automotive lidar market (
TRANSCRIPT

Vijay RakeshManaging Director, Americas Research
+1 312 294 [email protected]
Jason GetzResearch Associate
+1 312 294 [email protected]
U.S. Equity Research April 3, 2017
Technology ResearchSemiconductors & Automotive
TechnologiesIndustry Update
Mi-Tech Vol. 50: A Look at the LiDARMarket Through 2024E
Summary
In Vol. 50 of the Mi-Global Tech series, we take a look at the emerging LiDARmarket. The 2018 Audi A8 is on track to become the first commercially availablecar with LiDAR; going forward, we believe advancements in solid state LiDAR(SSL) technology, the reduction in cost, and the demand for a full sensor fusionwill could significant demand acceleration in the market between 2017 and2021. Some key takeaways: 1) a look at history with airbags, LDW and seat beltadoption; 2) history shows automotive adoption gets to ~50% in 5-7 years; and3) LiDAR adoption could get to 20% in 5 years to 2021E and grow to an $8Bautomotive LiDAR market (<$500M today) and a ~$30B fusion LiDAR ADASmarket (vs <$1B today), not to mention the adjacent data, AI, and servicesmarkets it could spawn.
Key�Points
In the first decade of the 20th century, there were no stop signs, trafficlights, or speed limits. Cars and automobiles for the first 10 years were drivingwithout any stop signs or traffic lights. According to the Detroit News, the firstU.S. stop sign was introduced in Detroit in 1915. So, in the first 10 years of theautomobile, there were no stop signs or traffic lights and in 1917 Detroit therewere 65,000 automobiles accounting for 7,171 accidents and 168 fatalities (Link- Detroit News). Today, it would be unimaginable to think of driving throughintersections without stop lights or traffic lights, but still, 2015 marked one of thehighest years of automotive fatalities with 4.4M accidents and 39,052 fatalitiesin the U.S. (Link- L.A Times) out of 263M vehicles registered, according toStatista, highlighting the fact that we are far from done in delivering safety orthe objective of Vision Zero. But, that is history and 110 years later, we are nowtalking autonomous driving and its perils along with the disruption it creates,much like the advent of the original automobile.
Automotive fusion ADAS and LiDAR ramps-LiDAR a $8B and FusionADAS $30B market by 2021E. We believe 2017E could see multiple LiDARramps in Europe and the US, with adoption growing to 20-30%+ by 2020-25Eas AEB, ACC, and LDW features continue to ramp. While radar and camerasdominate the market today, we believe dropping SSL costs (<$200/unit) coulddrive adoption and accelerate ADAS and autonomous driving. We would notethe 2016 California disengagement report, where Google (with LiDAR) wasfar and away the best performing car at 0.2 disengagements per 1,000 miles.We believe camera/radar only Tesla was closer to the bottom at ~330. Moredetails and YTD global auto sales in subsequent pages.
Price RatingCompany Symbol (4/03) Prior Curr PT Autoliv, Inc. ALV $100.69 – Neutral $115.00
CypressSemiconductorCorporation
CY $13.51 – Buy $16.00
Mobileye N.V. MBLY $61.25 – Neutral $63.54
NVIDIA Corporation NVDA $108.38 – Buy $130.00
NXPSemiconductors NV
NXPI $104.27 – Neutral $110.00
ON SemiconductorCorporation
ON $15.07 – Buy $18.00
Source: Bloomberg and Mizuho Securities USA
PLEASE REFER TO PAGE 19 OF THIS REPORT FOR IMPORTANT DISCLOSURE AND ANALYST CERTIFICATIONINFORMATION. Mizuho Securities USA LLC does and seeks to do business with companies covered in its research reports.As a result, investors should be aware that the Firm may have a conflict of interest that could affect the objectivity of thisreport. Investors should consider this report as only a single factor in making their investment decision.
Mizuho Securities USA LLCwww.mizuhosecurities.com/us

We look at some of the recent autonomous driving test results from the
California DMV which shows some significant performance differences
between, we believe, cars that use LiDAR and those that use only camera
and radar.
2016 California Disengagement Report – a green light for LiDAR? In
late December/early January, nine auto companies submitted results to
California DMV for their autonomous driving tests (Link). The reports state
the number of autonomous miles driven as well as the number of times the
vehicle disengaged the autonomous features and turned control back over to
the driver.
Google, by far, was the best performer in the report, with over 600k
miles driven and only 124 total disengagements, or ~0.2 disengagements
per 1,000 miles driven. Others who we believe fared well with their testing
were BMW at 1.6 disengagements per 1,000 miles, Ford at 5.1, and Nissan
at 6.8. At the bottom are Mercedes at ~277 disengagements per 1,000 miles
(we would note that Mercedes had additional times in which the driver
regained control of the car when they felt “uncomfortable,” but was not
turned back over by the car itself), Tesla with ~331, and Bosch at over
~1,400. While the reports do not go into detail about the types of
technologies being used, we believe that Google and Ford have been
using LiDAR in its tests while we believe Tesla is using a camera
radar/combination (no LiDAR as of yet). We are unsure of Bosch’s
results, as our checks shown Bosch is one of the few Tier 1 OEMs with a
full suite of ADAS sensors (mono camera/stereo camera/Radar/Lidar).
Exhibit 1: California Disengagement Report; Google Autonomous Driving Strong with the Most Miles
0.2 1.6 5.1 6.8 18.5 57.0227.2
330.9
1,466.9
0
200
400
600
800
1,000
1,200
1,400
1,600
Disengagements Per 1,000 Miles
Source: California DMV, Mizuho Securities research
Mi-Tech Vol. 50: A Look at the LiDAR Market Through 2024E
April 3, 2017 2Mizuho Securities USA LLC

Ford and Uber driving the roadmap to LiDAR adoption. We believe
Ford is testing 5,000-8,000 cars in the U.S. with 4-6 LiDARs as it moves
towards its future vision of car sharing and autonomous driving. We believe
Uber is testing cars with LiDAR in multiple states and test sites in Arizona
and California; however there will be hurdles not only from a testing
standpoint, but from an “acceptance” standpoint as well. Last week, it was
reported that one of Uber’s autonomous test vehicles in Arizona was
involved in an accident which resulted in Uber shutting down its test fleet
across the country. With the initial preliminary reports suggesting the
accident fault was not due to the Uber autonomous vehicle, Uber is
restarting (Link-Uber Arizona restart) its autonomous driving program.
A look at historical automotive safety adoption trends 1970-2020E
points to a ~5-10 year ramp in autos to reach 30-40% penetration. As
we show below, penetration trends from Wards, IHS, and Arthur Little
consulting showing typical adoption timelines for safety features such as
power brakes to airbags. As can be seen, after initial slower adoption (which
we are seeing now in LiDAR), adoption or penetration ramps to 30-40% in
the subsequent 5-10 years. We believe features such as AEB and LDW
could see ramps similar to that of the modern airbag, which took off ~10-12
years after being first implemented on the Mercedes S-Class. Mercedes
introduced its “Pre-Safe” (Daimler’s AEB) system with braking capabilities
on its S-Class in 2006, which we believe should put us at the beginning of a
mass AEB adoption ramp, no coincidence, ~10-12 years after initial
iterations. We believe adoption of radar/camera/LiDAR-based features
is a significant positive for auto suppliers ALV, MBLY, CY, NVDA,
NXPI, and ON.
Exhibit 2: Active Safety Ramps to Move Quickly - Some Historical Penetration Rates
0%
10%
20%
30%
40%
50%
60%
70%
80%
90%
100%
1970 1972 1974 1976 1978 1980 1982 1984 1986 1988 1990 1992 1994 1996 1998 2000 2002 2004 2006 2008 2010 2012 2014 2016 2018 2020 2022 2024
Estimated Auto Safety Feature Adoption %
Power Brakes ABS Driver Airbag Traction Control Brake Assist
AEB LDW TSR Night Vision Blind Spot Detection
Source: MIT, NHTSA, WARDs, I.H.S., Arthur Little Analysis, Mizuho Securities estimates, *TSR=traffic sign recognition,
LDW=lane departure warning, BSD=blind spot detection, AEB=autonomous emergency braking
Driver Airbag LDW
AEB
BSD
Power Brakes
Airbag
TSR
Mi-Tech Vol. 50: A Look at the LiDAR Market Through 2024E
April 3, 2017 3Mizuho Securities USA LLC

ADAS using radar/camera today, LiDAR tomorrow. As we show in
Exhibit-3, LiDAR is a better sensor in multiple weather conditions and
provides more 3D-point cloud information with depth and field of view for
the majority of situations required by autonomous driving versus the camera
or radar. We believe that with advancements in LiDAR technology with
solid-state LiDAR (SSL) and the cost reductions to go along with the
improvements (~$5,000-8,000 for high sensitivity multiple laser mechanical
versus <$200 for solid state), LiDAR should become a driving force behind
improving and enabling Level-4/5 ADAS and autonomous driving. Key
applications for LiDAR also include AEB and LDW with its ability to see
lane markings, road texture and 3D-sensing.
With AEB adoption currently relatively low in the U.S. and Japan (both
~10-20% penetration still), we see significant opportunities for market
growth compared to Europe where AEB adoption is in the ~45% range.
Exhibit 3: LiDAR vs. Radar vs. Camera and AEB Adoption …. The Near term Driver….
LiDAR Radar Camera
Range u u u
Field of View u u u
Width and Height u u u
3D Shape u u u
Object Rec. at Long Range u u u
Rain, Snow, Dust u u u
Night u u u
Signs and Color u u u
u-Best u-Better u-Worse u-Worst
0%
5%
10%
15%
20%
25%
30%
35%
40%
45%
50%
Japan U.S. Europe
AEB Adoption exiting 2017
Source: Mizuho Securities estimates, company reports
Below, we take a look at what we believe the LiDAR roadmap will look
like through 2024E. As ADAS is further adopted at OEMs and we move
closer to autonomous driving and Level 4/5, as we have noted before, we
believe sensor fusion will be key to the success of this process. A major
component, we believe, is the addition and ramp of LiDAR into these fusion
systems.
With Audi launching the first Level 3 production vehicle this year (2018
model year), we believe 2017E will see LiDAR enter commercial
automotive production. As solid state LiDAR technology improves and costs
are coming down, we believe LiDAR will begin to make an impact within
the automotive industry in the next 5 years, with significant ramps from
2019-2021 and beyond. We estimate the automotive LiDAR market
could be ~$8B by 2021E, up from ~$150M in 2017E, with the potential
to grow to ~$10B by 2024E.
Mi-Tech Vol. 50: A Look at the LiDAR Market Through 2024E
April 3, 2017 4Mizuho Securities USA LLC

Exhibit 4: Auto LiDAR Growth Accelerating Driven AEB, ACC…. ~$8B by 2021E
0
20
40
60
80
100
120
140
$0
$2,000
$4,000
$6,000
$8,000
$10,000
$12,000
2017E 2018E 2019E 2020E 2021E 2022E 2023E 2024E
Automotive LiDAR Revenue ($M) and Unit Growth (M)
LiDAR Market Size ($M) Total GaN/LiDAR Units per Year (M)
Source: EPC company reports, Mizuho Securities estimates
Over time, we believe technology should improve further, allowing for
fewer LiDAR units to perform the same tasks, we believe bringing LiDAR
units required from ~4 to ~3, but also increasing penetration in automotive
as we move towards Level-4/5 autonomous driving. Net, we see the total
automotive LiDAR market growing to ~$8B in 2021E, with total LiDAR
shipments of ~64M units, implying automotive penetration of ~20%.
Much of this penetration, we believe, will be in the Europe/Japan/NA
regions, with Europe the early adopters, likely at the top 3 German OEMs,
similar to AEB adoption today combined with some of the thought leaders in
the U.S. potentially including Ford, Tesla and Uber.
Exhibit 5: LiDAR Penetration/Adoption in Automotive out to 2024E; 20% penetration by 2021E
0%
5%
10%
15%
20%
25%
30%
35%
40%
2017E 2018E 2019E 2020E 2021E 2022E 2023E 2024E
LiDAR Auto Penetration
Source: EPC company reports, Mizuho Securities estimates
LiDAR Sensor Revenues of
~$8B by 2021E
LiDAR Penetration in Autos
~20% by 2021E
Mi-Tech Vol. 50: A Look at the LiDAR Market Through 2024E
April 3, 2017 5Mizuho Securities USA LLC

Despite our belief that LiDAR will become the key sensor for ADAS and
autonomous driving, we believe there will be a need for all sensors in order
to achieve fail-safe redundancy, at least initially. We believe over time, it
will move from a buffet of safety options to a much more optimized ADAS
fusion system with optimized LiDAR, radar, camera and sensing.
We believe a typical ADAS system with LiDAR will initially have ~4 units
to begin with; one on each corner of the car with initial costs of ~$250 per
unit (at current test stages) coming down to the 2-3 per car range. Moving
into 2018 and 2019, we believe the number of LiDAR units per car will
remain the same but costs will come down significantly into the ~$200/unit
range as LiDAR moves to mass adoption and takes its place in a typical
ADAS system. We also believe the car will have ~2-3 cameras at ~$100-120
per unit as well as ~4 radar units at ~$75, driving a multi-safety fail safe
redundancy. As we go into 2020 and beyond with Level 4/5, we believe
LiDAR will become more prominent in the vehicle but do expect to see
further price declines on the units.
Mi-Tech Vol. 50: A Look at the LiDAR Market Through 2024E
April 3, 2017 6Mizuho Securities USA LLC
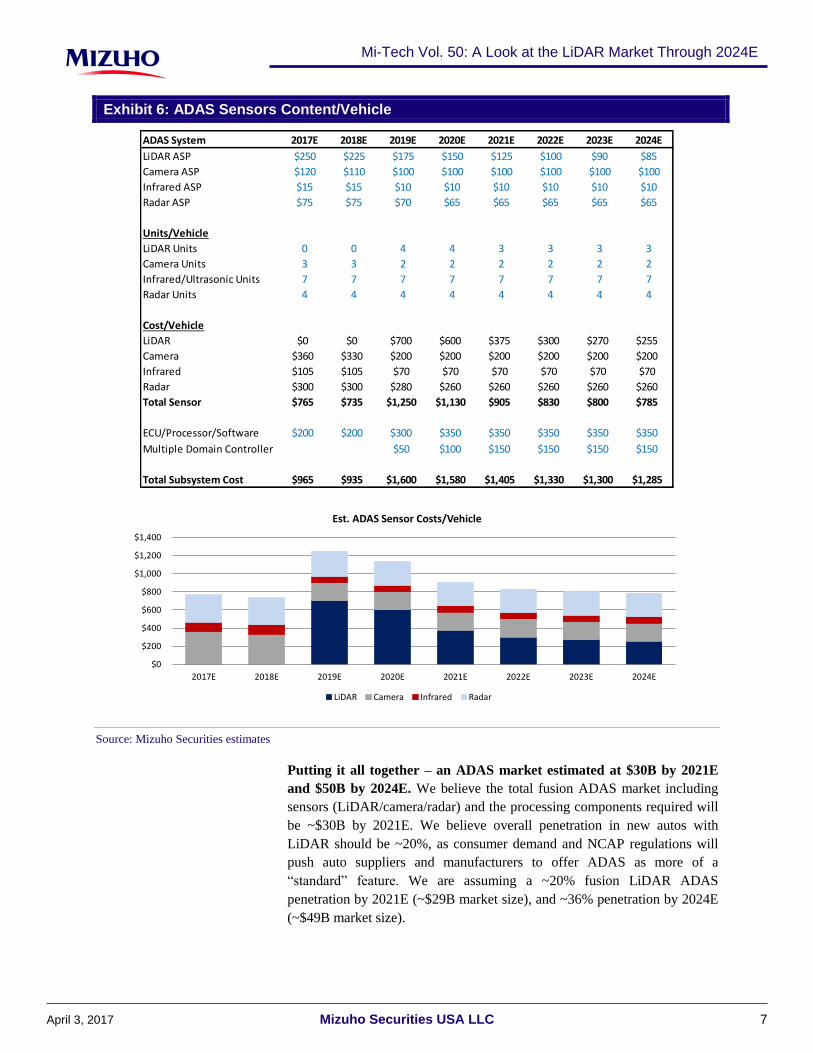
Exhibit 6: ADAS Sensors Content/Vehicle
ADAS System 2017E 2018E 2019E 2020E 2021E 2022E 2023E 2024E
LiDAR ASP $250 $225 $175 $150 $125 $100 $90 $85
Camera ASP $120 $110 $100 $100 $100 $100 $100 $100
Infrared ASP $15 $15 $10 $10 $10 $10 $10 $10
Radar ASP $75 $75 $70 $65 $65 $65 $65 $65
Units/Vehicle
LiDAR Units 0 0 4 4 3 3 3 3
Camera Units 3 3 2 2 2 2 2 2
Infrared/Ultrasonic Units 7 7 7 7 7 7 7 7
Radar Units 4 4 4 4 4 4 4 4
Cost/Vehicle
LiDAR $0 $0 $700 $600 $375 $300 $270 $255
Camera $360 $330 $200 $200 $200 $200 $200 $200
Infrared $105 $105 $70 $70 $70 $70 $70 $70
Radar $300 $300 $280 $260 $260 $260 $260 $260
Total Sensor $765 $735 $1,250 $1,130 $905 $830 $800 $785
ECU/Processor/Software $200 $200 $300 $350 $350 $350 $350 $350
Multiple Domain Controller $50 $100 $150 $150 $150 $150
Total Subsystem Cost $965 $935 $1,600 $1,580 $1,405 $1,330 $1,300 $1,285
$0
$200
$400
$600
$800
$1,000
$1,200
$1,400
2017E 2018E 2019E 2020E 2021E 2022E 2023E 2024E
Est. ADAS Sensor Costs/Vehicle
LiDAR Camera Infrared Radar
Source: Mizuho Securities estimates
Putting it all together – an ADAS market estimated at $30B by 2021E
and $50B by 2024E. We believe the total fusion ADAS market including
sensors (LiDAR/camera/radar) and the processing components required will
be ~$30B by 2021E. We believe overall penetration in new autos with
LiDAR should be ~20%, as consumer demand and NCAP regulations will
push auto suppliers and manufacturers to offer ADAS as more of a
“standard” feature. We are assuming a ~20% fusion LiDAR ADAS
penetration by 2021E (~$29B market size), and ~36% penetration by 2024E
(~$49B market size).
Mi-Tech Vol. 50: A Look at the LiDAR Market Through 2024E
April 3, 2017 7Mizuho Securities USA LLC

Exhibit 7: ADAS Market Growing to $30B by 2021E, $50B by 2024E
Automotive LiDAR/ADAS Market 2017E 2018E 2019E 2020E 2021E 2022E 2023E 2024E
Total GaN/LiDAR Units per Year (M) 0.6 4.6 9.5 33.4 63.5 92.9 106.8 115.0
# of Units per Car 4 4 4 4 3 3 3 3
Est. Autos TAM (M)* 93 95 98 101 102 103 104 105
# of Cars w/LiDAR (M)** 0.2 1.1 2.4 8.4 21.2 31.0 35.6 38.3
LiDAR Auto Penetration 0.2% 1.2% 2.4% 8.2% 20.7% 30.0% 34.1% 36.4%
LiDAR ASPs ($) $250 $225 $175 $150 $125 $100 $90 $85
LiDAR Market Size ($M) $152 $1,032 $1,655 $5,015 $7,940 $9,290 $9,615 $9,779
# of Cars w/ADAS (M)*** 2.0 5.0 6.0 8.4 21.2 31.0 35.6 38.3
ADAS ASP $965 $935 $1,600 $1,580 $1,405 $1,330 $1,300 $1,285
ADAS Market Size ($M) $1,930 $4,675 $9,600 $13,205 $29,748 $41,184 $46,293 $49,279
$0
$10,000
$20,000
$30,000
$40,000
$50,000
$60,000
2017E 2018E 2019E 2020E 2021E 2022E 2023E 2024E
ADAS Market Size ($M)
Source: Mizuho Securities estimates, EPC company estimates, *IHS estimates, **Mizuho estimates, ***Mizuho estimates, Radar+Camera, limited LiDAR 2017-19E
A look at some other third-party estimates on the ADAS market. Below,
we take a look at other research and consulting firms and their outlook on
the ADAS and LiDAR markets. As can be seen, estimates vary widely in
both LiDAR (~$0.9B-$4.9B) and ADAS (~$11B-$168B). We believe that
overall actual end-markets will be somewhere between the extremes. We
would note however, that while we do not have detailed access to the
reports, we believe each of these are calculated differently and include a
number of different discrepancies from company to company. For your
reference, we have laid out estimates by company.
Exhibit 8: A Look at Third-party ADAS and LiDAR Market Estimates by 2022-25E
Research Firm Market Size ($B) By Year Publish Date Source Link
Research and Markets LiDAR $4.9 2025 Mar-17 PR Newswire
ADAS $168.0 2025 May-16 PR Newswire
Grand View Research LiDAR $1.3 2024 Oct-16 Grand View Research
ADAS $11.0 2022 - Grand View Research
Markets and Markets LiDAR $5.2 2022 Mar-17 Markets and Markets
ADAS $42.4 2021 May-16 Markets and Markets
Allied Market Research LiDAR $0.9 2022 Apr-16 Allied Market Research
ADAS $60.1 2020 May-15 Allied Market Research
Source: Mizuho Securities research
Mi-Tech Vol. 50: A Look at the LiDAR Market Through 2024E
April 3, 2017 8Mizuho Securities USA LLC

A look at YTD global auto sales: China remains strong. After a period of
suppressed growth for China, auto sales are continuing to show signs of a
rebound with the 25% purchase tax cut on vehicles with under 1.6-liter
engines. Sales in China were up 23% y/y in February. In 2016, China has
only had one month of negative growth (-1% y/y for February). The monthly
auto sales in China are now higher than U.S and Japan combined.
Exhibit 9: China Monthly Auto Sales 2011-YTD Feb/2012-YTD Feb Y/Y Growth
0
400,000
800,000
1,200,000
1,600,000
2,000,000
2,400,000
2,800,000
3,200,000
3,600,000
China Monthly Vehicle Unit Sales
-40%
-30%
-20%
-10%
0%
10%
20%
30%
40%
50%
60%
China Vehicle Unit y/y Growth 2012-YTD
Source: Mizuho Securities estimates, Marklines
European car registrations remain stable to strong. European
registrations continue to remain stable to strong in 2017after a solid 2016. In
February, European registrations were up 2% y/y after being up 10% y/y for
January. Despite economic concerns in the EU with Brexit, we continue to
believe that sales should be ok moving forward.
Exhibit 10: Europe Monthly Auto Sales 2011-YTD Feb/2012-YTD Feb Y/Y Growth
0
400,000
800,000
1,200,000
1,600,000
2,000,000
Europe Monthly Vehicle Unit Sales
-20%
-15%
-10%
-5%
0%
5%
10%
15%
20%
Europe Vehicle Unit y/y Growth 2012-YTD
Source: Mizuho Securities estimates, ACEA
No signs of significant distress in the U.K. We believe it will be key to
keep an eye on the U.K. post the Brexit vote, as the U.K. represents ~20% of
total EU auto sales. Despite any potential concerns with Brexit, the U.K.,
while continuing to show signs of slowing, is flat to modestly growing.
Since the vote, passenger vehicle registrations have been up y/y, averaging
~1%. Registrations were up 3% y/y in January and flat in February.
Mi-Tech Vol. 50: A Look at the LiDAR Market Through 2024E
April 3, 2017 9Mizuho Securities USA LLC

Exhibit 11: U.K. Passenger Registrations July 2013-February 2017
-5%
0%
5%
10%
15%
20%
25%
30%
0
100,000
200,000
300,000
400,000
500,000
600,000
Jul'1
3
Sep
'13
No
v'1
3
Jan
'14
Mar
'14
May
'14
Jul'1
4
Sep
'14
No
v'1
4
Jan
'15
Mar
'15
May
'15
Jul'1
5
Sep
'15
No
v'1
5
Jan
'16
Mar
'16
May
'16
Jul'1
6
Sep
'16
No
v'1
6
Jan
'17
U.K. Passenger Car Registrations
U.K. Passenger Car Registrations Y/Y Growth
Source: Mizuho Securities estimates, ACEA
U.S. auto sales 2011-YTD flattish to slow. U.S. auto sales continue to
show signs of peaking and potential retraction, though as we noted before
multiple mandates with rear-camera ramping into 2017-19 and 2017 ramps
with AEB imply positive upside from U.S. exposure for the automotive
component suppliers. U.S. sales in February were down 1% y/y.
Exhibit 12: U.S. Monthly Auto Sales 2011-YTD Feb/2012-YTD Feb Y/Y Growth
0
400,000
800,000
1,200,000
1,600,000
2,000,000
U.S. Monthly Vehicle Unit Sales
-10%
-5%
0%
5%
10%
15%
20%
25%
30%
U.S. Vehicle Unit y/y Growth 2012-YTD
Source: Mizuho Securities estimates, WARD’s
Auto sales in Japan showing signs of a rebound. Japan autos were on
consistent declines for most of 2016 but began to show signs of a turnaround
in November and December. Strength has continued into 2017 with January
up 5% y/y and February up 7%. Average growth for the past 4 months is
~7% y/y.
Mi-Tech Vol. 50: A Look at the LiDAR Market Through 2024E
April 3, 2017 10Mizuho Securities USA LLC
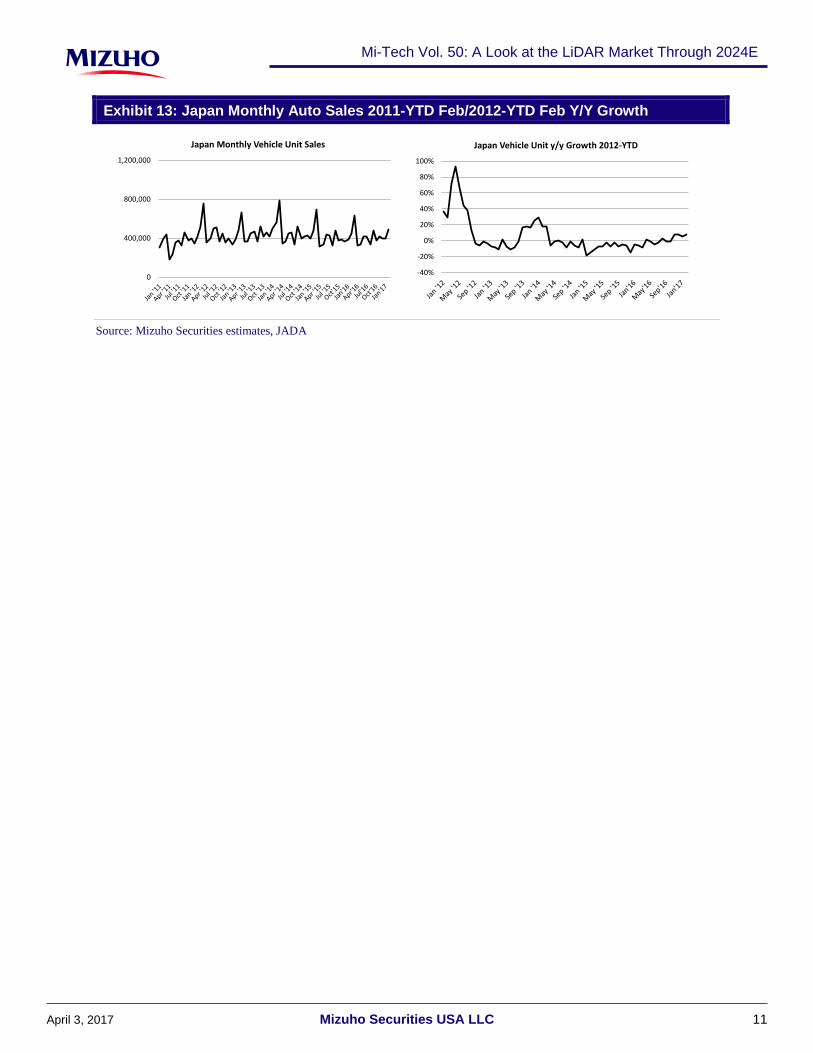
Exhibit 13: Japan Monthly Auto Sales 2011-YTD Feb/2012-YTD Feb Y/Y Growth
0
400,000
800,000
1,200,000
Japan Monthly Vehicle Unit Sales
-40%
-20%
0%
20%
40%
60%
80%
100%
Japan Vehicle Unit y/y Growth 2012-YTD
Source: Mizuho Securities estimates, JADA
Mi-Tech Vol. 50: A Look at the LiDAR Market Through 2024E
April 3, 2017 11Mizuho Securities USA LLC

Vol. Past Editions Date
I Connecting the Dots....Handset Markets into 2H15...4G.. June 2, 2015
II NXPI, ON, CY Automotive-What is NCAP? A Look at ADAS L2/3 June 7, 2015
III DRAM – Can We Expect Discipline into 2016? June 15, 2015
IV Global Automotive OEMs - Electrification and ADAS June 30, 2015
V 3D-NAND – Are we there yet? July 7, 2015
VI Why 2016 Should be Another Year of Strong RF Growth July 27, 2015
VII A Look at the EMV Ramp in the U.S. Aug. 6, 2015
VIII Payments Takeaways - Strong 2016 with China, NFC, and U.S. EMV Aug. 16, 2015
IX Display OEMs Join In-Cell; SYNA Well Positioned Sept. 13, 2015
X Global Auto Sales through August; We Like NXPI, CY, ON Sept. 17, 2015
XI Why You Should Buy Integrated RF Suppliers AVGO, SWKS, and QRVO Sept. 22, 2015
XII Handset RF Outlook - A Changing Landscape Nov. 13, 2015
XIII Takeaways from our NAND Call: The Enterprise Roadmap Nov. 13, 2015
XIV SYNA and FPC: The Mobile FP and Biometrics Landscape Nov. 22, 2015
XV In NAND, 3D is Key as TLC becomes so "last year" Nov. 29, 2015
XVI Samsung 18nm DRAM in mid-2016? Nov. 29, 2015
XVII Fingerprints: A Call with the King Dec. 3, 2015
XVIII Strong November 4G Adds, China 5/6 mode 2016 Tailwinds Dec. 28, 2015
XIX Autos - A Tax Cut (China) and 2017 Hike (Japan) Jan. 3, 2016
XX ADAS Gets a Disruptive Quanergy Boost; Positive for NXPI, CY, ON Jan. 21, 2016
XXI A Look at the Challenged PC and Storage Markets Jan. 25, 2016
XXII Storage Weak - SSD/HDD and a Strong Yen Feb. 15, 2016
XXIII Quanergy Accelerates ADAS and 3D-Mapping Feb. 21, 2016
XXIV China 4G Transition from 2G Gaining Steam Feb. 28, 2016
XXV NXPI-Apple Pay with CUP Drives Mobile Payments Feb. 28, 2016
XXVI Fingerprints and NFC-China Driving Growth with Payments Mar. 16, 2016
XXVII A Look at the Virtual Reality Roadmap with AMD Mar. 20, 2016
XXVIII A 3D-NAND and SSD Industry Update, and the HDD Roadmap Mar. 22, 2016
XXIX Huawei - Key Handset & Carrier Takeaways Mar. 31, 2016
XXX A Preliminary Look at VR; Closing in on Gaming May 11, 2016
XXXI Magna Takeaways; Focus on NXPI, CY and ON May 12, 2016
XXXII Tailwinds from Automotive Sales and AEB June 13, 2016
XXXIII Previewing Huawei, a Global Telecom and Networking Juggernaut June 15, 2016
Mi-Tech Vol. 50: A Look at the LiDAR Market Through 2024E
April 3, 2017 12Mizuho Securities USA LLC

XXXIV Updated Memory/HDD Model; Stable DRAM into 2017 June 20, 2016
XXXV BREXIT - What's Next for Autos? June 26, 2016
XXXVI Data Center IT Survey & Key 2016 Storage Trends July 26, 2016
XXXVII ADAS - New Roadmaps...New Disruptors... Aug. 18, 2016
XXXVIII A Look at YE2016 Handset RF/4G Trends Aug. 23, 2016
XXXIX The Race to ADAS, LiDAR and Alliances Sept. 16, 2016
XL Huawei Class of 2017: Better Memory, TDDI, FP Diversification Oct. 13, 2016
XLI Autos, Infineon LiDAR and Disruptive Business Models Oct. 17, 2016
XLII Global YTD Auto Sales Strong in China; Positive for ON and CY Oct. 23, 2016
XLIII A 3D-NAND Crystal Ball; is 2018 the Peak? Nov. 27, 2016
XLIV Autos Leading with LiDAR; is Computing Power Hyped? Nov. 29, 2016
XLV ADAS 2017 Another Step Closer; LiDAR Comes of Age Jan. 12, 2017
XLVI AI and Deep Learning; Primer to a Revolution Jan. 18, 2017
XLVII NVDA/Loop AI-DL Transforms Enterprise Intelligence Feb. 16, 2017
XLVIII Sensor Fusion for ASIL D; Move to LiDAR and Maps Mar. 9, 2017
XLIX A Look at the 2017 Huawei and China Handset Market Mar. 9, 2017
Mi-Tech Vol. 50: A Look at the LiDAR Market Through 2024E
April 3, 2017 13Mizuho Securities USA LLC

Glossary
~ - approximatelyeMCP - embedded multi-chip module
using DRAM and NANDIoT - internet of things nm - nanometer
RSP - Renesas Semiconductor
products/Drivers
1H/2H - first half/second halfEMV - Europay, MasterCard and Visa, a
payment consortiumIP - intellectual property NOL - Net Operating Losses RSU - Restricted Stock Units
2G/3G/4G - 2nd generation, third
generation. 4th generation wirelessEOY - end of year ISM - Institute for Supply Management
NOR - a type of non-volatile storage
memory
SAS - serial attached SCSI (small
computer system interface)
3G/4G - Third generation / Fourth
generationEPS - earnings per share
ITU - International Telecommunication
UnionNPV - net present value SAW - surface acoustic wave filters
4G-LTE - Fourth generation, long term
evolutionET - envelope tracking JPY - Japanese yen NVMe - Non-volatile Memory Express
SDH - Synchronous Digital Hierarchy,
mostly in Europe
ADAS - Automotive driver assist
systemsETD - Emerging Technologies Division JV - joint venture NYSE - New York Stock Exchange
SG&A - Sales, General and
Administrative
APU - accelerated processing unit EU - European Union K - Thousand ODM - original design manufacturerSLAC - subscriber line audio-processing
circuit
ARM - a family of instruction set
architectures used for processors for
computers, servers, etc.
EV - enterprise valueKbps/Mbps - Kilobit per
second/Megabit per second bandwidthOEM - original equipment manufacturer SLIC - subscriber line interface circuit
ASIC - application specific integrated
circuitsEvDO - Evolution Data Only KGD - Known Good Die OFN - optical finger navigation
SMIC - Semiconductor Manufacturing
International Corporation
ASP - average selling price EVP - Executive Vice PresidentKwpm - thousand wafer per month
capacity
OLT - Optical Line Termination or
TerminalSoC - system on chip
ATM - Asynchronous Transfer mode F - Fiscal LIBOR - London Interbank Offered Rate OM - operating marginSONET - Synchronous Optical Network,
used in North America
B - BillionFASB - Financial Accounting Standards
BoardLQ - last quarter ONU - Optical Network Unit SOX - Philadelphia semiconductor index
BAW - bulk acoustic wave filtersFBAR - film bulk acoustic resonator, a
type of filterLSD - low single digits Opex - operating expenses SRAM - static random access memory
BiDi - Bi DirectionalFBAR/BAW -Film Bulk acoustic
resonator/Bulk acoustic wave FiltersLT - long term P/B - price to book value ratio SSD - solid state drive
BOM - bill of materials FCF - free cash flowLTE - long term evolution, a 4th
generation wireless protocolP/E - price to earnings TAM - total available market
bps - basis pointsFDD LTE - Frequency Division Duplex
Long Term EvolutionLY - last year P/S - price to sales TD - time division
CA - carrier aggregation FP - finger print m - Meters PA - power amplifier TDDI - touch display driver integration
CAGR - compound annual growth rate FPGA - field programmable gate arrays M - Million
PAD - power amplifier duplexer,
essentially 2 filters and a Power
amplifier
TDD-LTE - Time Division Duplex Long
Term Evolution
CAPEX - capital expenditures FT - force touch M&A - mergers and acquisitions PC - personal computerTD-SCDMA - Time Division
Synchronous
CDMA - code division multiple access FTC - Federal Trade Commission MB - megabytePCIe - Peripheral Component
Interconnect ExpressTLC - triple level cell
CEO/CFO - Chief Executive/Chief
FinancialFY - fiscal/full year Mbps - megabit per second PMI - Purchasing Managers' Index Tx/Rx - Transmit / Receive
CES - consumer electronics showGAAP - generally accepted accounting
principlesMCU - micro controller unit
PMIC - Power Management Integrated
CircuitUSB - universal serial bus
CF - cash flow Gb/GB - gigabytes/Gigabit MHz - megahertz PoE - Power over Ethernet wpm - wafer per month
CFIUS - Committee on Foreign
Investment in the United StatesGb/s - Gigabit per second
MIIT - China Ministry of Industry and
Information TechnologyPSD - Programmable systems division x86 - Intel based processor architecture
COO - Chief Operation Officer GF - Global Foundries MIMO - multiple in, multiple out PSoC - programmable system on a chipXMC - Wuhan Xin Xin Semiconductor
Manufacturing Corporation
CSP - chip scale packaging GHz - gigahertz MLC - multi level cell PT - price target y/y - year over year
CY - calendar year GM - gross margin MoE - merger of equals Q - quarter YE - year end
D/E - debt to equity GPU - graphics processing unitMOFCOM - Ministry of Commerce
People's Republic of Chinaq/q - quarter over quarter YTD - year to date
DCF - discounted cash flowGSM - Global System for Mobile
CommunicationMSD - mid single digits QCT - Qualcomm chip technologies
DoD - Department of Defense HDD - hard disk driveMSM - multi station modems, QCOM's
QCT chipsQTL - Qualcomm technology licensing
DRAM - dynamic random access
memory
HSA - heterogeneous system
architecture combining x86 and ARMNAND - "not and," a type of memory R&D - research and development
DT - desktop HSD - high single digits NB - notebook Rev - revenues
e.MMC - Embedded managed NAND
solutionI/O - input output operations
NDRC - National Development and
Reform Commission in ChinaRF - radio frequency
EBITDA - earnings before interest,
taxes, depreciation and amortizationIC - integrated circuits NFC - near field communications ROI - return on investment
Mi-Tech Vol. 50: A Look at the LiDAR Market Through 2024E
April 3, 2017 14Mizuho Securities USA LLC

Price�Target�Calculation�and�Key�RisksAutoliv, Inc.Price Target. We have ALV with a Neutral and $115 PT, ~15.4x our F18E EPS. Webelieve that Autoliv is well positioned with its growing active safety segment and strongposition is passive safety, but some NT headwinds in active safety and potentiallyslowing LVP keep us on the sidelines. We will review our rating and PT after 1Q resultsare released.
Risks. Autoliv competes in the very competitive automotive sector and any misstepscan leave the company out of 2-4 year product cycles. The company also has a globalfootprint and faces currency uncertainty which can significantly affect topline results.Other risks include:
• Highly dependent on global light vehicle production
• Changes in component costs and raw material prices
• Pricing pressure from customers
• Potential failure of products and subsequent recalls
• Infringements on patents and proprietary technologies
• New Competition and pricing pressure from other low-cost OEMs, ODMs andsuppliers
• Unexpected changes in legal and regulatory requirements, tariffs and exchangerates, political and economic stability, staffing and management issues, and potentiallyadverse tax consequences for its international operations
• Potential loss of intellectual property, Commercialization of competing technologies
• Litigation Risks and Adverse effects of potential possible future patent or otherlitigation
Cypress Semiconductor CorporationPrice Target: We believe CY is now a changed story, with a revenue focus onautomotive and industrial, an automotive focused sales force, much less exposure toSRAM, continued fab consolidation with Fujitsu and Fab-4t on track with automotivequalifications and a dividend while you wait. CY's emerging technologies division isalso starting to drive topline growth. Our PT of $16 is based on 14.7x our F18E EPSof $1.09.
Risks: CY competes in a cyclical, technologically intensive industry. Financialexpectations and achieving future growth is subject to a number of risk factors,including, but are not limited to, the following:
Market Risks:
• Lumpiness in telecom and communication markets;
• Macro global slowdown, especially if the key U.S. economy is weak, impactingindustrial, automotive and or weaker consumer spending; and
• Customer concentration, competition and pricing pressure from other low-costOEMs, ODMs and suppliers and possible new market entrants from China, Asia-Pacific, or Taiwan.
Mi-Tech Vol. 50: A Look at the LiDAR Market Through 2024E
April 3, 2017 15Mizuho Securities USA LLC

Technology Risks:
• Potential loss of intellectual property and or commercialization of competingtechnologies;
• Successful integration and growth from Spansion acquisition;
• Litigation Risks - adverse effects of potential existing and possible future patent orother litigation.
Mobileye N.V.Price Target: We have MBLY rated a Neutral with a $63.54 PT, ~42.1x our F18EEPS, the value of the pending INTC acquisition. While MBLY is dominant with itsADAS camera SoCs, we are staying on the sidelines as large Tier 1 OEMs look tobring camera in-house and other ADAS disruptors such as solid-state LiDAR playersbegin to move into the space.
Risks: MBLY competes in the quickly evolving and unforgiving world of autonomousdriving, where errors, such as the Tesla accidents, can tarnish a company and emergingsolutions can replace older technologies. MBLY also faces other risks including:
•Depends solely on STMicroelectronics to produce, test, and assemble its EyeQ SoCs
•Significant R&D investments with no assurance of design wins on new productionmodels
•OEMs changing their ADAS technologies and moving away from MBLY products
•MBLY faces potential competition from a number of Tier 1 and other technologycompanies who may be current customers
•Currently solely dependent on mono-camera technology
NVIDIA CorporationPrice Target: While NVDA's valuations are steep, we believe current street estimatesare conservative, reflect licensing slowdown, so that improving PCs, gaming trends,VR, and datacenter position for upside to estimates. NVDA is also well positioned forthe up and coming machine learning, deep learning, and AI markets. Our NVDA F17/F18(Jan) rev/EPS at $8.0B/$2.73 and $8.5B/$3.01 respectively. We have NVDA witha Buy-$130PT, ~43.2x F19E P/E, at the higher end of its historical valuations.
Risks. NVDA competes in a cyclical, technologically intensive industry and sells toa concentrated customer base. Its ability to meet its own or our financial expectationsand achieve future growth is subject to a number of risk factors, including, but are notlimited to, the following:
•Demand for NVDA’s products is variable and could differ from expectations;
•Gross margin percentage could vary significantly;
•Competition and pricing pressure from other low-cost OEMs, ODMs, and suppliers;
•NVDA relies on third party manufacturing;
•NVDA has a very high valuation, and investors are risk averse having seen significantresets in equities trading at high valuations such as AMBA and MBLY. We believewhere NVDA differs is a significantly diversified revenue base, low customerconcentration and conservative estimates. Also its expected catalysts are near-term,compared to longer-term growth objectives that have technology and regulatory risks.
Mi-Tech Vol. 50: A Look at the LiDAR Market Through 2024E
April 3, 2017 16Mizuho Securities USA LLC

•Unexpected changes in legal and regulatory requirements, tariffs and exchange rates,political and economic stability, staffing and management issues, and potential adversetax consequences;
•Seasonal fluctuations associated with consumer products and the PC market;
•Potential loss of intellectual property, commercialization of competing technologies;
•Adverse effects of potential possible future patent or other litigation;
•NVDA receives a significant amount of revenue from a limited number of customers
NXP Semiconductors NVPrice Target: We have NXPI at a Neutral rating and a $110PT. Our PT is the QCOMacquisition price and represents a P/E multiple of 14.9x our post-FSL merger EPSof $7.38 and takes into consideration our expectations for approximately $2.8B ofFCF. We believe that multiple product cycles with EMV, NFC, Automotive, synergies,execution and a focus on cash flow position NXPI well into 2017-18E.
Risks: Among the risks to our recommendation and price target are the followingfactors:
1) NXPI has high debt relative to peers;
2) NXPI has a big automotive exposure and any slowdown there could impact outlook;
3) NXPI has exposure in key cyclical NFC markets;
4) Other risks include competition, new technologies, IP, and licensing;
5) NXPI also has a significant exposure ~40%+ of revenues from China;
6) NXPI is also exposed to key smartphone cycles including Apple; and
7) NXPI competes in cyclical markets and is as such exposed to macro-economic,technology, competitive and litigation risks and also pending regulatory approvals onkey mergers.
ON Semiconductor CorporationPrice Target: Our $18 price target is approximately ~12.4x our F18E EPS of $1.45.ON has been a show-me story given the challenges with Sanyo and the PC market,and we believe execution in the Automotive, wireless, and regaining share in the PCcomputing markets will be key to driving multiples higher. Near-term, strong marketshare in key automotive markets and ramp of new PC Skylake platforms positions wellfor ON.
Risks: ON competes in a cyclical technology intensive market and is exposed to macro-economic, competitive, litigation, market share, and other technology risks, including:
Market Risks• ON’s continued success of its research and development efforts and timelyintroduction and execution of its new wireless, computing, imaging and automotiveproducts;
• Slower-than-expected ramp in wireless charging;
• Competitive pricing and market share pressure from Asia-Pacific, Taiwan, or China;
• Slowdown in the automotive market and industrial markets;
Mi-Tech Vol. 50: A Look at the LiDAR Market Through 2024E
April 3, 2017 17Mizuho Securities USA LLC

• Unexpected changes in legal and regulatory requirements, tariffs and exchange rates,political and economic stability,
• Staffing and management issues, Currency (Yen) and potentially adverse taxconsequences for its international operations.
Technology Risks• Potential loss of intellectual property.
• Commercialization of competing technologies.
Mi-Tech Vol. 50: A Look at the LiDAR Market Through 2024E
April 3, 2017 18Mizuho Securities USA LLC

Companies Mentioned (prices as of 4/03 )Autoliv, Inc. (ALV- Neutral $100.69)Mobileye N.V. (MBLY- Neutral $61.25)NXP Semiconductors NV (NXPI- Neutral $104.27)
Cypress Semiconductor Corporation (CY- Buy $13.51)NVIDIA Corporation (NVDA- Buy $108.38)ON Semiconductor Corporation (ON- Buy $15.07)
IMPORTANT DISCLOSURESThe disclosures for the subject companies of this report as well as the disclosures for Mizuho Securities USA LLC entire coverage universe can be foundat https://msusa.bluematrix.com/sellside/Disclosures.action or obtained by contacting [email protected] or via postal mailat Equity Research Editorial Department, Mizuho Securities USA LLC, 320 Park Avenue, 12th Floor, New York NY, 10022.
Investment Risks and Valuation Methods can be located in the following section of this research report - Price Target Calculation and Key Risks.
Ownership Disclosures and Material Conflicts of Interest or Position as Officer or DirectorNone
Receipt of CompensationMizuho Securities USA LLC and or its affiliates makes a market in the following securities: NVIDIA Corporation, Autoliv, Inc., Mobileye N.V.,Cypress Semiconductor Corporation, NXP Semiconductors NV and ON Semiconductor CorporationThe compensation of the research analyst writing this report, in whole or part, is based on MSUSA's annual revenue and earnings and is not directly relatedto any specific investment banking compensation. MSUSA's internal policies and procedures prohibit research analysts from receiving compensationfrom companies covered in the research reports.
Regulation Analyst Certification (AC)I, Vijay Rakesh, hereby certify that the views expressed in this research report accurately reflect my personal views about any and all the subjectcompanies. No part of my compensation was, is or will be, directly or indirectly, related to the specific recommendations or views expressed in thisresearch report.
Rating Definitions
Mizuho Securities USA LLC investment ratings are based on the following definitions. Anticipated share price change is based on a 6- to 12-monthtime frame. Return expectation excludes dividends.
Buy:Neutral:Underperform:RS:NR:
Stocks for which the anticipated share price appreciation exceeds 10%.Stocks for which the anticipated share price appreciation is within 10% of the share price.Stocks for which the anticipated share price falls by 10% or more.Rating Suspended - rating and price objective temporarily suspended.No Rating - not covered, and therefore not assigned a rating.
Rating Distribution(As of 4/03 ) % of coverage IB service past 12 moBuy (Buy) 42.39% 43.51%
Hold (Neutral) 54.05% 36.53%
Sell (Underperform) 3.56% 45.45%
For disclosure purposes only (NYSE and FINRA ratings distribution requirements), our Buy, Neutral and Underperform ratings are displayed as Buy, Hold and Sell,respectively.
For additional information: Please log on to http://www.mizuhosecurities.com/us or write to Mizuho Securities USA LLC 320 Park Ave, 12th FL,New York, NY 10020.
DisclaimersThis report has been prepared by Mizuho Securities USA LLC (“MSUSA”), a subsidiary of Mizuho Americas LLC, solely for the purpose of supplyinginformation to the clients of MSUSA and/or its affiliates to whom it is distributed. This report is not, and should not be construed as, a solicitation oroffer to buy or sell any securities or related financial products.
This report has been prepared by MSUSA solely from publicly available information. The information contained herein is believed to be reliable buthas not been independently verified. MSUSA makes no guarantee, representation or warranty, and MSUSA, MHSC and/or their affiliates, directors,employees or agents accept no responsibility or liability whatsoever as to the accuracy, completeness or appropriateness of such information or for anyloss or damage arising from the use or further communication of this report or any part of it. Information contained herein may not be current due to,among other things, changes in the financial markets or economic environment. Opinions reflected in this report are subject to change without notice.
This report does not constitute, and should not be used as a substitute for, tax, legal or investment advice. The report has been prepared without regard tothe individual financial circumstances, needs or objectives of persons who receive it. The securities and investments related to the securities discussedin this report may not be suitable for all investors, and the report is intended for distribution to Institutional Investors. Readers should independently
Mi-Tech Vol. 50: A Look at the LiDAR Market Through 2024E
April 3, 2017 19Mizuho Securities USA LLC
evaluate particular investments and strategies, and seek the advice of a financial adviser before making any investment or entering into any transactionin relation to the securities mentioned in this report.
MSUSA has no legal responsibility to any investor who directly or indirectly receives this material. Investment decisions are to be made by and remainas the sole responsibility of the investor. Investment involves risks. The price of securities may go down as well as up, and under certain circumstancesinvestors may sustain total loss of investment. Past performance should not be taken as an indication or guarantee of future performance. Unlessotherwise attributed, forecasts of future performance represent analysts’ estimates based on factors they consider relevant. Actual performance mayvary. Consequently, no express or implied warranty can be made regarding future performance.
Any references in this report to Mizuho Financial Group, Inc. (“MHFG”), MHSC and/or its affiliates are based only on publicly available information.The authors of this report are prohibited from using or even obtaining any insider information. As a direct subsidiary of Mizuho Americas LLC andindirect subsidiary of MHFG, MSUSA does not, as a matter of corporate policy, cover MHFG or MHSC for investment recommendation purposes.
MSUSA or other companies affiliated with MHFG, Mizuho Americas LLC or MHSC, together with their respective directors and officers, may have ortake positions in the securities mentioned in this report, or derivatives of such securities or other securities issued by companies mentioned in this report,for their own account or the accounts of others, or enter into transactions contrary to any recommendations contained herein, and also may perform orseek to perform broking and other investment or securities related services for the companies mentioned in this report as well as other parties generally.
Restrictions on DistributionThis report is not directed to, or intended for distribution to or use by, any person who is a citizen or resident of, or entity located in, any locality, territory,state, country or other jurisdiction where such distribution, publication, availability or use would be contrary to or restricted by law or regulation. Personsor entities into whose possession this report comes should inform themselves about and observe such restrictions.
United States: Mizuho Securities USA LLC, a subsidiary of Mizuho Americas LLC, 320 Park Avenue, 12th Floor, New York, NY 10022, USA, contactnumber +1-212-209-9300, distributes or approves the distribution of this report in the United States and takes responsibility for it. Any transaction bya US investor resulting from the information contained in this report may be effected only through MSUSA. Interested US investors should contacttheir MSUSA sales representative.
United Kingdom/European Economic Area: This report is distributed or has been approved for issue and distribution in the UK by MizuhoInternational plc (“MHI”), Mizuho House, 30 Old Bailey, London EC4M 7AU, a member of the MHSC Group. MHI is authorized and regulated by theFinancial Services Authority and is a member of the London Stock Exchange. For the avoidance of doubt this report is not intended for retail clients.This report may be distributed in other member states of the European Union.
Japan: This report is distributed in Japan by Mizuho Securities Co., Ltd. (“MHSC”), Otemachi First Square Otemachi 1-chome, Chiyoda-ku, Tokyo100-0004, Japan. Registered Financial Instruments Firm, No. 94 (Kinsho), issued by the Director, Kanto Local Finance Bureau. MHSC is a memberof the Japan Securities Dealers Association, the Japan Securities Investment Advisers Association and the Financial Futures Association of Japan, andthe Type II Financial Instruments Firms Association.
Singapore: This report is distributed or has been approved for distribution in Singapore by Mizuho Securities (Singapore) Pte. Ltd. (“MHSS”), amember of the MHSC Group, which is regulated by the Monetary Authority of Singapore. Any research report produced by a foreign Mizuho entity,analyst or affiliate is distributed in Singapore only to “Institutional Investors,” “Expert Investors” or “Accredited Investors” as defined in the Securitiesand Futures Act, Chap. 289 of Singapore. Any matters arising from, or in connection with this material, should be brought to the attention of MHSS.
Hong Kong: This report is being distributed in Hong Kong by Mizuho Securities Asia Limited (“MHSA”), a member of the MHSC Group, which islicensed and regulated by the Hong Kong Securities and Futures Commission.
Australia: This report is being distributed in Australia by MHSA, which is exempted from the requirement to hold an Australian financial serviceslicense under the Corporation Act 2001 (“CA”) in respect of the financial services provided to the recipients. MHSA is regulated by the Securities andFutures Commission under the laws of Hong Kong, which differ from Australian laws. Distribution of this report is intended only for recipients whoare “wholesale clients” within the meaning of the CA.
If you do not wish to receive our reports in the future, please contact your sales person and request to be removed from receiving this distribution.
© Mizuho Securities USA LLC. All Rights Reserved 2017. This document may not be altered, reproduced or redistributed, or passed on to any otherparty, in whole or in part, without the prior written consent of Mizuho Securities USA LLC.
Mi-Tech Vol. 50: A Look at the LiDAR Market Through 2024E
April 3, 2017 20Mizuho Securities USA LLC