atoms, bits, and cash - giddy.org
TRANSCRIPT

CREDIT SUISSE FIRST BOSTON CORPORATION
Equity Research
Americas U.S. Investment Strategy November 22, 1999
Atoms, Bits, and Cash
The ABCs of Investing in the New Economy
Michael J. Mauboussin1 212 325 [email protected]
Stephen G. Kawaja1 212 325 [email protected]
• Detailed analysis of return on invested capital for the S&P 500shows that the source of value creation is shifting from physicalcapital to intellectual capital—from atoms to bits.
• Given that our accounting system is poor at capturing intellectualcapital, investors must focus on the source of value creation:cash.
• We find that the cash conversion cycle is an excellent measureof how well management is managing its tangible capital base.
• Our data show that new economy industries are improving theircapital management better than old economy industries. Further,companies closest to the customer tend to do a better job ofmanaging capital.
• The cash conversion cycle is a great way for growth and valueinvestors to identify promise or trouble in their stock picks.
Atoms, Bits, and Cash
– 2 –
Table of Contents
Executive Summary............................................................................................. 3
Introduction .......................................................................................................... 4
The Digital Economy: From Atoms to Bits........................................................ 5
Not Accounting for Bits....................................................................................... 7Uncovering Tangible Asset Efficiency 9
Capturing Change: The Cash Conversion Cycle............................................ 11The Mechanics of the Cash Conversion Cycle 11
The Cash Conversion Cycle Applied ............................................................... 13The Economy 13Various Sectors 13Individual Companies 18Case Study: Dell Computer Corp. 21
Appendix A ......................................................................................................... 24
Appendix B ......................................................................................................... 25

Atoms, Bits, and Cash
– 3 –
Executive Summary
• Aggregate return on invested capital data mask some profound trends.Detailed analysis of return on invested capital for the S&P 500 show that thesource of value creation is shifting from physical capital to intellectual capi-tal—from atoms to bits. In fact, improved physical capital management hasfreed roughly $245 billion over the past decade. However, measures of im-proved physical capital management are offset by a surge in goodwill. Cashis investing’s common denominator. Given that our accounting system is poorat capturing intellectual capital, investors must focus on the source of valuecreation: cash. There is a substantial and growing chasm between our ac-counting system and economic reality. Analysis of cash flow shrinks that gap,and allows investors to judge all companies on a universal and proven metricof performance.
• The cash conversion cycle is a powerful tool. We find that the cash conver-sion cycle is an excellent measure of how well management is employing itstangible capital base. In effect, an improving cash conversion cycle is often atriumph of brains over brawn—intellectual capital over physical capital.
• Cash flow: out with the old, in with the new. Our data show that new economyindustries—including technology and communications services—are improv-ing their capital management better than old economy industries such as ba-sic materials and energy. Further, companies closest to the customer tend todo a better job of managing capital than those removed from the end market.
• A stock picker’s delight. The cash conversion cycle is a great tool for growthand value investors to identify promise or trouble in their stock picks. Risingcash conversion cycles often indicate deterioration in cash flows, while de-clining cash conversion cycles generally signal improving cash flows. Neitherrising nor falling cash conversion cycles are readily apparent from the incomestatement. Thus, changing cash conversion cycles are often a harbinger ofstock price performance.
Atoms, Bits, and Cash
– 4 –
Introduction
“When I was a kid in the bank, the key economic indicator we looked at wasfreight car loadings. Who cares about that now? What we need is a way to meas-ure the knowledge we bring to the work we do.”
-Walter Wriston1
Throughout most of history, our economy has centered on the production of tan-gible goods using physical assets. However, the economy is undergoing a fun-damental shift. A new economy is emerging, where reliance on tangible capital isyielding to intellectual capital–from atoms to bits. Intellectual capital is intellectualmaterial—knowledge, information, intellectual property, and experience—that canbe put to use to create wealth.
2
This atoms-to-bits transformation has not only spawned whole new businesses, itis reshaping the competitive landscape of traditional industries. It has also cre-ated significant shareholder value, supporting one of the biggest and longest bullmarkets in history.
Unfortunately, as ethereal bits eclipse concrete atoms, traditional financial meas-ures become less reliable at capturing value. Our accounting system, designed totrack the movement of physical capital, is inelegant in recognizing knowledgecapital. The investment rules developed by Graham and Dodd for post-Depression companies have little to say about intangible assets. But none of thismatters to the stock market, which clearly has rewarded brains over brawn.
Happily, there is a common denominator for valuing atoms and bits: cash. In fact,Graham and Dodd were right all along: the value of a business is the presentvalue of future free cash flows. Debates about purchase versus pooling, expens-ing versus capitalizing, and income statement versus balance sheet all overlook abasic verity: the stock market follows cash. Increasingly, intellectual capital is re-placing physical capital—freeing huge sums of cash and confounding traditionalanalysis.
This report is broken into four parts. First, we explore the shift from atoms to bits.Our analysis reveals clear evidence of a surge in intellectual capital that is notwell captured in aggregate data. Second, we highlight the cash conversion cycleas a useful starting point in identifying companies that are successfully replacingtangible assets with intellectual capital. Third, we apply the cash conversion cycleto various sectors and companies. This analysis highlights shifts in the economyand provides critical insights about valuation. Finally, we show how the cash con-version cycle can be a great tool for stock picking.

Atoms, Bits, and Cash
– 5 –
The Digital Economy: From Atoms to Bits
“While the weight of current economic output is probably only modestly higherthan it was a half century ago, value added, adjusted for price change, has risenwell over threefold.”
-Alan Greenspan3
The Information Age is supplanting the Industrial Age. Knowledge is replacingphysical things as both the primary input and the final output of the productionprocess. The proof is everywhere, from radical new production processes to thebooming software industry.4
Consider a beverage can. In 1958, Reynolds Metals developed a seven-ouncealuminum can to compete with the standard steel can.5 The new containerweighed a relatively hefty two-thirds of an ounce, and required costly chemicalsor massive amounts of expensive electric power to produce.
This all changed when aluminum producers and can manufacturers figured outhow to make the aluminum can into a viable alternative to the steel can. Improvedmanufacturing know-how reduced the weight of the can to less than half anounce. The creation of an expansive recycling network—recycled aluminum usesabout 5% of the electricity needed to make ingot out of scratch—circumventedthe massive power cost disadvantage. The technology took off.
By 1967, the year Coke and Pepsi started using the aluminum can, engineershad figured out how to reduce the material used by more than 25%. Yet anothertriumph of knowledge over nature.
Aluminum can production is a microcosm. For example, U.S. exports lost 50% oftheir physical weight per dollar of value from 1990 to 1996.6
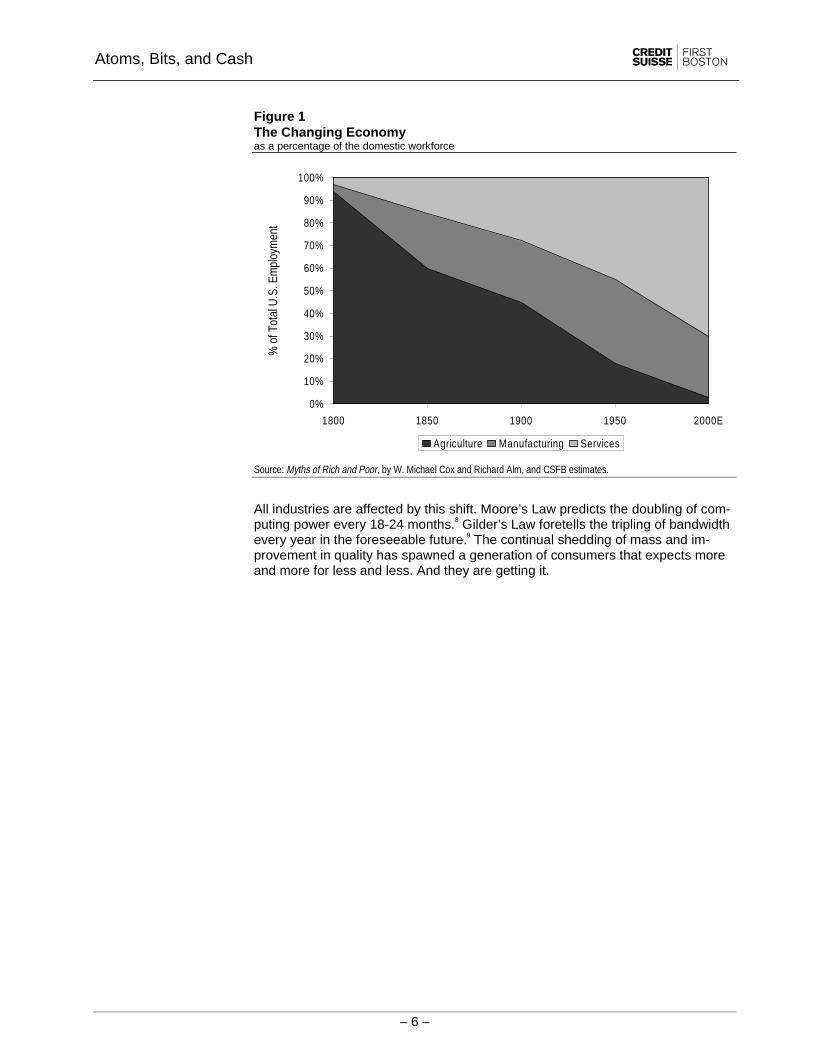
The trend away from manufacturing and toward services and other nonphysicaloutput has become pronounced. In 1800, only 3% of the domestic workforce heldservice jobs. By 1950, that number had jumped to 45%. We expect 70% of thedomestic workforce to hold service jobs by the turn of the millennium (seeFigure 1).7
Atoms, Bits, and Cash
– 6 –
Figure 1The Changing Economyas a percentage of the domestic workforce
0%
10%
20%
30%
40%
50%
60%
70%
80%
90%
100%
1800 1850 1900 1950 2000E
% o
f Tot
al U
.S. E
mpl
oym
ent
Agriculture Manufacturing Services
Source: Myths of Rich and Poor, by W. Michael Cox and Richard Alm, and CSFB estimates.
All industries are affected by this shift. Moore’s Law predicts the doubling of com-puting power every 18-24 months.8 Gilder’s Law foretells the tripling of bandwidthevery year in the foreseeable future.9 The continual shedding of mass and im-provement in quality has spawned a generation of consumers that expects moreand more for less and less. And they are getting it.
Atoms, Bits, and Cash
– 7 –
Not Accounting for Bits
“The good news is that there’s a new item in the asset column, one you’re prob-ably not even accounting for: your information assets.”
-Downes and Mui10
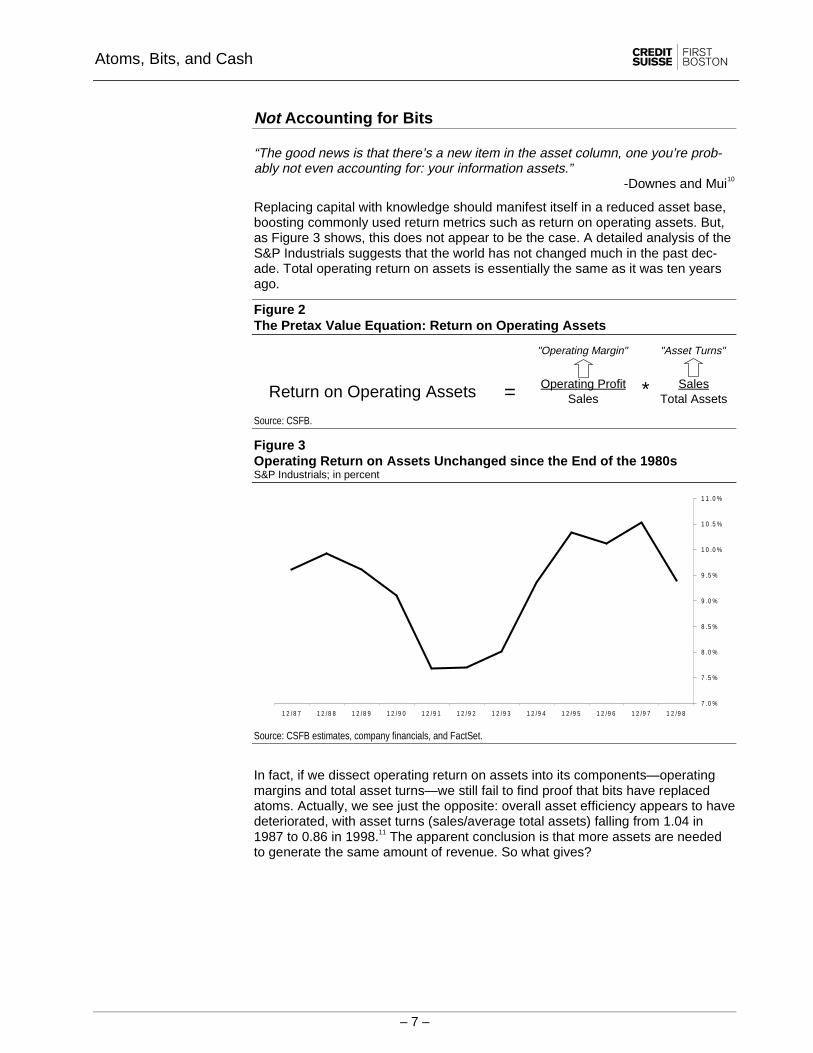
Replacing capital with knowledge should manifest itself in a reduced asset base,boosting commonly used return metrics such as return on operating assets. But,as Figure 3 shows, this does not appear to be the case. A detailed analysis of theS&P Industrials suggests that the world has not changed much in the past dec-ade. Total operating return on assets is essentially the same as it was ten yearsago.
Figure 2The Pretax Value Equation: Return on Operating Assets
"Operating Margin" "Asset Turns"
Operating Profit SalesSales Total AssetsReturn on Operating Assets = *
Source: CSFB.
Figure 3Operating Return on Assets Unchanged since the End of the 1980sS&P Industrials; in percent
7 .0 %
7 .5 %
8 .0 %
8 .5 %
9 .0 %
9 .5 %
1 0 .0 %
1 0 .5 %
1 1 .0 %
1 2 /9 81 2 /9 71 2 /9 61 2 /9 51 2 /9 41 2 /9 31 2 / 9 21 2 / 9 11 2 / 9 01 2 / 8 91 2 / 8 81 2 / 8 7
Source: CSFB estimates, company financials, and FactSet.
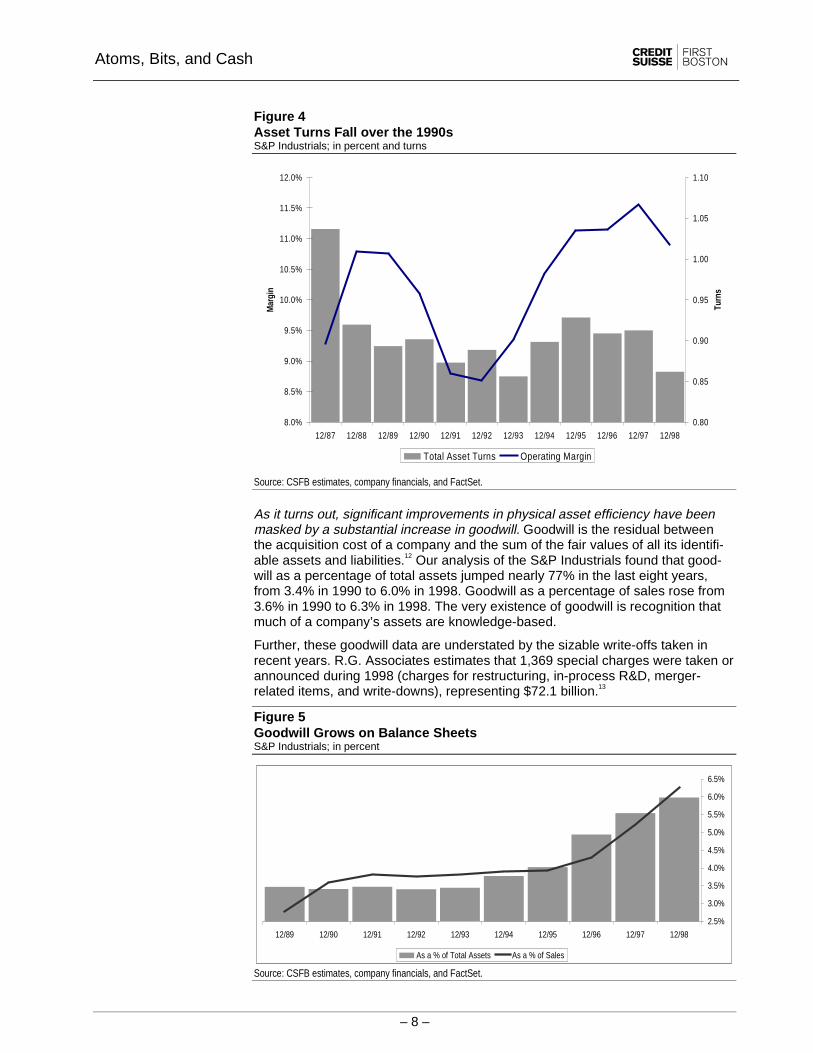
In fact, if we dissect operating return on assets into its components—operatingmargins and total asset turns—we still fail to find proof that bits have replacedatoms. Actually, we see just the opposite: overall asset efficiency appears to havedeteriorated, with asset turns (sales/average total assets) falling from 1.04 in1987 to 0.86 in 1998.11 The apparent conclusion is that more assets are neededto generate the same amount of revenue. So what gives?
Atoms, Bits, and Cash
– 8 –
Figure 4Asset Turns Fall over the 1990sS&P Industrials; in percent and turns
0.80
0.85
0.90
0.95
1.00
1.05
1.10
12/9812/9712/9612/9512/9412/9312/9212/9112/9012/8912/8812/87
Turn
s
8.0%
8.5%
9.0%
9.5%
10.0%
10.5%
11.0%
11.5%
12.0%
Mar
gin
Total Asset Turns Operating Margin
Source: CSFB estimates, company financials, and FactSet.
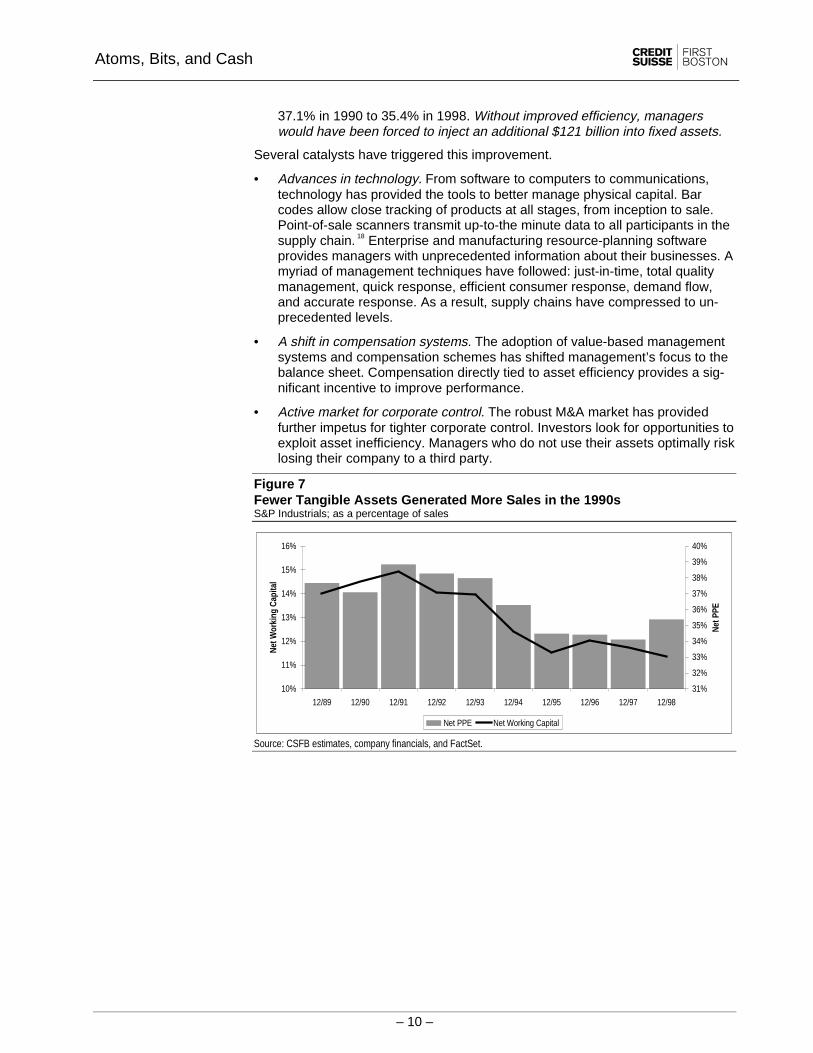
As it turns out, significant improvements in physical asset efficiency have beenmasked by a substantial increase in goodwill. Goodwill is the residual betweenthe acquisition cost of a company and the sum of the fair values of all its identifi-able assets and liabilities.12 Our analysis of the S&P Industrials found that good-will as a percentage of total assets jumped nearly 77% in the last eight years,from 3.4% in 1990 to 6.0% in 1998. Goodwill as a percentage of sales rose from3.6% in 1990 to 6.3% in 1998. The very existence of goodwill is recognition thatmuch of a company’s assets are knowledge-based.
Further, these goodwill data are understated by the sizable write-offs taken inrecent years. R.G. Associates estimates that 1,369 special charges were taken orannounced during 1998 (charges for restructuring, in-process R&D, merger-related items, and write-downs), representing $72.1 billion.13
Figure 5Goodwill Grows on Balance SheetsS&P Industrials; in percent
2.5%
3.0%
3.5%
4.0%
4.5%
5.0%
5.5%
6.0%
6.5%
12/9812/9712/9612/9512/9412/9312/9212/9112/9012/89
As a % of Total Assets As a % of Sales
Source: CSFB estimates, company financials, and FactSet.

Atoms, Bits, and Cash
– 9 –
Moreover, the surge in goodwill, while impressive, actually understates the rise inintangible assets.14 Reported goodwill results only from a merger or acquisition.However, acquirors can choose to record transactions as either a “purchase” or a“pooling,” with radically different accounting consequences. �
15 Purchase account-ing results in goodwill that is amortized, or expensed, against earnings for a pe-riod of up to 40 years. In contrast, there is no goodwill entry for pooling deals. Asa result, a “pooling” deal leaves a company with a smaller asset base than a“purchase” deal, even though the economics are identical.16
So while an active market for corporate control has forced goodwill onto balancesheets, goodwill is in no way a systematic or complete measure of intellectualcapital. In 1998 alone, 45.3% of the total domestic deal value was treated as apooling, leaving massive amounts of goodwill unreported.
Table 1Chosen Accounting Convention for M&A Deals Announced in 1998
Total Value Number of Deals(in millions) (in units)
Accounting Convention:Domestic $1,996,279.9 14,801.0 Pooling 45.3% 3.8% Purchase 54.7% 96.2%
Source: Security Data Corp.
Figure 6Operating Return on Assets Does Not Explain ValueS&P Industrials; in percent and turns
0
200
400
600
800
1,000
1,200
1,400
1,600
12/9812/9712/9612/9512/9412/9312/9212/9112/9012/89Pr
ice
6.0%
6.5%
7.0%
7.5%
8.0%
8.5%
9.0%
9.5%
10.0%
10.5%
11.0%
RO
A
S&P Industrials ROA S&P Industrials Price
r2 = 21.6%
Source: CSFB estimates, company financials, and FactSet.
Uncovering Tangible Asset Efficiency
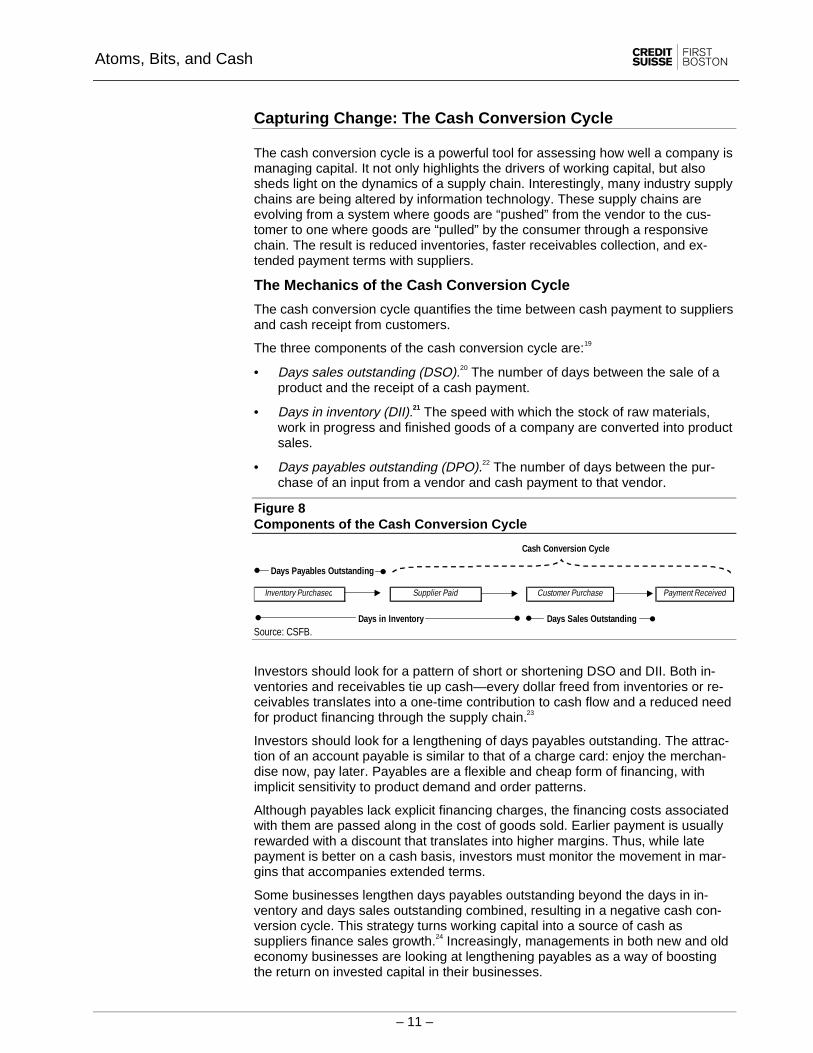
Removing goodwill from the equation, we see that tangible asset efficiency isactually soaring. Economy-wide productivity gains have reduced tangible assetneeds by more than $245 billion in the 1990s. 17 For the S&P Industrials, we seethat:
• Net working capital as a percentage of sales fell, in aggregate, from 14.5% in1990 to 11.4% in 1998. Had working capital efficiency remained at 1990 lev-els, an additional $124 billion would be tied up in net working capital alone.
• Net plant, property, and equipment enjoyed a similar, albeit more modest,improvement over the decade. Net PPE as a percentage of sales fell from
Atoms, Bits, and Cash
– 10 –
37.1% in 1990 to 35.4% in 1998. Without improved efficiency, managerswould have been forced to inject an additional $121 billion into fixed assets.
Several catalysts have triggered this improvement.
• Advances in technology. From software to computers to communications,technology has provided the tools to better manage physical capital. Barcodes allow close tracking of products at all stages, from inception to sale.Point-of-sale scanners transmit up-to-the minute data to all participants in thesupply chain. 18 Enterprise and manufacturing resource-planning softwareprovides managers with unprecedented information about their businesses. Amyriad of management techniques have followed: just-in-time, total qualitymanagement, quick response, efficient consumer response, demand flow,and accurate response. As a result, supply chains have compressed to un-precedented levels.
• A shift in compensation systems. The adoption of value-based managementsystems and compensation schemes has shifted management’s focus to thebalance sheet. Compensation directly tied to asset efficiency provides a sig-nificant incentive to improve performance.
• Active market for corporate control. The robust M&A market has providedfurther impetus for tighter corporate control. Investors look for opportunities toexploit asset inefficiency. Managers who do not use their assets optimally risklosing their company to a third party.
Figure 7Fewer Tangible Assets Generated More Sales in the 1990sS&P Industrials; as a percentage of sales
31%
32%
33%
34%
35%
36%
37%
38%
39%
40%
12/9812/9712/9612/9512/9412/9312/9212/9112/9012/89Ne
t PPE
10%
11%
12%
13%
14%
15%
16%
Net
Wor
king
Cap
ital
Net PPE Net Working Capital
Source: CSFB estimates, company financials, and FactSet.
Atoms, Bits, and Cash
– 11 –
Capturing Change: The Cash Conversion Cycle
The cash conversion cycle is a powerful tool for assessing how well a company ismanaging capital. It not only highlights the drivers of working capital, but alsosheds light on the dynamics of a supply chain. Interestingly, many industry supplychains are being altered by information technology. These supply chains areevolving from a system where goods are “pushed” from the vendor to the cus-tomer to one where goods are “pulled” by the consumer through a responsivechain. The result is reduced inventories, faster receivables collection, and ex-tended payment terms with suppliers.
The Mechanics of the Cash Conversion Cycle
The cash conversion cycle quantifies the time between cash payment to suppliersand cash receipt from customers.
The three components of the cash conversion cycle are:19
• Days sales outstanding (DSO).20 The number of days between the sale of aproduct and the receipt of a cash payment.
• Days in inventory (DII).21 The speed with which the stock of raw materials,work in progress and finished goods of a company are converted into productsales.
• Days payables outstanding (DPO).22 The number of days between the pur-chase of an input from a vendor and cash payment to that vendor.
Figure 8Components of the Cash Conversion Cycle
Days Payables Outstanding
Cash Conversion Cycle
Payment Received
Days in Inventory
Supplier Paid Customer PurchaseInventory Purchased
Days Sales OutstandingSource: CSFB.
Investors should look for a pattern of short or shortening DSO and DII. Both in-ventories and receivables tie up cash—every dollar freed from inventories or re-ceivables translates into a one-time contribution to cash flow and a reduced needfor product financing through the supply chain.23
Investors should look for a lengthening of days payables outstanding. The attrac-tion of an account payable is similar to that of a charge card: enjoy the merchan-dise now, pay later. Payables are a flexible and cheap form of financing, withimplicit sensitivity to product demand and order patterns.
Although payables lack explicit financing charges, the financing costs associatedwith them are passed along in the cost of goods sold. Earlier payment is usuallyrewarded with a discount that translates into higher margins. Thus, while latepayment is better on a cash basis, investors must monitor the movement in mar-gins that accompanies extended terms.
Some businesses lengthen days payables outstanding beyond the days in in-ventory and days sales outstanding combined, resulting in a negative cash con-version cycle. This strategy turns working capital into a source of cash assuppliers finance sales growth.24 Increasingly, managements in both new and oldeconomy businesses are looking at lengthening payables as a way of boostingthe return on invested capital in their businesses.

Atoms, Bits, and Cash
– 12 –
In fact, Wal-Mart recently announced its objective: “to sell merchandise before wepay for it.”25 Currently, 63% of Wal-Mart’s inventory is sold before the bills arepaid, up from 55% in 1998. Wal-Mart expects its entire inventory to be financedby suppliers within three years.
Atoms, Bits, and Cash
– 13 –
The Cash Conversion Cycle Applied
The Economy
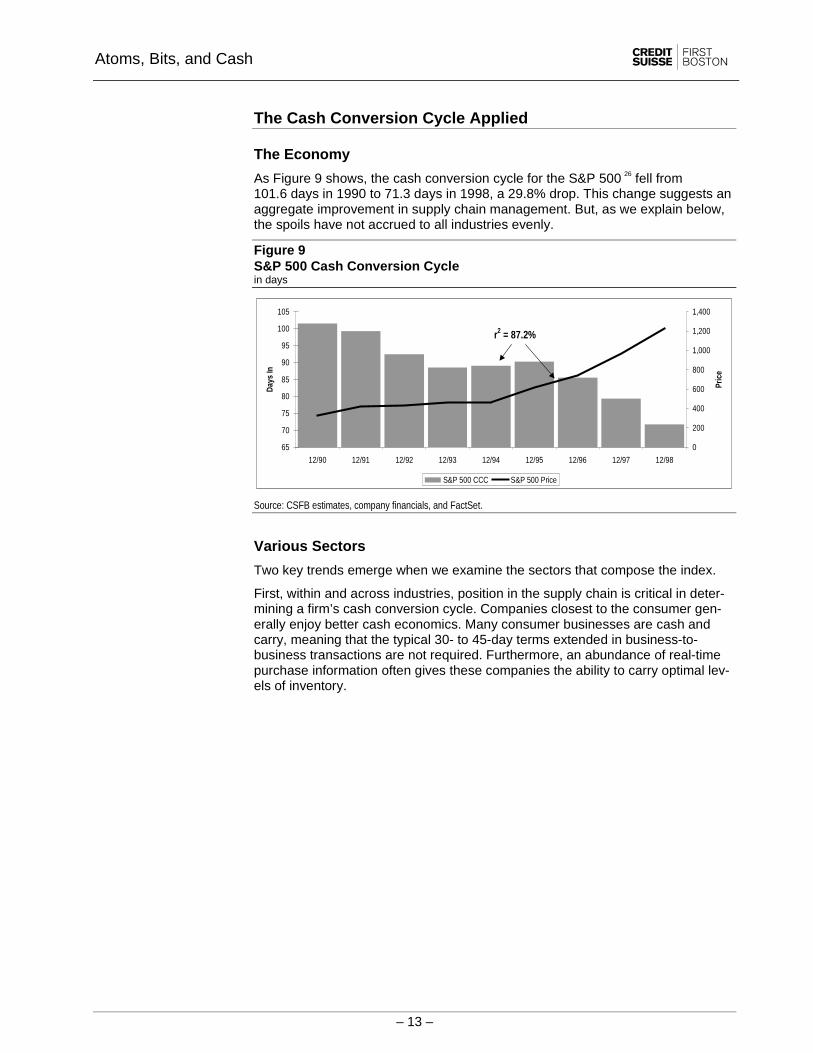
As Figure 9 shows, the cash conversion cycle for the S&P 500 26 fell from101.6 days in 1990 to 71.3 days in 1998, a 29.8% drop. This change suggests anaggregate improvement in supply chain management. But, as we explain below,the spoils have not accrued to all industries evenly.
Figure 9S&P 500 Cash Conversion Cyclein days
0
200
400
600
800
1,000
1,200
1,400
12/9812/9712/9612/9512/9412/9312/9212/9112/90
Pric
e
65
70
75
80
85
90
95
100
105
Days
In
S&P 500 CCC S&P 500 Price
r2 = 87.2%
Source: CSFB estimates, company financials, and FactSet.
Various Sectors
Two key trends emerge when we examine the sectors that compose the index.
First, within and across industries, position in the supply chain is critical in deter-mining a firm’s cash conversion cycle. Companies closest to the consumer gen-erally enjoy better cash economics. Many consumer businesses are cash andcarry, meaning that the typical 30- to 45-day terms extended in business-to-business transactions are not required. Furthermore, an abundance of real-timepurchase information often gives these companies the ability to carry optimal lev-els of inventory.
Atoms, Bits, and Cash
– 14 –
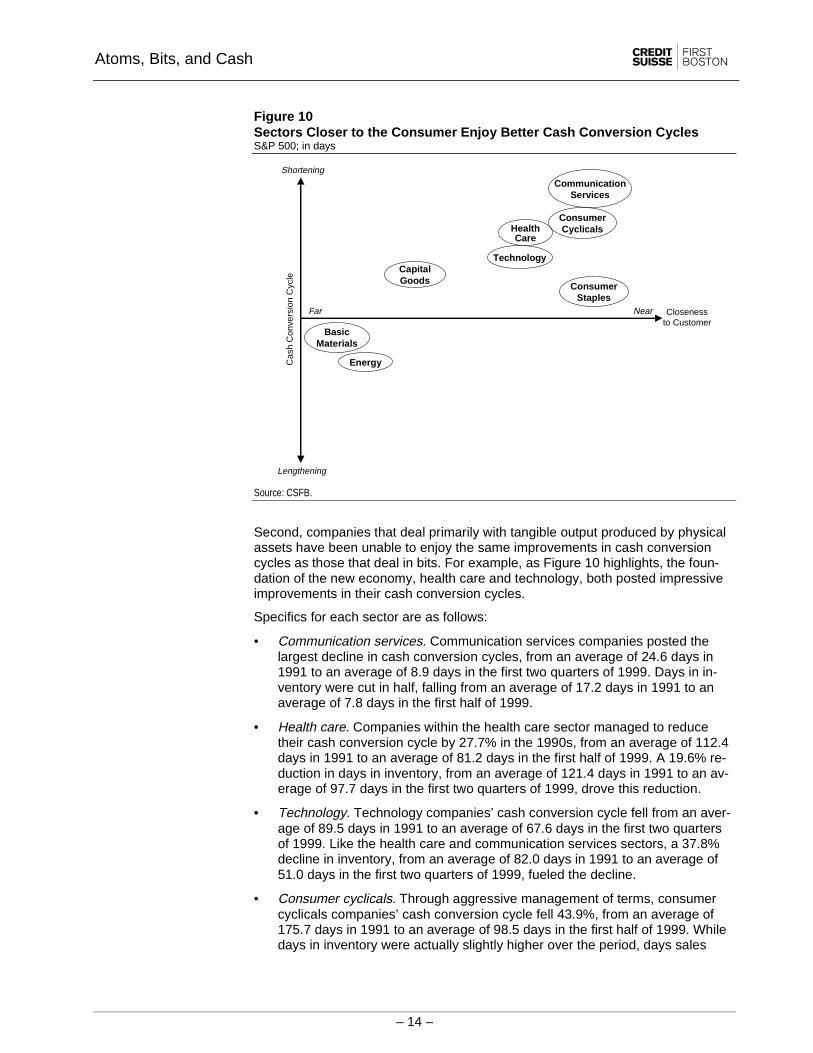
Figure 10Sectors Closer to the Consumer Enjoy Better Cash Conversion CyclesS&P 500; in days
Shortening
Lengthening
Closenessto Customer
Energy
BasicMaterials
Cas
h C
onve
rsio
n C
ycle
CapitalGoods
Technology
HealthCare
ConsumerCyclicals
CommunicationServices
ConsumerStaples
Far Near
Source: CSFB.
Second, companies that deal primarily with tangible output produced by physicalassets have been unable to enjoy the same improvements in cash conversioncycles as those that deal in bits. For example, as Figure 10 highlights, the foun-dation of the new economy, health care and technology, both posted impressiveimprovements in their cash conversion cycles.
Specifics for each sector are as follows:
• Communication services. Communication services companies posted thelargest decline in cash conversion cycles, from an average of 24.6 days in1991 to an average of 8.9 days in the first two quarters of 1999. Days in in-ventory were cut in half, falling from an average of 17.2 days in 1991 to anaverage of 7.8 days in the first half of 1999.
• Health care. Companies within the health care sector managed to reducetheir cash conversion cycle by 27.7% in the 1990s, from an average of 112.4days in 1991 to an average of 81.2 days in the first half of 1999. A 19.6% re-duction in days in inventory, from an average of 121.4 days in 1991 to an av-erage of 97.7 days in the first two quarters of 1999, drove this reduction.
• Technology. Technology companies’ cash conversion cycle fell from an aver-age of 89.5 days in 1991 to an average of 67.6 days in the first two quartersof 1999. Like the health care and communication services sectors, a 37.8%decline in inventory, from an average of 82.0 days in 1991 to an average of51.0 days in the first two quarters of 1999, fueled the decline.
• Consumer cyclicals. Through aggressive management of terms, consumercyclicals companies’ cash conversion cycle fell 43.9%, from an average of175.7 days in 1991 to an average of 98.5 days in the first half of 1999. Whiledays in inventory were actually slightly higher over the period, days sales

Atoms, Bits, and Cash
– 15 –
outstanding were halved, from an average of 177.4 in 1991 to an average of88.7 in the first half of 1999.
Atoms, Bits, and Cash
– 16 –
• Capital goods. Like consumer cyclicals, capital goods companies were ableto improve their cash conversion cycle primarily by better managing receiv-ables. The sector’s cash conversion cycle fell 23.2%, from an average of118.0 days in 1991 to an average of 90.7 in the first two quarters of 1999.
• Consumer staples. While the average cash conversion cycle in the sectordropped a mere 12.6%, from an average of 48.3 in 1991 to 42.3 days in thefirst two quarters of 1999, the absolute level is still less than half of its cyclicalcounterpart.
• Basic materials. The basic materials sector usually sits at the beginning of thesupply chain and deals in physical goods. Consequently, it is one of only twosectors that actually showed a lengthening cash conversion cycle over the1990s. Both DSOs and DIIs lengthened, driving the cash conversion cyclefrom an average of 73.7 days in 1991 to an average of 80.9 days in the firsthalf of 1999.
• Energy. The energy sector posted the greatest lengthening in its cash con-version cycle, jumping 34.9% in the 1990s—from an average of 17.5 days in1991 to an average of 23.6 days in the first two quarters of 1999.

Atoms, Bits, and Cash
– 17 –
Table 2Cash Conversion Cycle by SectorS&P 500 sector definitions; in days; percentage change
Average 1991Average
year-to-date 1999 Change Average 1991Average
year-to-date 1999 ChangeCommunication Services Basic Materials Days: Sales Outstanding 64.93 65.70 1.19% Days: Sales Outstanding 53.82 56.28 4.58%
in Inventory 17.19 7.80 (54.61%) in Inventory 63.17 65.05 2.97% Payables Outstanding 57.52 64.56 12.24% Payables Outstanding 43.24 40.44 (6.49%)
CCC 24.60 8.94 (63.6)% CCC 73.74 80.89 9.7%
Consumer Cyclicals Energy Days: Sales Outstanding 177.38 88.72 (49.98%) Days: Sales Outstanding 36.76 42.29 15.03%
in Inventory 57.09 57.92 1.46% in Inventory 27.88 24.65 (11.60%) Payables Outstanding 58.81 48.14 (18.13%) Payables Outstanding 47.18 43.38 (8.06%)
CCC 175.66 98.50 (43.9)% CCC 17.46 23.56 34.9%
Health Care Days: Sales Outstanding 61.74 60.28 (2.36%)
in Inventory 121.45 97.48 (19.74%) Payables Outstanding 72.13 76.84 6.52%
CCC 111.05 80.92 (27.1)%
Technology Days: Sales Outstanding 89.54 70.06 (21.75%)
in Inventory 81.98 51.48 (37.21%) Payables Outstanding 82.00 52.08 (36.49%)
CCC 89.53 69.47 (22.4)%
Capital Goods Days: Sales Outstanding 93.11 72.41 (22.23%)
in Inventory 69.79 63.00 (9.72%) Payables Outstanding 44.90 44.75 (0.33%)
CCC 118.00 90.66 (23.2)%
Consumer Staples Days: Sales Outstanding 30.40 30.44 0.12%
in Inventory 61.36 55.97 (8.77%) Payables Outstanding 43.28 44.07 1.84%
CCC 48.49 42.34 (12.7)%
Improved Lagged
Source: CSFB estimates, company financials, and FactSet.
Atoms, Bits, and Cash
– 18 –
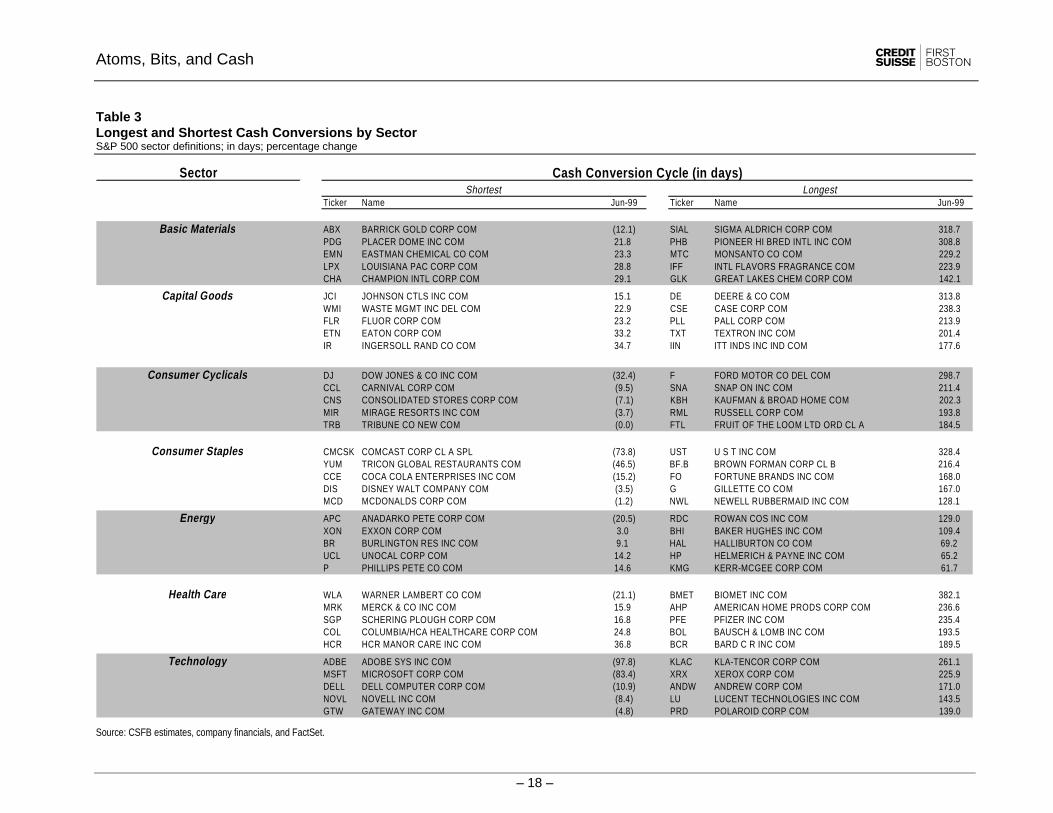
Table 3Longest and Shortest Cash Conversions by SectorS&P 500 sector definitions; in days; percentage change
Sector
Ticker Name Jun-99 Ticker Name Jun-99
Basic Materials ABX BARRICK GOLD CORP COM (12.1) SIAL SIGMA ALDRICH CORP COM 318.7PDG PLACER DOME INC COM 21.8 PHB PIONEER HI BRED INTL INC COM 308.8EMN EASTMAN CHEMICAL CO COM 23.3 MTC MONSANTO CO COM 229.2LPX LOUISIANA PAC CORP COM 28.8 IFF INTL FLAVORS FRAGRANCE COM 223.9CHA CHAMPION INTL CORP COM 29.1 GLK GREAT LAKES CHEM CORP COM 142.1
Capital Goods JCI JOHNSON CTLS INC COM 15.1 DE DEERE & CO COM 313.8WMI WASTE MGMT INC DEL COM 22.9 CSE CASE CORP COM 238.3FLR FLUOR CORP COM 23.2 PLL PALL CORP COM 213.9ETN EATON CORP COM 33.2 TXT TEXTRON INC COM 201.4IR INGERSOLL RAND CO COM 34.7 IIN ITT INDS INC IND COM 177.6
Consumer Cyclicals DJ DOW JONES & CO INC COM (32.4) F FORD MOTOR CO DEL COM 298.7CCL CARNIVAL CORP COM (9.5) SNA SNAP ON INC COM 211.4CNS CONSOLIDATED STORES CORP COM (7.1) KBH KAUFMAN & BROAD HOME COM 202.3MIR MIRAGE RESORTS INC COM (3.7) RML RUSSELL CORP COM 193.8TRB TRIBUNE CO NEW COM (0.0) FTL FRUIT OF THE LOOM LTD ORD CL A 184.5
Consumer Staples CMCSK COMCAST CORP CL A SPL (73.8) UST U S T INC COM 328.4YUM TRICON GLOBAL RESTAURANTS COM (46.5) BF.B BROWN FORMAN CORP CL B 216.4CCE COCA COLA ENTERPRISES INC COM (15.2) FO FORTUNE BRANDS INC COM 168.0DIS DISNEY WALT COMPANY COM (3.5) G GILLETTE CO COM 167.0MCD MCDONALDS CORP COM (1.2) NWL NEWELL RUBBERMAID INC COM 128.1
Energy APC ANADARKO PETE CORP COM (20.5) RDC ROWAN COS INC COM 129.0XON EXXON CORP COM 3.0 BHI BAKER HUGHES INC COM 109.4BR BURLINGTON RES INC COM 9.1 HAL HALLIBURTON CO COM 69.2UCL UNOCAL CORP COM 14.2 HP HELMERICH & PAYNE INC COM 65.2P PHILLIPS PETE CO COM 14.6 KMG KERR-MCGEE CORP COM 61.7
Health Care WLA WARNER LAMBERT CO COM (21.1) BMET BIOMET INC COM 382.1MRK MERCK & CO INC COM 15.9 AHP AMERICAN HOME PRODS CORP COM 236.6SGP SCHERING PLOUGH CORP COM 16.8 PFE PFIZER INC COM 235.4COL COLUMBIA/HCA HEALTHCARE CORP COM 24.8 BOL BAUSCH & LOMB INC COM 193.5HCR HCR MANOR CARE INC COM 36.8 BCR BARD C R INC COM 189.5
Technology ADBE ADOBE SYS INC COM (97.8) KLAC KLA-TENCOR CORP COM 261.1MSFT MICROSOFT CORP COM (83.4) XRX XEROX CORP COM 225.9DELL DELL COMPUTER CORP COM (10.9) ANDW ANDREW CORP COM 171.0NOVL NOVELL INC COM (8.4) LU LUCENT TECHNOLOGIES INC COM 143.5GTW GATEWAY INC COM (4.8) PRD POLAROID CORP COM 139.0
Cash Conversion Cycle (in days)Shortest Longest
Source: CSFB estimates, company financials, and FactSet.
Atoms, Bits, and Cash
– 19 –
Individual Companies
The cash conversion cycle is a robust tool when applied to individual companies.Overall, there is a remarkable correspondence between capital market valuationand a short cash conversion cycle.
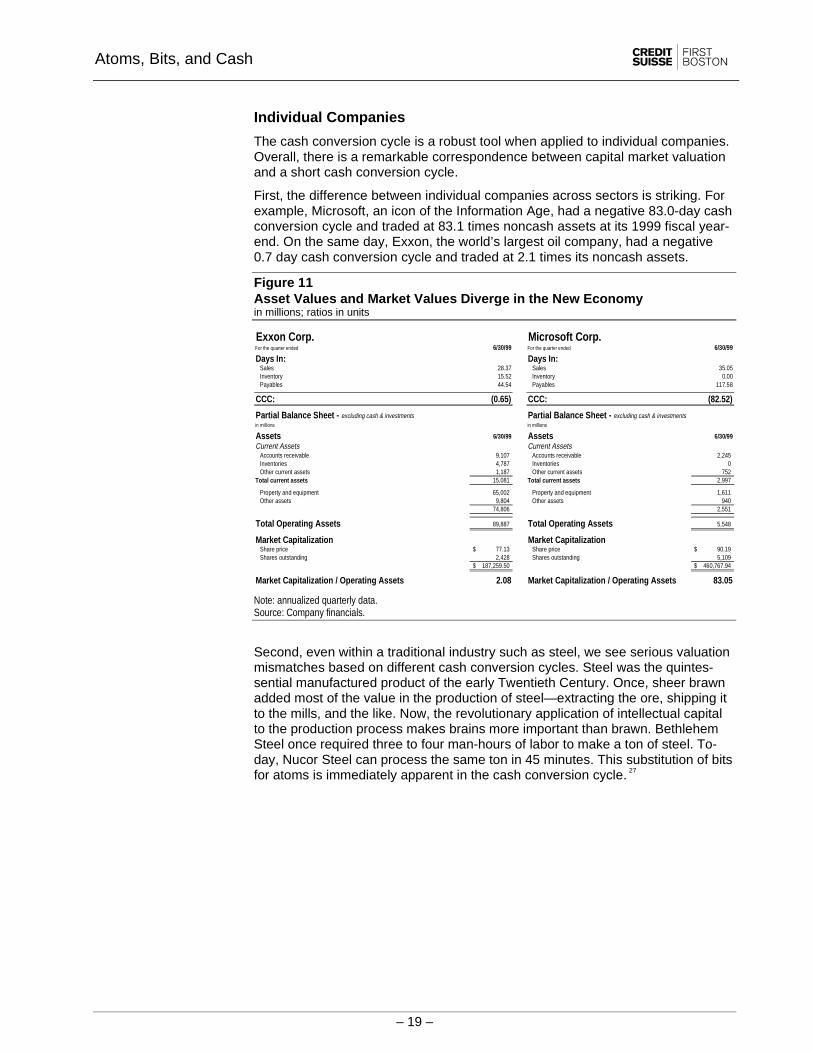
First, the difference between individual companies across sectors is striking. Forexample, Microsoft, an icon of the Information Age, had a negative 83.0-day cashconversion cycle and traded at 83.1 times noncash assets at its 1999 fiscal year-end. On the same day, Exxon, the world’s largest oil company, had a negative0.7 day cash conversion cycle and traded at 2.1 times its noncash assets.
Figure 11Asset Values and Market Values Diverge in the New Economyin millions; ratios in units
Exxon Corp. Microsoft Corp.For the quarter ended 6/30/99 For the quarter ended 6/30/99
Days In: Days In: Sales 28.37 Sales 35.05 Inventory 15.52 Inventory 0.00 Payables 44.54 Payables 117.58
CCC: (0.65) CCC: (82.52)
Partial Balance Sheet - excluding cash & investments Partial Balance Sheet - excluding cash & investmentsin millions in millions
Assets 6/30/99 Assets 6/30/99
Current Assets Current Assets Accounts receivable 9,107 Accounts receivable 2,245 Inventories 4,787 Inventories 0 Other current assets 1,187 Other current assets 752Total current assets 15,081 Total current assets 2,997
Property and equipment 65,002 Property and equipment 1,611 Other assets 9,804 Other assets 940
74,806 2,551
Total Operating Assets 89,887 Total Operating Assets 5,548
Market Capitalization Market Capitalization Share price 77.13$ Share price 90.19$ Shares outstanding 2,428 Shares outstanding 5,109
187,259.50$ 460,767.94$
Market Capitalization / Operating Assets 2.08 Market Capitalization / Operating Assets 83.05
Note: annualized quarterly data.Source: Company financials.
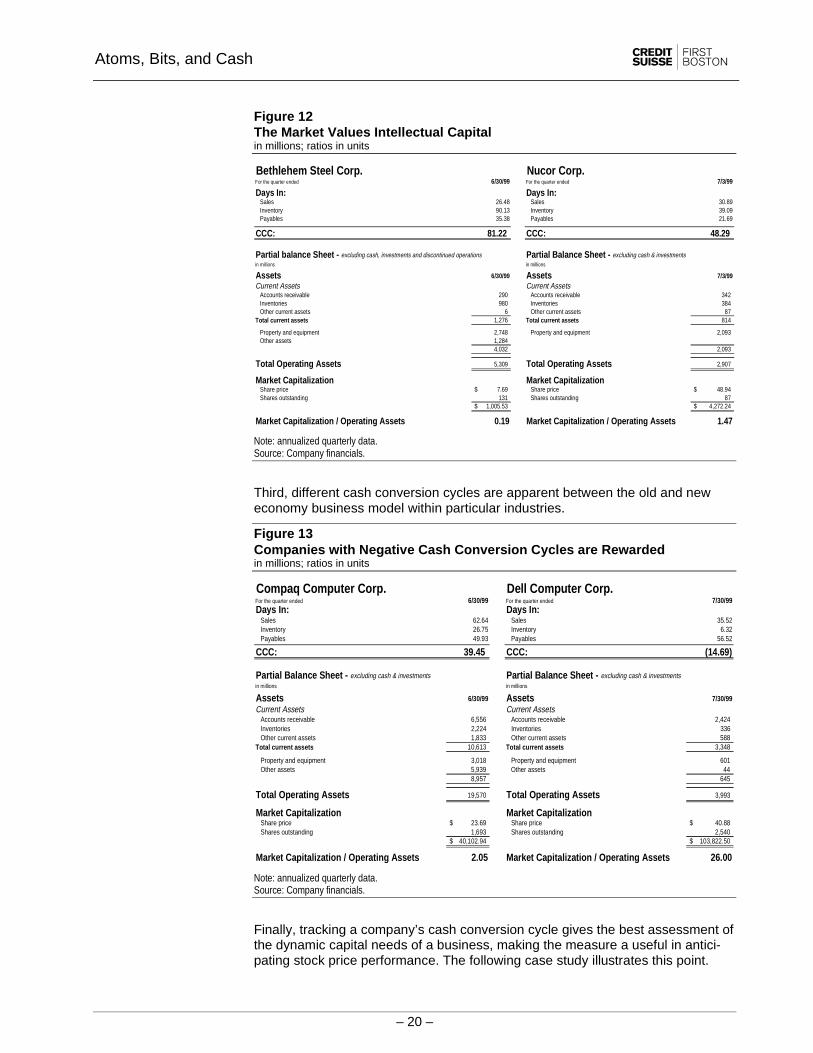
Second, even within a traditional industry such as steel, we see serious valuationmismatches based on different cash conversion cycles. Steel was the quintes-sential manufactured product of the early Twentieth Century. Once, sheer brawnadded most of the value in the production of steel—extracting the ore, shipping itto the mills, and the like. Now, the revolutionary application of intellectual capitalto the production process makes brains more important than brawn. BethlehemSteel once required three to four man-hours of labor to make a ton of steel. To-day, Nucor Steel can process the same ton in 45 minutes. This substitution of bitsfor atoms is immediately apparent in the cash conversion cycle. 27
Atoms, Bits, and Cash
– 20 –
Figure 12The Market Values Intellectual Capitalin millions; ratios in units
Bethlehem Steel Corp. Nucor Corp.For the quarter ended 6/30/99 For the quarter ended 7/3/99
Days In: Days In: Sales 26.48 Sales 30.89 Inventory 90.13 Inventory 39.09 Payables 35.38 Payables 21.69
CCC: 81.22 CCC: 48.29
Partial balance Sheet - excluding cash, investments and discontinued operations Partial Balance Sheet - excluding cash & investmentsin millions in millions
Assets 6/30/99 Assets 7/3/99
Current Assets Current Assets Accounts receivable 290 Accounts receivable 342 Inventories 980 Inventories 384 Other current assets 6 Other current assets 87Total current assets 1,276 Total current assets 814
Property and equipment 2,748 Property and equipment 2,093 Other assets 1,284
4,032 2,093
Total Operating Assets 5,309 Total Operating Assets 2,907
Market Capitalization Market Capitalization Share price 7.69$ Share price 48.94$ Shares outstanding 131 Shares outstanding 87
1,005.53$ 4,272.24$
Market Capitalization / Operating Assets 0.19 Market Capitalization / Operating Assets 1.47
Note: annualized quarterly data.Source: Company financials.
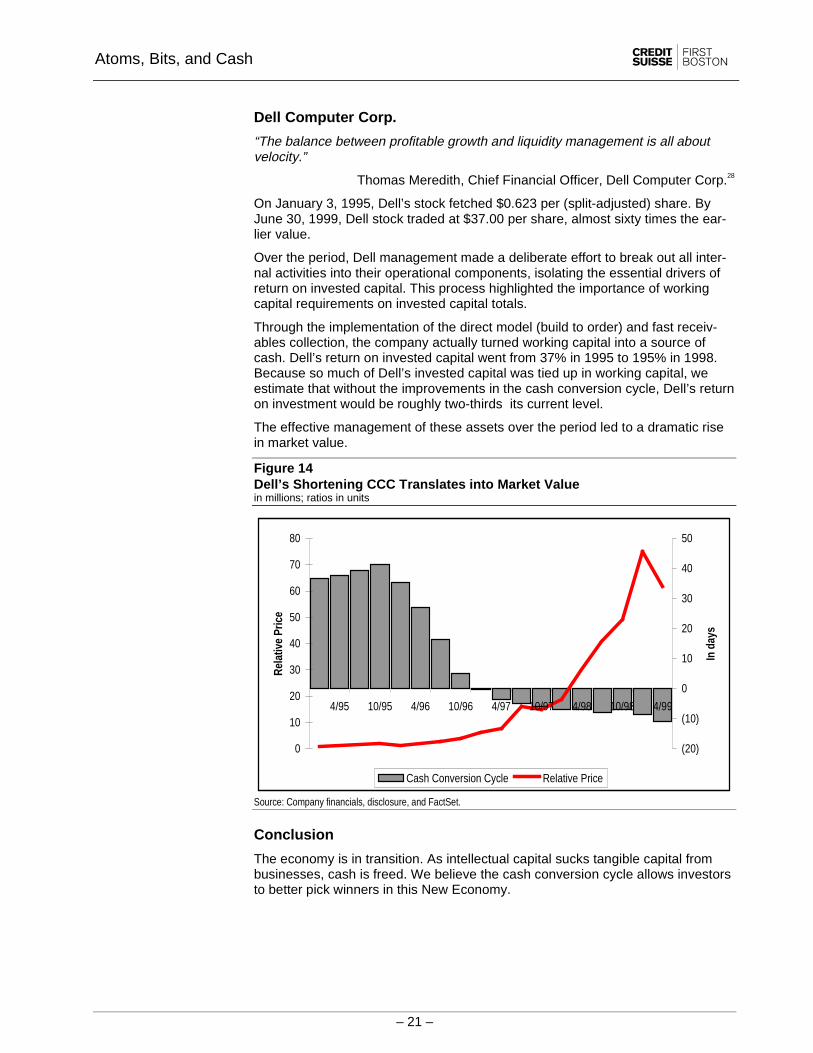
Third, different cash conversion cycles are apparent between the old and neweconomy business model within particular industries.
Figure 13Companies with Negative Cash Conversion Cycles are Rewardedin millions; ratios in units
Compaq Computer Corp. Dell Computer Corp.For the quarter ended 6/30/99 For the quarter ended 7/30/99Days In: Days In: Sales 62.64 Sales 35.52 Inventory 26.75 Inventory 6.32 Payables 49.93 Payables 56.52
CCC: 39.45 CCC: (14.69)
Partial Balance Sheet - excluding cash & investments Partial Balance Sheet - excluding cash & investmentsin millions in millions
Assets 6/30/99 Assets 7/30/99
Current Assets Current Assets Accounts receivable 6,556 Accounts receivable 2,424 Inventories 2,224 Inventories 336 Other current assets 1,833 Other current assets 588Total current assets 10,613 Total current assets 3,348
Property and equipment 3,018 Property and equipment 601 Other assets 5,939 Other assets 44
8,957 645
Total Operating Assets 19,570 Total Operating Assets 3,993
Market Capitalization Market Capitalization Share price 23.69$ Share price 40.88$ Shares outstanding 1,693 Shares outstanding 2,540
40,102.94$ 103,822.50$
Market Capitalization / Operating Assets 2.05 Market Capitalization / Operating Assets 26.00
Note: annualized quarterly data.Source: Company financials.
Finally, tracking a company’s cash conversion cycle gives the best assessment ofthe dynamic capital needs of a business, making the measure a useful in antici-pating stock price performance. The following case study illustrates this point.
Atoms, Bits, and Cash
– 21 –
Dell Computer Corp.
“The balance between profitable growth and liquidity management is all aboutvelocity.”
Thomas Meredith, Chief Financial Officer, Dell Computer Corp.28
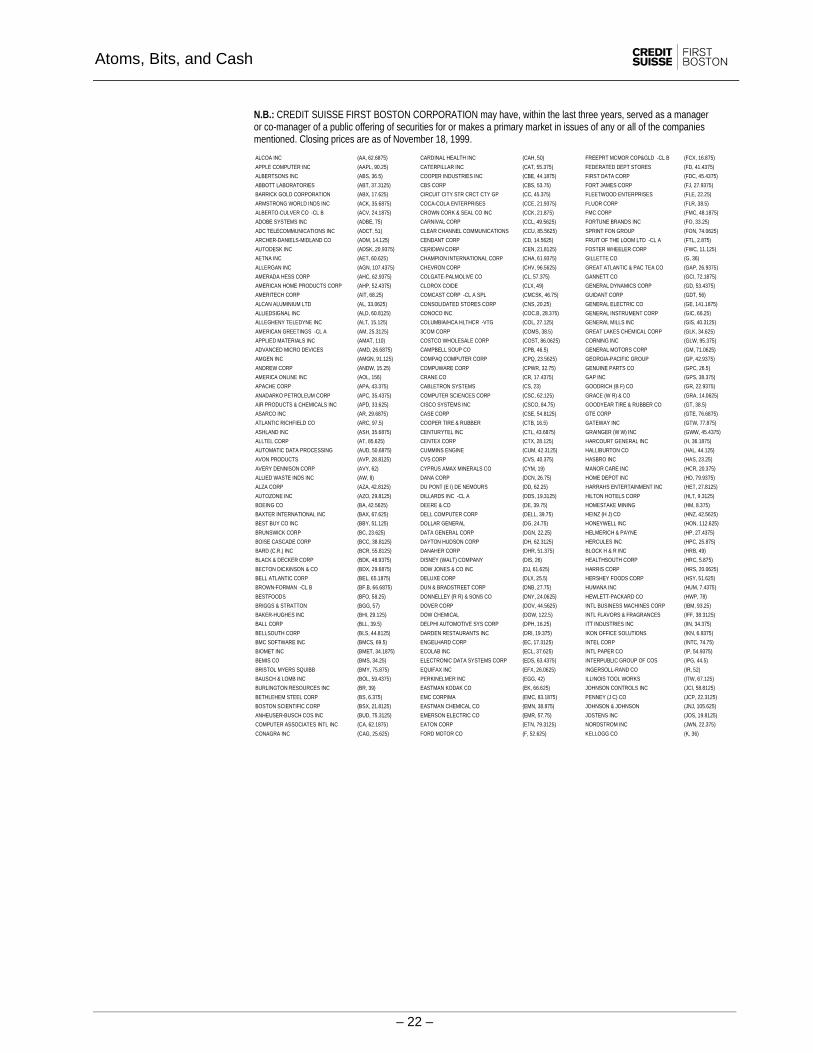
On January 3, 1995, Dell’s stock fetched $0.623 per (split-adjusted) share. ByJune 30, 1999, Dell stock traded at $37.00 per share, almost sixty times the ear-lier value.
Over the period, Dell management made a deliberate effort to break out all inter-nal activities into their operational components, isolating the essential drivers ofreturn on invested capital. This process highlighted the importance of workingcapital requirements on invested capital totals.
Through the implementation of the direct model (build to order) and fast receiv-ables collection, the company actually turned working capital into a source ofcash. Dell’s return on invested capital went from 37% in 1995 to 195% in 1998.Because so much of Dell’s invested capital was tied up in working capital, weestimate that without the improvements in the cash conversion cycle, Dell’s returnon investment would be roughly two-thirds its current level.
The effective management of these assets over the period led to a dramatic risein market value.
Figure 14Dell’s Shortening CCC Translates into Market Valuein millions; ratios in units
(20)
(10)
0
10
20
30
40
50
4/9910/984/9810/974/9710/964/9610/954/95In
day
s
0
10
20
30
40
50
60
70
80
Rela
tive
Pric
e
Cash Conversion Cycle Relative Price
Source: Company financials, disclosure, and FactSet.
Conclusion
The economy is in transition. As intellectual capital sucks tangible capital frombusinesses, cash is freed. We believe the cash conversion cycle allows investorsto better pick winners in this New Economy.
Atoms, Bits, and Cash
– 22 –
N.B.: CREDIT SUISSE FIRST BOSTON CORPORATION may have, within the last three years, served as a manageror co-manager of a public offering of securities for or makes a primary market in issues of any or all of the companiesmentioned. Closing prices are as of November 18, 1999.
ALCOA INC (AA, 62.6875) CARDINAL HEALTH INC (CAH, 50) FREEPRT MCMOR COP&GLD -CL B (FCX, 16.875)
APPLE COMPUTER INC (AAPL, 90.25) CATERPILLAR INC (CAT, 55.375) FEDERATED DEPT STORES (FD, 41.4375)
ALBERTSONS INC (ABS, 36.5) COOPER INDUSTRIES INC (CBE, 44.1875) FIRST DATA CORP (FDC, 45.4375)
ABBOTT LABORATORIES (ABT, 37.3125) CBS CORP (CBS, 53.75) FORT JAMES CORP (FJ, 27.9375)
BARRICK GOLD CORPORATION (ABX, 17.625) CIRCUIT CITY STR CRCT CTY GP (CC, 45.375) FLEETWOOD ENTERPRISES (FLE, 22.25)
ARMSTRONG WORLD INDS INC (ACK, 35.6875) COCA-COLA ENTERPRISES (CCE, 21.9375) FLUOR CORP (FLR, 38.5)
ALBERTO-CULVER CO -CL B (ACV, 24.1875) CROWN CORK & SEAL CO INC (CCK, 21.875) FMC CORP (FMC, 48.1875)
ADOBE SYSTEMS INC (ADBE, 75) CARNIVAL CORP (CCL, 49.5625) FORTUNE BRANDS INC (FO, 33.25)
ADC TELECOMMUNICATIONS INC (ADCT, 51) CLEAR CHANNEL COMMUNICATIONS (CCU, 85.5625) SPRINT FON GROUP (FON, 74.0625)
ARCHER-DANIELS-MIDLAND CO (ADM, 14.125) CENDANT CORP (CD, 14.5625) FRUIT OF THE LOOM LTD -CL A (FTL, 2.875)
AUTODESK INC (ADSK, 20.9375) CERIDIAN CORP (CEN, 21.8125) FOSTER WHEELER CORP (FWC, 11.125)
AETNA INC (AET, 60.625) CHAMPION INTERNATIONAL CORP (CHA, 61.9375) GILLETTE CO (G, 36)
ALLERGAN INC (AGN, 107.4375) CHEVRON CORP (CHV, 96.5625) GREAT ATLANTIC & PAC TEA CO (GAP, 26.9375)
AMERADA HESS CORP (AHC, 62.9375) COLGATE-PALMOLIVE CO (CL, 57.375) GANNETT CO (GCI, 72.1875)
AMERICAN HOME PRODUCTS CORP (AHP, 52.4375) CLOROX CO/DE (CLX, 49) GENERAL DYNAMICS CORP (GD, 53.4375)
AMERITECH CORP (AIT, 68.25) COMCAST CORP -CL A SPL (CMCSK, 46.75) GUIDANT CORP (GDT, 56)
ALCAN ALUMINIUM LTD (AL, 33.0625) CONSOLIDATED STORES CORP (CNS, 20.25) GENERAL ELECTRIC CO (GE, 141.1875)
ALLIEDSIGNAL INC (ALD, 60.8125) CONOCO INC (COC.B, 28.375) GENERAL INSTRUMENT CORP (GIC, 66.25)
ALLEGHENY TELEDYNE INC (ALT, 15.125) COLUMBIA/HCA HLTHCR -VTG (COL, 27.125) GENERAL MILLS INC (GIS, 40.3125)
AMERICAN GREETINGS -CL A (AM, 25.3125) 3COM CORP (COMS, 38.5) GREAT LAKES CHEMICAL CORP (GLK, 34.625)
APPLIED MATERIALS INC (AMAT, 110) COSTCO WHOLESALE CORP (COST, 86.0625) CORNING INC (GLW, 95.375)
ADVANCED MICRO DEVICES (AMD, 26.6875) CAMPBELL SOUP CO (CPB, 46.5) GENERAL MOTORS CORP (GM, 71.0625)
AMGEN INC (AMGN, 91.125) COMPAQ COMPUTER CORP (CPQ, 23.5625) GEORGIA-PACIFIC GROUP (GP, 42.9375)
ANDREW CORP (ANDW, 15.25) COMPUWARE CORP (CPWR, 32.75) GENUINE PARTS CO (GPC, 26.5)
AMERICA ONLINE INC (AOL, 156) CRANE CO (CR, 17.4375) GAP INC (GPS, 38.375)
APACHE CORP (APA, 43.375) CABLETRON SYSTEMS (CS, 23) GOODRICH (B F) CO (GR, 22.9375)
ANADARKO PETROLEUM CORP (APC, 35.4375) COMPUTER SCIENCES CORP (CSC, 62.125) GRACE (W R) & CO (GRA, 14.0625)
AIR PRODUCTS & CHEMICALS INC (APD, 33.625) CISCO SYSTEMS INC (CSCO, 84.75) GOODYEAR TIRE & RUBBER CO (GT, 38.5)
ASARCO INC (AR, 29.6875) CASE CORP (CSE, 54.8125) GTE CORP (GTE, 76.6875)
ATLANTIC RICHFIELD CO (ARC, 97.5) COOPER TIRE & RUBBER (CTB, 16.5) GATEWAY INC (GTW, 77.875)
ASHLAND INC (ASH, 35.6875) CENTURYTEL INC (CTL, 43.6875) GRAINGER (W W) INC (GWW, 45.4375)
ALLTEL CORP (AT, 85.625) CENTEX CORP (CTX, 28.125) HARCOURT GENERAL INC (H, 36.1875)
AUTOMATIC DATA PROCESSING (AUD, 50.6875) CUMMINS ENGINE (CUM, 42.3125) HALLIBURTON CO (HAL, 44.125)
AVON PRODUCTS (AVP, 28.8125) CVS CORP (CVS, 40.375) HASBRO INC (HAS, 23.25)
AVERY DENNISON CORP (AVY, 62) CYPRUS AMAX MINERALS CO (CYM, 19) MANOR CARE INC (HCR, 20.375)
ALLIED WASTE INDS INC (AW, 8) DANA CORP (DCN, 26.75) HOME DEPOT INC (HD, 79.9375)
ALZA CORP (AZA, 42.8125) DU PONT (E I) DE NEMOURS (DD, 62.25) HARRAHS ENTERTAINMENT INC (HET, 27.8125)
AUTOZONE INC (AZO, 29.8125) DILLARDS INC -CL A (DDS, 19.3125) HILTON HOTELS CORP (HLT, 9.3125)
BOEING CO (BA, 42.5625) DEERE & CO (DE, 39.75) HOMESTAKE MINING (HM, 8.375)
BAXTER INTERNATIONAL INC (BAX, 67.625) DELL COMPUTER CORP (DELL, 39.75) HEINZ (H J) CO (HNZ, 42.5625)
BEST BUY CO INC (BBY, 51.125) DOLLAR GENERAL (DG, 24.75) HONEYWELL INC (HON, 112.625)
BRUNSWICK CORP (BC, 23.625) DATA GENERAL CORP (DGN, 22.25) HELMERICH & PAYNE (HP, 27.4375)
BOISE CASCADE CORP (BCC, 38.8125) DAYTON HUDSON CORP (DH, 62.3125) HERCULES INC (HPC, 25.875)
BARD (C.R.) INC (BCR, 55.8125) DANAHER CORP (DHR, 51.375) BLOCK H & R INC (HRB, 49)
BLACK & DECKER CORP (BDK, 48.9375) DISNEY (WALT) COMPANY (DIS, 26) HEALTHSOUTH CORP (HRC, 5.875)
BECTON DICKINSON & CO (BDX, 29.6875) DOW JONES & CO INC (DJ, 61.625) HARRIS CORP (HRS, 20.0625)
BELL ATLANTIC CORP (BEL, 65.1875) DELUXE CORP (DLX, 25.5) HERSHEY FOODS CORP (HSY, 51.625)
BROWN-FORMAN -CL B (BF.B, 66.6875) DUN & BRADSTREET CORP (DNB, 27.75) HUMANA INC (HUM, 7.4375)
BESTFOODS (BFO, 58.25) DONNELLEY (R R) & SONS CO (DNY, 24.0625) HEWLETT-PACKARD CO (HWP, 78)
BRIGGS & STRATTON (BGG, 57) DOVER CORP (DOV, 44.5625) INTL BUSINESS MACHINES CORP (IBM, 93.25)
BAKER-HUGHES INC (BHI, 29.125) DOW CHEMICAL (DOW, 122.5) INTL FLAVORS & FRAGRANCES (IFF, 38.3125)
BALL CORP (BLL, 39.5) DELPHI AUTOMOTIVE SYS CORP (DPH, 16.25) ITT INDUSTRIES INC (IIN, 34.375)
BELLSOUTH CORP (BLS, 44.8125) DARDEN RESTAURANTS INC (DRI, 19.375) IKON OFFICE SOLUTIONS (IKN, 6.9375)
BMC SOFTWARE INC (BMCS, 69.5) ENGELHARD CORP (EC, 17.3125) INTEL CORP (INTC, 74.75)
BIOMET INC (BMET, 34.1875) ECOLAB INC (ECL, 37.625) INTL PAPER CO (IP, 54.9375)
BEMIS CO (BMS, 34.25) ELECTRONIC DATA SYSTEMS CORP (EDS, 63.4375) INTERPUBLIC GROUP OF COS (IPG, 44.5)
BRISTOL MYERS SQUIBB (BMY, 75.875) EQUIFAX INC (EFX, 26.0625) INGERSOLL-RAND CO (IR, 52)
BAUSCH & LOMB INC (BOL, 59.4375) PERKINELMER INC (EGG, 42) ILLINOIS TOOL WORKS (ITW, 67.125)
BURLINGTON RESOURCES INC (BR, 39) EASTMAN KODAK CO (EK, 66.625) JOHNSON CONTROLS INC (JCI, 58.8125)
BETHLEHEM STEEL CORP (BS, 6.375) EMC CORP/MA (EMC, 83.1875) PENNEY (J C) CO (JCP, 22.3125)
BOSTON SCIENTIFIC CORP (BSX, 21.8125) EASTMAN CHEMICAL CO (EMN, 38.875) JOHNSON & JOHNSON (JNJ, 105.625)
ANHEUSER-BUSCH COS INC (BUD, 75.3125) EMERSON ELECTRIC CO (EMR, 57.75) JOSTENS INC (JOS, 19.8125)
COMPUTER ASSOCIATES INTL INC (CA, 62.1875) EATON CORP (ETN, 79.3125) NORDSTROM INC (JWN, 22.375)
CONAGRA INC (CAG, 25.625) FORD MOTOR CO (F, 52.625) KELLOGG CO (K, 36)
Atoms, Bits, and Cash
– 23 –
KAUFMAN & BROAD HOME CORP (KBH, 25.0625) OWENS-ILLINOIS INC (OI, 24.25) SYSCO CORP (SYY, 39.75)
KLA-TENCOR CORP (KLAC, 91.1875) OMNICOM GROUP (OMC, 90.875) AT&T CORP (T, 47.3125)
K MART CORP (KM, 9.375) ORACLE CORP (ORCL, 71) TANDY CORP (TAN, 66.3125)
KIMBERLY-CLARK CORP (KMB, 68.0625) OWENS CORNING (OWC, 18.1875) TEKTRONIX INC (TEK, 32.5625)
KERR-MCGEE CORP (KMG, 60.5) OCCIDENTAL PETROLEUM CORP (OXY, 23.75) TENNECO AUTOMOTIVE INC (TEN, 7.1875)
COCA-COLA CO (KO, 59.9375) PHILLIPS PETROLEUM CO (P, 51.375) TENET HEALTHCARE CORP (THC, 24)
KROGER CO (KR, 23.1875) PAYCHEX INC (PAYX, 41.5) TEMPLE-INLAND INC (TIN, 63.75)
KNIGHT-RIDDER INC (KRI, 58.5) PITNEY BOWES INC (PBI, 49.8125) TJX COMPANIES INC (TJX, 22.9375)
KOHLS CORP (KSS, 71.9375) PEP BOYS-MANNY MOE & JACK (PBY, 9.75) TIMKEN CO (TKR, 19)
KING WORLD PRODUCTIONS INC (KWP, 42.25) PACCAR INC (PCAR, 42.25) TELLABS INC (TLAB, 73.625)
LONGS DRUG STORES INC (LDG, 27) POTLATCH CORP (PCH, 44.125) TIMES MIRROR COMPANY -SER A (TMC, 67.8125)
LAIDLAW INC (LDW, 5.8125) SPRINT PCS GROUP (PCS, 89.6875) THERMO ELECTRON CORP (TMO, 13.6875)
LIZ CLAIBORNE INC (LIZ, 38.375) PHELPS DODGE CORP (PD, 54.625) THOMAS & BETTS CORP (TNB, 44.8125)
LILLY (ELI) & CO (LLY, 75.0625) PLACER DOME INC (PDG, 11.75) TOYS R US INC (TOY, 17.75)
LOCKHEED MARTIN CORP (LMT, 19.25) PE CORP (PEB, 80.5625) TRIBUNE CO (TRB, 53.5)
LOWES COS (LOW, 55) PEPSICO INC (PEP, 34.125) TRW INC (TRW, 52.625)
LOUISIANA-PACIFIC CORP (LPX, 12.8125) PFIZER INC (PFE, 33.8125) TUPPERWARE CORP (TUP, 18.875)
LSI LOGIC CORP (LSI, 61.75) PROCTER & GAMBLE CO (PG, 109) TIME WARNER INC (TWX, 67.5)
LIMITED INC (LTD, 38.6875) PARKER-HANNIFIN CORP (PH, 47.875) TEXACO INC (TX, 65.375)
LUCENT TECHNOLOGIES INC (LU, 76.75) PIONEER HI-BRED INTERNATIONL (PHB, 39.9375) TEXAS INSTRUMENTS INC (TXN, 94.9375)
LEXMARK INTL GRP INC -CL A (LXK, 78.625) PULTE CORP (PHM, 21.5625) TEXTRON INC (TXT, 73.5)
MARRIOTT INTL INC (MAR, 33.5) PALL CORP (PLL, 24.3125) TYCO INTERNATIONAL LTD (TYC, 44.25)
MASCO CORP (MAS, 28.75) PARAMETRIC TECHNOLOGY CORP (PMTC, 22) UNOCAL CORP (UCL, 35.3125)
MATTEL INC (MAT, 13.4375) PHARMACIA & UPJOHN INC (PNU, 58.75) UNISYS CORP (UIS, 24.6875)
MAY DEPARTMENT STORES CO (MAY, 32.25) PPG INDUSTRIES INC (PPG, 60.5) UNION CARBIDE CORP (UK, 61.5625)
MCDONALDS CORP (MCD, 46.125) POLAROID CORP (PRD, 19.9375) MEDIAONE GROUP INC (UMG, 71.125)
MCKESSON HBOC INC (MCK, 23.5) PEOPLESOFT INC (PSFT, 18.5) UNILEVER N V -NY SHARES (UN, 56.1875)
MEREDITH CORP (MDP, 39.625) PRAXAIR INC (PX, 47.9375) UNITED HEALTHCARE CORP (UNH, 56.375)
MCDERMOTT INTL INC (MDR, 9.6875) QUALCOMM INC (QCOM, 342.875) UNION PACIFIC RESOURCES GRP (UPR, 15.875)
MEDTRONIC INC (MDT, 39) RITE AID CORP (RAD, 6.625) UST INC (UST, 26.875)
MEAD CORP (MEA, 39.1875) RALSTON PURINA CO (RAL, 31.3125) U S WEST INC (USW, 65.125)
MCGRAW-HILL COMPANIES (MHP, 59.375) REEBOK INTERNATIONAL LTD (RBK, 9) UNITED TECHNOLOGIES CORP (UTX, 56.375)
MILLIPORE CORP (MIL, 34.3125) ROYAL DUTCH PET -NY REG (RD, 64.6875) VF CORP (VFC, 30)
MIRAGE RESORTS INC (MIR, 12.5) ROWAN COS INC (RDC, 18.4375) VIACOM INC -CL B (VIA.B, 52.75)
MALLINCKRODT INC (MKG, 35.375) COORS (ADOLPH) -CL B (RKY, 52.125) VULCAN MATERIALS CO (VMC, 42.4375)
MINNESOTA MINING & MFG CO (MMM, 101.5) REYNOLDS METALS CO (RLM, 61.625) SEAGRAM CO LTD (VO, 44.3125)
PHILIP MORRIS COS INC (MO, 25.9375) RUSSELL CORP (RML, 13.9375) WESTVACO CORP (W, 31.875)
MOBIL CORP (MOB, 105.3125) ROHM & HAAS CO (ROH, 37.375) WALGREEN CO (WAG, 28.75)
MOTOROLA INC (MOT, 119) ROCKWELL INTL CORP (ROK, 47.1875) MCI WORLDCOM INC (WCOM, 88.5)
MERCK & CO (MRK, 77.25) RAYTHEON CO -CL B (RTN.B, 31.375) WENDY’S INTERNATIONAL INC (WEN, 23.75)
USX-MARATHON GROUP (MRO, 29.8125) IMS HEALTH INC (RX, 26.875) WHIRLPOOL CORP (WHR, 65.4375)
MICROSOFT CORP (MSFT, 85) SEARS ROEBUCK & CO (S, 31.3125) WINN-DIXIE STORES INC (WIN, 28.1875)
MONSANTO CO (MTC, 45.5625) SBC COMMUNICATIONS INC (SBC, 51.625) WARNER-LAMBERT CO (WLA, 88.6875)
MICRON TECHNOLOGY INC (MU, 63.625) SEALED AIR CORP (SEE, 52.4375) WILLAMETTE INDUSTRIES (WLL, 45.6875)
MAYTAG CORP (MYG, 45.625) SEAGATE TECHNOLOGY (SEG, 35.9375) WELLPOINT HLTH NETWRK -CL A (WLP, 66.875)
MILACRON INC (MZ, 15.1875) SCIENTIFIC-ATLANTA INC (SFA, 57.5625) WASTE MANAGEMENT INC (WMI, 16.1875)
INCO LTD (N, 19.5) SILICON GRAPHICS INC (SGI, 8.3125) WAL-MART STORES (WMT, 58.875)
NAVISTAR INTERNATIONL (NAV, 38) SCHERING-PLOUGH (SGP, 56.875) WATSON PHARMACEUTICALS INC (WPI, 37.3125)
NACCO INDUSTRIES -CL A (NC, 48) SHERWIN-WILLIAMS CO (SHW, 21.375) WORTHINGTON INDUSTRIES (WTHG, 15.6875)
NEWMONT MINING CORP (NEM, 21.9375) SIGMA-ALDRICH (SIAL, 28.3125) WRIGLEY (WM) JR CO (WWY, 84.1875)
NABISCO GROUP HLDGS CORP (NGH, 12) SCHLUMBERGER LTD (SLB, 68.8125) WEYERHAEUSER CO (WY, 62.4375)
NIKE INC -CL B (NKE, 44.25) SARA LEE CORP (SLE, 26) USX-U S STEEL GROUP (X, 24.625)
NORTHROP GRUMMAN CORP (NOC, 55.375) SOLECTRON CORP (SLR, 85.5) EXXON CORP (XON, 80.25)
NOVELL INC (NOVL, 23) SPRINGS INDUSTRIES -CL A (SMI, 40.125) XEROX CORP (XRX, 24.875)
NATIONAL SERVICE INDS INC (NSI, 31.8125) SHARED MEDICAL SYSTEMS CORP (SMS, 40.625) TRICON GLOBAL RESTAURANTS (YUM, 42.3125)
NATIONAL SEMICONDUCTOR CORP (NSM, 35.8125) SNAP-ON INC (SNA, 30.75)
NORTEL NETWORKS CORP (NT, 74.9375) STAPLES INC (SPLS, 24.25)
NETWORK APPLIANCE INC (NTAP, 124) SERVICE CORP INTERNATIONAL (SRV, 7.75)
NUCOR CORP (NUE, 49.6875) ST JUDE MEDICAL INC (STJ, 29.1875)
NEWELL RUBBERMAID INC (NWL, 36.5) SUNOCO INC (SUN, 27)
NEXTEL COMMUNICATIONS (NXTL, 97.25) SUN MICROSYSTEMS INC (SUNW, 124.9375)
NEW YORK TIMES CO -CL A (NYT, 39) SUPERVALU INC (SVU, 21.3125)
QUAKER OATS CO (OAT, 69.875) STANLEY WORKS (SWK, 32.6875)
OFFICE DEPOT INC (ODP, 12.625) SAFEWAY INC (SWY, 38.1875)

Atoms, Bits, and Cash
– 24 –
Appendix A
Operating return on assets is skewed by numerous other accounting distortions.The most relevant are listed below.
• Restructurings occur when a company makes a fundamental change in itsbusiness strategy, operations, or structure, resulting in provisions for ex-pected losses.29 This provisional charge has three effects. First, it reducesdepreciation and/or amortization expense, helping operating margins. Sec-ond, it boosts future reported earnings by recognizing future expenses in thecurrent period. Finally, it shrinks the asset base, enhancing returns. Restruc-turing charges have become more and more prevalent. Warren Buffett re-cently said, “I believe that the behavior of managements has been...worsewhen it comes to restructurings and merger accounting...many CEOs thinkthis kind of manipulation is not only okay, but actually their duty.” 30
• As the source of value has shifted, employees have become more and morevaluable. Increasingly, the way to attract and motivate employees is throughemployee stock options (giving them “a piece of the action”) 31. Although cashcompensation is expensed, most employee stock options are not. Recogniz-ing employee stock options as an expense serves to reduce operating profitsand depress computed returns.
Current accounting convention views research, development, software, and in-formation technology spending as costs—which are expensed on the incomestatement—rather than as investments in future growth—which are capitalized onthe balance sheet. This convention has caused a material understatement both ofthe reported asset base and earnings. The impact is significant. To put it in per-spective, consider that U.S. companies spent $212 billion on information technol-ogy in 1996 alone.32
Atoms, Bits, and Cash
– 25 –
Appendix B
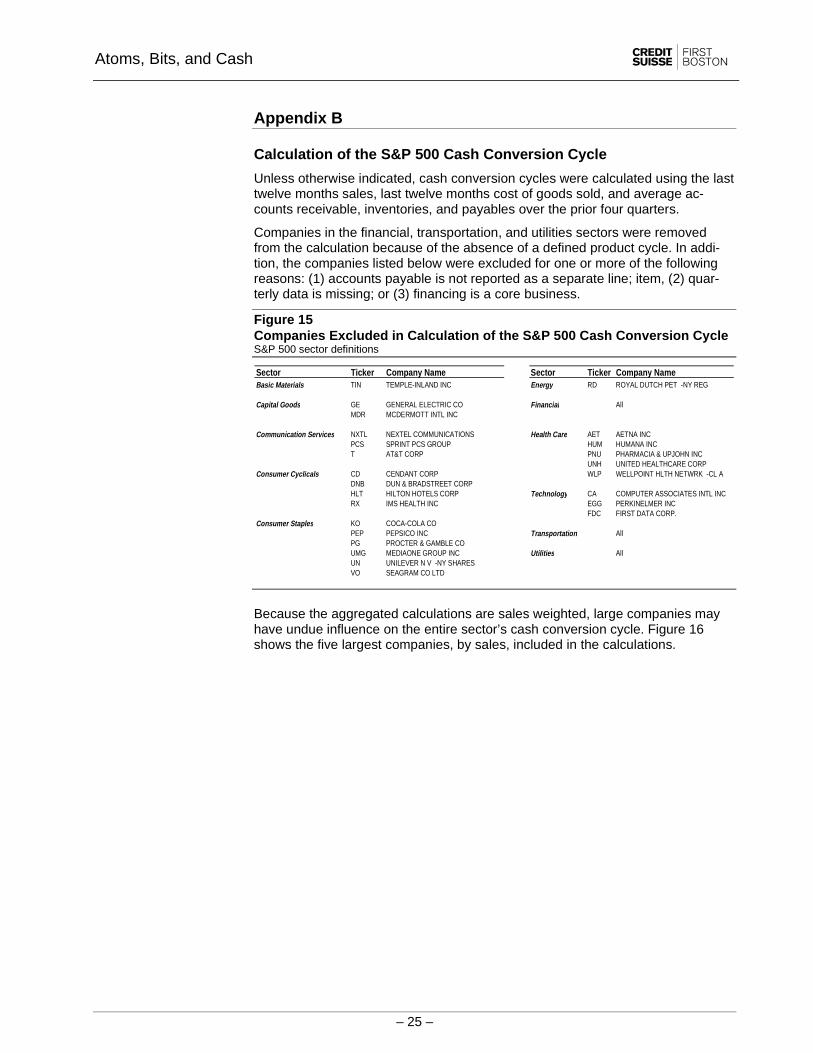
Calculation of the S&P 500 Cash Conversion Cycle
Unless otherwise indicated, cash conversion cycles were calculated using the lasttwelve months sales, last twelve months cost of goods sold, and average ac-counts receivable, inventories, and payables over the prior four quarters.
Companies in the financial, transportation, and utilities sectors were removedfrom the calculation because of the absence of a defined product cycle. In addi-tion, the companies listed below were excluded for one or more of the followingreasons: (1) accounts payable is not reported as a separate line; item, (2) quar-terly data is missing; or (3) financing is a core business.
Figure 15Companies Excluded in Calculation of the S&P 500 Cash Conversion CycleS&P 500 sector definitions
Sector Ticker Company Name Sector Ticker Company NameBasic Materials TIN TEMPLE-INLAND INC Energy RD ROYAL DUTCH PET -NY REG
Capital Goods GE GENERAL ELECTRIC CO Financial AllMDR MCDERMOTT INTL INC
Communication Services NXTL NEXTEL COMMUNICATIONS Health Care AET AETNA INCPCS SPRINT PCS GROUP HUM HUMANA INCT AT&T CORP PNU PHARMACIA & UPJOHN INC
UNH UNITED HEALTHCARE CORPConsumer Cyclicals CD CENDANT CORP WLP WELLPOINT HLTH NETWRK -CL A
DNB DUN & BRADSTREET CORPHLT HILTON HOTELS CORP Technology CA COMPUTER ASSOCIATES INTL INCRX IMS HEALTH INC EGG PERKINELMER INC
FDC FIRST DATA CORP.Consumer Staples KO COCA-COLA CO
PEP PEPSICO INC Transportation AllPG PROCTER & GAMBLE COUMG MEDIAONE GROUP INC Utilities AllUN UNILEVER N V -NY SHARESVO SEAGRAM CO LTD
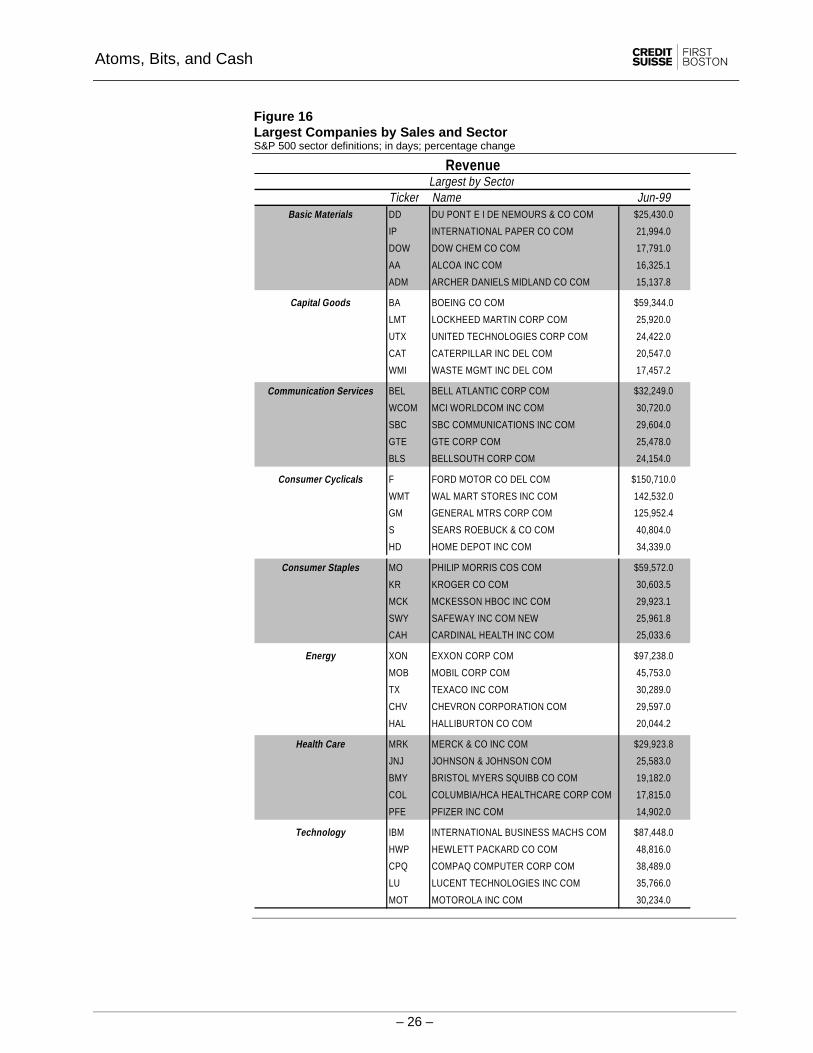
Because the aggregated calculations are sales weighted, large companies mayhave undue influence on the entire sector’s cash conversion cycle. Figure 16shows the five largest companies, by sales, included in the calculations.
Atoms, Bits, and Cash
– 26 –
Figure 16Largest Companies by Sales and SectorS&P 500 sector definitions; in days; percentage change
Ticker Name Jun-99Basic Materials DD DU PONT E I DE NEMOURS & CO COM $25,430.0
IP INTERNATIONAL PAPER CO COM 21,994.0
DOW DOW CHEM CO COM 17,791.0
AA ALCOA INC COM 16,325.1
ADM ARCHER DANIELS MIDLAND CO COM 15,137.8
Capital Goods BA BOEING CO COM $59,344.0
LMT LOCKHEED MARTIN CORP COM 25,920.0
UTX UNITED TECHNOLOGIES CORP COM 24,422.0
CAT CATERPILLAR INC DEL COM 20,547.0
WMI WASTE MGMT INC DEL COM 17,457.2
Communication Services BEL BELL ATLANTIC CORP COM $32,249.0
WCOM MCI WORLDCOM INC COM 30,720.0
SBC SBC COMMUNICATIONS INC COM 29,604.0
GTE GTE CORP COM 25,478.0
BLS BELLSOUTH CORP COM 24,154.0
Consumer Cyclicals F FORD MOTOR CO DEL COM $150,710.0
WMT WAL MART STORES INC COM 142,532.0
GM GENERAL MTRS CORP COM 125,952.4
S SEARS ROEBUCK & CO COM 40,804.0
HD HOME DEPOT INC COM 34,339.0
Consumer Staples MO PHILIP MORRIS COS COM $59,572.0
KR KROGER CO COM 30,603.5
MCK MCKESSON HBOC INC COM 29,923.1
SWY SAFEWAY INC COM NEW 25,961.8
CAH CARDINAL HEALTH INC COM 25,033.6
Energy XON EXXON CORP COM $97,238.0
MOB MOBIL CORP COM 45,753.0
TX TEXACO INC COM 30,289.0
CHV CHEVRON CORPORATION COM 29,597.0
HAL HALLIBURTON CO COM 20,044.2
Health Care MRK MERCK & CO INC COM $29,923.8
JNJ JOHNSON & JOHNSON COM 25,583.0
BMY BRISTOL MYERS SQUIBB CO COM 19,182.0
COL COLUMBIA/HCA HEALTHCARE CORP COM 17,815.0
PFE PFIZER INC COM 14,902.0
Technology IBM INTERNATIONAL BUSINESS MACHS COM $87,448.0
HWP HEWLETT PACKARD CO COM 48,816.0
CPQ COMPAQ COMPUTER CORP COM 38,489.0
LU LUCENT TECHNOLOGIES INC COM 35,766.0
MOT MOTOROLA INC COM 30,234.0
RevenueLargest by Sector
Atoms, Bits, and Cash
– 27 –
1 Interview with Walter Wriston, quoted in Thomas A. Stewart, “Brainpower,” Fortune, June 3, 1991.2 See Intellectual Capital by Thomas A. Stewart, Doubleday, 1997.3 http://www.bog.frb.fed.us/BOARDDOCS/SPEECHES/19961016.htm.4 See The Weightless World by Diane Coyle, Capstone Publishing, 1997.5 This example is taken from Intellectual Capital by Thomas A. Stewart, Doubleday, 1997.6 See New Rules for the New Economy by Kevin Kelly, Penguin Books, 1998.7 See Myths of Rich and Poor by W. Michael Cox and Richard Alm.8 http://www.intel.com/intel/museum/25anniv/hof/moore.htm.
9 http://www.seas.upenn.edu/~gaj1/wireless.html.10 See Unleashing the Killer App by Larry Downes and Chunka Mui, Harvard Business School Press, 1998.11 This is a commonly used measure of the productivity of assets.12 See Financial Statement Analysis by Leopold Bernstein and John Wild, McGraw-Hill, 1998.13 Warren Buffett, Berkshire Hathaway Annual Report 1998.14 See Appendix A.15 Purchase accounting assumes that one company uses its economic resources to acquire another, and thus net assets acquired arerecorded at their fair value purchase price. In a purchase of net assets, this is exactly what happens: the net assets purchased from theselling entity are recorded on the acquirer’s books at fair value. Any premium over and above fair value is goodwill. While part of thegap between book value and price is allocated to the target’s identifiable net assets to bring them up to fair value, the largest portion (upto 90% in some acquisitions) is assigned to goodwill.
Pooling accounting merges two firms using the existing recorded book values of their net assets. There is no adjustment to fair valuebecause the underlying assumption is that there has not been an exchange of economic resources, but rather a combining of equityinterests.16 See “Let’s Make a Deal” by Michael Mauboussin and Bob Hiler, Credit Suisse First Boston, April 27, 1998.17
Assumes net working capital and net PPE remained at the same percentage of sales as in 1990 in each subsequent year. This figureis the nominal sum of the incremental difference between implied and actual net working capital and net PPE.18
See “What Is the Right Supply Chain for Your Product?” by Marshall Fisher, Harvard Business Review, March-April 1997.19 See “A Cash Conversion Cycle Approach to Liquidity Analysis” by Verylyn D. Richards and Eugen J. Laughlin, FinancialManagement, Spring 1980, 32-38.20 DSO = Days in the year (360) / (Sales / Average accounts receivable).21 DII = Days in the year (360) / (Cost of goods sold / Average inventory).22 DPO = Days in the year (360) / (Cost of goods sold / Average accounts payables).23
Product financing costs amounted to more than 4% of GDP in 1998. See “Combining Logistics with Financing for EnhancedProfitability” by Richard Palmieri and Jon Africk, Credit Suisse First Boston at http://palmieri.ascet.com.24
See Essentials of Managerial Finance, 5th ed. by J. Fred Weston and Eugene F. Brigham, The Dryden Press, 1979.25
Jay Fitzsimmons, Wal-mart senior vice-president, quoted in The Wall Street Journal, November 10, 1999.26
See Appendix B for methodology.27
See Intellectual Capital by Thomas A. Stewart, Doubleday, 1997.28
See “Thomas Meredith” by Stephen Barr, CFO Magazine, September 1998.29
There are two main types of restructuring charges:
1. Costs associated with terminated employees or assets no longer being used—termination benefits, facility closure costs, operatingleases, lease termination costs, excess lease costs, losses on planned disposals of assets, and certain contractual obligations.
2. Costs associated with retained employees or assets—employee relocation, temporarily idled facilities, equipment relocation,training and retraining, business re-engineering, information systems enhancements, inventory write-downs, and assetimpairments.
Source: Financial Accounting Standards Board, Emerging Issues Task Force No. 94-3, February 21, 1994.30 Warren Buffett, Berkshire Hathaway Annual Report 1998.31 See “A Piece of the Action” by Michael Mauboussin and Bob Hiler, Credit Suisse First Boston, November 2, 1998.32 See New Rules for the New Economy by Kevin Kelly, Penguin Books, 1998.

Copyright 1999 Credit Suisse First Boston Corporation 1999. All rights reserved
This report is provided to you solely for informational purposes and does not constitute an offer or solicitation of an offer, or any advice or recommendation, to purchase anysecurities or other financial instruments and may not be construed as such. This report may not be reproduced or redistributed to any other person, in whole or in part, withoutthe prior written consent of the distributor listed below. The information set forth herein has been obtained or derived from sources believed by Credit Suisse First BostonCorporation and its affiliates (“CSFB” or “the firm”) to be reliable, but CSFB does not make any representation or warranty, express or implied, as to its accuracy or complete-ness.
Past performance should not be taken as an indication or guarantee of future performance, and no representation or warranty, express or implied is made regarding futureperformance. Opinions and estimates may be changed without notice. The firm, or one or more of its partners or employees, from time to time may have long or short posi-tions in, or buy and sell and make markets in, any of the securities discussed herein. The firm may underwrite or provide investment banking, credit and other financial serv-ices to any company or issuer of securities or financial instruments referred to herein. If CSFB makes a market in any security, there can be no assurance that CSFB willcontinue to do so. Additional information is available upon request.
CSFB may have issued other reports that are inconsistent with, and reach different conclusions from, the information presented herein. Those reports reflect the differentassumptions, views and analytical methods of the analysts who prepared them.
This report is being distributed in the United States by CSFB, and in Canada by Credit Suisse First Boston Securities Canada, Inc. (“CSFBSC”) with CSFB as mailing/deliveryagent. In jurisdictions where CSFB is not registered or licensed to trade in securities, any trade will be made only in accordance with applicable securities legislation which willvary from jurisdiction to jurisdiction and may require that the trade be made in accordance with applicable exemptions from registration or licensing requirements. CSFBSChas approved the distribution of this memorandum. Any U.S. customer wishing to effect a transaction in any security should do so only by contacting a representative at CreditSuisse First Boston Corporation, Eleven Madison Avenue, New York, NY 10010 (212) 325-2000. ni4127.doc
AmericasEleven Madison AvenueNew York, NY 10010, U.S.A.1 212 325 2000
Atlanta 1 404 656 9500 Mexico City 1 525 202 6000Baltimore 1 410 223 3000 Pasadena 1 626 395 5100Boston 1 617 556 5500 Philadelphia 1 215 851 1000Buenos Aires 1 541 394 3100 San Francisco 1 415 836 7600Chicago 1 312 750 3000 São Paulo 55 11 822 4862Houston 1 713 220 6700 Toronto 1 416 352 4500
EuropeOne Cabot SquareLondon E14 4QJ, England44 171 888 8888
Amsterdam 31 20 575 4890 Paris 33 1 40 76 8888Budapest 36 1 202 2188 Prague 42 2 248 10937Frankfurt 49 69 75380 Vienna 43 1 512 3023Geneva 41 22 707 0130 Warsaw 48 22 695 0050Madrid 34 91 532 0303 Zug 41 41 726 1020Milan 39 02 7702 1 Zurich 41 1 335 7711Moscow 7 501 967 8200
Asia PacificThree Exchange Square8 Connaught PlaceCentral, Hong Kong852 2101 6000
Auckland 64 9 302 5500 Shanghai 86 21 6219 0808Beijing 86 10 6410 6611 Singapore 65 538 6322Melbourne 61 3 9 280 1666 Sydney 61 2 9394 4400Mumbai 91 22 284 6888 Taipei 8862 2718 5919Osaka 81 6 243 0789 Tokyo 81 3 5404 9000Seoul 82 2 3707 3700 Wellington 64 4 474 4400

Copyright 1999 Credit Suisse First Boston Corporation 1999. All rights reserved
This report is provided to you solely for informational purposes and does not constitute an offer or solicitation of an offer, or any advice or recommendation, to purchase anysecurities or other financial instruments and may not be construed as such. This report may not be reproduced or redistributed to any other person, in whole or in part, withoutthe prior written consent of the distributor listed below. The information set forth herein has been obtained or derived from sources believed by Credit Suisse First BostonCorporation and its affiliates (“CSFB” or “the firm”) to be reliable, but CSFB does not make any representation or warranty, express or implied, as to its accuracy or complete-ness.
Past performance should not be taken as an indication or guarantee of future performance, and no representation or warranty, express or implied is made regarding futureperformance. Opinions and estimates may be changed without notice. The firm, or one or more of its partners or employees, from time to time may have long or short posi-tions in, or buy and sell and make markets in, any of the securities discussed herein. The firm may underwrite or provide investment banking, credit and other financial serv-ices to any company or issuer of securities or financial instruments referred to herein. If CSFB makes a market in any security, there can be no assurance that CSFB willcontinue to do so. Additional information is available upon request.
CSFB may have issued other reports that are inconsistent with, and reach different conclusions from, the information presented herein. Those reports reflect the differentassumptions, views and analytical methods of the analysts who prepared them.
This report is being distributed in the United States by CSFB, and in Canada by Credit Suisse First Boston Securities Canada, Inc. (“CSFBSC”) with CSFB as mailing/deliveryagent. In jurisdictions where CSFB is not registered or licensed to trade in securities, any trade will be made only in accordance with applicable securities legislation which willvary from jurisdiction to jurisdiction and may require that the trade be made in accordance with applicable exemptions from registration or licensing requirements. CSFBSChas approved the distribution of this memorandum. Any U.S. customer wishing to effect a transaction in any security should do so only by contacting a representative at CreditSuisse First Boston Corporation, Eleven Madison Avenue, New York, NY 10010 (212) 325-2000. ni4127.doc