atlantic county special services school ... legal debt margin information n/a demographic &...
TRANSCRIPT

COMPREHENSIVE ANNUAL FINANCIAL REPORT
County of AtlanticMays Landing, New Jersey
ATLANTIC COUNTY SPECIAL SERVICES
FOR THE FISCAL YEAR ENDED JUNE 30, 2015
SCHOOL DISTRICT


ATLANTIC COUNTY SPECIAL SERVICES SCHOOL DISTRICT
FOR THE FISCAL YEAR ENDED JUNE 30, 2015
Business Office –Lisa Mooney, Business Administrator/Board Secretary
Prepared by
COMPREHENSIVE ANNUAL FINANCIAL REPORT
OF THE
MAYS LANDING, NEW JERSEY


PAGE
Letter of Transmittal 1Organizational Chart 5Roster of Officials 7Consultants and Advisors 9
Independent Auditors' Report 13
Management's Discussion & Analysis 19
A. Government-Wide Financial Statements:A-1 Statement of Net Position 31A-2 Statement of Activities 32
B. Fund Financial Statements:Governmental Funds:
B-1 Balance Sheet 37B-2 Statement of Revenues, Expenditures & Changes in Fund Balance 38B-3 Reconciliation of the Statement of Revenues, Expenditures & Changes in Fund
Balance of Governmental Funds to the Statement of Activities 39Proprietary Funds:
B-4 Statement of Net Position 43B-5 Statement of Revenues, Expenditures & Changes in Fund Net Position 44B-6 Statement of Cash Flows 45
Fiduciary Funds:B-7 Statement of Fiduciary Net Position 49B-8 Statement of Changes in Fiduciary Net Position 50
Notes to Financial Statements 53
C. Budgetary Comparison Schedules:C-1 Budgetary Comparison Schedule - General Fund 87C-2 Budgetary Comparison Schedule - Special Revenue Fund 92
Notes to the Required Supplementary Information:C-3 Budget-to-GAAP Reconciliation 95
INTRODUCTORY SECTION
FINANCIAL SECTION
OUTLINE OF CAFR - GASB #34
REQUIRED SUPPLEMENTARY INFORMATION - PART II
REQUIRED SUPPLEMENTARY INFORMATION - PART I
BASIC FINANCIAL STATEMENTS

PAGE
OUTLINE OF CAFR - GASB #34
L. Schedules Related to Accounting and Reporting for Pensions (GASB 68)L-1 Schedule of the District's Proportionate Share of the Net Pension Liability - PERS 99L-2 Schedule of District Contributions - PERS 100L-3 Schedule of the District's Proportionate Share of the Net Pension Liability - TPAF 101
Notes to the Required Supplementary Information 105
D. School Based Budget Schedules Fund:D-1 Combining Balance Sheet N/AD-2 Blended Resource Fund - Schedule of Expenditures Allocated by Resource
Type - Actual N/AD-3 Blended Resource Fund - Schedule of Blended Expenditures - Budget & Actual N/A
E. Special Revenue Fund:E-1 Combining Schedule of Revenues & Expenditures - Special Revenue Fund - 113
Budgetary BasisE-2 Preschool Education Aid Schedule(s) of Expenditures - Budgetary Basis N/A
F. Capital Projects Fund:F-1 Summary Statement of Project Expenditures 117F-2 Summary Schedule of Revenues, Expenditures and Changes in Fund Balance -
Budgetary Basis 118F-2a Schedule of Revenues, Expenditures, Project Balance & Project Status -
Budgetary Basis 119
G. Proprietary Funds:Enterprise Funds:
G-1 Combining Statement of Net Position 125G-2 Combining Statement of Revenues, Expenses & Changes in Fund Net Position 126G-3 Combining Statement of Cash Flows 127
Internal Service Funds:G-4 Combining Statement of Net Position N/AG-5 Combining Statement of Revenues, Expenses & Changes in Fund Net Position N/AG-6 Combining Statement of Cash Flows N/A
H. Fiduciary Funds:H-1 Combining Statement of Fiduciary Net Position 133H-2 Combining Statement of Changes in Fiduciary Net Position 134H-3 Student Activity Agency Fund Schedule of Receipts & Disbursements 135H-4 Payroll Agency Fund Schedule of Receipts & Disbursements 135
I. Long-Term Debt:I-1 Schedule of Serial Bonds N/AI-2 Schedule of Obligations Under Capital Leases N/AI-3 Debt Service Fund Budgetary Comparison Schedule N/A
REQUIRED SUPPLEMENTARY INFORMATION - PART III
OTHER SUPPLEMENTARY INFORMATION
PAGE
OUTLINE OF CAFR - GASB #34
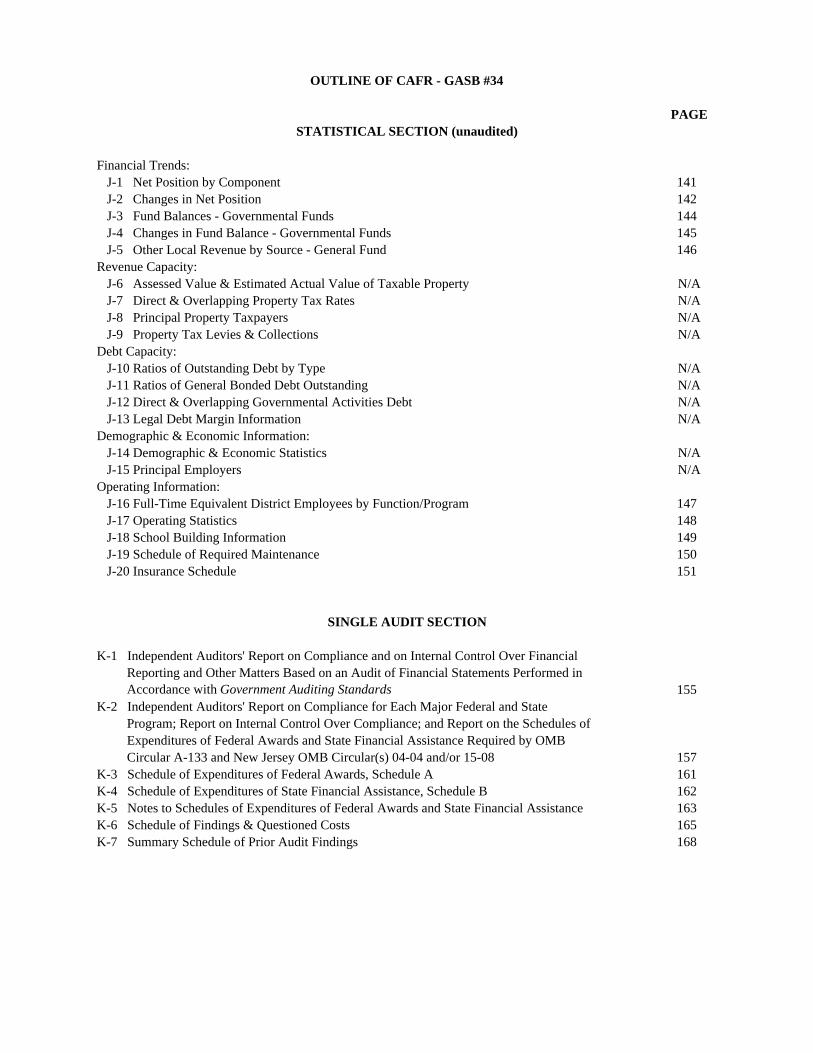
Financial Trends:J-1 Net Position by Component 141J-2 Changes in Net Position 142J-3 Fund Balances - Governmental Funds 144J-4 Changes in Fund Balance - Governmental Funds 145J-5 Other Local Revenue by Source - General Fund 146
Revenue Capacity:J-6 Assessed Value & Estimated Actual Value of Taxable Property N/AJ-7 Direct & Overlapping Property Tax Rates N/AJ-8 Principal Property Taxpayers N/AJ-9 Property Tax Levies & Collections N/A
Debt Capacity:J-10 Ratios of Outstanding Debt by Type N/AJ-11 Ratios of General Bonded Debt Outstanding N/AJ-12 Direct & Overlapping Governmental Activities Debt N/AJ-13 Legal Debt Margin Information N/A
Demographic & Economic Information:J-14 Demographic & Economic Statistics N/AJ-15 Principal Employers N/A
Operating Information:J-16 Full-Time Equivalent District Employees by Function/Program 147J-17 Operating Statistics 148J-18 School Building Information 149J-19 Schedule of Required Maintenance 150J-20 Insurance Schedule 151
K-1 Independent Auditors' Report on Compliance and on Internal Control Over Financial Reporting and Other Matters Based on an Audit of Financial Statements Performed in Accordance with Government Auditing Standards 155
K-2 Independent Auditors' Report on Compliance for Each Major Federal and State Program; Report on Internal Control Over Compliance; and Report on the Schedules of Expenditures of Federal Awards and State Financial Assistance Required by OMB Circular A-133 and New Jersey OMB Circular(s) 04-04 and/or 15-08 157
K-3 Schedule of Expenditures of Federal Awards, Schedule A 161K-4 Schedule of Expenditures of State Financial Assistance, Schedule B 162K-5 Notes to Schedules of Expenditures of Federal Awards and State Financial Assistance 163K-6 Schedule of Findings & Questioned Costs 165K-7 Summary Schedule of Prior Audit Findings 168
SINGLE AUDIT SECTION
STATISTICAL SECTION (unaudited)

This page intentionally left blank.

INTRODUCTORY SECTION

This page intentionally left blank.

December 8, 2015 Honorable President and Members of the Board of Education Atlantic County Special Services School District Mays Landing, New Jersey Dear Board Members and Constituents of Atlantic County Special Services School District: The comprehensive annual financial report of the Atlantic County Special Services School District (District) for the fiscal year ended June 30, 2015, is hereby submitted. Responsibility for both the accuracy of the data and completeness and fairness of the presentation, including all disclosures, rests with the management of the Board of Education (Board). To the best of our knowledge and belief, the data presented in this report is accurate in all material respects and is reported in a manner designed to present fairly the financial position and results of operations of the various funds and account groups of the District. All disclosures necessary to enable the reader to gain an understanding of the District's financial activities have been included. The comprehensive annual financial report is presented in four sections: introductory, financial, statistical and single audit. The introductory section includes this transmittal letter, the District's organizational chart and a list of principal officials. The financial section includes the basic financial statements, required supplemental information, and other supplementary information, as well as the auditor's report thereon. The statistical section includes selected financial and demographic information, generally presented on a multi-year basis. The District is required to undergo an annual single audit in conformity with the provisions of the Single Audit Act of 1984, OMB Circular A-133 Audits of States, Local Governments, and Non-Profit Organizations, and State Treasury Circular(s) 04-04 and/or 15-08 OMB, Single Audit Policy for Recipients of Federal Grants, State Grants and State Aid. Information related to this single audit, including the auditor's report on the internal control structure and compliance with applicable laws and regulations and findings and recommendations, are included in the single audit section of this report. 1) REPORTING ENTITY AND ITS SERVICES: The District is a component unit of the County of Atlantic within the criteria set forth in Section 2100 of the GASB Codification of Governmental Accounting and Financial Reporting Standards. All funds and account groups of the District are included in this report. The Board of Education of the Special Services School District and the Vocational School District of the County of Atlantic, a component unit of the County of Atlantic, constitutes the District's reporting entity. The mission of the Atlantic County Special Services School District is to provide innovative
1

educational programs and related services for students with special needs ages 3 to 21 who meet eligibility requirements. This is accomplished by offering specialized, individualized instruction aligned with the New Jersey Core Curriculum Content and Common Core State Standards to meet academic, vocational, functional, physical, and emotional student needs. Essential programs are developed in collaboration with educational and human services agencies by planning, coordinating, assisting and/or implementing countywide programs as appropriate. In addition to a wide range of on-site and off-campus programs for enrolled students, the Board of Education offers itinerant shared services including occupational therapy, physical therapy, speech/language therapy, counseling, behavioral consultation, nursing services, homebound instruction, and child study team evaluation/services to students in Local Educational Agencies. An educational component and nursing services are provided to youths housed at the Harborfields juvenile detention facility, and the district is sub-contracted by the County to provide county-wide Special Child Health Services case management services. 2) ECONOMIC CONDITION AND OUTLOOK: The economic environment in New Jersey continues to have a major impact on the state’s educational system, given budget cuts made in previous school years and additional budget restrictions currently in place. Although our district does not directly receive state aid or stimulus funds, the cuts to sending districts have had an impact on our budget planning, particularly in light of decreased student enrollment. The district continues to experience declining enrollment. We will continue to closely monitor actual student enrollment numbers, modify spending as needed, and gather data in order to effectively and realistically project tuition revenues for the 2015/2016 budget. Atlantic County continues to recover from Superstorm Sandy; however the closing of three casinos and the bankruptcy filing of one casino in Atlantic City is going to have a negative impact on the economy in Atlantic County with over 8,000 residents unemployed as a result of the casino closings. A new Call Center Company has begun operations in Atlantic City which is expected to bring economic growth to the area. The third phase of development at the Walk in Atlantic City was completed with the opening of the Bass Pro Shop. The county’s unemployment rate has dropped but the decline is largely believed to be a result of resident’s relocating to other areas. Housing foreclosure rates continue to exceed national averages. 3) MAJOR INITIATIVES: We continue to provide feedback to our staff in accordance with Achieve NJ teacher evaluation mandates. Our Student Growth Objectives (SGOs) have become more rigorous in year two of the mandate, and we have been granted a waiver to conduct two long evaluations for tenured teachers rather than three short evaluations. We are continuing to use the Danielson Framework for Teaching and the Multidimensional Principal Performance Rubric (MPPR). Ongoing costs for training, materials, and computer-based evaluation programs will be built into the annual budget. In response to identified needs from our sending districts, and the ongoing state Department of Education initiative to share services, we will continue to offer itinerant/shared services to Local Educational Agencies. We also have a Behavior Disabilities program for High School aged students. Comprehensive professional learning activities, including Non-Violent Crisis Intervention (NVCI) training and the Olweus bullying prevention program, serve to provide consistent
2

frameworks within which to address significant behavior issues and facilitate the development of pro-social skills. Policies, procedures and investigations are implemented as required to comply with state Harassment, Intimidation and Bullying (HIB) mandates. Our School to Work Career Exploration program continues to offer students with disabilities in Atlantic County the opportunity to receive real-life, meaningful work experiences in their home communities. This year we have expanded our Career Exploration program to include Student Internships. Our Community-based Partners include the Harrah’s family of casinos, Atlantic City Regional Medical Center (City and Mainland divisions), the Richard Stockton College of New Jersey, Shore Memorial Hospital, Meadowview Nursing Home, Atlantic/Cape Community College and the Community Food Bank of New Jersey. 4) INTERNAL ACCOUNTING CONTROLS: Management of the District is responsible for establishing and maintaining an internal control structure designed to ensure that the assets of the District are protected from loss, theft or misuse and to ensure that adequate accounting data are compiled to allow for the preparation of financial statements in conformity with generally accepted accounting principles (GAAP). The internal control structure is designed to provide reasonable, but not absolute, assurance that these objectives are met. The concept of reasonable assurance recognizes that: (1) the cost of a control should not exceed the benefits likely to be derived; and (2) the valuation of costs and benefits requires estimates and judgments by the District management. As a recipient of federal awards and state financial assistance, the District also is responsible for ensuring that adequate internal controls are in place to ensure compliance with applicable laws and regulations related to those programs. Internal control is also subject to periodic evaluation by the District management. As part of the District's single audit described earlier, tests are made to determine the adequacy of the internal control structure, including that portion related to federal and state financial assistance programs, as well as to determine that the District has complied with applicable laws and regulations. 5) BUDGETARY CONTROLS: In addition to internal accounting controls, the District maintains budgetary controls. The objective of these budgetary controls is to ensure compliance with legal provisions embodied in the annual appropriated budget approved by the Board of School Estimates. Annual appropriated budgets are adopted for the general fund and the special revenue fund. The final budget amount as amended for the fiscal year is reflected in the financial section. An encumbrance accounting system is used to record outstanding purchase commitments on a line item basis. Open encumbrances at year-end are either canceled or are included as re-appropriations of fund balance in the subsequent year. Those amounts to be re-appropriated are reported as reservations of fund balance at June 30, 2015. 6) ACCOUNTING SYSTEM AND REPORTS: The District's accounting records reflect generally accepted accounting principles, as promulgated by the Governmental Accounting Standards Board (GASB). The accounting system of the District is organized on the basis of funds and account groups. These funds and account groups are explained in "Notes to the
3

Financial Statements", Note 1. 7) DEBT ADMINISTRATION: In accordance with the statutes governing Type I School Districts, the bonded debt is assumed by the County of Atlantic, New Jersey, and provision for amortization of principal and interest on the outstanding debt is included in the county budget. 8) CASH MANAGEMENT: The investment policy of the District is guided in large part by state statute as detailed in "Notes to the Financial Statements," Note 1 and 2. The District has adopted a cash management plan which requires it to deposit public funds in public depositories protected from loss under the provisions of the Governmental Unit Deposit Protection Act ("GUDPA"). GUDPA was enacted in 1970 to protect Governmental Units from a loss of funds on deposit with a failed banking institution in New Jersey. New Jersey Statutes require governmental units to deposit public funds in institutions as described in Note 1, Notes to the Financial Statements. 9) RISK MANAGEMENT: The Board carries various forms of insurance, including but not limited to general liability, automobile liability and comprehensive/collision, hazard and theft insurance on property and contents, and fidelity bonds. 10) OTHER INFORMATION: A) Independent Audit - State statutes require an annual audit by independent certified public accountants or registered municipal accountants. The Board selected the accounting firm of the Holman Frenia Allison, PC. In addition to meeting the requirements set forth in state statutes, the audit also was designed to meet the requirements of the Single Audit Act of 1984, OMB Circular A-133 and New Jersey OMB’s Circular(s) 04-04 and/or 15-08. The auditor's report on the general purpose financial statements and combining and individual fund statements and schedules is included in the financial section of this report. The auditor's reports related specifically to the single audit are included in the single audit section of this report. 11) ACKNOWLEDGMENTS: We would like to express our appreciation to the members of the Board of Education of the Special Services School District and the Vocational School District of the County of Atlantic for their concern in providing fiscal accountability to the citizens and taxpayers of the school district and thereby contributing their full support to the development and maintenance of our financial operation. The preparation of this report could not have been accomplished without the efficient and dedicated services of our financial and accounting staff.
4

5

This page intentionally left blank.
6

MEMBERS OF THE BOARD OF EDUCATION TERM EXPIRES
Philip Munafo, President 2017
Augustus Harmon, Vice President 2016
Marilyn Gallagher 2016
Dr. Norman Hirschfeld 2015
Mark W. Ludwick 2017
Joseph F. Zondlo 2015
Ann "Sally" Williams Ex-Officio
Thomas J. Dowd, Executive County Superintendent Ex-Officio
OTHER OFFICIALS
Philip J. Guenther, Ed. D., Superintendent
Lisa Mooney, CPA, Business Administrator/Board Secretary
Valerie Ritson, Assistant Board Secretary
ATLANTIC COUNTY SPECIAL SERVICES SCHOOL DISTRICT4805 Nawakwa Boulevard
Mays Landing, New Jersey 08330
ROSTER OF OFFICIALS
JUNE 30, 2015
7

This page intentionally left blank.
8
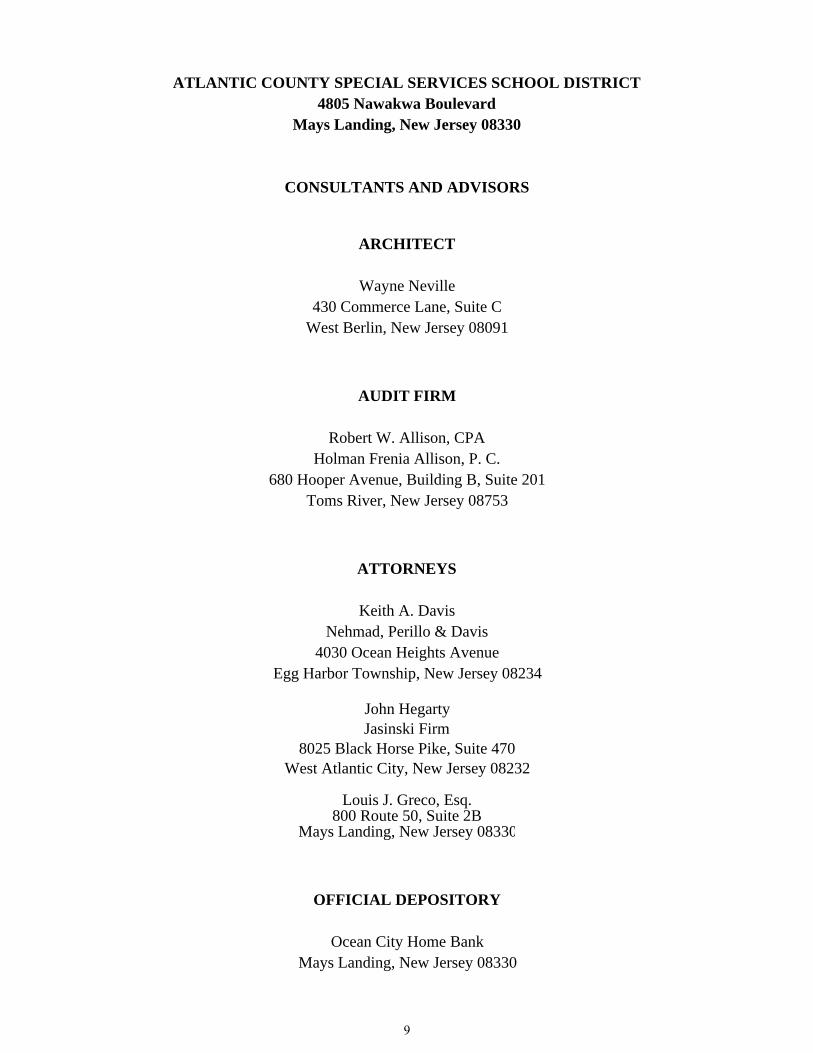
Louis J. Greco, Esq.
Wayne Neville
Toms River, New Jersey 08753
ATTORNEYS
Keith A. DavisNehmad, Perillo & Davis
4030 Ocean Heights Avenue
430 Commerce Lane, Suite CWest Berlin, New Jersey 08091
AUDIT FIRM
800 Route 50, Suite 2B
Holman Frenia Allison, P. C.
Egg Harbor Township, New Jersey 08234
Robert W. Allison, CPA
680 Hooper Avenue, Building B, Suite 201
OFFICIAL DEPOSITORY
Ocean City Home BankMays Landing, New Jersey 08330
John HegartyJasinski Firm
8025 Black Horse Pike, Suite 470West Atlantic City, New Jersey 08232
ATLANTIC COUNTY SPECIAL SERVICES SCHOOL DISTRICT4805 Nawakwa Boulevard
Mays Landing, New Jersey 08330
CONSULTANTS AND ADVISORS
ARCHITECT
Mays Landing, New Jersey 08330
9
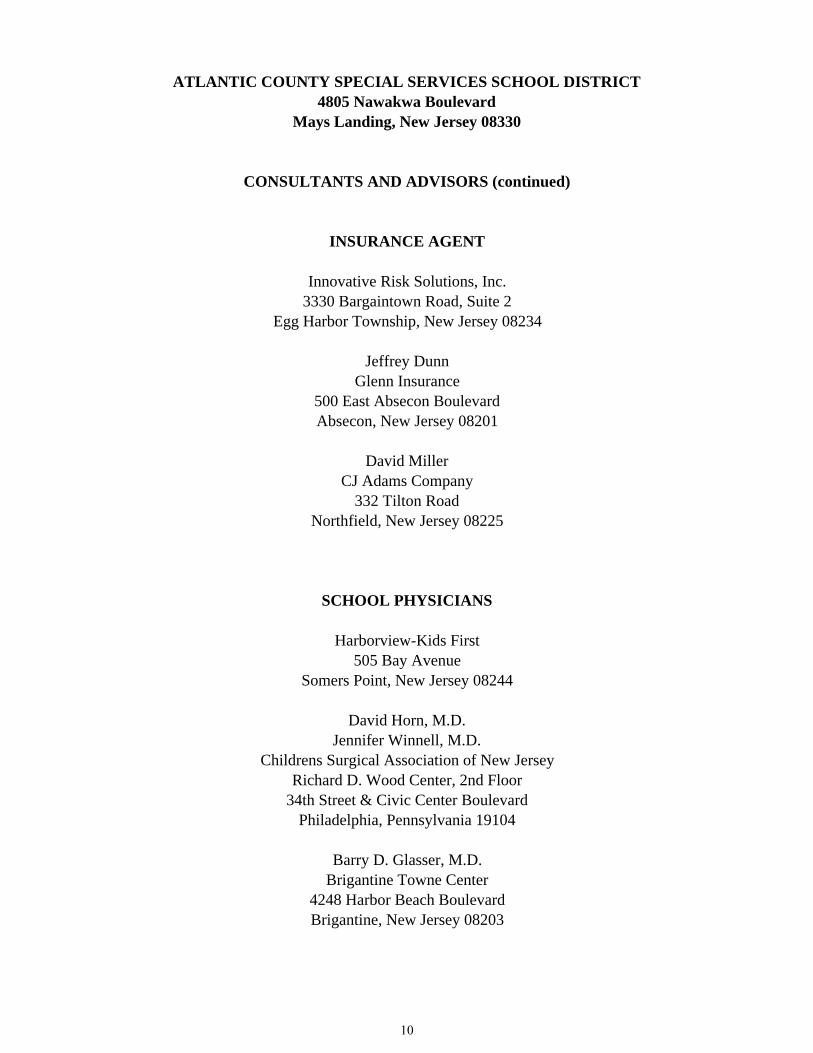
Brigantine, New Jersey 082034248 Harbor Beach Boulevard
SCHOOL PHYSICIANS
Barry D. Glasser, M.D.
Harborview-Kids First
Philadelphia, Pennsylvania 19104
Childrens Surgical Association of New Jersey
34th Street & Civic Center Boulevard
Brigantine Towne Center
505 Bay AvenueSomers Point, New Jersey 08244
David Horn, M.D.Jennifer Winnell, M.D.
Richard D. Wood Center, 2nd Floor
Jeffrey Dunn
Absecon, New Jersey 08201
ATLANTIC COUNTY SPECIAL SERVICES SCHOOL DISTRICT4805 Nawakwa Boulevard
Mays Landing, New Jersey 08330
CONSULTANTS AND ADVISORS (continued)
David Miller
3330 Bargaintown Road, Suite 2
500 East Absecon BoulevardGlenn Insurance
INSURANCE AGENT
Innovative Risk Solutions, Inc.
Egg Harbor Township, New Jersey 08234
CJ Adams Company332 Tilton Road
Northfield, New Jersey 08225
10

FINANCIAL SECTION
11

This page intentionally left blank.
12
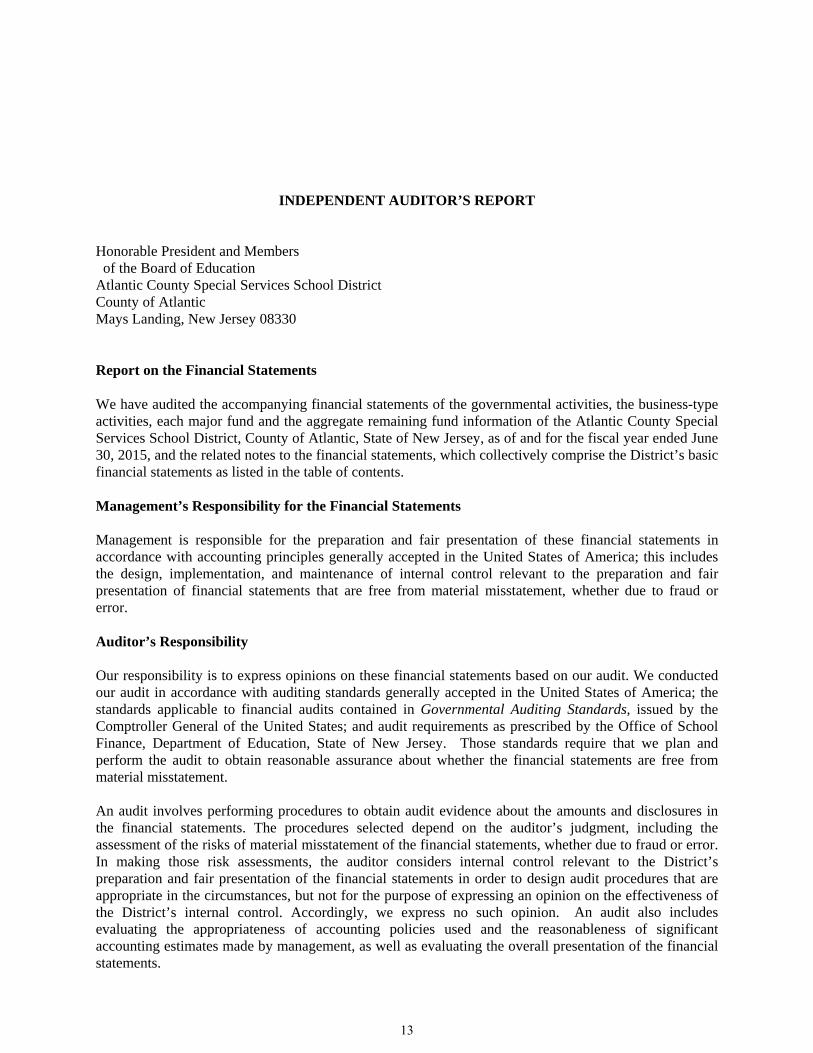
INDEPENDENT AUDITOR’S REPORT Honorable President and Members of the Board of Education Atlantic County Special Services School District County of Atlantic Mays Landing, New Jersey 08330 Report on the Financial Statements We have audited the accompanying financial statements of the governmental activities, the business-type activities, each major fund and the aggregate remaining fund information of the Atlantic County Special Services School District, County of Atlantic, State of New Jersey, as of and for the fiscal year ended June 30, 2015, and the related notes to the financial statements, which collectively comprise the District’s basic financial statements as listed in the table of contents. Management’s Responsibility for the Financial Statements Management is responsible for the preparation and fair presentation of these financial statements in accordance with accounting principles generally accepted in the United States of America; this includes the design, implementation, and maintenance of internal control relevant to the preparation and fair presentation of financial statements that are free from material misstatement, whether due to fraud or error. Auditor’s Responsibility Our responsibility is to express opinions on these financial statements based on our audit. We conducted our audit in accordance with auditing standards generally accepted in the United States of America; the standards applicable to financial audits contained in Governmental Auditing Standards, issued by the Comptroller General of the United States; and audit requirements as prescribed by the Office of School Finance, Department of Education, State of New Jersey. Those standards require that we plan and perform the audit to obtain reasonable assurance about whether the financial statements are free from material misstatement. An audit involves performing procedures to obtain audit evidence about the amounts and disclosures in the financial statements. The procedures selected depend on the auditor’s judgment, including the assessment of the risks of material misstatement of the financial statements, whether due to fraud or error. In making those risk assessments, the auditor considers internal control relevant to the District’s preparation and fair presentation of the financial statements in order to design audit procedures that are appropriate in the circumstances, but not for the purpose of expressing an opinion on the effectiveness of the District’s internal control. Accordingly, we express no such opinion. An audit also includes evaluating the appropriateness of accounting policies used and the reasonableness of significant accounting estimates made by management, as well as evaluating the overall presentation of the financial statements.
13

We believe that the audit evidence we have obtained is sufficient and appropriate to provide a basis for our audit opinions. Opinions In our opinion, the financial statements referred to above present fairly, in all material respects, the respective financial position of the governmental activities, the business-type activities, each major fund and the aggregate remaining fund information of the Atlantic County Special Services School District, County of Atlantic, State of New Jersey, as of June 30, 2015, and the respective changes in financial position and, where applicable, cash flows thereof for the year then ended in accordance with accounting principles generally accepted in the United States of America. Emphasis of Matter Change in Accounting Principle As discussed in Note 1 to the financial statements, during the fiscal year ended June 30, 2015 the District adopted Governmental Accounting Standards Board (GASB) Statement No. 68, Accounting and Financial Reporting for Pensions - an Amendment of GASB Statement No.27. Our opinion is not modified with respect to this matter. Other Matters Required Supplementary Information Accounting principles generally accepted in the United States of America require that the management’s discussion and analysis, budgetary comparison information and required supplementary information as listed in the table of contents be presented to supplement the basic financial statements. Such information, although not a part of the basic financial statements, is required by the Governmental Accounting Standards Board who considers it to be an essential part of financial reporting for placing the basic financial statements in an appropriate operational, economic, or historical context. We have applied certain limited procedures to the required supplementary information in accordance with auditing standards generally accepted in the United States of America, which consisted of inquiries of management about the methods of preparing the information and comparing the information for consistency with management’s responses to our inquiries, the basic financial statements, and other knowledge we obtained during our audit of the basic financial statements. We do not express an opinion or provide any assurance on the information because the limited procedures do not provide us with sufficient evidence to express an opinion or provide any assurance. Other Information Our audit was conducted for the purpose of forming opinions on the financial statements that collectively comprise the Atlantic County Special Services School District’s basic financial statements. The accompanying combining statements and related major fund supporting statements and schedules and Schedules of Expenditures of Federal Awards and State Financial Assistance as required by U.S. Office of Management and Budget Circular A-133, Audits of States, Local Governments, and Non-Profit Organizations and New Jersey OMB’s Circular(s) 04-04 and/or 15-08, Single Audit Policy for Recipients of Federal Grants, State Grants and State Aid respectively, are presented for purposes of additional analysis and are not a required part of the basic financial statements.
14
The accompanying combining statements and related major fund supporting statements and schedules and the Schedules of Expenditures of Federal Awards and State Financial Assistance are the responsibility of management and were derived from and relates directly to the underlying accounting and other records used to prepare the basic financial statements. Such information has been subjected to the auditing procedures applied in the audit of the basic financial statements and certain additional procedures, including comparing and reconciling such information directly to the underlying accounting other records used to prepare the basic financial statements or to the basic financial statements themselves, and other additional procedures in accordance with auditing standards generally accepted in the United States of America. In our opinion, the accompanying combining statements and related major fund supporting statements and schedules and Schedules of Expenditures of Federal Awards and State Financial Assistance are fairly stated in all material respects in relation to the basic financial statements taken as a whole. The introductory section and statistical information have not been subjected to the auditing procedures applied in the audit of the basic financial statements and, accordingly, we do not express an opinion or provide any assurance on them. Other Reporting Required by Government Auditing Standards In accordance with Government Auditing Standards, we have also issued our report dated December 8, 2015 on our consideration of the Atlantic County Special Services School District’s internal control over financial reporting and on our tests of its compliance with certain provisions of laws, regulations, contracts, and grant agreements and other matters. The purpose of that report is to describe the scope of our testing of internal control over financial reporting and compliance and the results of that testing, and not to provide an opinion on internal control over financial reporting or on compliance. That report is an integral part of an audit performed in accordance with Government Auditing Standards in considering Atlantic County Special Services School District’s internal control over financial reporting and compliance.
Respectfully Submitted,
HOLMAN FRENIA ALLISON, P.C.
Robert W. Allison Certified Public Accountant Public School Accountant, No. 897
Toms River, New Jersey December 8, 2015
15

This page intentionally left blank.
16
REQUIRED SUPPLEMENTARY INFORMATION - PART I
Management's Discussion and Analysis
17

This page intentionally left blank.
18

MANAGEMENT’S DISCUSSION AND ANALYSIS (UNAUDITED)
This section of the Atlantic County Special Services School District’s (a component unit of the County of Atlantic) (“District”) annual financial report presents our discussion and analysis of the District’s financial performance during the fiscal year that ended on June 30, 2015. Please read it in conjunction with the transmittal letter at the front of this report and the District’s financial statement. As described in Note 18 to the financial statements, "Prior Period Adjustment/Restatement of Net Position", the District has adopted the provisions of GASB Statement No. 68, Accounting and Financial Reporting for Pensions, for the year ended June 30, 2015. The adoption of this principle resulted in a restatement of the District's opening net position as of July 1, 2014 in the amount of ($23,359,742), as indicated in Note 18 to the financial statements. Prior year balances reflected in MD&A have been updated, for comparison purposes, to reflect the change where indicated. FINANCIAL HIGHLIGHTS
The net position of the District decreased $646,489 due to an excess of expenditures over revenues.
The State of New Jersey reimbursed the District $604,374 during the fiscal year ended June 30, 2015 for the employer’s share of social security contributions for TPAF members as calculated on their base salaries. The State also contributed $1,097,644 for TPAF pension and post-retirement medical contributions on-behalf of the district. These amounts, which are not budgeted, are included as both a revenue and appropriation in the financial statements.
During the fiscal year ended June 30, 2015, the District’s governmental activities expenditures were $1,180,220 more than total revenues. During the prior fiscal year, expenditures exceeded revenues by $1,378,661.
In the District’s business-type activities, net position increased $533,731 as a result of an excess of revenues over expenditures.
OVERVIEW OF THE FINANCIAL STATEMENTS This annual report consists of four parts – management’s discussion and analysis (this section), the basic financial statements, required supplementary information, and an optional section that presents combining statements for special revenue, proprietary, and fiduciary funds. The basic financial statements include two kinds of statements that present different views of the District.
The first two statements are government-wide financial statements that provide both long-term and short-term information about the District’s overall financial status.
The remaining statements are fund financial statements that focus on individual parts of the District’s government, reporting on the District’s operations in more detail than the government-wide statements. Governmental fund statements tell how general government services like instruction were
financed in the short term as well as what remains for future spending. Proprietary fund statements offer short- and long-term financial information about the
activities the District operates like businesses, such as the food service area. Fiduciary fund statements provide information about the financial relationships – like the
unemployment trust fund – in which the District acts solely as a trustee or agent for the benefit of others, to whom the resources in question belong.
19

The financial statements also include notes that explain some of the information in the financial statements and provide more detailed data. The statements are followed by a section of required supplementary information that further explains and supports the information in the financial statements. Figure A-1 shows how the required parts of this annual report are arranged and relate to one another. Figure A-1 summarizes the major features of the District’s financial statements, including the portion of the District’s government they cover and the types of information they contain. The remainder of this overview section of management’s discussion and analysis explains the structure and contents of each of the statements.
Major Features of Atlantic County Special Services School District’s Government-Wide and Fund Financial Statements
(Figure A-1)
Government- Governmental Proprietary FiduciaryWide Statements Funds Funds Funds
Scope Entire District except fiduciary funds.
The activities of the District that are not
proprietary or fiduciary, such as food service and student activities.
Activities the District operates similar to
private businesses such as food service and
transportation enterprise.
Instances in which the District is the trustee or
agent for someone else's resources, such as payroll agency and
student activities.Required Financial
Statements
Statement of Net Position
Statement of Activities
Balance Sheet
Statement of Revenues, Expenses and Changes
in Fund Balance
Statement of Net Position
Statement of Activities
Statement of Cash Flows
Statement of Fiduciary Net Position
Statement of Changes in Fiduciary Net
Position
Accounting Basis and
Measurement Focus
Accrual accounting and economic resources
focus.
Modified accrual accounting and current
financial resources focus.
Accrual accounting and economic resources
focus.
Accrual accounting and economic resources
focus.
Type of Asset and Liability Information
All assets and liabilities, both financial and
capital, and short-term and long-term.
Only assets expected to be used up and
liabilities that will come due during the current
year or soon thereafter; no capital assets or debt are included.
All assets and liabilities, both financial and
capital, and short-term and long-term.
All assets and liabilities, both short-term and
long-term.
Type of Inflow/Outflow
Information
All revenues and expenses during the
current year, regardless of when cash is received or paid.
Revenues for which cash is received during or soon after the end of
year; expenditures when goods or services have been received and payment is due during
the year or soon thereafter.
All revenues and expenses during the
current year, regardless of when cash is received or paid.
All revenues and expenses during the
current year, regardless of when cash is received or paid.
Fund Statements
20
Government-Wide Statements The government-wide statements report information about the District as a whole using accounting methods similar to those used by private-sector companies. The statement of net position includes all of the government’s assets and liabilities. All of the current year’s revenues and expenses are accounted for in the statement of activities regardless of when cash is received or paid. The two government-wide statements report the District’s net position and how it has changed. Net position – the difference between the District’s assets and liabilities – is one way to measure the District’s financial health, or position.
Over time, increases or decreases in the District’s net position is an indicator of whether its financial health is improving or deteriorating, respectively.
To assess the overall health of the District you need to consider additional non-financial factors such as changes in the County’s property tax base and the condition of the District’s facilities.
The government-wide financial statements of the District are divided into two categories:
Governmental activities – most of the District’s basic services are included here, such as instruction, vocational education, administration, and plant operations. Tuition and state and federal grants finance most of these activities.
Business-type activities – the District charges fees to customers to help it cover the costs of certain services it provides. The District’s food service, transportation, and Teachers Aide Enterprise funds are included here.
Fund Financial Statements The fund financial statements provide more detailed information about the District’s most significant funds – not the District as a whole. Funds are accounting devices that the District uses to keep track of specific sources of funding and spending for particular purposes. The District has three kinds of funds:
Governmental funds – Most of the District’s basic services are included in governmental funds, which focus on (1) how cash and other financial assets that can readily be converted to cash flow in and out and (2) the balances left at year-end that are available for spending. Consequently, the governmental funds statements provide a detailed short-term view that helps you determine whether there are more or fewer financial resources that can be spent in the near future to finance the District’s programs. Because this information does not encompass the additional long-term focus of the government-wide statements, we provide additional information at the bottom of the governmental funds statement that explains the relationship (or differences) between them.
Proprietary funds – Services for which the District charges customers a fee are generally reported in proprietary funds. Proprietary funds, like the government-wide statements, provide both long- and short-term financial information. In fact, the District’s enterprise funds (one type of proprietary fund) are the same as its business-type activities, but provide more detail and additional information, such as cash flows.
Fiduciary funds – The District is the trustee, or fiduciary, for its employees’ unemployment compensation plan. It is also responsible for other assets that - because of a trust arrangement – can be used only for the trust beneficiaries. The District is responsible for ensuring that the assets reported in these funds are used for their intended purposes. All of the District’s fiduciary activities are reported in separate statement of fiduciary net position and a statement of changes in fiduciary net position. We exclude these activities from the District’s government-wide financial statements because the District cannot use these assets to finance its operations.
21
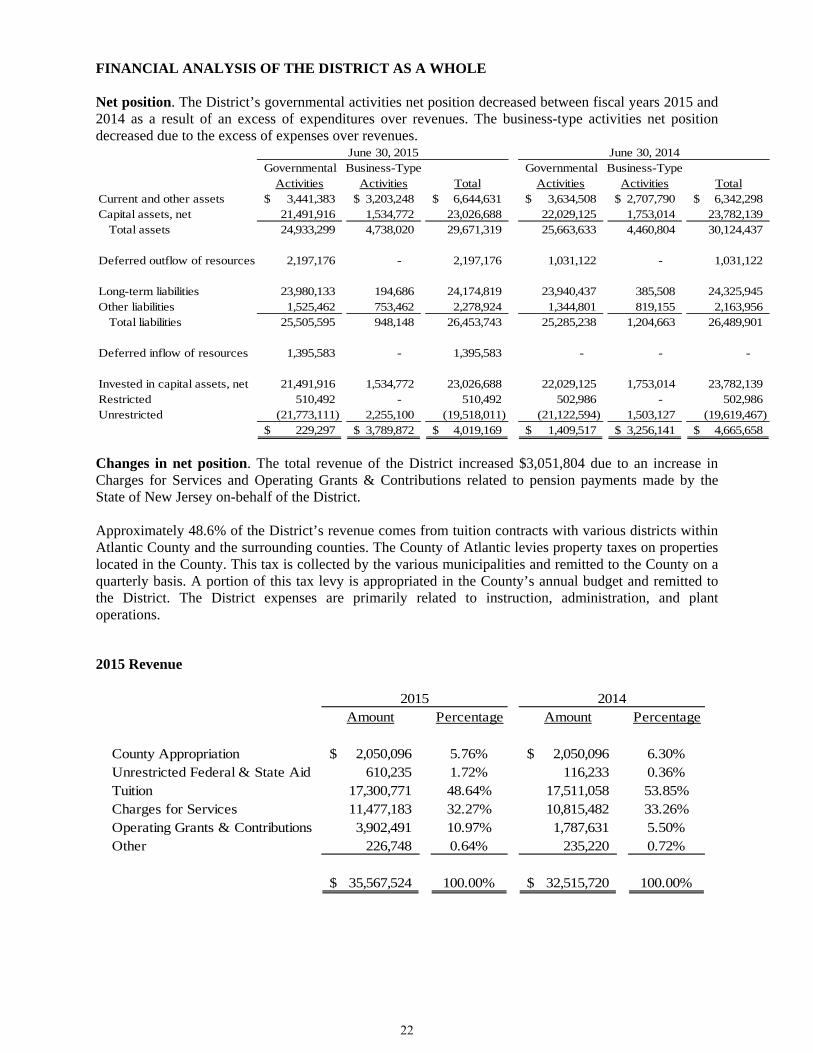
FINANCIAL ANALYSIS OF THE DISTRICT AS A WHOLE Net position. The District’s governmental activities net position decreased between fiscal years 2015 and 2014 as a result of an excess of expenditures over revenues. The business-type activities net position decreased due to the excess of expenses over revenues.
Governmental Business-Type Governmental Business-TypeActivities Activities Total Activities Activities Total
Current and other assets 3,441,383$ 3,203,248$ 6,644,631$ 3,634,508$ 2,707,790$ 6,342,298$ Capital assets, net 21,491,916 1,534,772 23,026,688 22,029,125 1,753,014 23,782,139
Total assets 24,933,299 4,738,020 29,671,319 25,663,633 4,460,804 30,124,437
Deferred outflow of resources 2,197,176 - 2,197,176 1,031,122 - 1,031,122
Long-term liabilities 23,980,133 194,686 24,174,819 23,940,437 385,508 24,325,945 Other liabilities 1,525,462 753,462 2,278,924 1,344,801 819,155 2,163,956
Total liabilities 25,505,595 948,148 26,453,743 25,285,238 1,204,663 26,489,901
Deferred inflow of resources 1,395,583 - 1,395,583 - - -
Invested in capital assets, net 21,491,916 1,534,772 23,026,688 22,029,125 1,753,014 23,782,139 Restricted 510,492 - 510,492 502,986 - 502,986 Unrestricted (21,773,111) 2,255,100 (19,518,011) (21,122,594) 1,503,127 (19,619,467)
229,297$ 3,789,872$ 4,019,169$ 1,409,517$ 3,256,141$ 4,665,658$
June 30, 2015 June 30, 2014
Changes in net position. The total revenue of the District increased $3,051,804 due to an increase in Charges for Services and Operating Grants & Contributions related to pension payments made by the State of New Jersey on-behalf of the District. Approximately 48.6% of the District’s revenue comes from tuition contracts with various districts within Atlantic County and the surrounding counties. The County of Atlantic levies property taxes on properties located in the County. This tax is collected by the various municipalities and remitted to the County on a quarterly basis. A portion of this tax levy is appropriated in the County’s annual budget and remitted to the District. The District expenses are primarily related to instruction, administration, and plant operations.
2015 Revenue
Amount Percentage Amount Percentage
County Appropriation 2,050,096$ 5.76% 2,050,096$ 6.30%Unrestricted Federal & State Aid 610,235 1.72% 116,233 0.36%Tuition 17,300,771 48.64% 17,511,058 53.85%Charges for Services 11,477,183 32.27% 10,815,482 33.26%Operating Grants & Contributions 3,902,491 10.97% 1,787,631 5.50%Other 226,748 0.64% 235,220 0.72%
35,567,524$ 100.00% 32,515,720$ 100.00%
2015 2014
22

Governmental Activities The following schedule summarizes the governmental and business-type activities of the District during the 2015and 2014 fiscal years.
2015 2014 2015 2014 2015 2014Revenue
Program Revenue:Charges for Services 17,300,771$ 17,511,058$ 11,477,183$ 10,815,482$ 28,777,954$ 28,326,540$ Operating Grants 3,673,677 - 228,814 231,665 3,902,491 231,665
General Revenues:County Appropriations 2,050,096 2,050,096 - - 2,050,096 2,050,096 Federal & State Aid 610,235 116,233 - - 610,235 116,233 Other 164,647 235,220 62,101 - 226,748 235,220
Total 23,799,426 19,912,607 11,768,098 11,047,147 35,567,524 30,959,754
Expenses
Instruction:Special Instruction 7,607,307 7,845,081 - - 7,607,307 7,845,081 Other Instruction 855,485 761,457 - - 855,485 761,457
Support Services:Student & Instruction
Related Services 2,884,228 3,038,669 - - 2,884,228 3,038,669 School Administration 672,983 631,216 - - 672,983 631,216 General & Business
Administration 1,174,994 1,115,928 - - 1,174,994 1,115,928 Plant Operations &
Maintenance 1,607,410 1,653,937 - - 1,607,410 1,653,937 Pupil Transportation 29,214 27,389 - - 29,214 27,389 Unallocated Benefits 9,043,970 5,194,671 - - 9,043,970 5,194,671 Unallocated Depreciation 798,079 889,920 - - 798,079 889,920 Business-Type Activities - - 11,540,343 11,681,916 11,540,343 11,681,916
Total Expenses 24,673,670 21,158,268 11,540,343 11,681,916 36,214,013 32,840,184
Transfers (305,976) (133,000) 305,976 133,000 - -
Change in Net Position (1,180,220)$ (1,378,661)$ 533,731$ (501,769)$ (646,489)$ (1,880,430)$
Governmental Activities Business-Type Activities Total
2015 RevenueCounty Appropriation
Unrestricted Federal & State Aid
Tuition
Charges for Services
23
Business-Type Activities Revenues of the District’s business-type activities increased approximately 6.5% when compared to the previous fiscal year while expenditures decreased 1.2% over the past fiscal year. FINANCIAL ANALYSIS OF THE DISTRICT’S FUNDS As of the year end, the governmental funds reported a combined fund balance of $2,916,271 which is $404,558 lower than the beginning of the year. The most significant change was an increase in special education expenditures. General Fund Budgetary Highlights As further explained in the Notes to the Financial Statements, annual appropriated budgets are prepared in the spring of each year for the general and special revenue. The budgets are submitted to the County office and, as a Type I School District, are approved by the Board of School Estimates. Transfers of appropriations may be made by Board resolution at any time during the fiscal year. The District is permitted to encumber funds throughout the year for purchases ordered but not yet received. Any open encumbrances as of June 30th carry over to the next fiscal year and are added to the appropriation reflected in the certified budget. After adjusting total revenue reported on Exhibit C-1 for the Reimbursed TPAF Social Security Contribution and On-Behalf TPAF Pension and Post-Retirement Medical Contributions, which are not budgeted, the District’s budget revenue was less than actual revenues by $1,004,692. This is a result of a smaller student population than anticipated and reduced miscellaneous revenue from itinerant services. Again, after adjusting for the Reimbursed TPAF Social Security Contribution and On-Behalf TPAF Pension and Post-Retirement Medical Contributions, actual expenditures were below the budgeted appropriations by $1,297,488. The most significant variances occurred in the area of salaries and benefits. CAPITAL ASSET AND DEBT ADMINISTRATION Capital Assets At the end of 2015, the District had invested $23.0 million (net of accumulated depreciation) in a broad range of capital assets, including land, buildings, vehicles and machinery. This amount represents a net decrease (including additions and deductions) of $755,451 or 3.2%, over last year. Refer to Note 6 to the Financial Statements for more detailed information. Long-Term Debt New Jersey State Statutes governing Type I School Districts require the bonded debt be assumed by the County and provision for amortization of principal and interest on the outstanding debt is included in the County budget. The District is party to a capital lease for the purchase of school buses. Refer to the Note 8 to the Financial Statements for more detailed information.
24
ECONOMIC FACTORS AND NEXT YEAR’S BUDGETS AND RATES The District budget for the 2015 fiscal year includes very little expansion for equipment acquisitions. CONTACTING THE DISTRICT’S FINANCIAL MANAGEMENT This financial report is designed to present users (residents, sending districts, and creditors) with a general overview of the District’s finances and to demonstrate the District’s accountability. If you have questions about the report or need additional financial information, contact the District’s business administrator at 4805 Nawakwa Boulevard, Mays Landing, New Jersey 08330.
25

This page intentionally left blank.
26

BASIC FINANCIAL STATEMENTS
27

This page intentionally left blank.
28

A. Government-Wide Financial Statements
29

This page intentionally left blank
30

EXHIBIT A-1
BUSINESS-GOVERNMENTAL TYPE JUNE 30,
ACTIVITIES ACTIVITIES 2015
Cash & Cash Equivalents 2,659,130$ 1,971,419$ 4,630,549$ Accounts Receivable, Net 245,211 1,138,525 1,383,736 Due From Other Funds 537,042 75,091 612,133 Inventory - 18,213 18,213 Capital Assets Not Being Depreciated:
Land 636,272 73,500 709,772 Capital Assets, Net of
Accumulated Depreciation 20,855,644 1,461,272 22,316,916
Total Assets 24,933,299 4,738,020 29,671,319
Deferred Outflows Related to Pensions 2,197,176 - 2,197,176
Total Deferred Outflow of Resources 2,197,176 - 2,197,176
Total Assets and Deferred Outflow of Resources 27,130,475 4,738,020 31,868,495
Accounts Payable 269,230 147,611 416,841 Due to Other Funds - 605,851 605,851 Unearned Revenues 255,882 - 255,882 PERS Pension Payable 1,000,350 - 1,000,350 Noncurrent Liabilities:
Due Beyond One Year 23,980,133 194,686 24,174,819
Total Liabilities 25,505,595 948,148 26,453,743
Deferred Inflows Related to Pensions 1,395,583 - 1,395,583
Total Deferred Inflow of Resources 1,395,583 - 1,395,583
Total Liabilities and Deferred Inflows of Resources 26,901,178 948,148 27,849,326
Invested in Capital Assets, Netof Related Debt 21,491,916 1,534,772 23,026,688
Restricted For:Capital Projects 20,761 - 20,761 Other Purposes 489,731 - 489,731
Unrestricted (21,773,111) 2,255,100 (19,518,011)
Total Net Position 229,297$ 3,789,872$ 4,019,169$
LIABILITIES
NET POSITION
TOTAL
ATLANTIC COUNTY SPECIAL SERVICES SCHOOL DISTRICTSTATEMENT OF NET POSITION
JUNE 30, 2015
ASSETS
DEFERRED OUTFLOW OF RESOURCES
DEFERRED INFLOW OF RESOURCES
The Accompanying Notes to the Financial Statements are an integral part of this Statement.
31

EX
HIB
IT A
-2
CH
AR
GE
SO
PE
RA
TIN
GB
US
INE
SS
-F
OR
GR
AN
TS
&G
OV
ER
NM
EN
TA
LT
YP
EJU
NE
30,
FU
NC
TIO
NS
/PR
OG
RA
MS
EX
PE
NS
ES
SE
RV
ICE
SC
ON
TR
IBU
TIO
NS
AC
TIV
ITIE
SA
CT
IVIT
IES
2015
Gov
ernm
enta
l Act
ivit
ies:
Inst
ruct
ion:
Spe
cial
Edu
cati
on7,
607,
307
$
17,3
00,7
71$
-
$
9,69
3,46
4$
-
$
9,69
3,46
4$
O
ther
Ins
truc
tion
855,
485
-
-
(8
55,4
85)
-
(8
55,4
85)
Sup
port
Ser
vice
s:S
tude
nt &
Ins
truc
tion
Rel
ated
Ser
vice
s2,
884,
228
-
12,4
81
(2,8
71,7
47)
-
(2,8
71,7
47)
S
choo
l Adm
inis
trat
ive
Ser
vice
s67
2,98
3
-
-
(672
,983
)
-
(672
,983
)
O
ther
Adm
inis
trat
ive
Ser
vice
s1,
174,
994
-
-
(1,1
74,9
94)
-
(1,1
74,9
94)
P
lant
Ope
rati
ons
and
Mai
nten
ance
1,60
7,41
0
-
-
(1
,607
,410
)
-
(1
,607
,410
)
Pup
il T
rans
port
atio
n29
,214
-
-
(29,
214)
-
(2
9,21
4)
Una
lloc
ated
Ben
efit
s9,
043,
970
-
3,66
1,19
6
(5,3
82,7
74)
-
(5,3
82,7
74)
U
nall
ocat
ed D
epre
ciat
ion
798,
079
-
-
(7
98,0
79)
-
(7
98,0
79)
Tot
al G
over
nmen
tal A
ctiv
itie
s24
,673
,670
17
,300
,771
3,67
3,67
7
(3,6
99,2
22)
-
(3,6
99,2
22)
Bus
ines
s-T
ype
Act
ivit
ies:
Foo
d S
ervi
ce69
5,01
3
23
8,48
0
228,
814
-
(2
27,7
19)
(227
,719
)
T
rans
port
atio
n7,
345,
473
7,
552,
623
-
-
20
7,15
0
207,
150
Inst
ruct
ion
3,49
9,85
7
3,68
6,08
0
-
-
186,
223
18
6,22
3
T
otal
Bus
ines
s-T
ype
Act
ivit
ies
11,5
40,3
43
11,4
77,1
83
22
8,81
4
-
165,
654
16
5,65
4
Tot
al P
rim
ary
Gov
ernm
ent
36,2
14,0
13$
28
,777
,954
$
3,
902,
491
$
(3,6
99,2
22)
16
5,65
4
(3
,533
,568
)
Gen
eral
Rev
enue
s:T
axes
:C
ount
y A
ppro
pria
tion
s2,
050,
096
-
2,05
0,09
6
Fed
eral
& S
tate
Aid
Unr
estr
icte
d 61
0,23
5
-
610,
235
Non
Res
iden
t Fee
s10
8,28
6
-
108,
286
Mis
cell
aneo
us I
ncom
e53
,152
-
53,1
52
Can
cell
atio
n of
Rec
eiva
ble
Bal
anc e
(57,
373)
-
(5
7,37
3)
T
rans
fers
(305
,976
)
305,
976
-
Can
cell
atio
n of
Pri
or Y
ear
Pay
able
s60
,582
62,1
01
12
2,68
3
Tot
al G
ener
al R
even
ues,
Spe
cial
Ite
ms,
Ext
raor
dina
ry I
tem
s &
Tra
nsfe
rs2,
519,
002
368,
077
2,
887,
079
Cha
nge
In N
et P
osit
ion
(1,1
80,2
20)
533,
731
(6
46,4
89)
Beg
inni
ng N
et P
osit
ion,
as
Res
tate
d (S
ee N
ote
18)
1,40
9,51
7
3,
256,
141
4,66
5,65
8
End
ing
Net
Pos
itio
n22
9,29
7$
3,
789,
872
$
4,
019,
169
$
NE
T (
EX
PE
NS
ES
) R
EV
EN
UE
PR
OG
RA
M R
EV
EN
UE
SA
ND
CH
AN
GE
S I
N N
ET
PO
SIT
ION
AT
LA
NT
IC C
OU
NT
Y S
PE
CIA
L S
ER
VIC
ES
SC
HO
OL
DIS
TR
ICT
ST
AT
EM
EN
T O
F A
CT
IVIT
IES
FO
R T
HE
YE
AR
EN
DE
D J
UN
E 3
0, 2
015
TO
TA
L
The
Acc
ompa
nyin
g N
otes
to th
e F
inan
cial
Sta
tem
ents
are
an
inte
gral
par
t of
this
Sta
tem
ent.
32

B. Fund Financial Statements
33

This page intentionally left blank
34

Governmental Funds
35

This page intentionally left blank
36

EXHIBIT B-1
SPECIAL CAPITALGENERAL REVENUE PROJECTS JUNE 30,
ASSETS FUND FUND FUND 2015
Cash & Cash Equivalents 2,167,023$ 2,376$ -$ 2,169,399$ Intergovernmental Accounts Receivable:
State 138,243 - 42,272 180,515 Other 64,696 - - 64,696
Interfund Receivable 633,644 - - 633,644 Restricted Cash 489,731 - - 489,731
Total Assets 3,493,337$ 2,376$ 42,272$ 3,537,985$
LIABILITIES & FUND BALANCES
Liabilities:Accounts Payable 158,696$ 894$ -$ 159,590$ Intergovernmental Payable 109,640 - - 109,640 Unearned Revenues 254,400 1,482 - 255,882 Interfund Payable 75,091 - 21,511 96,602
Total Liabilities 597,827 2,376 21,511 621,714
Fund Balances:Restricted:
Capital Reserve 364,049 - - 364,049 Maintenance Reserve 125,682 - - 125,682
Assigned to:Other Purposes - - 20,761 20,761
Unassigned 2,405,779 - - 2,405,779
Total Fund Balances 2,895,510 - 20,761 2,916,271
Total Liabilities & Fund Balances 3,493,337$ 2,376$ 42,272$
Amounts reported for governmental activities in the Statement of Net Position (A-2) are different because:
Capital assets used in governmental activities are not financial resources and therefore are not reported in the funds. The cost of the assets is $33,111,505 and accumulated depreciation is $11,619,589. 21,491,916
Deferred outflows and inflows of resources related to pensions and deferred charges or credits on debt refundings are applicable to future reporting periods and, therefore, are not reported in the funds. 801,593
PERS pension payable is not due and payable in the current period and, therefore, is not reported as a liability in the funds. (1,000,350)
Long-term liabilities, including net pension liability and compensated absences are not due and payable in the current period and, therefore, are not reported as liabilities in the funds. (See Illusstrative Note 8) (23,980,133)
Net Position of Governmental Activities 229,297$
TOTAL
ATLANTIC COUNTY SPECIAL SERVICES SCHOOL DISTRICT
BALANCE SHEETGOVERNMENTAL FUNDS
JUNE 30, 2015
The Accompanying Notes to the Financial Statements are an integral part of this Statement.
37
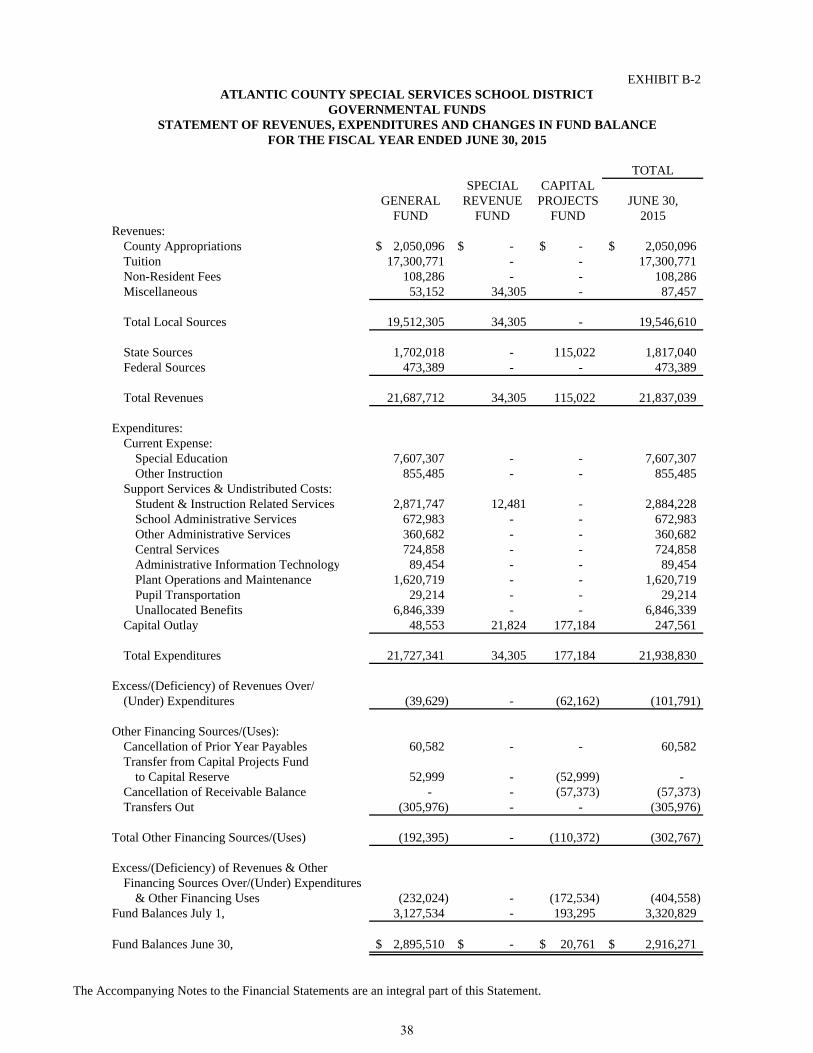
EXHIBIT B-2
SPECIAL CAPITALGENERAL REVENUE PROJECTS JUNE 30,
FUND FUND FUND 2015Revenues:
County Appropriations 2,050,096$ -$ -$ 2,050,096$ Tuition 17,300,771 - - 17,300,771 Non-Resident Fees 108,286 - - 108,286 Miscellaneous 53,152 34,305 - 87,457
Total Local Sources 19,512,305 34,305 - 19,546,610
State Sources 1,702,018 - 115,022 1,817,040 Federal Sources 473,389 - - 473,389
Total Revenues 21,687,712 34,305 115,022 21,837,039
Expenditures:Current Expense:
Special Education 7,607,307 - - 7,607,307 Other Instruction 855,485 - - 855,485
Support Services & Undistributed Costs:Student & Instruction Related Services 2,871,747 12,481 - 2,884,228 School Administrative Services 672,983 - - 672,983 Other Administrative Services 360,682 - - 360,682 Central Services 724,858 - - 724,858 Administrative Information Technology 89,454 - - 89,454 Plant Operations and Maintenance 1,620,719 - - 1,620,719 Pupil Transportation 29,214 - - 29,214 Unallocated Benefits 6,846,339 - - 6,846,339
Capital Outlay 48,553 21,824 177,184 247,561
Total Expenditures 21,727,341 34,305 177,184 21,938,830
Excess/(Deficiency) of Revenues Over/(Under) Expenditures (39,629) - (62,162) (101,791)
Other Financing Sources/(Uses):Cancellation of Prior Year Payables 60,582 - - 60,582 Transfer from Capital Projects Fund
to Capital Reserve 52,999 - (52,999) - Cancellation of Receivable Balance - - (57,373) (57,373) Transfers Out (305,976) - - (305,976)
Total Other Financing Sources/(Uses) (192,395) - (110,372) (302,767)
Excess/(Deficiency) of Revenues & OtherFinancing Sources Over/(Under) Expenditures
& Other Financing Uses (232,024) - (172,534) (404,558) Fund Balances July 1, 3,127,534 - 193,295 3,320,829
Fund Balances June 30, 2,895,510$ -$ 20,761$ 2,916,271$
ATLANTIC COUNTY SPECIAL SERVICES SCHOOL DISTRICT
STATEMENT OF REVENUES, EXPENDITURES AND CHANGES IN FUND BALANCEGOVERNMENTAL FUNDS
FOR THE FISCAL YEAR ENDED JUNE 30, 2015
TOTAL
The Accompanying Notes to the Financial Statements are an integral part of this Statement.
38
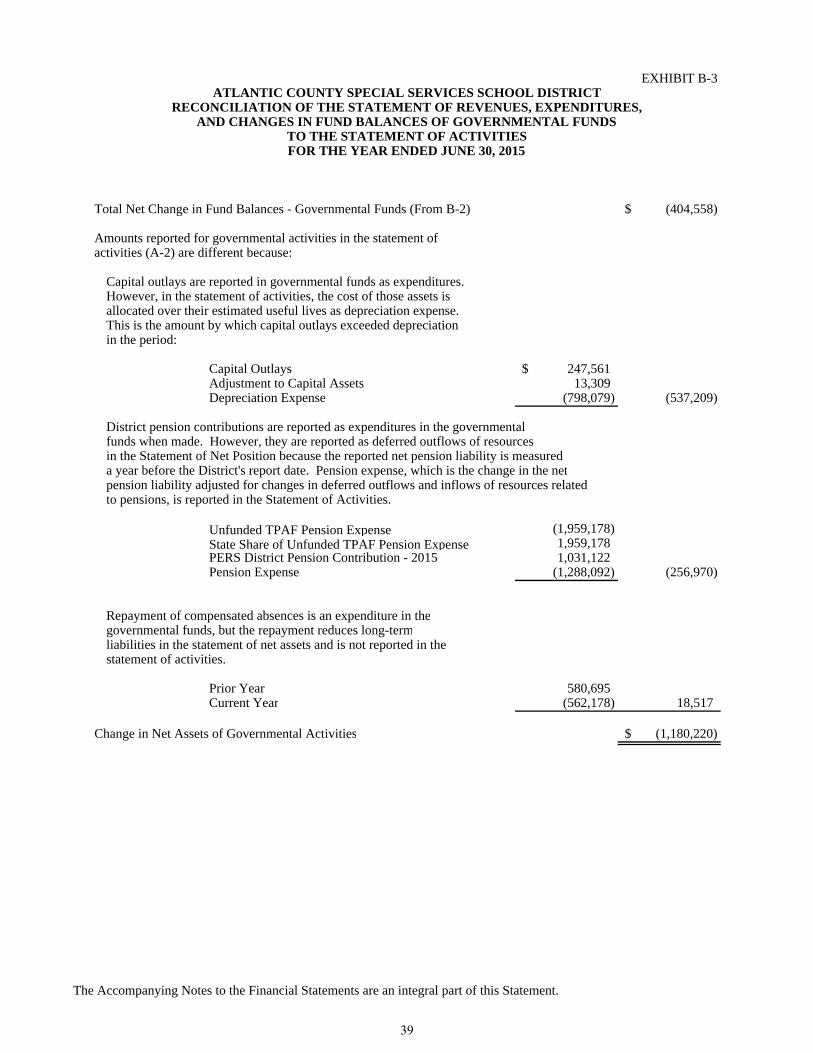
EXHIBIT B-3
Total Net Change in Fund Balances - Governmental Funds (From B-2) (404,558)$
Amounts reported for governmental activities in the statement ofactivities (A-2) are different because:
Capital outlays are reported in governmental funds as expenditures.However, in the statement of activities, the cost of those assets isallocated over their estimated useful lives as depreciation expense.This is the amount by which capital outlays exceeded depreciation in the period:
Capital Outlays 247,561$ Adjustment to Capital Assets 13,309 Depreciation Expense (798,079) (537,209)
District pension contributions are reported as expenditures in the governmentalfunds when made. However, they are reported as deferred outflows of resourcesin the Statement of Net Position because the reported net pension liability is measureda year before the District's report date. Pension expense, which is the change in the netpension liability adjusted for changes in deferred outflows and inflows of resources relatedto pensions, is reported in the Statement of Activities.
Unfunded TPAF Pension Expense (1,959,178) State Share of Unfunded TPAF Pension Expense 1,959,178 PERS District Pension Contribution - 2015 1,031,122 Pension Expense (1,288,092) (256,970)
Repayment of compensated absences is an expenditure in thegovernmental funds, but the repayment reduces long-termliabilities in the statement of net assets and is not reported in thestatement of activities.
Prior Year 580,695 Current Year (562,178) 18,517
Change in Net Assets of Governmental Activities (1,180,220)$
FOR THE YEAR ENDED JUNE 30, 2015
ATLANTIC COUNTY SPECIAL SERVICES SCHOOL DISTRICTRECONCILIATION OF THE STATEMENT OF REVENUES, EXPENDITURES,
AND CHANGES IN FUND BALANCES OF GOVERNMENTAL FUNDSTO THE STATEMENT OF ACTIVITIES
The Accompanying Notes to the Financial Statements are an integral part of this Statement.
39

This page intentionally left blank
40

Proprietary Funds
41

This page intentionally left blank
42

EX
HIB
IT B
-4
ITIN
ER
AN
T/
FO
OD
SH
AR
ED
SC
HO
OL
SC
OU
NT
YS
TA
TE
JUN
E 3
0,S
ER
VIC
ET
RA
NS
PO
RT
AT
ION
SE
RV
ICE
ST
O C
AR
EE
RS
PR
OG
RA
MS
PR
OG
RA
MS
2015
Cur
rent
Ass
ets:
Cas
h -
$
1,
519,
883
$
43
0,81
5$
-
$
-
$
20,7
21$
1,
971,
419
$
A
ccou
nts
Rec
eiva
ble:
Fed
eral
18,0
70
-
-
-
-
-
18
,070
S
tate
239
-
-
-
-
-
239
Oth
er10
,634
65
4,90
7
24
5,27
6
4,
375
16
2,98
1
42,0
43
1,
120,
216
In
terf
und
Rec
eiva
ble
75,0
91
-
-
-
-
-
75
,091
In
vent
ory
18,2
13
-
-
-
-
-
18
,213
Tot
al C
urre
nt A
sset
s12
2,24
7
2,17
4,79
0
676,
091
4,37
5
162,
981
62
,764
3,20
3,24
8
Non
curr
ent A
sset
s:L
and
and
Impr
ovem
ents
-
73,5
00
-
-
-
-
73
,500
B
uild
ing
and
Impr
ovem
ents
-
510,
210
-
-
-
-
51
0,21
0
M
achi
nery
and
Equ
ipm
ent
584,
587
3,
493,
854
-
-
-
-
4,07
8,44
1
Les
s: A
ccum
ulat
ed D
epre
ciat
ion
(479
,515
)
(2
,647
,864
)
-
-
-
-
(3
,127
,379
)
Tot
al N
oncu
rren
t Ass
ets
105,
072
1,
429,
700
-
-
-
-
1,53
4,77
2
Tot
al A
sset
s22
7,31
9
3,60
4,49
0
676,
091
4,37
5
162,
981
62
,764
4,73
8,02
0
Cur
rent
Lia
bili
ties
:A
ccou
nts
Pay
able
1,19
3
14
4,05
0
2,
368
-
-
-
14
7,61
1
In
terf
und
Pay
able
195,
552
-
26
7,09
1
1,
195
14
2,01
3
-
60
5,85
1
Tot
al C
urre
nt L
iabi
liti
es19
6,74
5
144,
050
269,
459
1,19
5
142,
013
-
753,
462
Non
curr
ent L
iabi
liti
es:
Com
pens
ated
Abs
ence
s14
,013
18
0,67
3
-
-
-
-
194,
686
Tot
al N
oncu
rren
t Lia
bili
ties
14,0
13
180,
673
-
-
-
-
19
4,68
6
Tot
al L
iabi
liti
es21
0,75
8
324,
723
269,
459
1,19
5
142,
013
-
948,
148
Inve
sted
in C
apit
al A
sset
s,N
et o
f R
elat
ed D
ebt
105,
072
1,
429,
700
-
-
-
-
1,53
4,77
2
Unr
estr
icte
d(8
8,51
1)
1,85
0,06
7
406,
632
3,18
0
20,9
68
62
,764
2,25
5,10
0
Tot
al N
et P
osit
ion
16,5
61$
3,27
9,76
7$
406,
632
$
3,
180
$
20
,968
$
62,7
64$
3,
789,
872
$
LIA
BIL
ITIE
S
NE
T P
OS
ITIO
N
PR
OP
RIE
TA
RY
FU
ND
SA
TL
AN
TIC
CO
UN
TY
SP
EC
IAL
SE
RV
ICE
S S
CH
OO
L D
IST
RIC
T
ST
AT
EM
EN
T O
F N
ET
PO
SIT
ION
JUN
E 3
0, 2
015
TO
TA
L
AS
SE
TS
The
Acc
ompa
nyin
g N
otes
to th
e F
inan
cial
Sta
tem
ents
are
an
inte
gral
par
t of
this
Sta
tem
ent.
43

EX
HIB
IT B
-5
ITIN
ER
AN
T/
FO
OD
SH
AR
ED
SC
HO
OL
SC
OU
NT
YS
TA
TE
JUN
E 3
0,S
ER
VIC
ET
RA
NS
PO
RT
AT
ION
SE
RV
ICE
ST
O C
AR
EE
RS
PR
OG
RA
MS
PR
OG
RA
MS
2015
Ope
rati
ng R
even
ues:
Cha
rges
for
Ser
vice
s:D
aily
Sal
es23
8,48
0$
-
$
-
$
8,21
5$
-$
-
$
246,
695
$
T
rans
port
atio
n F
ees
-
7,55
2,62
3
-
-
-
-
7,55
2,62
3
F
ees
for
Ser
vice
-
-
3,08
2,07
9
-
-
63
,595
3,14
5,67
4
C
ount
y A
id P
aym
ents
-
-
-
-
53
2,19
1
-
53
2,19
1
Tot
al O
pera
ting
Rev
enue
238,
480
7,55
2,62
3
3,
082,
079
8,
215
53
2,19
1
63,5
95
11
,477
,183
Ope
rati
ng E
xpen
ses:
Cos
t of
Sal
es20
9,61
7
-
-
-
-
-
209,
617
S
alar
ies
and
Wag
es23
2,46
5
2,
699,
959
1,36
5,88
6
11,6
95
404,
025
59
,498
4,77
3,52
8
E
mpl
oyee
Ben
efit
s19
4,28
7
2,
616,
183
1,20
8,96
8
-
115,
703
18
,942
4,15
4,08
3
T
rave
l-
-
30
-
3,
094
-
3,12
4
G
ener
al S
uppl
ies
18,0
14
-
-
-
4,
718
-
22,7
32
O
ther
Pur
chas
ed S
ervi
ces
-
-
300,
405
-
-
-
300,
405
T
rans
port
atio
n O
pera
tion
s-
1,
084,
469
-
-
-
-
1,
084,
469
Con
trac
ted
Ser
vice
s-
61
5,77
8
-
-
-
-
61
5,77
8
Dep
reci
atio
n E
xpen
se38
,880
31
3,15
9
-
-
-
-
35
2,03
9
Mis
cell
aneo
us1,
750
13,1
37
1,35
0
-
5,54
3
-
21
,780
Tot
al O
pera
ting
Exp
ense
s69
5,01
3
7,
342,
685
2,87
6,63
9
11,6
95
533,
083
78
,440
11,5
37,5
55
Ope
rati
ng I
ncom
e/(L
oss)
(456
,533
)
20
9,93
8
205,
440
(3,4
80)
(8
92)
(1
4,84
5)
(6
0,37
2)
Non
oper
atin
g R
even
ues
(Exp
ense
s):
Sta
te S
ourc
es:
Sta
te S
choo
l Lun
ch P
rogr
am2,
828
-
-
-
-
-
2,
828
Fed
eral
Sou
rces
:S
choo
l Bre
akfa
st P
rogr
am75
,482
-
-
-
-
-
75,4
82
N
atio
nal S
choo
l Lun
ch P
rogr
am13
4,49
9
-
-
-
-
-
134,
499
F
ood
Dis
trib
utio
n P
rogr
am16
,005
-
-
-
-
-
16,0
05
In
tere
st E
xpen
se-
(2
,788
)
-
-
-
-
(2
,788
)
C
ance
llat
ion
of P
rior
Yea
r P
ayab
les
4,28
0
48
0
55,5
51
-
1,
260
53
0
62
,101
Tot
al N
onop
erat
ing
Rev
enue
(E
xpen
ses)
233,
094
(2,3
08)
55
,551
-
1,26
0
530
288,
127
Oth
er F
inan
cing
Sou
rces
/(U
ses)
:O
pera
ting
Tra
nsfe
rs I
n/(O
ut)
305,
976
-
-
-
-
-
30
5,97
6
Tot
al O
ther
Fin
anci
ng S
ourc
es/(
Use
s)30
5,97
6
-
-
-
-
-
305,
976
Cha
nge
in N
et P
osit
ion
82,5
37
207,
630
26
0,99
1
(3
,480
)
368
(14,
315)
533,
731
T
otal
Net
Pos
itio
n -
Beg
inni
ng(6
5,97
6)
3,
072,
137
145,
641
6,66
0
20,6
00
77
,079
3,25
6,14
1
Tot
al N
et P
osit
ion
- E
ndin
g16
,561
$
3,
279,
767
$
40
6,63
2$
3,18
0$
20,9
68$
62
,764
$
3,78
9,87
2$
TO
TA
L
AT
LA
NT
IC C
OU
NT
Y S
PE
CIA
L S
ER
VIC
ES
SC
HO
OL
DIS
TR
ICT
PR
OP
RIE
TA
RY
FU
ND
SS
TA
TE
ME
NT
OF
RE
VE
NU
ES
, EX
PE
NS
ES
AN
D C
HA
NG
ES
IN
FU
ND
NE
T P
OS
ITIO
NF
OR
TH
E F
ISC
AL
YE
AR
EN
DE
D J
UN
E 3
0, 2
015
The
Acc
ompa
nyin
g N
otes
to th
e F
inan
cial
Sta
tem
ents
are
an
inte
gral
par
t of
this
Sta
tem
ent.
44

EX
HIB
IT B
-6
ITIN
ER
AN
T/
FO
OD
SH
AR
ED
SC
HO
OL
SC
OU
NT
YS
TA
TE
SE
RV
ICE
TR
AN
SP
OR
TA
TIO
NS
ER
VIC
ES
TO
CA
RE
ER
SP
RO
GR
AM
SP
RO
GR
AM
S20
15C
ash
Flo
ws
from
Ope
rati
ng A
ctiv
itie
s:R
ecei
pts
from
Cus
tom
ers
240,
251
$
7,
820,
919
$
3,06
2,36
3$
13,6
80$
593,
009
$
83,0
22$
11,8
13,2
44$
Pay
men
ts to
Em
ploy
ees
(232
,408
)
(2
,744
,525
)
(1,3
65,8
86)
(1
1,69
5)
(4
04,0
25)
(67,
778)
(4,8
26,3
17)
P
aym
ents
for
Em
ploy
ee B
enef
its
(194
,287
)
(2
,616
,183
)
(1,2
08,9
68)
-
(1
15,7
03)
(18,
942)
(4,1
54,0
83)
P
aym
ents
to S
uppl
iers
(212
,282
)
(1
,590
,398
)
(305
,627
)
(3
,335
)
(17,
739)
-
(2,1
29,3
81)
Net
Cas
h F
low
s F
rom
Ope
rati
ng A
ctiv
itie
s(3
98,7
26)
869,
813
18
1,88
2
(1
,350
)
55,5
42
(3,6
98)
70
3,46
3
Cas
h F
low
s F
rom
Cap
ital
Fin
anci
ng A
ctiv
itie
s:P
urch
ase
of E
quip
men
t-
(1
33,7
96)
-
-
-
-
(133
,796
)
In
tere
st P
aid
-
(2,7
88)
-
-
-
-
(2,7
88)
Pri
ncpa
l Pai
d on
Lea
se O
blig
atio
ns-
(1
38,0
34)
-
-
-
-
(138
,034
)
Net
Cas
h F
low
s F
rom
Cap
ital
Fin
anci
ng A
ctiv
itie
s-
(2
74,6
18)
-
-
-
-
(274
,618
)
Cas
h F
low
s F
rom
Non
capi
tal F
inan
cing
Act
ivit
ies:
Cas
h R
ecei
ved
Fro
m S
tate
& F
eder
al P
rogr
ams
212,
499
-
-
-
-
-
21
2,49
9
Ope
rati
ng S
ubsi
diar
ies
and
Tra
nsfe
rs f
rom
/(to
) O
ther
Fun
ds18
6,22
7
(10,
886)
-
1,
195
(5
5,54
2)
-
12
0,99
4
Net
Cas
h F
low
s F
rom
Non
capi
tal F
inan
cing
Act
ivit
ies
398,
726
(1
0,88
6)
-
1,19
5
(55,
542)
-
333,
493
Net
Cha
nge
in C
ash
& C
ash
Equ
ival
ents
-
584,
309
18
1,88
2
(1
55)
-
(3,6
98)
76
2,33
8
Bal
ance
s -
Beg
inni
ng o
f Y
ear
-
935,
574
24
8,93
3
15
5
-
24
,419
1,
209,
081
Bal
ance
s -
End
ing
of Y
ear
-$
1,51
9,88
3$
43
0,81
5$
-
$
-
$
20
,721
$
1,
971,
419
$
Ope
rati
ng I
ncom
e (L
oss)
(456
,533
)$
20
9,93
8$
205,
440
$
(3,4
80)
$
(8
92)
$
(14,
845)
$
(60,
372)
$
A
djus
tmen
ts to
Rec
onci
le O
pera
ting
Inc
ome
(Los
s)to
Cas
h P
rovi
ded
by (
Use
d in
) O
pera
ting
Act
ivit
ies:
Dep
reci
atio
n E
xpen
se38
,880
31
3,15
9
-
-
-
-
352,
039
F
ood
Dis
trib
utio
n P
rogr
am16
,005
-
-
-
-
-
16
,005
C
hang
e in
Ass
ets
& L
iabi
liti
es:
(Inc
reas
e)/D
ecre
ase
in A
ccou
nts
Rec
eiva
ble
1,77
1
26
8,29
6
(19,
716)
5,46
5
60,8
18
19,4
27
336,
061
(I
ncre
ase)
/Dec
reas
e in
Inv
ento
ry6,
220
-
-
-
-
-
6,22
0
In
crea
se/(
Dec
reas
e) in
Acc
ount
s P
ayab
le(5
,126
)
12
2,98
6
(3,8
42)
(3
,335
)
(4,3
84)
-
10
6,29
9
Incr
ease
/(D
ecre
ase)
in C
ompe
nsat
ed A
bsen
ces
57
(4
4,56
6)
-
-
-
(8,2
80)
(5
2,78
9)
Net
Cas
h F
low
s F
rom
Ope
rati
ng A
ctiv
itie
s(3
98,7
26)
$
869,
813
$
18
1,88
2$
(1
,350
)$
55,5
42$
(3,6
98)
$
70
3,46
3$
AT
LA
NT
IC C
OU
NT
Y S
PE
CIA
L S
ER
VIC
ES
SC
HO
OL
DIS
TR
ICT
Rec
onci
liat
ion
of O
pera
ting
Inc
ome/
(Los
s) to
Net
Cas
h F
low
s F
rom
Ope
rati
ng A
ctiv
itie
s:
PR
OP
RIE
TA
RY
FU
ND
SS
TA
TE
ME
NT
OF
CA
SH
FL
OW
SF
OR
TH
E F
ISC
AL
YE
AR
EN
DE
D J
UN
E 3
0, 2
015
TO
TA
L
The
Acc
ompa
nyin
g N
otes
to th
e F
inan
cial
Sta
tem
ents
are
an
inte
gral
par
t of
this
Sta
tem
ent.
45

This page intentionally left blank
46

Fiduciary Fund
47

This page intentionally left blank
48

EXHIBIT B-7
PRIVATEPURPOSE
UNEMPLOYMENTCOMPENSATION STUDENT JUNE 30,
INSURANCE ACTIVITY PAYROLL 2015
Cash & Cash Equivalents 210,146$ 63,667$ 65,885$ 339,698$
Total Assets 210,146 63,667 65,885 339,698
Unemployment Claims Payable 2,883 - - 2,883 Interfund Payable - - 6,282 6,282 Payroll Deductions &
Withholdings - - 59,603 59,603 Due to Student Groups - 63,667 - 63,667
Total Liabilities 2,883 63,667 65,885 132,435
Reserved 207,263 - - 207,263
Total Net Position 207,263$ -$ -$ 207,263$
ATLANTIC COUNTY SPECIAL SERVICES SCHOOL DISTRICT
TOTAL
FIDUCIARY FUNDSSTATEMENT OF FIDUCIARY NET POSITON
JUNE 30, 2015
AGENCY FUNDS
ASSETS
LIABILITIES
NET POSITION
The Accompanying Notes to the Financial Statements are an integral part of this Statement.
49

EXHIBIT B-8
PRIVATEPURPOSE
UNEMPLOYMENTCOMPENSATION JUNE 30,
INSURANCE 2015
Additions:Local Sources:
Employee Salary Deductions 34,329$ 34,329$ Board Contribution 18,000 18,000
Total Operating Revenues 52,329 52,329
Other Sources:Interest on Investments 715 715
Total Additions 53,044 53,044
Deductions:Unemployment Compensation Insurance Claims 21,567 21,567
Total Deductions 21,567 21,567
Change in Net Position 31,477 31,477 Net Position - Beginning of the Year 175,786 175,786
Net Position - End of the Year 207,263$ 207,263$
ATLANTIC COUNTY SPECIAL SERVICES SCHOOL DISTRICTFIDUCIARY FUNDS
STATEMENT OF FIDUCIARY NET POSITIONJUNE 30, 2015
TOTAL
The Accompanying Notes to the Financial Statements are an integral part of this Statement.
50

ATLANTIC COUNTY SPECIAL SERVICES SCHOOL DISTRICT
NOTES TO THE FINANCIAL STATEMENTSJUNE 30, 2015
51

This page intentionally left blank
52

ATLANTIC COUNTY SPECIAL SERVICES SCHOOL DISTRICT (A COMPONENT UNIT OF THE COUNTY OF ATLANTIC)
NOTES TO THE FINANCIAL STATEMENTS
FOR THE YEAR ENDED JUNE 30, 2015
Note 1. Summary of Significant Accounting Policies The financial statements of the Atlantic County Special Services School District (the ‘District”) have been prepared in conformity with generally accepted accounting principles (GAAP) as prescribed by the Governmental Accounting Standards Board (GASB). The following is a summary of more significant accounting policies. For the year ended June 30, 2015, the District implemented the provisions of GASB Statement No. 68, Accounting and Financial Reporting for Pensions, as amended by GASB Statement No. 71, Pension Transition for Contributions Made Subsequent to the Measurement Date. GASB Statement Nos. 68 and 71 establish standards for measuring and recognizing net pension liabilities, deferred outflows of resources, deferred inflows of resources, and expenses/expenditures related to pension benefits provided through defined benefit pension plans. In addition, Statement No. 68 requires disclosure of information related to pension benefits. A. Reporting Entity The Atlantic County Special Services School District is a Type I district located in the County of Atlantic, State of New Jersey. As a Type I district, the School District functions independently through a Board of Education. The Board consists of appointed officials by the County Freeholders and is responsible for the fiscal control of the District. A Superintendent is appointed by the Board and is responsible for the administrative control of the District. The purpose of the district is to educate students in grades 9 through 12. The Atlantic County Special Services School District had an approximate enrollment at June 30, 2015 of 431 students. The primary criterion for including activities within the District’s reporting entity, as set forth in Section 2100 of the GASB Codification of Governmental Accounting and Financial Reporting Standards, is whether:
the organization is legally separate (can sue or be sued in their own name); the District holds the corporate powers of the organization; the District appoints a voting majority of the organization’s board the District is able to impose its will on the organization; the organization has the potential to impose a financial benefit/burden on the District there is a fiscal dependency by the organization on the District.
There were no additional entities required to be included in the reporting entity under the criteria as described above. Furthermore, the District is a component unit of the County of Atlantic, however, the County of Atlantic reports on a regulatory basis of accounting which excludes component units.. B. Component Units GASB Statement No.14. The Financial Reporting Entity, provides guidance that all entities associated with a primary government are potential component units and should be evaluated for inclusion in the financial reporting entity. A primary government is financially accountable not only for the organizations that make up its legal entity but also for legally separate organizations that meet the criteria established by GASB Statement No. 14, as amended by GASB Statement No. 39, Determining Whether Certain Organizations are Component Units. The District had no component units as of and for the year ended June 30, 2015.
53

ATLANTIC COUNTY SPECIAL SERVICES SCHOOL DISTRICT (A COMPONENT UNIT OF THE COUNTY OF ATLANTIC)
NOTES TO THE FINANCIAL STATEMENTS (continued)
FOR THE YEAR ENDED JUNE 30, 2015
Note 1. Summary of Significant Accounting Policies (continued) C. Government-Wide Financial Statements The District’s Government-Wide Financial Statements include a Statement of Net Position and a Statement of Activities. These statements present summaries of Governmental and Business-Type Activities for the District accompanied by a total column. Fiduciary activities of the District are not included in these statements. These statements are presented on an “economic resources” measurement focus and the accrual basis of accounting. Accordingly, all of the District’s assets, deferred outflows of resources, liabilities, and deferred inflows of resources, including capital assets and long-term liabilities, are included in the accompanying Statement of Net Position. The Statement of Activities presents changes in net position. Under the accrual basis of accounting, revenues are recognized in the period in which they are earned while expenses are recognized in the period in which the liability is incurred, regardless of the timing of related cash flows. The types of transactions reported as program revenues for the District are reported in three categories: 1) charges for services, 2) operating grants and contributions, and 3) capital grants and contributions. Certain eliminations have been made to interfund activities, payables, and receivables. All internal balances in the Statement of Net Position have been eliminated except those representing balances between the governmental activities and the business-type activities, which are presented as internal balances and eliminated in the total primary government column. In the Statement of Activities, internal service fund transactions have been eliminated; however, those transactions between governmental and business-type activities have not been eliminated. D. Governmental Fund Financial Statements Governmental fund financial statements include a Balance Sheet and a Statement of Revenues, Expenditures and Changes in Fund Balances for all major governmental funds and non-major funds aggregated. An accompanying schedule (Exhibit B-3) is presented to reconcile and explain the differences in fund balances and changes in fund balances as presented in these statements to the net position and changes in net position presented in the Government-Wide financial statements. The District has presented all major funds that met those qualifications. All governmental funds are accounted for on a spending or “current financial resources” measurement focus and the modified accrual basis of accounting. Accordingly, only current assets and current liabilities are included on the Balance Sheets. (The District’s deferred outflows of resources and deferred inflows of resources are noncurrent.) The Statement of Revenues, Expenditures and Changes in Fund Balances present increases (revenues and other financing sources) and decreases (expenditures and other financing uses) in net current assets. Under the modified accrual basis of accounting, revenues are recognized in the accounting period in which they become both measurable and available to finance expenditures of the current period. Accordingly, revenues are recorded when received in cash, except that revenues subject to accrual (generally 60 days after year-end) are recognized when due. The primary revenue sources, which have been treated as susceptible to accrual by the District, are property tax and intergovernmental revenues and other taxes. Expenditures are recorded in the accounting period in which the related fund liability is incurred.
54

ATLANTIC COUNTY SPECIAL SERVICES SCHOOL DISTRICT (A COMPONENT UNIT OF THE COUNTY OF ATLANTIC)
NOTES TO THE FINANCIAL STATEMENTS (continued)
FOR THE YEAR ENDED JUNE 30, 2015
Note 1. Summary of Significant Accounting Policies (continued) E. Proprietary Fund Financial Statements Proprietary fund financial statements include a Statement of Net Position, a Statement of Revenues, Expenses and Changes in Fund Net Position, and a Statement of Cash Flows for each major proprietary fund and for the non-major funds aggregated. A column representing internal service funds is also presented in these statements. However, internal service funds balances and activities have been combined with the governmental activities in the Government-Wide financial statements. Proprietary funds are accounted for using the “economic resources” measurement focus and the accrual basis of accounting. Accordingly, all assets, deferred outflows of resources, liabilities (whether current or noncurrent), and deferred inflows of resources are included on the Statement of Net Position. The Statement of Revenues, Expenses and Changes in Fund Net Position presents increases (revenues) and decreases (expenses) in total net position. Under the accrual basis of accounting, revenues are recognized in the period in which they are earned while expenses are recognized in the period in which the liability is incurred, regardless of the timing of related cash flows. Operating revenues in the proprietary funds are those revenues that are generated from the primary operations of the fund. All other revenues are reported as non-operating revenues. Operating expenses are those expenses that are essential to the primary operations of the fund. All other expenses are reported as non-operating expenses. F. Fiduciary Fund Financial Statements Fiduciary fund financial statements include a Statement of Net Position. The District’s fiduciary funds are Agency Funds, which are custodial in nature (assets equal liabilities) and do not involve measurement of results of operations. The Agency funds are accounted for on a spending or “economic resources” measurement focus and the accrual basis of accounting as are the proprietary funds explained above. G. Measurement Focus, Basis of Accounting and Financial Statement Presentation The government-wide financial statements are reported using the economic resources measurement focus and the accrual basis of accounting as are the proprietary fund and fiduciary fund financial statements. Revenues are recorded when earned and expenses are recorded when a liability is incurred, regardless of the timing of related cash flows. Property taxes are recognized as revenues in the year in which they are levied. Grants and similar items are recognized as revenue as soon as all eligibility requirements imposed by the provider have been met. Amounts reported as program revenues include 1) charges to customers or applicants for goods, services, or privileges provided, 2) operating grants and contributions, and 3) capital grants and contributions. Internally dedicated resources are reported as general revenues rather than as program revenues. Likewise, general revenues include all taxes.
55

ATLANTIC COUNTY SPECIAL SERVICES SCHOOL DISTRICT (A COMPONENT UNIT OF THE COUNTY OF ATLANTIC)
NOTES TO THE FINANCIAL STATEMENTS (continued)
FOR THE YEAR ENDED JUNE 30, 2015
Note 1. Summary of Significant Accounting Policies (continued) G. Measurement Focus, Basis of Accounting and Financial Statement Presentation (continued) While government-wide and fund financial statements are presented separately, they are interrelated. The governmental activities column of the government wide statements incorporates data from governmental funds and internal service funds, while business-type activities incorporate data from the District’s enterprise funds. Separate financial statements are provided for governmental funds, proprietary funds, and fiduciary funds. However, data from the fiduciary funds is not incorporated in the government-wide financial statements. Governmental fund financial statements are reported using the current financial resources measurement focus and the modified accrual basis of accounting. Revenues are recognized as soon as they are both measurable and available. Revenues are considered to be available when they are collectible within the current period or soon enough thereafter to pay liabilities of the current period. For this purpose, the District considers revenues to be available if they are collected within 60 days of the end of the current fiscal year-end. Expenditures generally are recorded when a liability is incurred, as under accrual accounting. However, debt service expenditures, as well as expenditures related to compensated absences and claims and judgments, are recorded only when payment is due. General capital assets acquisitions are reported as expenditures in the governmental funds. Issuance of long-term debt and acquisitions under capital leases are reported as other financing sources. Property taxes, charges for services, licenses, and interest on notes receivable associated with the current fiscal period are all considered to be susceptible to accrual and accordingly have been recognized as revenues of the current fiscal period. Entitlements are recorded as revenues when all eligibility requirements are met, including any time requirements, and the amount is received during the period or within the availability period for this revenue source (within 60 days of year-end). Expenditure-driven grants are recognized as revenue when the qualifying expenditures have been incurred and all eligibility requirements have been met, and the amount is received during the period or within the availability period for this revenue source (within 60 days of year-end). All other revenue items are considered to be measurable and available when cash is received. Proprietary funds distinguish operating revenues and expenses from non-operating items. Operating revenues and expenses generally result from providing services and producing and delivering goods in connection with a proprietary fund’s principal ongoing operations. The principal operating revenues of the enterprise funds are charges to customers for sales and services. Operating expenses for enterprise funds include the cost of sales and services, employee salaries and benefits, administrative expenses, and depreciation on capital assets. All revenues and expenses not meeting this definition are reported as non-operating revenues and expenses. When both restricted and unrestricted resources are available for use, it is District policy to use restricted resources first, then unrestricted resources as they are needed. Internal service funds are used to account for those operations which provide benefits to other funds, departments, or agencies of the primary government and its component unit. Although internal service funds are reported as a proprietary fund in the fund financial statements, it is incorporated into governmental activities in the government-wide financial statements. The District does not maintain any internal service funds.
56

ATLANTIC COUNTY SPECIAL SERVICES SCHOOL DISTRICT (A COMPONENT UNIT OF THE COUNTY OF ATLANTIC)
NOTES TO THE FINANCIAL STATEMENTS (continued)
FOR THE YEAR ENDED JUNE 30, 2015
Note 1. Summary of Significant Accounting Policies (continued) G. Measurement Focus, Basis of Accounting and Financial Statement Presentation (continued) The District reports the following major governmental funds:
General Fund - The general fund is the general operating fund of the District and is used to account for all financial resources except those required to be accounted for in another fund. Included are certain expenditures for vehicles and movable instructional or noninstructional equipment which are classified in the Capital Outlay sub-fund. As required by the New Jersey Department of Education the District includes budgeted capital outlay in this fund. Generally accepted accounting principles as they pertain to governmental entities state that General Fund resources may be used to directly finance capital outlays for long-lived improvements as long as the resources in such cases are derived exclusively from unrestricted revenues. Resources for budgeted capital outlay purposes are normally derived from State of New Jersey Aid, interest earnings and appropriated fund balance. Expenditures are those that result in the acquisition of or additions to capital assets for land, existing buildings, improvements of grounds, construction of buildings, additions to or remodeling of buildings and the purchase of built-in equipment. These resources can be transferred from and to Current Expense by board resolution. Special Revenue Fund - The Special Revenue Fund is used to account for the proceeds of specific revenue from State and Federal Government, (other than major capital projects, Debt Service or the Enterprise Funds) and local appropriations that are legally restricted to expenditures for specified purposes. Capital Projects Fund - The capital projects fund is used to account for all financial resources to be used for the acquisition or construction of major capital facilities (other than those financed by proprietary funds).
The District reports the following major proprietary funds:
Food Service Fund – This fund accounts for the revenues and expenses pertaining to the District’s cafeteria operations. Transportation Fund – This fund accounts for the revenues and expenses pertaining to the transportation services provided to other districts within the State. Itinerant/Shared Services Fund – This fund accounts for the revenues and expenses pertaining to the various itinerant services provided to other districts within the County. This fund also accounts for the shared service agreements with the Atlantic County Institute of Technology. State Programs Fund – This fund accounts for the revenues and expenses pertaining to the educational programs and services provided through a contract with the State of New Jersey, Department of Human Services, Juvenile Justice Commission.
57

ATLANTIC COUNTY SPECIAL SERVICES SCHOOL DISTRICT (A COMPONENT UNIT OF THE COUNTY OF ATLANTIC)
NOTES TO THE FINANCIAL STATEMENTS (continued)
FOR THE YEAR ENDED JUNE 30, 2015
Note 1. Summary of Significant Accounting Policies (continued) G. Measurement Focus, Basis of Accounting and Financial Statement Presentation (continued)
Schools to Careers Fund – This fund accounts for the revenues and expenses pertaining to the Schools to Careers Program that provides activities in a non-traditional community based system that ensures appropriate employment for the graduates. County Projects Fund – This fund accounts for the revenues and expenses pertaining to agreements with Atlantic County government to provide educational services for the County.
Additionally, the District reports the following major fiduciary funds:
Private Purpose Trust Funds - Private-purpose trust funds are used to account for the principal and income for trust arrangements that benefit individuals, private organizations, or other governments. The district currently maintains the following private purpose trust funds:
Unemployment Trust Fund – Revenues consist of employee payroll withholdings, interest income, and contributions through the annual budget process of the District. Expenditures consist of unemployment reimbursement claims.
Agency Funds - Agency funds are assets held by a governmental entity (either as trustee or as an agent) for other parties that cannot be used to finance the governmental entity’s own operating programs. The district currently maintains Payroll funds and Student Activity Funds as Agency Funds.
During the course of operations, the District has activity between funds for various purposes. Any residual balances outstanding at year end are reported as due from/to other funds and advances to/from other funds. While these balances are reported in fund financial statements, certain eliminations are made in the preparation of the government-wide financial statements. Balances between the funds included in governmental activities (i.e., the governmental funds and internal service funds) are eliminated so that only the net amount is included as internal balances in the governmental activities column. Similarly, balances between the funds included in business-type activities (i.e., the enterprise funds) are eliminated so that only the net amount is included as internal balances in the business-type activities column. Further, certain activity occurs during the year involving transfers of resources between funds. In fund financial statements these amounts are reported at gross amounts as transfers in/out. While reported in fund financial statements, certain eliminations are made in the preparation of the government-wide financial statements. Transfers between the funds included in governmental activities are eliminated so that only the net amount is included as transfers in the governmental activities column. Similarly, balances between the funds included in business-type activities are eliminated so that only the net amount is included as internal balances in the business-type activities column.
58

ATLANTIC COUNTY SPECIAL SERVICES SCHOOL DISTRICT (A COMPONENT UNIT OF THE COUNTY OF ATLANTIC)
NOTES TO THE FINANCIAL STATEMENTS (continued)
FOR THE YEAR ENDED JUNE 30, 2015
Note 1. Summary of Significant Accounting Policies (continued) H. Budgets/Budgetary Control Annual appropriated budgets are prepared in the spring of each year for the general, special revenue and debt service funds. The budgets are submitted to the county office. In accordance with P.L.2011 c.202, which became effective January 17, 2012, the District eliminated the April annual voter referendum on budgets which met the statutory tax levy cap limitations and the board of education members are elected at the November general election. Budgets are prepared using the modified accrual basis of accounting. The legal level of budgetary control is established at line item accounts within each fund. Line item accounts are defined as the lowest (most specific) level of detail as established pursuant to the minimum chart of accounts referenced in N.J.A.C. 6A:23-2-2(f)1. Transfers of appropriations may be made by School Board resolution at any time during the fiscal year in accordance with N.J.A.C. 6A:23-2-11. Formal budgetary integration into the accounting system is employed as a management control device during the year. For governmental funds there are no substantial differences between the budgetary basis of accounting and generally accepted accounting principles with the exception of the legally mandated revenue recognition of the last state aid payment for budgetary purposes only and the special revenue fund as noted below. Encumbrance accounting is also employed as an extension of formal budgetary integration in the governmental fund types. Unencumbered appropriations lapse at fiscal year-end. The accounting records of the special revenue fund are maintained on the grant accounting budgetary basis. The grant accounting budgetary basis differs from GAAP in that the grant accounting budgetary basis recognizes encumbrances as expenditures and also recognizes the related revenues, whereas the GAAP basis does not. Sufficient supplemental records are maintained to allow for the presentation of GAAP basis financial reports. The budget, as detailed on Exhibit C-1 and Exhibit C-2, includes all amendments to the adopted budget, if any. Exhibit C-3 presents a reconciliation of the general fund revenues and special revenue fund revenues and expenditures from the budgetary basis of accounts as presented in the General Fund Budgetary Comparison Schedules and the Special Revenue Fund Budgetary Comparison Schedule to the GAAP basis of accounting as presented in the Statement of Revenues, Expenditures and Changes in Fund Balance – Governmental Funds. Note that the District does not report encumbrances outstanding at fiscal year-end as expenditures in the general fund since the general fund budget follows modified accrual basis with the exception of the revenue recognition policy for the last state aid payments. I. Encumbrances Under encumbrance accounting purchase orders, contracts and other commitments for the expenditure of resources are recorded to reserve a portion of the applicable appropriation. Open encumbrances in governmental funds other than the special revenue fund are reported as assigned fund balances at fiscal year-end as they do not constitute expenditures or liabilities but rather commitments related to unperformed contracts for goods and services.
59

ATLANTIC COUNTY SPECIAL SERVICES SCHOOL DISTRICT (A COMPONENT UNIT OF THE COUNTY OF ATLANTIC)
NOTES TO THE FINANCIAL STATEMENTS (continued)
FOR THE YEAR ENDED JUNE 30, 2015
Note 1. Summary of Significant Accounting Policies (continued) I. Encumbrances (continued) Open encumbrances in the special revenue fund for which the District has received advances are reflected in the balance sheet as a reduction of the accounts receivables or as unearned revenue at fiscal year-end. The encumbered appropriation authority carries over into the next fiscal year. An entry will be made at the beginning of the next fiscal year to increase the appropriation reflected in the certified budget by the outstanding encumbrance amount as of the current fiscal year-end. J. Cash and Cash Equivalents Cash and Cash equivalents include petty cash, change funds, cash in banks and all highly liquid investments with a maturity of three months or less at the time of purchase and are stated at cost plus accrued interest. U.S. Treasury and agency obligations and certificates of deposit with maturities of one year or less when purchased are stated at cost. New Jersey School Districts are limited as to the types of investments and types of financial institutions they may invest in. N.J.S.18A:20-37 provides a list of permissible investments that may be purchased by New Jersey school districts. Additionally, the District has adopted a cash management plan that requires it to deposit public funds in public depositories protected from loss under the provisions of the Governmental Unit Deposit Protection Act (“GUDPA”). GUDPA was enacted in 1970 to protect Governmental Units from loss of funds on deposit with a failed banking institution in New Jersey. N.J.S.A.17:9-41 et. seq. establishes the requirements for the security of deposits of governmental units. The statute requires that no governmental unit shall deposit public funds in a public depository unless such funds are secured in accordance with the Act. Public depositories include Savings and Loan institutions, banks (both state and national banks) and savings banks the deposits of which are federally insured. All public depositories must pledge collateral, having a market value at least equal to five percent of the average daily balance of collected public funds, to secure the deposits of Governmental Units. If a public depository fails, the collateral it has pledged, plus the collateral of all other public depositories, is available to pay the full amount of their deposits to the Governmental Units. K. Tuition Payable/Receivable Tuition rates for the fiscal year end June 30, 2015 were established by the receiving district based on estimated costs. The charges are subject to adjustment when the final costs have been determined. L. Inventories Inventories are valued at cost, using the first-in/first-out (FIFO) method. The costs of inventories are recorded as expenditures when consumed rather when purchased.
60

ATLANTIC COUNTY SPECIAL SERVICES SCHOOL DISTRICT (A COMPONENT UNIT OF THE COUNTY OF ATLANTIC)
NOTES TO THE FINANCIAL STATEMENTS (continued)
FOR THE YEAR ENDED JUNE 30, 2015
Note 1. Summary of Significant Accounting Policies (continued) M. Short-Term Interfund Receivables/Payables Short-term interfund receivables/payables represent amounts that are owed, other than charges for goods or services rendered to/from a particular fund in the District and that are due within one year. The amounts are eliminated in the governmental and business-type activities, which are presented as Internal Balances. Balances with fiduciary funds are not considered Internal Balances; therefore those balances are reported on the Statement of Net Position. N. Capital Assets Capital assets are reported in the applicable governmental or business-type activities column in the government-wide financial statements. Purchased or constructed assets are recorded at actual cost or estimated historical cost if actual cost is unavailable. Donated capital assets are recorded at estimated fair value at the date of donation. The District has established a threshold of $2,000 for capitalization of depreciable assets. Major outlays for capital assets and improvements are capitalized as projects are constructed. The costs of normal maintenance and repairs that do not add to the value of the asset or materially extend asset lives are not capitalized. Capital assets of the District are depreciated or amortized using the straight-line method over the following estimated lives: Equipment & Vehicles 3 – 20 Years Buildings 30 – 50 Years Improvements 10 – 50 Years Software 5 – 7 Years O. Compensated Absences Compensated absences are those absences for which employees will be paid, such as vacation, sick leave and sabbatical leave. A liability for compensated absences that are attributable to services already rendered, and that are not contingent on a specific event that is outside the control of the District and its employees, is accrued as the employees earn the rights to the benefits. Compensated absences that relate to future services, or that are contingent on a specific event that is outside the control of the District and its employees, are accounted for in the period in which such services are rendered or in which such events take place. In the Government-Wide financial statements, under governmental activities and business-type activities, compensated absences are reported as an expenditure and noncurrent liabilities. P. Unearned Revenue Unearned revenue arises when assets are recognized before revenue recognition criteria have been satisfied and is recorded as a liability until the revenue is both measureable and the District is eligible to realize the revenue.
61

ATLANTIC COUNTY SPECIAL SERVICES SCHOOL DISTRICT (A COMPONENT UNIT OF THE COUNTY OF ATLANTIC)
NOTES TO THE FINANCIAL STATEMENTS (continued)
FOR THE YEAR ENDED JUNE 30, 2015
Note 1. Summary of Significant Accounting Policies (continued) Q. Accrued Liabilities and Long-Term Obligations All payables, accrued liabilities, and long-term obligations are reported in the government-wide financial statements, and all payables, accrued liabilities and long-term obligations payable from proprietary funds are reported on the proprietary fund financial statements. In general, government fund payables and accrued liabilities that, once incurred, are paid in a timely manner and in full from current financial resources, are reported as obligations of the funds. However, claims and judgments, compensated absences, special termination benefits and contractually required pension contributions that will be paid from governmental funds, are reported as a liability in the fund financial statements only to the extent that they are normally expected to be paid with expendable available financial resources. R. Use of Estimates The preparation of financial statements in conformity with accounting principles generally accepted in the United States of America requires management to make estimates and assumption that affect certain reported amounts and disclosures. Accordingly, actual results could differ from those estimates. S. Fund Balance In accordance with Government Accounting Standards Board 54, Fund Balance Reporting and Governmental Fund Type Definitions, the District classifies governmental fund balances as follows:
Non-spendable – This classification includes amounts that cannot be spent because they are either not in spendable form or are legally or contractually required to be maintained intact. Non-spendable items are not expected to be converted to cash or are not expected to be converted to cash within the next year.
Restricted – This classification includes amounts for which constraints have been placed on the use of the resources either externally imposed by creditors (such as through a debt covenant), grantors, contributors, or laws or regulations of other governments, or imposed by law through constitutional provisions or enabling legislation.
Committed – This classification includes amounts that can be used only for specific purposes pursuant to constraints imposed by formal action of the Board of Education. These amounts cannot be used for any other purpose unless the Board of Education removes or changes the specified use by taking the same type of action (resolution) that was employed when the funds were initially committed. This classification also includes contractual obligations to the extent that existing resources have been specifically committed for use in satisfying those contractual requirements. The School Board did not have any committed resources as of June 30, 2015.
Assigned – This classification includes amounts that are constrained by the School District’s intent to be used for a specific purpose but are neither restricted nor committed. This intent can be expressed by the Board of Education or through the Board of Education delegating this responsibility to the business administrator through the budgetary process. This classification also includes the remaining positive fund balance for all governmental funds except for the General Fund.
Unassigned – This classification includes the residual fund balance for the General Fund. The Unassigned classification also includes negative residual fund balance of any other governmental fund that cannot be eliminated by offsetting of Assigned fund balance amounts.
62

ATLANTIC COUNTY SPECIAL SERVICES SCHOOL DISTRICT (A COMPONENT UNIT OF THE COUNTY OF ATLANTIC)
NOTES TO THE FINANCIAL STATEMENTS (continued)
FOR THE YEAR ENDED JUNE 30, 2015
Note 1. Summary of Significant Accounting Policies (continued) S. Fund Balance (continued) When an expenditure is incurred for purposes for which both restricted and unrestricted fund balance is available, it is the District’s policy to consider restricted funds to have been spent first. When an expenditure is incurred for which committed, assigned, or unassigned fund balances are available, it is the District’s policy to consider amounts to have been spent first out of committed funds, then assigned funds, and finally unassigned funds, as needed, unless the Board has provided otherwise in its commitment or assignment actions. T. Net Position Net position, represents the difference between summation of assets and deferred outflows of resources, and the summation of liabilities and deferred inflows of resources. Net position is classified in the following three components:
Net Investment in Capital Assets – This component represents capital assets, net of accumulated depreciation, net of outstanding balances of borrowings used for acquisition, construction, or improvement of those assets.
Restricted – Net position is reported as restricted when there are limitations imposed on their use either through the enabling legislation adopted by the District or through external restrictions imposed by creditors, grantors or laws or regulations of other governments.
Unrestricted – Net position is reported as unrestricted when it does not meet the criteria of the other two components of net position.
U. Impact of Recently Issued Accounting Principles Adopted Accounting Pronouncements
For the year ended June 30, 2015, the District implemented GASB Statement No. 68 Accounting and Financial Reporting for Pensions – (Amendment to GASB Statement No. 27) and GASB Statement No. 71, Pension Transition for Contributions Made Subsequent to the Measurement Date. The implementation of the Statements requires the District to report as an asset and/or a liability its portion of the collective net pension’s asset and liability of the New Jersey Public Employees’ Retirement System (PERS). The implementation of the Statements also requires the District to report a deferred outflow and/or inflow for the effect of the net change in the District’s proportion of the collective net pension asset and/or liability and difference during the measurement period between the District’s contributions and its proportionate share of total contributions to the pension systems not included in pension expense. Also included as a deferred outflow is the District contributions to the pension system subsequent to the measurement date.
63

ATLANTIC COUNTY SPECIAL SERVICES SCHOOL DISTRICT (A COMPONENT UNIT OF THE COUNTY OF ATLANTIC)
NOTES TO THE FINANCIAL STATEMENTS (continued)
FOR THE YEAR ENDED JUNE 30, 2015
Note 1. Summary of Significant Accounting Policies (continued) U. Impact of Recently Issued Accounting Principles (continued) Recently Issued and Adopted Accounting Pronouncements The District has adopted and implemented all current standards of the Governmental Accounting Standards Board (GASB) that are applicable as of June 30, 2015. GASB has issued Statement No. 72, Fair Value Measurement and Application, effective for the year ending June 30, 2016 GASB has issued Statement No. 75, Accounting and Financial Reporting for Post-employment Benefits Other than Pensions, effective for the year ending June 30, 2018. This Statement replaces the requirements of Statement No. 45, Accounting and Financial Reporting by Employers for Post- employment Benefits Other Than Pensions, as amended, and No. 57, OPEB Measurements by Agency Employers and Agent Multi-Employer Plans, for OPEB Statement No. 74, Financial Reporting for Post-employment Benefit Plans Other Than Pension Plans, establishes new accounting and financial reporting requirements for OPEB Plans. GASB has issued Statement No. 76, The Hierarchy of Generally Accepted Accounting Principles for State and Local Governments, effective for the year ending June 30, 2016. The District will evaluate the impact each of these pronouncements may have on its financial statements and will implement them as applicable and when material. V. Deferred Outflows and Deferred Inflows of Resources In addition to assets, the statement of net position reports a separate section for deferred outflows of resources. This separate financial statement element, deferred outflows of resources, represents a consumption of net position that applies to a future period(s) and so will not be recognized as an outflow of resources (expense/expenditure) until then. In addition to liabilities, the statement of net position reports a separate section for deferred inflows of resources. This separate financial statement element, deferred inflows of resources, represents an acquisition of net position that applies to a future periods and so will not be recognized as an inflow of resources (revenue) until that time. W. Pensions For purposes of measuring the net pension liability, deferred outflows of resources and deferred inflows of resources related to pensions, and pension expense, information about the pension plan’s fiduciary net position and additions to/deductions from the plan’s fiduciary net position have been determined on the same basis as they are reported by the plan. For this purpose, benefit payments (including refunds of employee contributions) are recognized when due and payable in accordance with the benefit terms. Investments are reported at fair value.
64

ATLANTIC COUNTY SPECIAL SERVICES SCHOOL DISTRICT (A COMPONENT UNIT OF THE COUNTY OF ATLANTIC)
NOTES TO THE FINANCIAL STATEMENTS (continued)
FOR THE YEAR ENDED JUNE 30, 2015
Note 1. Summary of Significant Accounting Policies (continued) X. Subsequent Events The District has evaluated subsequent events occurring after June 30, 2015 through the date of December 8, 2015, which is the date the financial statements were available to be issued. Note 2. Cash Deposits and Investments A. Cash Deposits Custodial Credit Risk – Custodial credit risk is the risk that, in the event of a bank failure, the Board’s deposits may not be recovered. Although the Board does not have a formal policy regarding custodial credit risk, NJSA 17:9-41 et seq. requires that the governmental units shall deposit public funds in public depositories protected from loss under the provisions of GUDPA. Under the Act, the first $250,000 of governmental deposits in each insured depository is protected by FDIC. Public fund owned by the Board in excess of FDIC insured amounts are protected by GUDPA. However, GUDPA does not protect intermingled trust funds such as salary withholdings, bail funds or funds that may pass to the Board relative to the happening of a future condition. Such funds are shown as Uninsured and Uncollateralized in the schedule below. As of June 30, 2015, the District’s bank balance of $3,377,526 was insured or collateralized as shown below: Insured under FDIC $ 250,000 Uninsured and uncollateralized 318,025 Collateralized in the District’s name under GUDPA 2,809,501 Total $ 3,377,526 B. Investments New Jersey statues permit the Board to purchase the following types of securities:
1. Bonds and other obligations of the United State or obligations guaranteed by the United States. 2. Bonds of any Federal Intermediate Credit Bank, Federal Home Loan Bank, Federal National
Mortgage Agency or of any United States Bank, which have a maturity date not greater than twelve months from the date of purchase.
3. New Jersey Cash Management Fund, New Jersey Asset and Rebate Management Fund and MBIA CLASS.
Custodial credit risk - This is the risk that in the event of the failure of the counterparty (e.g., broker-dealer) to a transaction, a government will not be able to recover the value of its investment or collateral securities that are in the possession of another party. The District does not have custodial credit risk policies for investments.
65

ATLANTIC COUNTY SPECIAL SERVICES SCHOOL DISTRICT (A COMPONENT UNIT OF THE COUNTY OF ATLANTIC)
NOTES TO THE FINANCIAL STATEMENTS (continued)
FOR THE YEAR ENDED JUNE 30, 2015
Note 2. Cash Deposits and Investments B. Investments (continued) Interest rate risk - This is the risk that changes in market interest rates will adversely affect the fair value of an investment. Generally, the longer the maturity of an investment, the greater the sensitivity of its fair value to changes in market interest rates. The District does not have a formal investment policy that limits investment maturities as a means of managing its exposure to fair value losses arising from increasing interest rates. Credit risk - Generally, credit risk is the risk that an issuer of a debt type investment will not fulfill its obligation to the holder of the investment. This is measured by assignment of a rating by a nationally recognized rating organization. U.S. Government securities or obligations explicitly guaranteed by the U.S. government are not considered to have credit risk exposure. Concentrations - The District places no limit in the amount the District may invest in any one issuer The District did not hold any investments at June 30, 2015. Note 3. Reserve Accounts A. Capital Reserve
A capital reserve account was established by the Atlantic County Special Services School District on September 28, 2000, for the accumulation of funds for use as capital outlay expenditures in subsequent fiscal years. The capital reserve account is maintained in the general fund and its activity is included in the general fund annual budget. Funds placed in the capital reserve account are restricted to capital projects in the district’s approved Long Range Facilities Plan (LRFP). Upon submission of the LRFP to the department, a district may increase the balance in the capital reserve by appropriating funds in the annual general fund budget certified for taxes or by transfer by Board resolution at year-end of any unanticipated revenue or unexpended line-item appropriation amounts, or both. A district may also appropriated additional amounts when the express approval of the voters has been obtained either by a separate proposal at budget time or by a special question at one of the four special elections authorized pursuant to N.J.S.A.19:60-2. Pursuant to N.J.A.C.6:23A-14.1(g), the balance in the account cannot at any time exceed the local support costs of uncompleted capital projects in its approved LRFP. The activity of the capital reserve for the July 1, 2014 to June 30, 2015 fiscal year is as follows:
Beginning Balance, July 1, 2014 $ 184,416 Increases: Budget Appropriation 73,598 Transfer Authorized June 22, 2015 52,128 Transfer from Capital Projects Fund 52,999 Interest Earned 908
Ending Balance, June 30, 2015 $ 364,049
66
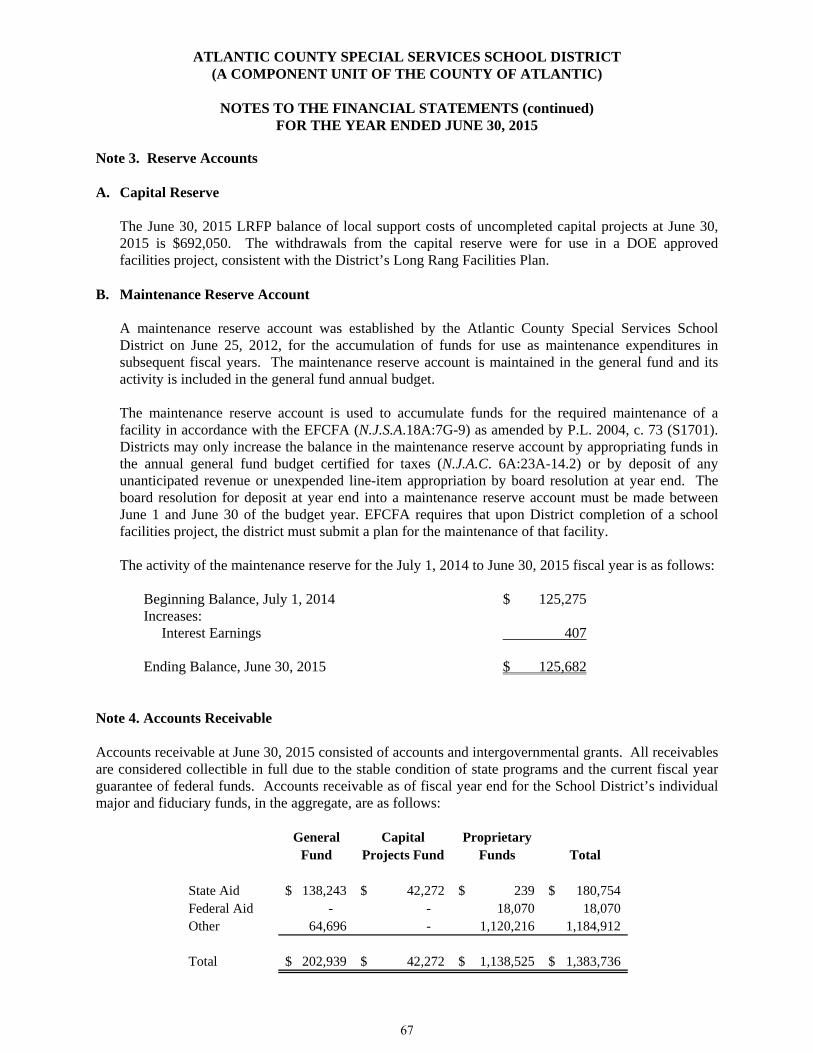
ATLANTIC COUNTY SPECIAL SERVICES SCHOOL DISTRICT (A COMPONENT UNIT OF THE COUNTY OF ATLANTIC)
NOTES TO THE FINANCIAL STATEMENTS (continued)
FOR THE YEAR ENDED JUNE 30, 2015
Note 3. Reserve Accounts A. Capital Reserve
The June 30, 2015 LRFP balance of local support costs of uncompleted capital projects at June 30, 2015 is $692,050. The withdrawals from the capital reserve were for use in a DOE approved facilities project, consistent with the District’s Long Rang Facilities Plan.
B. Maintenance Reserve Account
A maintenance reserve account was established by the Atlantic County Special Services School District on June 25, 2012, for the accumulation of funds for use as maintenance expenditures in subsequent fiscal years. The maintenance reserve account is maintained in the general fund and its activity is included in the general fund annual budget.
The maintenance reserve account is used to accumulate funds for the required maintenance of a facility in accordance with the EFCFA (N.J.S.A.18A:7G-9) as amended by P.L. 2004, c. 73 (S1701). Districts may only increase the balance in the maintenance reserve account by appropriating funds in the annual general fund budget certified for taxes (N.J.A.C. 6A:23A-14.2) or by deposit of any unanticipated revenue or unexpended line-item appropriation by board resolution at year end. The board resolution for deposit at year end into a maintenance reserve account must be made between June 1 and June 30 of the budget year. EFCFA requires that upon District completion of a school facilities project, the district must submit a plan for the maintenance of that facility. The activity of the maintenance reserve for the July 1, 2014 to June 30, 2015 fiscal year is as follows:
Beginning Balance, July 1, 2014 $ 125,275 Increases: Interest Earnings 407
Ending Balance, June 30, 2015 $ 125,682 Note 4. Accounts Receivable Accounts receivable at June 30, 2015 consisted of accounts and intergovernmental grants. All receivables are considered collectible in full due to the stable condition of state programs and the current fiscal year guarantee of federal funds. Accounts receivable as of fiscal year end for the School District’s individual major and fiduciary funds, in the aggregate, are as follows:
General Capital ProprietaryFund Projects Fund Funds Total
State Aid 138,243$ 42,272$ 239$ 180,754$ Federal Aid - - 18,070 18,070 Other 64,696 - 1,120,216 1,184,912
Total 202,939$ 42,272$ 1,138,525$ 1,383,736$
67

ATLANTIC COUNTY SPECIAL SERVICES SCHOOL DISTRICT (A COMPONENT UNIT OF THE COUNTY OF ATLANTIC)
NOTES TO THE FINANCIAL STATEMENTS (continued)
FOR THE YEAR ENDED JUNE 30, 2015
Note 5. Transfers to Capital Outlay During the year ending June 30, 2015, the District made no transfers to capital outlay. Note 6. Capital Assets Capital assets activity for the year ended June 30, 2015 was as follows:
June 30, Transfers/ June 30,2014 Additions Adjustments 2015
Governmental Activities:Capital assets not being depreciated:
Land 636,272$ -$ -$ 636,272$ Construction in progress 3,957 - (3,957) -
Total capital assets not being depreciated 640,229 - (3,957) 636,272
Capital assets being depreciated:Buildings and improvements 28,896,804 188,887 3,975 29,089,666 Machinery and equipment 4,208,982 56,123 (879,538) 3,385,567
Historical cost 33,105,786 245,010 (875,563) 32,475,233
Less: accumulated depreciation:Buildings and improvements (8,822,221) (745,947) 749,723 (8,818,445) Machinery and equipment (2,894,669) (52,132) 145,657 (2,801,144)
Total accumulated depreciation (11,716,890) (798,079) 895,380 (11,619,589)
Total capital assets being depreciated, net 21,388,896 (553,069) 19,817 20,855,644
Governmental activities capital assets, net 22,029,125$ (553,069)$ 15,860$ 21,491,916$
68

ATLANTIC COUNTY SPECIAL SERVICES SCHOOL DISTRICT (A COMPONENT UNIT OF THE COUNTY OF ATLANTIC)
NOTES TO THE FINANCIAL STATEMENTS (continued)
FOR THE YEAR ENDED JUNE 30, 2015
Note 6. Capital Assets (continued)
June 30, Transfers/ June 30,2014 Additions Adjustments 2015
Business-Type Activities:Capital assets not being depreciated:
Land 73,500$ -$ -$ 73,500$
Total capital assets not being depreciated 73,500 - - 73,500
Capital assets being depreciated:Buildings and improvements 510,210 - - 510,210 Equipment 3,944,308 133,130 1,003 4,078,441
Historical cost 4,454,518 133,130 1,003 4,588,651
Less: accumulated depreciation:Buildings and improvements (178,345) (13,661) 13,161 (178,845) Equipment (2,596,659) (338,377) (13,498) (2,948,534)
Total accumulated depreciation (2,775,004) (352,038) (337) (3,127,379)
Total capital assets being depreciated, net 1,679,514 (218,908) 666 1,461,272
Business-type activities capital assets, net 1,753,014$ (218,908)$ 666$ 1,534,772$
Depreciation expense was charged to governmental and business-type functions/programs as follows:
Governmental Activities:Unallocated 798,079$
Total Depreciation Expense - Governmental Activites 798,079$
Business-Type Activities:Food Service Fund 352,039$
Total Depreciation Expense - Business-Type Activites 352,039$
69

ATLANTIC COUNTY SPECIAL SERVICES SCHOOL DISTRICT (A COMPONENT UNIT OF THE COUNTY OF ATLANTIC)
NOTES TO THE FINANCIAL STATEMENTS (continued)
FOR THE YEAR ENDED JUNE 30, 2015
Note 7. Interfund Receivables and Payables Individual fund receivables/payables balances at June 30, 2015 are as follows:
Interfund InterfundFund Receivable Payable
Governmental Funds 633,644$ 96,602$ Proprietary Funds 75,091 605,851 Fiduciary Funds - 6,282
708,735$ 708,735$
The interfund receivables and payables above predominately resulted from payment made by certain funds on behalf of other funds. All interfund balances are expected to be repaid within one year. The summary of interfund transfers follows:
Fund Transfers In Transfers Out
General Fund 52,999$ 305,976$ Enterprise Funds 305,976 52,999
358,975$ 358,975$
The purpose of interfund transfers were for the liquidation of prior year interfund receivables and payables and for payments made on behalf of other funds. Note 8. Long-Term Obligations During the fiscal year ended June 30, 2015 the following changes occurred in liabilities reported in the governmental activities long-term obligations account group:
June 30, June 30, Amounts Due2014 Increased Decreased 2015 Within One Year
Governmental activities: Net Pension Liability 23,359,742$ 58,213$ -$ 23,417,955$ -$
Compensatedabsences payable 580,695 - 18,517 562,178 -
Total 23,940,437$ 58,213$ 18,517$ 23,980,133$ -$
70
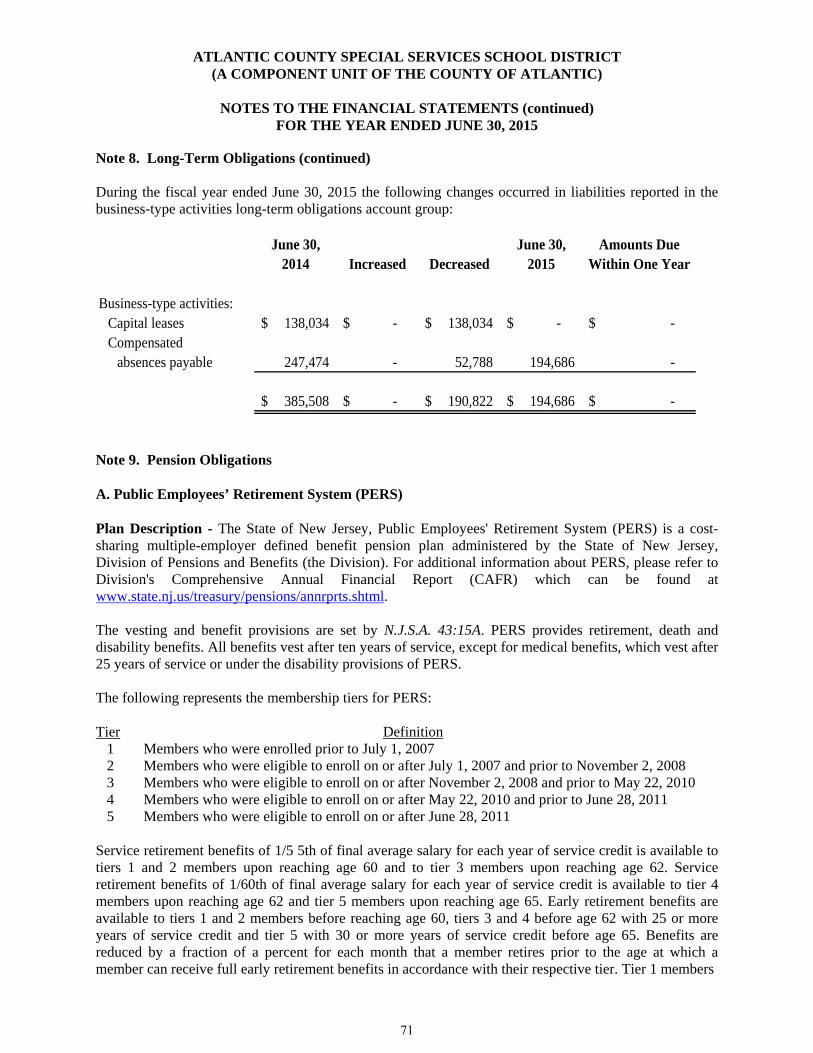
ATLANTIC COUNTY SPECIAL SERVICES SCHOOL DISTRICT (A COMPONENT UNIT OF THE COUNTY OF ATLANTIC)
NOTES TO THE FINANCIAL STATEMENTS (continued)
FOR THE YEAR ENDED JUNE 30, 2015
Note 8. Long-Term Obligations (continued) During the fiscal year ended June 30, 2015 the following changes occurred in liabilities reported in the business-type activities long-term obligations account group:
June 30, June 30, Amounts Due2014 Increased Decreased 2015 Within One Year
Business-type activities:Capital leases 138,034$ -$ 138,034$ -$ -$ Compensated
absences payable 247,474 - 52,788 194,686 -
385,508$ -$ 190,822$ 194,686$ -$
Note 9. Pension Obligations A. Public Employees’ Retirement System (PERS) Plan Description - The State of New Jersey, Public Employees' Retirement System (PERS) is a cost-sharing multiple-employer defined benefit pension plan administered by the State of New Jersey, Division of Pensions and Benefits (the Division). For additional information about PERS, please refer to Division's Comprehensive Annual Financial Report (CAFR) which can be found at www.state.nj.us/treasury/pensions/annrprts.shtml. The vesting and benefit provisions are set by N.J.S.A. 43:15A. PERS provides retirement, death and disability benefits. All benefits vest after ten years of service, except for medical benefits, which vest after 25 years of service or under the disability provisions of PERS. The following represents the membership tiers for PERS: Tier Definition 1 Members who were enrolled prior to July 1, 2007 2 Members who were eligible to enroll on or after July 1, 2007 and prior to November 2, 2008 3 Members who were eligible to enroll on or after November 2, 2008 and prior to May 22, 2010 4 Members who were eligible to enroll on or after May 22, 2010 and prior to June 28, 2011 5 Members who were eligible to enroll on or after June 28, 2011 Service retirement benefits of 1/5 5th of final average salary for each year of service credit is available to tiers 1 and 2 members upon reaching age 60 and to tier 3 members upon reaching age 62. Service retirement benefits of 1/60th of final average salary for each year of service credit is available to tier 4 members upon reaching age 62 and tier 5 members upon reaching age 65. Early retirement benefits are available to tiers 1 and 2 members before reaching age 60, tiers 3 and 4 before age 62 with 25 or more years of service credit and tier 5 with 30 or more years of service credit before age 65. Benefits are reduced by a fraction of a percent for each month that a member retires prior to the age at which a member can receive full early retirement benefits in accordance with their respective tier. Tier 1 members
71
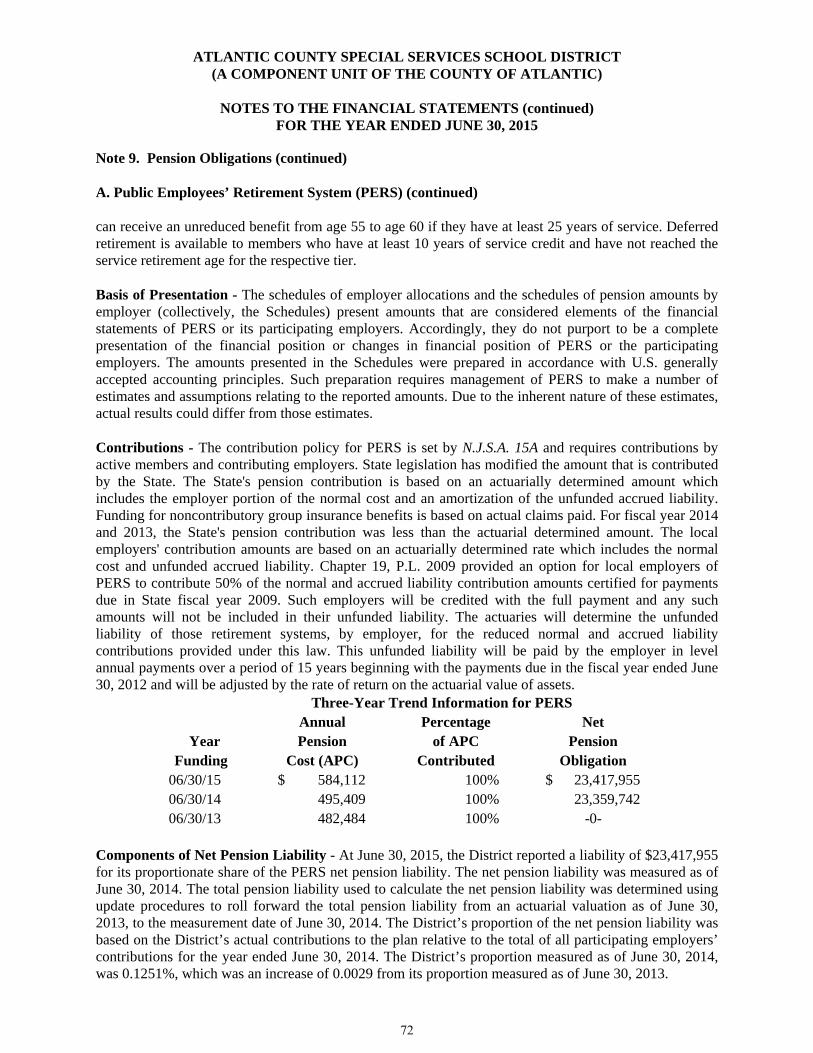
ATLANTIC COUNTY SPECIAL SERVICES SCHOOL DISTRICT (A COMPONENT UNIT OF THE COUNTY OF ATLANTIC)
NOTES TO THE FINANCIAL STATEMENTS (continued)
FOR THE YEAR ENDED JUNE 30, 2015
Note 9. Pension Obligations (continued) A. Public Employees’ Retirement System (PERS) (continued) can receive an unreduced benefit from age 55 to age 60 if they have at least 25 years of service. Deferred retirement is available to members who have at least 10 years of service credit and have not reached the service retirement age for the respective tier. Basis of Presentation - The schedules of employer allocations and the schedules of pension amounts by employer (collectively, the Schedules) present amounts that are considered elements of the financial statements of PERS or its participating employers. Accordingly, they do not purport to be a complete presentation of the financial position or changes in financial position of PERS or the participating employers. The amounts presented in the Schedules were prepared in accordance with U.S. generally accepted accounting principles. Such preparation requires management of PERS to make a number of estimates and assumptions relating to the reported amounts. Due to the inherent nature of these estimates, actual results could differ from those estimates. Contributions - The contribution policy for PERS is set by N.J.S.A. 15A and requires contributions by active members and contributing employers. State legislation has modified the amount that is contributed by the State. The State's pension contribution is based on an actuarially determined amount which includes the employer portion of the normal cost and an amortization of the unfunded accrued liability. Funding for noncontributory group insurance benefits is based on actual claims paid. For fiscal year 2014 and 2013, the State's pension contribution was less than the actuarial determined amount. The local employers' contribution amounts are based on an actuarially determined rate which includes the normal cost and unfunded accrued liability. Chapter 19, P.L. 2009 provided an option for local employers of PERS to contribute 50% of the normal and accrued liability contribution amounts certified for payments due in State fiscal year 2009. Such employers will be credited with the full payment and any such amounts will not be included in their unfunded liability. The actuaries will determine the unfunded liability of those retirement systems, by employer, for the reduced normal and accrued liability contributions provided under this law. This unfunded liability will be paid by the employer in level annual payments over a period of 15 years beginning with the payments due in the fiscal year ended June 30, 2012 and will be adjusted by the rate of return on the actuarial value of assets.
Annual Percentage Net Year Pension of APC Pension
Funding Cost (APC) Contributed Obligation06/30/15 584,112$ 100% 23,417,955$ 06/30/14 495,409 100% 23,359,742 06/30/13 482,484 100% -0-
Three-Year Trend Information for PERS
Components of Net Pension Liability - At June 30, 2015, the District reported a liability of $23,417,955 for its proportionate share of the PERS net pension liability. The net pension liability was measured as of June 30, 2014. The total pension liability used to calculate the net pension liability was determined using update procedures to roll forward the total pension liability from an actuarial valuation as of June 30, 2013, to the measurement date of June 30, 2014. The District’s proportion of the net pension liability was based on the District’s actual contributions to the plan relative to the total of all participating employers’ contributions for the year ended June 30, 2014. The District’s proportion measured as of June 30, 2014, was 0.1251%, which was an increase of 0.0029 from its proportion measured as of June 30, 2013.
72
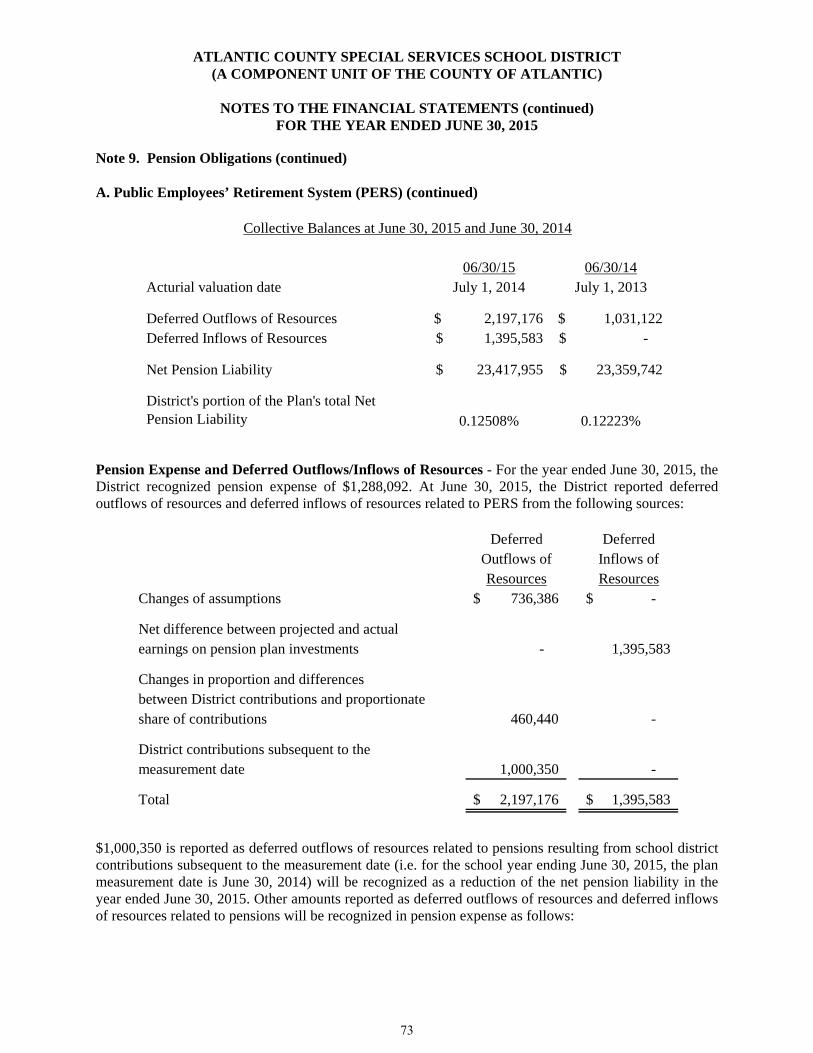
ATLANTIC COUNTY SPECIAL SERVICES SCHOOL DISTRICT (A COMPONENT UNIT OF THE COUNTY OF ATLANTIC)
NOTES TO THE FINANCIAL STATEMENTS (continued)
FOR THE YEAR ENDED JUNE 30, 2015
Note 9. Pension Obligations (continued) A. Public Employees’ Retirement System (PERS) (continued)
06/30/15 06/30/14Acturial valuation date July 1, 2014 July 1, 2013
Deferred Outflows of Resources 2,197,176$ 1,031,122$ Deferred Inflows of Resources 1,395,583$ -$
Net Pension Liability 23,417,955$ 23,359,742$
District's portion of the Plan's total Net Pension Liability 0.12508% 0.12223%
Collective Balances at June 30, 2015 and June 30, 2014
Pension Expense and Deferred Outflows/Inflows of Resources - For the year ended June 30, 2015, the District recognized pension expense of $1,288,092. At June 30, 2015, the District reported deferred outflows of resources and deferred inflows of resources related to PERS from the following sources:
Deferred DeferredOutflows of Inflows ofResources Resources
Changes of assumptions 736,386$ -$
Net difference between projected and actualearnings on pension plan investments - 1,395,583
Changes in proportion and differencesbetween District contributions and proportionateshare of contributions 460,440 -
District contributions subsequent to themeasurement date 1,000,350 -
Total 2,197,176$ 1,395,583$
$1,000,350 is reported as deferred outflows of resources related to pensions resulting from school district contributions subsequent to the measurement date (i.e. for the school year ending June 30, 2015, the plan measurement date is June 30, 2014) will be recognized as a reduction of the net pension liability in the year ended June 30, 2015. Other amounts reported as deferred outflows of resources and deferred inflows of resources related to pensions will be recognized in pension expense as follows:
73

ATLANTIC COUNTY SPECIAL SERVICES SCHOOL DISTRICT (A COMPONENT UNIT OF THE COUNTY OF ATLANTIC)
NOTES TO THE FINANCIAL STATEMENTS (continued)
FOR THE YEAR ENDED JUNE 30, 2015
Note 9. Pension Obligations (continued) A. Public Employees’ Retirement System (PERS) (continued)
Year Ended June 30,2016 (72,683)$ 2017 (72,683) 2018 (72,683) 2019 (72,683) 2020 (72,683) Thereafter 164,658
Total (198,757)$
Actuarial Assumptions - The total pension asset/(liability) as of the measurement date was determined by using an actuarial valuation as noted in the table below, with update procedures used to roll forward the total pension liability to the measurement date. The actuarial valuations used the following actuarial assumptions:
PERSMeasurement date June 30, 2014Actuarial valuation date July 1, 2013Interest rate 7.90%Salary scale 2012-2012 - 2.15-4.40%
Based on AgeThereafter - 3.15-5.40%
Based on AgeInflation rate 3.01%
Mortality rates were based on the RP-2000 Combined Healthy Male or Female Mortality Tables (setback 1 year for females) with adjustments for mortality improvements from base year of 2012 based on Projection Scale AA. The actuarial assumptions used in the July 1, 2013 valuation were based on the results of an actuarial experience study for the period July 1, 2008 to June 30, 2011. Long-Term Expected Rate of Return - In accordance with State statute, the long-term expected rate of return on plan investments is determined by the State Treasurer, after consultation with the Directors of the Division of Investments and Division of Pensions and Benefits, the board of trustees and the actuaries. Best estimates of arithmetic real rates of return for each major asset class included in PERS's target asset allocation as of June 30, 2014 are summarized in the following table:
74

ATLANTIC COUNTY SPECIAL SERVICES SCHOOL DISTRICT (A COMPONENT UNIT OF THE COUNTY OF ATLANTIC)
NOTES TO THE FINANCIAL STATEMENTS (continued)
FOR THE YEAR ENDED JUNE 30, 2015
Note 9. Pension Obligations (continued) A. Public Employees’ Retirement System (PERS) (continued)
Target Long-Term ExpectedAllocation Real Rate of Return
Cash 6.00% 0.80%Core Bonds 1.00% 2.49%Intermediate-Term Bonds 11.20% 2.26%Mortgages 2.50% 2.17%High Yield Bonds 5.50% 4.82%Inflation-Indexed Bonds 2.50% 3.51%Broad US Equities 25.90% 8.22%Developed Foreign Equities 12.70% 8.12%Emerging Market Equities 6.50% 9.91%Private Equity 8.25% 13.02%Hedge Funds / Absolute Return 12.25% 4.92%Real Estate (Property) 3.20% 5.80%Commodities 2.50% 5.35%
Discount Rate - The discount rate used to measure the total pension liability was 5.39% as of June 30, 2014. The single blended discount rate was based on long-term expected rate of return on pension plan investments of 7.9%, and a municipal bond rate of 4.29% as of June 30, 2014, based on the Bond Buyer Go 20-Bond Municipal Bond Index which includes tax-exempt general obligation municipals bonds with an average rating of AA/Aa or higher. The projection of cash flows used to determine the discount rate assumed that employee contributions will be made at the current member contribution rates and that contributions from employers will be made on the average of the last five years of contributions made in relation to the last five years of recommended contributions. Based on those assumptions, the plan’s fiduciary net position was projected to be available to make projected future benefit payments of current plan members through 2033. Therefore, the long-term expected rate of return on plan investments was applied to projected benefit payments through 2033, and the municipal bond rate was applied to projected benefit payments after that date in determining the total pension liability. Sensitivity of the District’s proportionate share of the Net Pension Liability to Changes in the Discount Rate - The following presents the District’s proportionate share of the net pension liability calculated using the discount rate as disclosed above, as well as what the District’s proportionate share of the net pension liability would be if it were calculated using a discount rate that is 1-percentage-point lower (4.39%) or 1-percentage-point higher (6.39%) than the current rate:
5.39%4.39% Current 6.39%
1% Decrease Discount Rate 1% IncreaseDistrict's proportionate share
of the net pension liability 29,460,584$ 23,417,955$ 18,343,683$
75

ATLANTIC COUNTY SPECIAL SERVICES SCHOOL DISTRICT (A COMPONENT UNIT OF THE COUNTY OF ATLANTIC)
NOTES TO THE FINANCIAL STATEMENTS (continued)
FOR THE YEAR ENDED JUNE 30, 2015
Note 9. Pension Obligations (continued) B. Teachers’ Pension and Annuity Fund (TPAF) Plan Description - The State of New Jersey, Teachers' Pension and Annuity Fund (TPAF) is a cost sharing multiple-employer defined benefit pension plan with a special-funding situation, by which the State of New Jersey (the State) is responsible to fund 100% of the employer contributions, excluding any local employer early retirement incentive (ERI) contributions. TPAF is administered by the State of New Jersey, Division of Pensions and Benefits (the Division). For additional information about TPAF, please refer to Division's Comprehensive Annual Financial Report (CAFR) which can be found at www.state.nj.us/treasury/pensions/annrprts.shtml. The vesting and benefit provisions are set by N.J.S.A. 18A:66. TPAF provides retirement, death and disability benefits. All benefits vest after ten years of service, except for medical benefits, which vest after 25 years of service or under the disability provisions of TPAF. Members are always fully vested for their own contributions and, after three years of service credit, become vested for 2% of related interest earned on the contributions. In the case of death before retirement, members' beneficiaries are entitled to full interest credited to the members' accounts. The following represents the membership tiers for TPAF: Tier Definition 1 Members who were enrolled prior to July 1, 2007 2 Members who were eligible to enroll on or after July 1, 2007 and prior to November 2, 2008 3 Members who were eligible to enroll on or after November 2, 2008 and prior to May 22, 2010 4 Members who were eligible to enroll on or after May 22, 2010 and prior to June 28, 2011 5 Members who were eligible to enroll on or after June 28, 2011 Service retirement benefits of 1/60th of final average salary for each year of service credit is available to tier 4 members upon reaching age 62 and tier 5 members upon reaching age 65. Early retirement benefits are available to tiers 1 and 2 members before reaching age 60, tiers 3 and 4 before age 62 with 25 or more years of service credit, and tier 5 before age 65 with 30 or more years of service credit. Benefits are reduced by a fraction of a percent for each month that a member retires prior to the retirement age for his/her respective tier. Deferred retirement is available to members who have at least 10 years of service credit and have not reached the service retirement age for the respective tier. Basis of Presentation - The schedules of employer and nonemployer allocations and the schedules of pension amounts by employer and nonemployer (collectively, the Schedules) present amounts that are considered elements of the financial statements of TPAF and the State as an employer/nonemployer entity. Accordingly, they do not purport to be a complete presentation of the financial position or changes in financial position of TPAF or the State. The amounts presented in the Schedules were prepared in accordance with U.S. generally accepted accounting principles. Such preparation requires management of TPAF to make a number of estimates and assumptions relating to the reported amounts. Due to the inherent nature of these estimates, actual results could differ from those estimates.
76

ATLANTIC COUNTY SPECIAL SERVICES SCHOOL DISTRICT (A COMPONENT UNIT OF THE COUNTY OF ATLANTIC)
NOTES TO THE FINANCIAL STATEMENTS (continued)
FOR THE YEAR ENDED JUNE 30, 2015
Note 9. Pension Obligations (continued) B. Teachers’ Pension and Annuity Fund (TPAF) (continued) Contributions - The contribution policy for TPAF is set by N.J.S.A 18A:66 and requires contributions by active members and contributing employers. State legislation has modified the amount that is contributed by the State. The State's pension contribution is based on an actuarially determined amount which includes the employer portion of the normal cost and an amortization of the unfunded accrued liability. Funding for noncontributory group insurance benefits is based on actual claims paid. For fiscal year 2014 and 2013, the State's pension contribution was less than the actuarial determined amount. Special Funding Situation - The employer contributions for local participating employers are legally required to be funded by the State in accordance with N.J.S.A 18:66-33. Therefore, these local participating employers are considered to be in a special funding situation as defined by GASB Statement No. 68 and the State is treated as a nonemployer contributing entity. Since the local participating employers do not contribute directly to the plan (except for employer specific financed amounts), there is no net pension liability or deferred outflows or inflows to report in the financial statements of the local participating employers. However, the notes to the financial statements of the local participating employers must disclose the portion of the nonemployer contributing entities' total proportionate share of the net pension liability that is associated with the local participating employer.
Post-RetirementMedical & Percentage Net
Year Annual Pension of APC PensionFunding Cost (APC) Contributed Obligation
06/30/15 1,097,644$ 100% $-0-06/30/14 925,422 100% -0-06/30/13 1,135,043 100% -0-
Three-Year Trend Information for TPAF (Paid on behalf of the District)
Teachers Pensions and Annuity Fund (TPAF) - For purposes of measuring the net pension liability, deferred outflows of resources and deferred inflows of resources related to pensions, and pension expense, information about the fiduciary net position of the Teachers’ Pension and Annuity Fund (TPAF) and additions to/deductions from the TPAF’s fiduciary net position have been determined on the same basis as they are reported by the TPAF. For this purpose, benefit payments (including refunds of employee contributions) are recognized when due and payable in accordance with the benefit terms. Investments are reported at fair value.
TPAFMeasurement date June 30, 2014Actuarial valuation date July 1, 2013Interest rate 7.90%Salary scale Varies Based on ExperienceInflation rate 2.50%
77

ATLANTIC COUNTY SPECIAL SERVICES SCHOOL DISTRICT (A COMPONENT UNIT OF THE COUNTY OF ATLANTIC)
NOTES TO THE FINANCIAL STATEMENTS (continued)
FOR THE YEAR ENDED JUNE 30, 2015
Note 9. Pension Obligations (continued) B. Teachers’ Pension and Annuity Fund (TPAF) (continued) Mortality rates were based on the RP-2000 Health Annuitant Mortality Table for Males or Females, as appropriate, with adjustments for mortality improvements based on Scale AA. Pre-retirement mortality improvements for active members are projected using Scale AA from the base year of 2000 until the valuation date plus 15 years to account for future mortality improvement. Post-retirement mortality improvements for non-disabled annuitants are projected using Scale AA from the base year of 2000 for males and 2003 for females until the valuation date plus 7 years to account for future mortality improvement. The actuarial assumptions used in the July 1, 2013 valuation were based on the results of an actuarial experience study for the period July 1, 2009 to June 30, 2012. Long-Term Expected Rate of Return - In accordance with State statute, the long-term expected rate of return on plan investments is determined by the State Treasurer, after consultation with the Directors of the Division of Investments and Division of Pensions and Benefits, the board of trustees and the actuaries. Best estimates of arithmetic real rates of return for each major asset class included in TPAF's target asset allocation as of June 30, 2014 are summarized in the following table:
Target Long-Term ExpectedAllocation Real Rate of Return
Cash 6.00% 0.50%Core Fixed Income 0.00% 2.19%Core Bonds 1.00% 1.38%Short-Term Bonds 0.00% 1.00%Intermediate-Term Bonds 11.20% 2.60%Long-Term Bonds 0.00% 3.23%Mortgages 2.50% 2.84%High Yield Bonds 5.50% 4.15%Non-US Fixed Income 0.00% 1.41%Inflation-Indexed Bonds 2.50% 1.30%Broad US Equities 25.90% 5.88%Large Cap US Equities 0.00% 5.62%Mid Cap US Equities 0.00% 6.39%Small Cap US Equities 0.00% 7.39%Developed Foreign Equities 12.70% 6.05%Emerging Market Equities 6.50% 8.90%Private Equity 8.25% 9.15%Hedge Funds / Absolute Return 12.25% 3.85%Real Estate (Property) 3.20% 4.43%Real Estate (REITS) 0.00% 5.58%Commodities 2.50% 3.60%
78

ATLANTIC COUNTY SPECIAL SERVICES SCHOOL DISTRICT (A COMPONENT UNIT OF THE COUNTY OF ATLANTIC)
NOTES TO THE FINANCIAL STATEMENTS (continued)
FOR THE YEAR ENDED JUNE 30, 2015
Note 9. Pension Obligations (continued) B. Teachers’ Pension and Annuity Fund (TPAF) (continued) Discount Rate - The discount rate used to measure the total pension liability was 4.68% as of June 30, 2014. The single blended discount rate was based on long-term expected rate of return on pension plan investments of 7.9%, and a municipal bond rate of 4.29% as of June 30, 2014, based on the Bond Buyer Go 20-Bond Municipal Bond Index which includes tax-exempt general obligation municipals bonds with an average rating of AA/Aa or higher. The projection of cash flows used to determine the discount rate assumed that employee contributions will be made at the current member contribution rates and that contributions from employers will be made on the average of the last five years. Based on those assumptions, the plan’s fiduciary net position was projected to be available to make projected future benefit payments of current plan members through 2027. Therefore, the long-term expected rate of return on plan investments was applied to projected benefit payments through 2027, and the municipal bond rate was applied to projected benefit payments after that date in determining the total pension liability. Pension plan fiduciary net position - Detailed information about the pension plan’s fiduciary net position is available in the separately issued PERS & TPAF financial report. C. Defined Contribution Retirement Program (DCRP) The District contributes to the New Jersey Defined Contribution Retirement Program (DCRP) which is a defined contribution retirement benefit plan, along with life insurance and disability coverage, for its employees who are ineligible for PERS or TPAF. When enrolled in the DCRP, members contribute 5.5 percent of their base salary to a tax-deferred investment account established with Prudential Financial, which jointly administers the DCRP investments with the Division of Pension and Benefits. Member contributions are matched by a 3 percent employer contribution. Employees are immediately vested in their own contributions and earnings on those contributions and become vested in District contributions and earnings on District contributions after commencement of their second year of employment, with some exceptions. Nonvested District contributions and earnings are forfeited upon separation from covered employment. Such forfeitures are reverted back to a forfeiture account for the employer and may be used to reduce pension expenses. For the year ended June 30, 2015, the District did not apply forfeitures to reduce the District’s pension expense. Note 10. Post-Retirement Benefits Chapter 384 of Public Laws 1987 and Chapter 6 of Public Laws 1990 required Teachers’ Pensions and Annuity Fund (TPAF) and the Public Employees’ Retirement System (PERS), respectively, to fund post-retirement medical benefits for those State Employees who retire after accumulating 25 years of credited service or on a disability retirement. P.L. 2007, c.103 amended the law to eliminate the funding of post-retirement medical benefits through the TPAF and PERS. It created separate funds outside of the pension plans for the funding and payment of post-retirement medical benefits for retired State employees and retired educational employees. As of June 30, 2015, there were 103,432 retirees receiving post-retirement
79
ATLANTIC COUNTY SPECIAL SERVICES SCHOOL DISTRICT (A COMPONENT UNIT OF THE COUNTY OF ATLANTIC)
NOTES TO THE FINANCIAL STATEMENTS (continued)
FOR THE YEAR ENDED JUNE 30, 2015
Note 10. Post-Retirement Benefits (continued) medical benefits, and the state contributed $1.07 billion on their behalf.. The cost of these benefits is funded through contributions by the State in accordance with P.L. 1994, c.62. Funding of post-retirement medical benefits changed from a pre-funding basis to a pay-as-you-go basis beginning in Fiscal Year 1994. The State is also responsible for the cost attributable to P.L. 1992, c.126, which provides employer paid health benefits to members of PERS and the Alternate Benefit Program who retired from a board of education or county college with 25 years of service. The State paid $165.8 million toward Chapter 126 benefits for 18,122 eligible retired members in Fiscal Year 2014. Note 11. Risk Management The District is exposed to various risks of loss related to torts; theft of, damage to and destruction of assets; errors and omissions; injuries to employees; and natural disasters. Property and Liability Insurance – The District maintains commercial insurance coverage for property, liability, student accident and surety bonds. A complete schedule of insurance coverage can be found in the Statistical Section of this Comprehensive Annual Financial Report. New Jersey Unemployment Compensation Insurance – The District has elected to fund their New Jersey Unemployment Compensation Insurance under the “Benefit Reimbursement Method”. Under this plan the District is required to reimburse the New Jersey Unemployment Trust Fund for benefits paid to its former employees and charged to its account with the State. The District is billed quarterly for amounts due to the State. The following is a summary of School District contributions, reimbursements to the State for benefits paid and the ending balance of the School District’s expendable trust fund for the current and previous two years:
District Employee Other Interest Amount EndingFiscal Year Contributions Contributions Sources Earned Reimbursed Balance
2014-2015 18,000$ 34,329$ -$ 715$ 21,567$ 207,263$ 2013-2014 18,000 34,649 38,919 240 31,549 175,786 2012-2013 18,000 40,999 - 213 55,824 115,527
Note 12. Contingencies State and Federal Grantor Agencies - The District participates in numerous state and federal grant programs, which are governed by various rules and regulations of the grantor agencies; therefore, to the extent that the District has not complied with the rules and regulations governing the grants, refunds of any money received may be required and the collectability of any related receivable at June 30, 2015 may be impaired. In the opinion of the District, there are no significant contingent liabilities relating to compliance with the rules and regulations governing the respective grants; therefore, no provisions have been recorded in the accompanying combined financial statements for such contingencies.
80

ATLANTIC COUNTY SPECIAL SERVICES SCHOOL DISTRICT (A COMPONENT UNIT OF THE COUNTY OF ATLANTIC)
NOTES TO THE FINANCIAL STATEMENTS (continued)
FOR THE YEAR ENDED JUNE 30, 2015
Note 13. Economic Dependency The District receives a substantial amount of its support from federal and state governments. A significant reduction in the level of support, if this were to occur, could have an effect on the District’s programs and activities. Note 14. Deferred Compensation The District offers its employees a choice of the following deferred compensation plans created in accordance with Internal Revenue Code Section 403(b). The plans, which are administered by the entities listed below, permits participants to defer a portion of their salary until future years. Amounts deferred under the plans are not available to employees until termination, retirement, death or unforeseeable emergency. The plan administrators are as follows: The Equitable Lincoln Investments Fidelity Investments Met Life Frank J. Siracusa & Sons Vanguard Note 15. Compensated Absences The District accounts for compensated absences (e.g., unused vacation, sick leave) as directed by Governmental Accounting Standards Board Statement No. 16 (GASB 16), “Accounting for Compensated Absences”. A liability for compensated absences attributable to services already rendered and not contingent on a specific event that is outside the control of the employer and employee is accrued as employees earn the rights to the benefits. District employees are granted varying amount of vacation and sick leave in accordance with the District's personnel policies. The District policy permits employees to accumulate unused sick leave and carry forward the full amount to subsequent years. Upon retirement employees shall be paid by the District for the unused sick leave in accordance with Districts’ agreements with the various employee unions. The liability for vested compensated absences of the governmental fund types is recorded in the statement of net assets under governmental activities. The current portion of the compensated absence balance is not considered material to the applicable funds total liabilities, and is therefore not shown separately from the long-term liability balance of compensated absences. The amount at June 30, 2015 is $562,178. The liability for vested compensated absences of the proprietary fund types is recorded within those funds as the benefits accrue to employees. The current portion of the compensated absence balance is not considered material to the proprietary fund total liabilities, and is therefore not shown separately from the long-term liability balance of compensated absences. The amount at June 30, 2015 is $194,686.
81

ATLANTIC COUNTY SPECIAL SERVICES SCHOOL DISTRICT (A COMPONENT UNIT OF THE COUNTY OF ATLANTIC)
NOTES TO THE FINANCIAL STATEMENTS (continued)
FOR THE YEAR ENDED JUNE 30, 2015
Note 16. Deficit Unrestricted Net Position As reflected on Exhibit A-1, Statement of Net Position, a deficit in unrestricted net position of $(21,773,111) existed as of June 30, 2015 for governmental activities. The primary causes of this deficit is the District not recognizing the receivable for the last two state aid payments and the recording of the long-term liability for compensated absences and net pension. In accordance with full accrual accounting, which is the basis of accounting for Exhibit A-1, Statement of Net Position, such liabilities are required to be recorded in the period in which they are incurred. However, in accordance with the rules and regulations that govern the District in the formulation of their annual budget (see Note 1), compensated absences and pension liabilities that relate to future services, or that are contingent on a specific event outside the control of the District and its employees, are funded in the period in which such services are rendered or in which such events take place. Therefore, this deficit in unrestricted net position for governmental activities does not indicate that the District is facing financial difficulties. Note 17. Fund Balance General Fund – Of the $2,895,510 General Fund fund balance at June 30, 2015, $364,049 has been reserved in the Capital Reserve Account; $125,682 has been reserved in the Maintenance Reserve Account; and $2,405,779 is unassigned. Capital Projects Fund – The entire $20,761 Capital Projects Fund balance at June 30, 2015 has been assigned to other purposes. Note 18. Prior Period Adjustment/Restatement of Net Position Net position as of July 1, 2014, has been restated as follows for the implementation of GASB Statement No. 68, Accounting and Financial Reporting for Pensions, as amended by GASB Statement No. 71, Pension Transition for Contributions Made Subsequent to the Measurement Date.
Net Position as previously reported at June 30, 2014 24,769,259$ Prior period adjustment - Implementation of GASB #68:
Net Pension Liability (Measurement date as of June 30, 2013) (23,359,742)$ PERS Pension Payable at June 30, 2014 (1,031,122) Deferred Outflows (District contributions made during
fiscal year 2014) 1,031,122 Total prior period adjustment (23,359,742)
Net Position as restated, July 1, 2014 1,409,517$
Governmental Activities
82

REQUIRED SUPPLEMENTARY INFORMATION - PART II
83

This page intentionally left blank
84
C. Budgetary Comparison Schedules
85

This page intentionally left blank
86
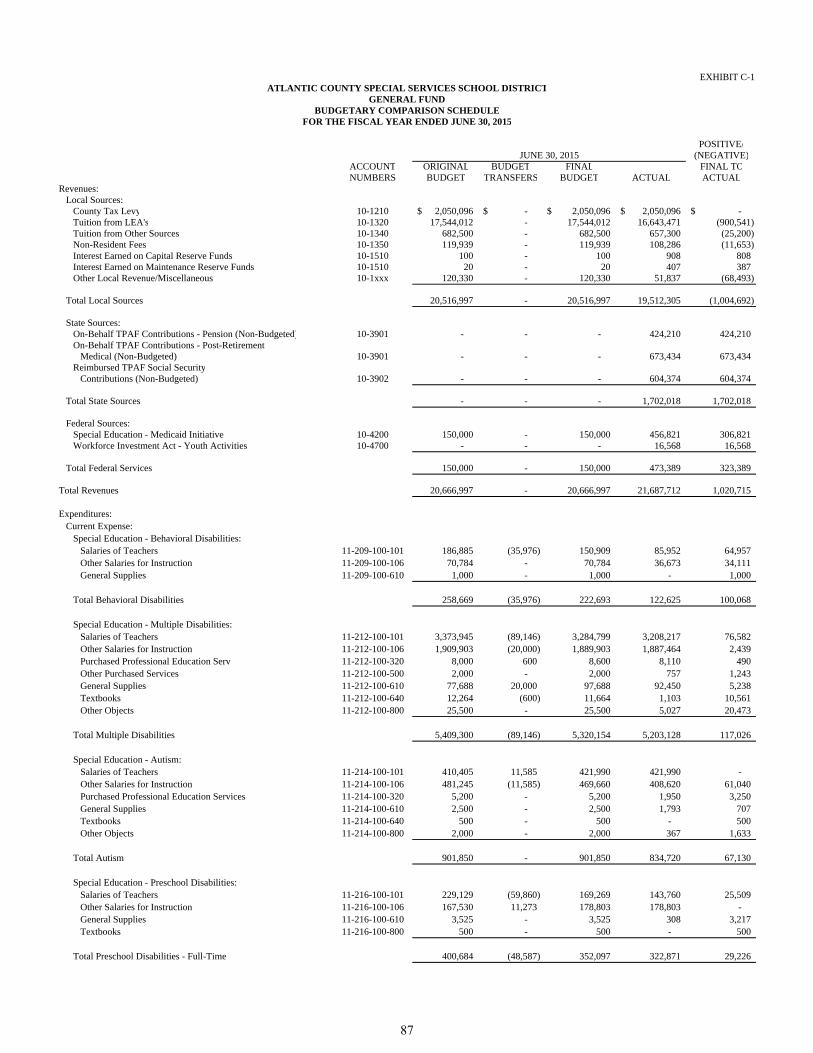
EXHIBIT C-1
POSITIVE/(NEGATIVE)
ACCOUNT ORIGINAL BUDGET FINAL FINAL TONUMBERS BUDGET TRANSFERS BUDGET ACTUAL ACTUAL
Revenues:Local Sources:
County Tax Levy 10-1210 2,050,096$ -$ 2,050,096$ 2,050,096$ -$ Tuition from LEA's 10-1320 17,544,012 - 17,544,012 16,643,471 (900,541) Tuition from Other Sources 10-1340 682,500 - 682,500 657,300 (25,200) Non-Resident Fees 10-1350 119,939 - 119,939 108,286 (11,653) Interest Earned on Capital Reserve Funds 10-1510 100 - 100 908 808 Interest Earned on Maintenance Reserve Funds 10-1510 20 - 20 407 387 Other Local Revenue/Miscellaneous 10-1xxx 120,330 - 120,330 51,837 (68,493)
Total Local Sources 20,516,997 - 20,516,997 19,512,305 (1,004,692)
State Sources:On-Behalf TPAF Contributions - Pension (Non-Budgeted) 10-3901 - - - 424,210 424,210 On-Behalf TPAF Contributions - Post-Retirement
Medical (Non-Budgeted) 10-3901 - - - 673,434 673,434 Reimbursed TPAF Social Security
Contributions (Non-Budgeted) 10-3902 - - - 604,374 604,374
Total State Sources - - - 1,702,018 1,702,018
Federal Sources:Special Education - Medicaid Initiative 10-4200 150,000 - 150,000 456,821 306,821 Workforce Investment Act - Youth Activities 10-4700 - - - 16,568 16,568
Total Federal Services 150,000 - 150,000 473,389 323,389
Total Revenues 20,666,997 - 20,666,997 21,687,712 1,020,715
Expenditures:Current Expense:
Special Education - Behavioral Disabilities:Salaries of Teachers 11-209-100-101 186,885 (35,976) 150,909 85,952 64,957 Other Salaries for Instruction 11-209-100-106 70,784 - 70,784 36,673 34,111 General Supplies 11-209-100-610 1,000 - 1,000 - 1,000
Total Behavioral Disabilities 258,669 (35,976) 222,693 122,625 100,068
Special Education - Multiple Disabilities:Salaries of Teachers 11-212-100-101 3,373,945 (89,146) 3,284,799 3,208,217 76,582 Other Salaries for Instruction 11-212-100-106 1,909,903 (20,000) 1,889,903 1,887,464 2,439 Purchased Professional Education Serv 11-212-100-320 8,000 600 8,600 8,110 490 Other Purchased Services 11-212-100-500 2,000 - 2,000 757 1,243 General Supplies 11-212-100-610 77,688 20,000 97,688 92,450 5,238 Textbooks 11-212-100-640 12,264 (600) 11,664 1,103 10,561 Other Objects 11-212-100-800 25,500 - 25,500 5,027 20,473
Total Multiple Disabilities 5,409,300 (89,146) 5,320,154 5,203,128 117,026
Special Education - Autism:Salaries of Teachers 11-214-100-101 410,405 11,585 421,990 421,990 - Other Salaries for Instruction 11-214-100-106 481,245 (11,585) 469,660 408,620 61,040 Purchased Professional Education Services 11-214-100-320 5,200 - 5,200 1,950 3,250 General Supplies 11-214-100-610 2,500 - 2,500 1,793 707 Textbooks 11-214-100-640 500 - 500 - 500 Other Objects 11-214-100-800 2,000 - 2,000 367 1,633
Total Autism 901,850 - 901,850 834,720 67,130
Special Education - Preschool Disabilities:Salaries of Teachers 11-216-100-101 229,129 (59,860) 169,269 143,760 25,509 Other Salaries for Instruction 11-216-100-106 167,530 11,273 178,803 178,803 - General Supplies 11-216-100-610 3,525 - 3,525 308 3,217 Textbooks 11-216-100-800 500 - 500 - 500
Total Preschool Disabilities - Full-Time 400,684 (48,587) 352,097 322,871 29,226
FOR THE FISCAL YEAR ENDED JUNE 30, 2015
ATLANTIC COUNTY SPECIAL SERVICES SCHOOL DISTRICTGENERAL FUND
JUNE 30, 2015
BUDGETARY COMPARISON SCHEDULE
87

EXHIBIT C-1
POSITIVE/(NEGATIVE)
ACCOUNT ORIGINAL BUDGET FINAL FINAL TONUMBERS BUDGET TRANSFERS BUDGET ACTUAL ACTUAL
FOR THE FISCAL YEAR ENDED JUNE 30, 2015
ATLANTIC COUNTY SPECIAL SERVICES SCHOOL DISTRICTGENERAL FUND
JUNE 30, 2015
BUDGETARY COMPARISON SCHEDULE
Special Education - Extended School Year:Salaries of Teachers 11-221-100-101 269,197 1,718 270,915 270,790 125 Other Salaries for Instruction 11-221-100-106 153,200 (12,118) 141,082 126,395 14,687 Purchased Professional Education Services 11-221-100-320 9,290 10,400 19,690 13,035 6,655 General Supplies 11-221-100-610 4,000 - 4,000 3,962 38 Other Objects 11-221-100-800 24,225 - 24,225 21,287 2,938
Total Extended School Year 459,912 - 459,912 435,469 24,443
Special Education - Cognitive - Severe:Salaries of Teachers 11-222-100-101 266,137 48,587 314,724 312,526 2,198 Other Salaries for Instruction 11-222-100-106 195,821 - 195,821 164,360 31,461 Purchased Professional Education Services 11-222-100-320 210,707 - 210,707 210,707 - General Supplies 11-222-100-610 3,220 - 3,220 901 2,319 Other Objects 11-222-100-800 2,500 - 2,500 - 2,500
Total Cognitive - Instruction 678,385 48,587 726,972 688,494 38,478
Total Special Education 8,108,800 (125,122) 7,983,678 7,607,307 376,371
Other Instructional Programs - Instruction:Salaries 11-400-100-100 791,115 89,147 880,262 849,009 31,253 Supplies and Materials 11-400-100-600 14,543 - 14,543 6,476 8,067
Total Other Instructional Programs - Instruction 805,658 89,147 894,805 855,485 39,320
Undistributed Expenditures:Health Services:
Salaries 11-000-213-100 328,757 - 328,757 322,963 5,794 Purchased Professional and Technical Services 11-000-213-300 166,676 (15,000) 151,676 120,159 31,517 Supplies and Materials 11-000-213-600 5,500 - 5,500 4,346 1,154 Other Objects 11-000-213-800 1,500 - 1,500 270 1,230
Total Health Services 502,433 (15,000) 487,433 447,738 39,695
Speech, OT, PT & Related Services:Salaries 11-000-216-100 1,640,918 - 1,640,918 1,547,757 93,161 Purchased Professional Education Services 11-000-216-320 2,500 - 2,500 - 2,500 Other Objects 11-000-216-600 11,750 - 11,750 7,536 4,214
Total Speech, OT, PT & Related Services 1,655,168 - 1,655,168 1,555,293 99,875
Child Study Team:Salaries of Other Professional Staff 11-000-219-104 780,976 - 780,976 762,052 18,924 Salaries of Secretarial and Clerical Assistants 11-000-219-105 160,230 (57,400) 102,830 75,782 27,048 Other Purchased Services 11-000-219-500 1,200 - 1,200 10 1,190 Supplies and Materials 11-000-219-600 5,840 - 5,840 705 5,135 Other Objects 11-000-219-800 5,000 - 5,000 3,257 1,743
Total Child Study Team 953,246 (57,400) 895,846 841,806 54,040
Educational Media/Library Services:Salaries 11-000-222-100 4,400 - 4,400 4,155 245 Purchased Professional and Technical Services 11-000-222-300 20,000 (2,000) 18,000 7,472 10,528 Other Purchased Services 11-000-222-500 600 - 600 - 600
Total Educational Media/Library Services 25,000 (2,000) 23,000 11,627 11,373
Instructional Staff Training Services:Purchased Professional - Educational Services 11-000-223-320 7,600 2,000 9,600 9,059 541 Other Purchased Services 11-000-223-500 1,000 - 1,000 342 658 Supplies and Materials 11-000-223-600 6,000 - 6,000 5,882 118
Total Instructional Staff Training Services 14,600 2,000 16,600 15,283 1,317
88

EXHIBIT C-1
POSITIVE/(NEGATIVE)
ACCOUNT ORIGINAL BUDGET FINAL FINAL TONUMBERS BUDGET TRANSFERS BUDGET ACTUAL ACTUAL
FOR THE FISCAL YEAR ENDED JUNE 30, 2015
ATLANTIC COUNTY SPECIAL SERVICES SCHOOL DISTRICTGENERAL FUND
JUNE 30, 2015
BUDGETARY COMPARISON SCHEDULE
Support Services - General Administration:Salaries 11-000-230-100 217,964 (24,167) 193,797 191,824 1,973 Legal Services 11-000-230-331 30,000 8,662 38,662 35,839 2,823 Audit Fees 11-000-230-332 25,000 1,750 26,750 26,750 - Architectural/Engineering Services 11-000-230-334 3,500 (3,207) 293 - 293 Other Purchased Professional Services 11-000-230-339 - 14,974 14,974 10,524 4,450 Communications/Telephone 11-000-230-530 46,750 - 46,750 31,497 15,253 BOE Other Purchased Services 11-000-230-585 2,500 - 2,500 1,180 1,320 Misc. Purchased Services 11-000-230-590 31,575 16,000 47,575 44,061 3,514 General Supplies 11-000-230-610 8,200 - 8,200 5,447 2,753 BOE In-House Training/Meeting Supplies 11-000-230-630 2,500 - 2,500 1,850 650 Miscellaneous Expenditures 11-000-230-890 4,900 - 4,900 3,416 1,484 BOE Membership Dues and Fees 11-000-230-895 8,300 - 8,300 8,294 6
Total Support Services - General Administration 381,189 14,012 395,201 360,682 34,519
Support Services - School Administration:Salaries of Principals/Asst. Principals/Program Director 11-000-240-103 428,213 - 428,213 419,843 8,370 Salaries of Secretarial and Clerical Assistants 11-000-240-105 206,664 57,400 264,064 241,348 22,716 Other Salaries 11-000-240-110 3,000 - 3,000 - 3,000 Other Professional Services 11-000-240-500 7,500 - 7,500 718 6,782 Supplies and Materials 11-000-240-600 12,200 - 12,200 6,046 6,154 Other Objects 11-000-240-800 5,565 - 5,565 5,028 537
- Total Support Services - School Administration 663,142 57,400 720,542 672,983 47,559
Central Services:Salaries 11-000-251-100 662,894 1,945 664,839 664,628 211 Purchased Professional Services 11-000-251-330 49,844 (1,945) 47,899 41,811 6,088 Misc. Purchased Services 11-000-251-592 12,000 - 12,000 5,667 6,333 Supplies and Materials 11-000-251-600 13,400 - 13,400 10,410 2,990 Miscellaneous Expenditures 11-000-251-890 2,500 - 2,500 2,342 158
- Total Central Services 740,638 - 740,638 724,858 15,780
Administrative Information Technology:Salaries 11-000-252-100 71,009 - 71,009 68,009 3,000 Purchased Technical Services 11-000-252-340 - 17,000 17,000 12,175 4,825 Supplies and Materials 11-000-252-600 11,280 - 11,280 9,270 2,010
- Total Administrative Information Technology 82,289 17,000 99,289 89,454 9,835
Required Maintenance for School Facilities:Salaries 11-000-261-100 234,709 (4,000) 230,709 222,881 7,828 Cleaning , Repairs, and Maintenance Services 11-000-261-420 155,600 4,125 159,725 148,735 10,990 General Supplies 11-000-261-610 42,800 3,023 45,823 40,020 5,803 Other Objects 11-000-261-800 18,500 (3,023) 15,477 15,391 86
Total Required Maintenance for School Facilities 451,609 125 451,734 427,027 24,707
Custodial Services:Salaries 11-000-262-100 415,824 (6,300) 409,524 366,001 43,523 Purchased Professional and Technical Services 11-000-262-300 6,800 - 6,800 2,900 3,900 Cleaning, Repairs, and Maintenance Services 11-000-262-420 20,200 - 20,200 18,838 1,362 Other Purchased Property Services 11-000-262-490 21,000 2,300 23,300 23,144 156 Insurance 11-000-262-520 68,800 (13,721) 55,079 55,079 - General Supplies 11-000-262-610 46,510 4,721 51,231 50,550 681 Energy (Natural Gas) 11-000-262-621 110,880 13,000 123,880 117,391 6,489 Energy (Electricity) 11-000-262-622 400,000 (13,000) 387,000 366,534 20,466
Total Custodial Services 1,090,014 (13,000) 1,077,014 1,000,437 76,577
89

EXHIBIT C-1
POSITIVE/(NEGATIVE)
ACCOUNT ORIGINAL BUDGET FINAL FINAL TONUMBERS BUDGET TRANSFERS BUDGET ACTUAL ACTUAL
FOR THE FISCAL YEAR ENDED JUNE 30, 2015
ATLANTIC COUNTY SPECIAL SERVICES SCHOOL DISTRICTGENERAL FUND
JUNE 30, 2015
BUDGETARY COMPARISON SCHEDULE
Care & Upkeep of Grounds:Cleaning , Repairs, and Maintenance Services 11-000-263-420 25,965 (4,125) 21,840 21,065 775 General Supplies 11-000-263-610 8,500 - 8,500 6,918 1,582
Total Care & Upkeep of Grounds 34,465 (4,125) 30,340 27,983 2,357
Security:Salaries 11-000-266-100 91,203 (1,000) 90,203 88,076 2,127 Purchased Professional and Technical Services 11-000-266-300 74,094 1,000 75,094 75,094 - General Supplies 11-000-266-610 2,810 - 2,810 2,102 708
Total Security 168,107 - 168,107 165,272 2,835
Total Operation & Maintenance of Plant Services 1,744,195 (17,000) 1,727,195 1,620,719 106,476
Student Transportation Services:Contract Services 11-000-270-512 37,800 - 37,800 29,214 8,586 Other Objects 11-000-270-800 5,000 - 5,000 - 5,000
Student Transportation Services 42,800 - 42,800 29,214 13,586
Personnel Services - Unallocated Employee Benefits:Social Security Contributions 11-000-291-220 410,000 10,061 420,061 413,779 6,282 Other Retirement Contributions - PERS 11-000-291-241 547,000 37,112 584,112 584,112 - Other Retirement Contributions - Regular 11-000-291-249 3,500 - 3,500 - 3,500 Unemployment Compensation 11-000-291-250 18,000 - 18,000 18,000 - Workmen's Compensation 11-000-291-260 307,800 (16,000) 291,800 278,558 13,242 Health Benefits 11-000-291-270 4,233,500 (122,173) 4,111,327 3,789,298 322,029 Tuition Reimbursement 11-000-291-280 35,000 - 35,000 19,847 15,153 Other Employee Benefits 11-000-291-290 78,021 - 78,021 40,727 37,294
Total Personnel Services - Unallocated Employee Benefits 5,632,821 (91,000) 5,541,821 5,144,321 397,500
On-Behalf TPAF Contributions - Pension (Non-Budgeted) - - - 424,210 (424,210) On-Behalf TPAF Contributions - Post-Retirement
Medical (Non-Budgeted) - - - 673,434 (673,434) Reimbursed TPAF Social Security Contributions (Non-Budgeted) - - - 604,374 (604,374)
Total Undistributed Expenditures 12,437,521 (91,988) 12,345,533 13,215,996 (870,463)
Total General Current Expenditures 21,351,979 (127,963) 21,224,016 21,678,788 (454,772)
Capital Outlay:Equipment:Multiple Disabilities 12-212-100-730 10,000 - 10,000 - 10,000 Undistributed Expenditures:Instruction 12-000-100-730 5,000 - 5,000 - 5,000 Required Maintenance for School Facilities 12-000-260-730 49,500 5,387 54,887 48,553 6,334 Care & Upkeep of Grounds 12-000-263-730 11,800 (5,387) 6,413 - 6,413
Total Equipment 76,300 - 76,300 48,553 27,747
Total Capital Outlay 76,300 - 76,300 48,553 27,747
Total Expenditures 21,428,279 (127,963) 21,300,316 21,727,341 (427,025)
Excess/(Deficiency) of Revenues Over/(Under) Expenditures (761,282) 127,963 (633,319) (39,629) 593,690
90

EXHIBIT C-1
POSITIVE/(NEGATIVE)
ACCOUNT ORIGINAL BUDGET FINAL FINAL TONUMBERS BUDGET TRANSFERS BUDGET ACTUAL ACTUAL
FOR THE FISCAL YEAR ENDED JUNE 30, 2015
ATLANTIC COUNTY SPECIAL SERVICES SCHOOL DISTRICTGENERAL FUND
JUNE 30, 2015
BUDGETARY COMPARISON SCHEDULE
Other Financing Sources/(Uses):Cancellation of Prior Year Payables - - - 60,582 60,582 Transfer of Interest Earned on Capital Reserve (100) - (100) - 100 Transfer of Interest Earned on Maintenance Reserve (20) - (20) - 20 Increase in Capital Reserve (73,598) - (73,598) - 73,598 Transfer from Capital Projects Fund to Capital Reserve - - - 52,999 52,999 Operating Transfers Out:
Transfer To Enterprise Funds (165,000) (140,976) (305,976) (305,976) -
Total Other Financing Sources/(Uses) (238,718) (140,976) (379,694) (192,395) 187,299
Excess/(Deficiency) of Revenues & Other Financing Sources/(Uses)Over/(Under) Expenditures & Other Financing Uses (1,000,000) (13,013) (1,013,013) (232,024) 780,989 Fund Balances, July 1 3,127,534 - 3,127,534 3,127,534 -
Fund Balances, June 30 2,127,534$ (13,013)$ 2,114,521$ 2,895,510$ 780,989$
Prior Year Reserve for Encumbrances (13,013)$
Total Budget Transfers (13,013)$
Restricted Fund Balance:Capital Reserve 364,049$ Mainenance Reserve 125,682 Unassigned Fund Balance 2,405,779
Fund Balance per Governmental Funds (GAAP) 2,895,510$
RECAPITULATION OF BUDGET TRANSFERS
RECAPITULATION OF FUND BALANCE
91
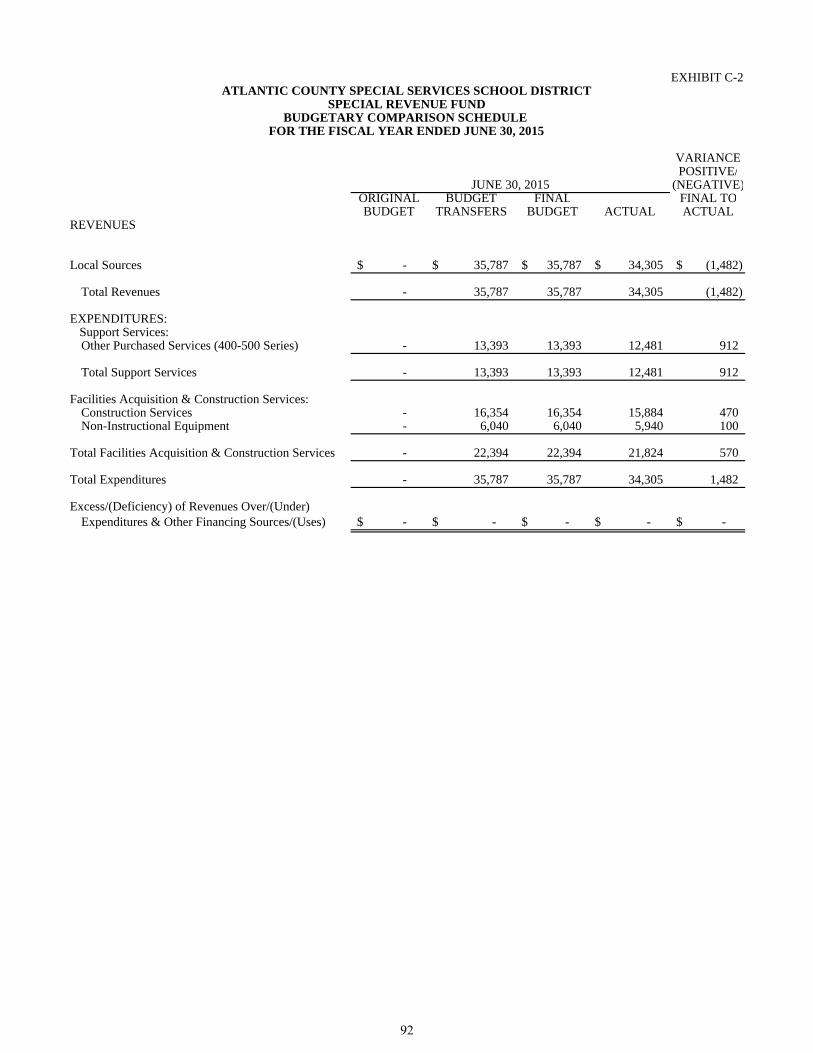
EXHIBIT C-2
VARIANCEPOSITIVE/
(NEGATIVE)ORIGINAL BUDGET FINAL FINAL TOBUDGET TRANSFERS BUDGET ACTUAL ACTUAL
REVENUES
Local Sources -$ 35,787$ 35,787$ 34,305$ (1,482)$
Total Revenues - 35,787 35,787 34,305 (1,482)
EXPENDITURES:Support Services:Other Purchased Services (400-500 Series) - 13,393 13,393 12,481 912
Total Support Services - 13,393 13,393 12,481 912
Facilities Acquisition & Construction Services:Construction Services - 16,354 16,354 15,884 470 Non-Instructional Equipment - 6,040 6,040 5,940 100
Total Facilities Acquisition & Construction Services - 22,394 22,394 21,824 570
Total Expenditures - 35,787 35,787 34,305 1,482
Excess/(Deficiency) of Revenues Over/(Under)Expenditures & Other Financing Sources/(Uses) -$ -$ -$ -$ -$
JUNE 30, 2015
ATLANTIC COUNTY SPECIAL SERVICES SCHOOL DISTRICT
BUDGETARY COMPARISON SCHEDULE SPECIAL REVENUE FUND
FOR THE FISCAL YEAR ENDED JUNE 30, 2015
92

NOTES TO REQUIRED SUPPLEMENTARY INFORMATION
93

This page intentionally left blank
94

EXHIBIT C-3
SPECIALGENERAL REVENUE
FUND FUNDSources/Inflows of Resources:
Actual Amounts (Budgetary Basis) "Revenue"From the Budgetary Comparison Schedule (C-Series) 21,687,712$ 34,305$
Total Revenues as Reported on the Statement of Revenues,Expenditures, and Changes in Fund Balances - GovernmentalFunds. (B-2) 21,687,712$ 34,305$
Uses/Outflows of Resources:Actual amounts (budgetary basis) "total expenditures" from thebudgetary comparison schedule 21,727,341$ 34,305$
Total Expenditures as Reported on the Statement of Revenues,Expenditures, and Changes in Fund Balances - Governmental Funds (B-2) 21,727,341$ 34,305$
ATLANTIC COUNTY SPECIAL SERVICES SCHOOL DISTRICT
Note A - Explanation of Differences between Budgetary Inflows and Outflows and GAAP Revenues and Expenditures
FOR THE FISCAL YEAR ENDED JUNE 30, 2015
REQUIRED SUPPLEMENTARY INFORMATIONBUDGETARY COMPARISON SCHEDULE
NOTE TO RSI
95

This page intentionally left blank
96
REQUIRED SUPPLEMENTARY INFORMATION - PART III
97

This page intentionally left blank
98

EXHIBIT L-1
2015 2014
District's proportion of the net pension liability(asset) 0.125% 0.122%
District's proportionate share of the netpension liability (asset) 23,417,955$ 23,359,742$
District's covered-employee payroll 8,719,053$ 8,676,108$
District's proportionate share of the netpension liability (asset) as a percentage of itscovered-employee payroll 268.584% 269.242%
Plan fiduciary net position as a percentage ofthe total pension liability 52.08% 48.72%
ATLANTIC COUNTY SPECIAL SERVICES SCHOOL DISTRICTSCHEDULE OF THE DISTRICT'S PROPORTIONATE SHARE OF THE NET PENSION LIABILITY
PUBLIC EMPLOYEES' RETIREMENT SYSTEMLAST TWO FISCAL YEARS
* The amounts presented for each fiscal year were determined as of the calendar year-end that occurred within the fiscal year.
99

EXHIBIT L-2
2015 2014
Contractually required contribution 584,112$ 495,409$
Contributions in relation to thecontractually required contribution 584,112 495,409
Contribution deficiency (excess) -$ -$
District's covered-employee payroll 8,719,053$ 8,676,108$
Contributions as a percentage of covered-employee payroll 0.067% 0.057%
ATLANTIC COUNTY SPECIAL SERVICES SCHOOL DISTRICTSCHEDULE OF DISTRICT'S CONTRIBUTIONSPUBLIC EMPLOYEES' RETIREMENT SYSTEM
LAST TWO FISCAL YEARS
* The amounts presented for each fiscal year were determined as of the calendar year-end that occurred within the fiscal year.
100

EXHIBIT L-3
2015 2014
District's proportion of the net pension liability(asset) 0.083% 0.082%
District's proportionate share of the netpension liability (asset) 44,293,160$ 41,665,099$
District's covered-employee payroll 8,522,183$ 8,480,208$
District's proportionate share of the netpension liability (asset) as a percentage of itscovered-employee payroll 519.740% 491.322%
Plan fiduciary net position as a percentage ofthe total pension liability 33.64% 33.76%
ATLANTIC COUNTY SPECIAL SERVICES SCHOOL DISTRICTSCHEDULE OF THE STATE'S PROPORTIONATE SHARE OF THE NET PENSION LIABILITY
TEACHERS' PENSION AND ANNUITY FUNDLAST TWO FISCAL YEARS
* The amounts presented for each fiscal year were determined as of the calendar year-end that occurred within the fiscal year.
101

This page intentionally left blank
102

NOTES TO REQUIRED SUPPLEMENTARY INFORMATION
103

This page intentionally left blank
104

ATLANTIC COUNTY SPECIAL SERVICES SCHOOL DISTRICT NOTES TO THE REQUIRED SUPPLEMENTARY INFORMATION
FOR THE FISCAL YEAR ENDED JUNE 30, 2015 Teachers’ Pension and Annuity Fund (TPAF) Changes of benefit terms. The vesting and benefit provisions are set by N.J.S.A. 18A:66. TPAF provides retirement, death and disability benefits. All benefits vest after ten years of service, except for medical benefits, which vest after 25 years of service or under the disability provisions of TPAF. Members are always fully vested for their own contributions and, after three years of service credit, become vested for 2% of related interest earned on the contributions. In the case of death before retirement, members’ beneficiaries are entitled to full interest credited to the members’ accounts. Changes of assumptions. Mortality rates were based on the RP-2000 Health Annuitant Mortality Table for Males or Females, as appropriate, with adjustments for mortality improvements based on Scale AA. Pre-retirement mortality improvements for active members are projected using Scale AA from the base year of 2000 until the valuation date plus 15 years to account for future mortality improvement. Post-retirement mortality improvements for non-disabled annuitants are projected using Scale AA from the base year of 2000 for males and 2003 for females until the valuation date plus 7 years to account for future mortality improvement. Public Employees' Retirement System (PERS) Changes of benefit terms. The vesting and benefit provisions are set by N.J.S.A. 43:15A. PERS provides retirement, death and disability benefits. All benefits vest after ten years of service, except for medical benefits, which vest after 25 years of service or under the disability provisions of PERS. Changes of assumptions. Mortality rates were based on the RP-2000 Combined Healthy Male and Female Mortality Tables (setback 1 year for females) with adjustments for mortality improvements from the base year of 2012 Based on Projection Scale AA.
105

This page intentionally left blank.
106
OTHER SUPPLEMENTARY INFORMATION
107

This page intentionally left blank
108

D. School Based Budget Schedules
Not Applicable
109

This page intentionally left blank
110

E. Special Revenue Fund
111

This page intentionally left blank
112

EXHIBIT E-1
AtlanticareHealth
Grant 2015
Revenues:Local Sources 34,305$ 34,305$
Total Revenues 34,305$ 34,305$
Expenditures:Instruction:
Salaries of Teachers -$ -$ Instruction Purchased
Services - - General Supplies - -
Total Instruction - -
Support Services:Other Purchased Services
(400-500 Series) 12,481 12,481
Total Support Services 12,481 12,481
Facilities Acquisition &Construction Services:
Construction Services 15,884 15,884 Non-Instructional Equipment 5,940 5,940
Total Facilities Acquisition &Construction Services 21,824 21,824
Total Expenditures 34,305$ 34,305$
FOR THE FISCAL YEAR ENDED JUNE 30, 2015
ATLANTIC COUNTY SPECIAL SERVICES SCHOOL DISTRICTSPECIAL REVENUE FUND
COMBINING SCHEDULE OF REVENUES AND EXPENDITURES - BUDGETARY BASIS
113

This page intentionally left blank
114

F. Capital Projects Fund
115

This page intentionally left blank
116

EX
HIB
IT F
-1
UN
EX
PE
ND
ED
CA
NC
EL
LA
TIO
N
BA
LA
NC
EP
RIO
RC
UR
RE
NT
YE
AR
TR
AN
SF
ER
TO
OF
RE
CE
IVA
BL
EP
RO
JEC
T T
ITL
ED
AT
EA
PP
RO
PR
IAT
ION
SY
EA
RS
EX
PE
ND
ITU
RE
SC
AP
ITA
L R
ES
ER
VE
BA
LA
NC
EJU
NE
30,
201
5
Ren
ovat
ions
and
Upg
rade
s to
H
igh
Sch
ool
4/9/
2014
329,
333
$
7,
175
$
17
7,18
4$
52
,999
$
57
,373
$
34,6
02$
Tot
a l32
9,33
3$
7,17
5$
177,
184
$
52,9
99$
57,3
73$
34
,602
$
Une
xpen
ded
Pro
ject
Bal
ance
s, J
une
30, 2
015
34,6
02$
Les
s:U
nexp
ende
d S
tate
Aid
- R
OD
Gra
nts
(13,
841)
Tot
a l F
und
Bal
ance
(G
AA
P B
asis
) -
June
30,
201
520
,761
$
Rec
onci
liat
ion
of
Fu
nd
Bal
ance
, Ju
ne
30, 2
015
AT
LA
NT
IC C
OU
NT
Y S
PE
CIA
L S
ER
VIC
ES
SC
HO
OL
DIS
TR
ICT
CA
PIT
AL
PR
OJE
CT
S F
UN
DS
UM
MA
RY
SC
HD
UL
E O
F P
RO
JEC
T E
XP
EN
DIT
UR
ES
FO
R M
AN
AG
ED
CA
PIT
AL
PR
OJE
CT
SF
OR
TH
E F
ISC
AL
YE
AR
EN
DE
D J
UN
E 3
0, 2
015
EX
PE
ND
ITU
RE
S
117

EXHIBIT F-2
Revenues:State Sources - ROD Grant -$ Transfer from Capital Reserve -
Total Revenues -
Expenditures:Purchased Professional & Technical Services 177,184
Total Expenditures 177,184
Other Financing Sources/(Uses):Transfer to Capital Reserve (52,999) Cancellation of Receivable Balance (57,373)
Total Other Financing Sources/(Uses) (110,372)
Excess/(Deficiency) of Revenues Over/(Under) Expenditures (287,556) Fund Balance - Beginning 322,158
Fund Balance - Ending 34,602$
FOR THE FISCAL YEAR ENDED JUNE 30, 2015
ATLANTIC COUNTY SPECIAL SERVICES SCHOOL DISTRICTCAPITAL PROJECTS FUND
SUMMARY STATEMENT OF PROJECT EXPENDITURES
118

EXHIBIT F-2a
REVISEDPRIOR CURRENT AUTHORIZED
PERIODS YEAR TOTALS COST
Revenues & Other Financing Sources:State Sources - ROD Grant 131,733$ -$ 131,733$ 131,733$ Transfer from Capital Reserve 197,600 - 197,600 197,600
Total Revenues 329,333 - 329,333 329,333
Expenditures & Other Financing Uses: Purchased Professional & Technical Services 7,175 177,184 184,359 218,961
Transfer to Capital Reserve - 52,999 52,999 52,999 Cancellation of Receivable Balance - 57,373 57,373 57,373
Total Expenditures 7,175 287,556 294,731 329,333
Excess/(Deficiency) of Revenues Over/(Under) Expenditures 322,158$ (287,556)$ 34,602$ -$
Project Number 0125-060-14-1002; 0125-060-14-1004Grant Date 04/09/14Bond Authorization Date N/ABonds Authorization N/ABonds Issued N/AOriginal Authorized Cost 329,333.00$ Additional Authorized Cost -$ Revised Authorized Cost 329,333.00$
Percentage Increase Over Original Authorized Cost N/APercentage Completion 100.00%Original Target Completion Date September 2014Revised Target Completion Date September 2014
Additional Project Information:
PROJECT STATUS--BUDGETARY BASIS
ATLANTIC COUNTY SPECIAL SERVICES SCHOOL DISTRICTCAPITAL PROJECTS FUND
SCHEDULE OF PROJECT REVENUES, EXPENDITURES, PROJECT BALANCE, AND
FROM INCEPTION AND FOR THE YEAR ENDED JUNE 30, 2015RENOVATIONS AND UPGRADES TO HIGH SCHOOL
119

This page intentionally left blank.
120

G. Proprietary Funds
121

This page intentionally left blank
122

Enterprise Funds
123

This page intentionally left blank
124

EX
HIB
IT G
-1
ITIN
ER
AN
T/
FO
OD
SH
AR
ED
SC
HO
OL
SC
OU
NT
YS
TA
TE
SE
RV
ICE
TR
AN
SP
OR
TA
TIO
NS
ER
VIC
ES
TO
CA
RE
ER
SP
RO
GR
AM
SP
RO
GR
AM
S20
15
Cur
rent
Ass
ets:
Cas
h -
$
1,
519,
883
$
430,
815
$
-$
-$
20
,721
$
1,97
1,41
9$
A
ccou
nts
Rec
eiva
ble:
Fed
era l
18,0
70
-
-
-
-
-
18
,070
Sta
te23
9
-
-
-
-
-
23
9
O
the r
10,6
34
65
4,90
7
24
5,27
6
4,
375
16
2,98
1
42,0
43
1,
120,
216
Inte
rfun
d R
ecei
vabl
e75
,091
-
-
-
-
-
75,0
91
In
vent
ory
18,2
13
-
-
-
-
-
18
,213
Tot
al C
urre
nt A
sset
s12
2,24
7
2,
174,
790
67
6,09
1
4,
375
16
2,98
1
62,7
64
3,
203,
248
Non
curr
ent A
sset
s:L
and
and
Impr
ovem
ent s
-
73
,500
-
-
-
-
73
,500
Bui
ldin
g an
d Im
prov
emen
t s-
510,
210
-
-
-
-
510,
210
M
achi
nery
and
Equ
ipm
ent
584,
587
3,49
3,85
4
-
-
-
-
4,07
8,44
1
L
ess:
Acc
umul
ated
Dep
reci
atio
n(4
79,5
15)
(2
,647
,864
)
-
-
-
-
(3,1
27,3
79)
Tot
al N
oncu
rren
t Ass
ets
105,
072
1,42
9,70
0
-
-
-
-
1,53
4,77
2
Tot
al A
sset
s22
7,31
9
3,
604,
490
67
6,09
1
4,
375
16
2,98
1
62,7
64
4,
738,
020
Cur
rent
Lia
bili
ties
:A
ccou
nts
Pay
able
1,19
3
144,
050
2,36
8
-
-
-
14
7,61
1
Inte
rfun
d P
ayab
l e19
5,55
2
-
26
7,09
1
1,
195
14
2,01
3
-
605,
851
Tot
al C
urre
nt L
iabi
liti
es19
6,74
5
14
4,05
0
26
9,45
9
1,
195
14
2,01
3
-
753,
462
Non
curr
ent L
iabi
liti
es:
Com
pens
ated
Abs
ence
s14
,013
180,
673
-
-
-
-
194,
686
Tot
al N
oncu
rren
t Lia
bili
ties
14,0
13
18
0,67
3
-
-
-
-
19
4,68
6
Tot
al L
iabi
liti
es21
0,75
8
32
4,72
3
26
9,45
9
1,
195
14
2,01
3
-
948,
148
Inve
sted
in C
apit
al A
sset
s ,N
et o
f R
elat
ed D
ebt
105,
072
1,42
9,70
0
-
-
-
-
1,53
4,77
2
U
nres
tric
ted
(88,
511)
1,85
0,06
7
406,
632
3,18
0
20,9
68
62
,764
2,25
5,10
0
Tot
al N
et P
osit
ion
16,5
61$
3,27
9,76
7$
40
6,63
2$
3,
180
$
20
,968
$
62,7
64$
3,
789,
872
$
NE
T P
OS
ITIO
N
ST
AT
EM
EN
T O
F N
ET
PO
SIT
ION
AS
OF
JU
NE
30,
201
5
AT
LA
NT
IC C
OU
NT
Y S
PE
CIA
L S
ER
VIC
ES
SC
HO
OL
DIS
TR
ICT
EN
TE
RP
RIS
E F
UN
DS
AS
SE
TS
LIA
BIL
ITIE
S
125
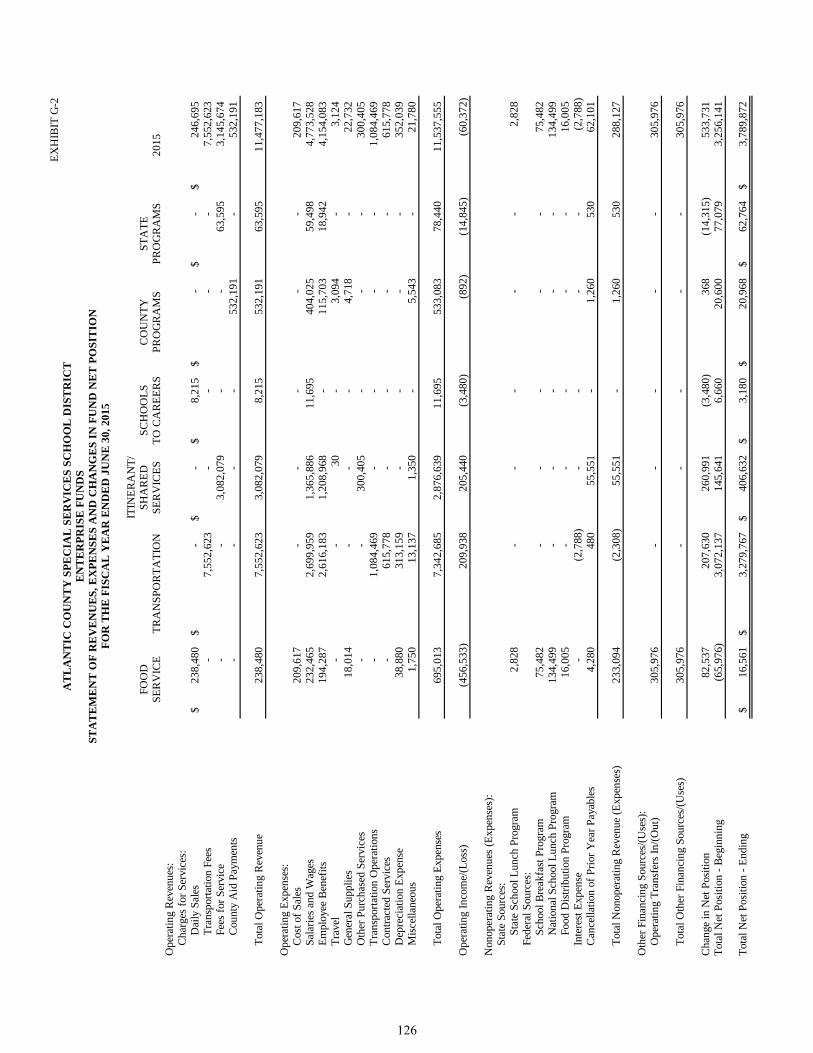
EX
HIB
IT G
-2
ITIN
ER
AN
T/
FOO
DS
HA
RE
DS
CH
OO
LS
CO
UN
TY
ST
AT
ES
ER
VIC
ET
RA
NS
PO
RT
AT
ION
SE
RV
ICE
ST
O C
AR
EE
RS
PR
OG
RA
MS
PR
OG
RA
MS
2015
Ope
ratin
g R
even
ues:
Cha
rges
for
Ser
vice
s:D
aily
Sal
es23
8,48
0$
-
$
-$
8,
215
$
-
$
-
$
246,
695
$
Tra
nspo
rtat
ion
Fees
-
7,
552,
623
-
-
-
-
7,
552,
623
Fe
es f
or S
ervi
ce-
-
3,
082,
079
-
-
63,5
95
3,
145,
674
C
ount
y A
id P
aym
ents
-
-
-
-
532,
191
-
53
2,19
1
Tot
al O
pera
ting
Rev
enue
238,
480
7,
552,
623
3,
082,
079
8,21
5
532,
191
63,5
95
11
,477
,183
Ope
ratin
g E
xpen
ses:
Cos
t of
Sal
es20
9,61
7
-
-
-
-
-
20
9,61
7
S
alar
ies
and
Wag
es23
2,46
5
2,69
9,95
9
1,36
5,88
6
11
,695
40
4,02
5
59
,498
4,77
3,52
8
Em
ploy
ee B
enef
its19
4,28
7
2,61
6,18
3
1,20
8,96
8
-
115,
703
18,9
42
4,
154,
083
T
rave
l-
-
30
-
3,
094
-
3,12
4
Gen
eral
Sup
plie
s18
,014
-
-
-
4,
718
-
22,7
32
Oth
er P
urch
ased
Ser
vice
s-
-
30
0,40
5
-
-
-
30
0,40
5
T
rans
port
atio
n O
pera
tions
-
1,
084,
469
-
-
-
-
1,
084,
469
C
ontr
acte
d S
ervi
ces
-
61
5,77
8
-
-
-
-
61
5,77
8
D
epre
ciat
ion
Exp
ense
38,8
80
31
3,15
9
-
-
-
-
35
2,03
9
M
isce
llane
ous
1,75
0
13,1
37
1,
350
-
5,54
3
-
21
,780
Tot
al O
pera
ting
Exp
ense
s69
5,01
3
7,34
2,68
5
2,87
6,63
9
11
,695
53
3,08
3
78
,440
11,5
37,5
55
Ope
ratin
g In
com
e/(L
oss)
(456
,533
)
209,
938
205,
440
(3
,480
)
(892
)
(1
4,84
5)
(6
0,37
2)
Non
oper
atin
g R
even
ues
(Exp
ense
s):
Sta
te S
ourc
es:
Sta
te S
choo
l Lun
ch P
rogr
am2,
828
-
-
-
-
-
2,82
8
Fede
ral S
ourc
es:
Sch
ool B
reak
fast
Pro
gram
75,4
82
-
-
-
-
-
75,4
82
Nat
iona
l Sch
ool L
unch
Pro
gram
134,
499
-
-
-
-
-
134,
499
Food
Dis
trib
utio
n P
rogr
am16
,005
-
-
-
-
-
16
,005
In
tere
st E
xpen
se-
(2,7
88)
-
-
-
-
(2
,788
)
Can
cella
tion
of P
rior
Yea
r P
ayab
les
4,28
0
480
55,5
51
-
1,26
0
530
62,1
01
Tot
al N
onop
erat
ing
Rev
enue
(E
xpen
ses)
233,
094
(2
,308
)
55,5
51
-
1,26
0
530
288,
127
Oth
er F
inan
cing
Sou
rces
/(U
ses)
:O
pera
ting
Tra
nsfe
rs I
n/(O
ut)
305,
976
-
-
-
-
-
305,
976
Tot
al O
ther
Fin
anci
ng S
ourc
es/(
Use
s)30
5,97
6
-
-
-
-
-
30
5,97
6
Cha
nge
in N
et P
ositi
on82
,537
207,
630
260,
991
(3
,480
)
368
(14,
315)
533,
731
Tot
al N
et P
ositi
on -
Beg
inni
ng(6
5,97
6)
3,
072,
137
14
5,64
1
6,66
0
20,6
00
77,0
79
3,
256,
141
Tot
al N
et P
ositi
on -
End
ing
16,5
61$
3,
279,
767
$
40
6,63
2$
3,
180
$
20
,968
$
62
,764
$
3,78
9,87
2$
AT
LA
NT
IC C
OU
NT
Y S
PE
CIA
L S
ER
VIC
ES
SC
HO
OL
DIS
TR
ICT
EN
TE
RP
RIS
E F
UN
DS
ST
AT
EM
EN
T O
F R
EV
EN
UE
S, E
XP
EN
SE
S A
ND
CH
AN
GE
S I
N F
UN
D N
ET
PO
SIT
ION
FO
R T
HE
FIS
CA
L Y
EA
R E
ND
ED
JU
NE
30,
201
5
126

EX
HIB
IT G
-3
ITIN
ER
AN
T/
FO
OD
SH
AR
ED
SC
HO
OL
SC
OU
NT
YS
TA
TE
SE
RV
ICE
TR
AN
SP
OR
TA
TIO
NS
ER
VIC
ES
TO
CA
RE
ER
SP
RO
GR
AM
SP
RO
GR
AM
S20
15C
ash
Flo
ws
from
Ope
rati
ng A
ctiv
itie
s:R
ecei
pts
from
Cus
tom
ers
240,
251
$
7,82
0,91
9$
3,
062,
363
$
13
,680
$
593,
009
$
83,0
22$
11
,813
,244
$
Pay
men
ts to
Em
ploy
ees
(232
,408
)
(2,7
44,5
25)
(1
,365
,886
)
(1
1,69
5)
(4
04,0
25)
(6
7,77
8)
(4
,826
,317
)
P
aym
ents
for
Em
ploy
ee B
enef
its
(194
,287
)
(2,6
16,1
83)
(1
,208
,968
)
-
(115
,703
)
(18,
942)
(4,1
54,0
83)
Pay
men
ts to
Sup
plie
rs(2
12,2
82)
(1
,590
,398
)
(305
,627
)
(3,3
35)
(1
7,73
9)
-
(2,1
29,3
81)
Net
Cas
h F
low
s F
rom
Ope
rati
ng A
ctiv
itie
s(3
98,7
26)
86
9,81
3
181,
882
(1,3
50)
55
,542
(3
,698
)
703,
463
Cas
h F
low
s F
rom
Cap
ital
Fin
anci
ng A
ctiv
itie
s:P
urch
ase
of E
quip
men
t-
(133
,796
)
-
-
-
-
(1
33,7
96)
In
tere
st P
aid
-
(2
,788
)
-
-
-
-
(2
,788
)
Pri
ncpa
l Pai
d on
Lea
se O
blig
atio
ns-
(138
,034
)
-
-
-
-
(1
38,0
34)
Net
Cas
h F
low
s F
rom
Cap
ital
Fin
anci
ng A
ctiv
itie
s-
(274
,618
)
-
-
-
-
(2
74,6
18)
Cas
h F
low
s F
rom
Non
capi
tal F
inan
cing
Act
ivit
ies:
Cas
h R
ecei
ved
Fro
m S
tate
& F
eder
al P
rogr
ams
212,
499
-
-
-
-
-
212,
499
Ope
rati
ng S
ubsi
diar
ies
and
Tra
nsfe
rs f
rom
/(to
) O
ther
Fun
ds18
6,22
7
(1
0,88
6)
-
1,
195
(5
5,54
2)
-
120,
994
Net
Cas
h F
low
s F
rom
Non
capi
tal F
inan
cing
Act
ivit
ies
398,
726
(10,
886)
-
1,19
5
(55,
542)
-
33
3,49
3
Net
Cha
nge
in C
ash
& C
ash
Equ
ival
ents
-
58
4,30
9
181,
882
(155
)
-
(3,6
98)
76
2,33
8
B
alan
ces
- B
egin
ning
of
Yea
r-
935,
574
24
8,93
3
15
5
-
24,4
19
1,20
9,08
1
Bal
ance
s -
End
ing
of Y
ear
-$
1,
519,
883
$
430,
815
$
-$
-
$
20,7
21$
1,
971,
419
$
Ope
rati
ng I
ncom
e (L
oss)
(456
,533
)$
209,
938
$
20
5,44
0$
(3
,480
)$
(892
)$
(1
4,84
5)$
(6
0,37
2)$
A
djus
tmen
ts to
Rec
onci
le O
pera
ting
Inc
ome
(Los
s)to
Cas
h P
rovi
ded
by (
Use
d in
) O
pera
ting
Act
ivit
ies:
Dep
reci
atio
n E
xpen
se38
,880
31
3,15
9
-
-
-
-
352,
039
Foo
d D
istr
ibut
ion
Pro
gram
16,0
05
-
-
-
-
-
16,0
05
Cha
nge
in A
sset
s &
Lia
bili
ties
:(I
ncre
ase)
/Dec
reas
e in
Acc
ount
s R
ecei
vabl
e1,
771
26
8,29
6
(19,
716)
5,46
5
60,8
18
19,4
27
336,
061
(Inc
reas
e)/D
ecre
ase
in I
nven
tory
6,22
0
-
-
-
-
-
6,22
0
Incr
ease
/(D
ecre
ase)
in A
ccou
nts
Pay
able
(5,1
26)
12
2,98
6
(3,8
42)
(3
,335
)
(4,3
84)
-
106,
299
Incr
ease
/(D
ecre
ase)
in C
ompe
nsat
ed A
bsen
ces
57
(44,
566)
-
-
-
(8,2
80)
(5
2,78
9)
Net
Cas
h F
low
s F
rom
Ope
rati
ng A
ctiv
itie
s(3
98,7
26)
$
86
9,81
3$
181,
882
$
(1,3
50)
$
55
,542
$
(3,6
98)
$
70
3,46
3$
Rec
onci
liat
ion
of O
pera
ting
Inc
ome/
(Los
s) to
Net
Cas
h F
low
s F
rom
Ope
rati
ng A
ctiv
itie
s:
AT
LA
NT
IC C
OU
NT
Y S
PE
CIA
L S
ER
VIC
ES
SC
HO
OL
DIS
TR
ICT
EN
TE
RP
RIS
E F
UN
DS
ST
AT
EM
EN
T O
F C
AS
H F
LO
WS
FO
R T
HE
FIS
CA
L Y
EA
R E
ND
ED
JU
NE
30,
201
5
127

This page intentionally left blank
128

Internal Service Fund
Not Applicable
129

This page intentionally left blank
130

H. Fiduciary Fund
131

This page intentionally left blank
132

EXHIBIT H-1
PRIVATEPURPOSE
UNEMPLOYMENTCOMPENSATION STUDENT
INSURANCE ACTIVITY PAYROLL 2015
Assets:Cash & Cash Equivalents 210,146$ 63,667$ 65,885$ 339,698$
Total Assets 210,146 63,667 65,885 339,698
Liabilities:Unemployment Claims Payable 2,883 - - 2,883 Interfund - - 6,282 6,282 Payroll Deductions &
Withholdings - - 59,603 59,603 Due to Student Groups - 63,667 - 63,667
Total Liabilities 2,883 63,667 65,885 132,435
Reserved 207,263$ -$ -$ 207,263$
ASSETS
LIABILITIES
NET POSITION
AGENCY FUNDS
ATLANTIC COUNTY SPECIAL SERVICES SCHOOL DISTRICTFIDUCIARY FUNDS
COMBINING STATEMENT OF FIDUCIARY NET POSITIONJUNE 30, 2015
133

EXHIBIT H-2
PRIVATEPURPOSE
UNEMPLOYMENTCOMPENSATION
INSURANCE 2015
Additions:Local Sources:
Employee Salary Deductions 34,329$ 34,329$ Board Contribution 18,000 18,000
Total Operating Revenues 52,329 52,329
Other Sources:Interest on Investments 715 715
Total Additions 53,044 53,044
Deductions:Unemployment Compensation Insurance Claims 21,567 21,567
Total Deductions 21,567 21,567
Change in Net Position 31,477 31,477 Net Position, July 1 175,786 175,786
Net Position, June 30 207,263$ 207,263$
ATLANTIC COUNTY SPECIAL SERVICES SCHOOL DISTRICTFIDUCIARY FUNDS
COMBINING STATEMENT OF CHANGES IN FIDUCIARY NET POSITIONJUNE 30, 2015
134
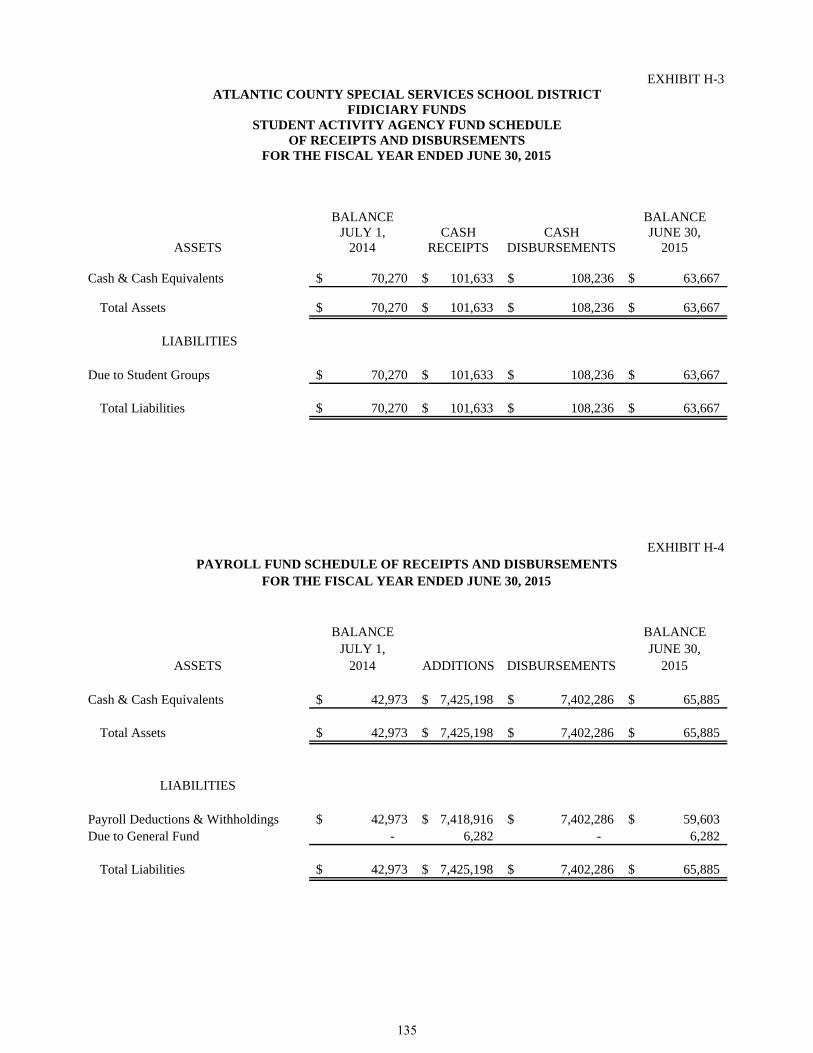
EXHIBIT H-3
BALANCE BALANCEJULY 1, CASH CASH JUNE 30,
2014 RECEIPTS DISBURSEMENTS 2015
Cash & Cash Equivalents 70,270$ 101,633$ 108,236$ 63,667$
Total Assets 70,270$ 101,633$ 108,236$ 63,667$
Due to Student Groups 70,270$ 101,633$ 108,236$ 63,667$
Total Liabilities 70,270$ 101,633$ 108,236$ 63,667$
EXHIBIT H-4
BALANCE BALANCEJULY 1, JUNE 30,
2014 ADDITIONS DISBURSEMENTS 2015
Cash & Cash Equivalents 42,973$ 7,425,198$ 7,402,286$ 65,885$
Total Assets 42,973$ 7,425,198$ 7,402,286$ 65,885$
Payroll Deductions & Withholdings 42,973$ 7,418,916$ 7,402,286$ 59,603$ Due to General Fund - 6,282 - 6,282
Total Liabilities 42,973$ 7,425,198$ 7,402,286$ 65,885$
LIABILITIES
ASSETS
ASSETS
LIABILITIES
PAYROLL FUND SCHEDULE OF RECEIPTS AND DISBURSEMENTSFOR THE FISCAL YEAR ENDED JUNE 30, 2015
ATLANTIC COUNTY SPECIAL SERVICES SCHOOL DISTRICTFIDICIARY FUNDS
STUDENT ACTIVITY AGENCY FUND SCHEDULE
FOR THE FISCAL YEAR ENDED JUNE 30, 2015OF RECEIPTS AND DISBURSEMENTS
135

This page intentionally left blank
136

I. Long-Term Debt
Not Applicable
137

This page intentionally left blank
138

STATISTICAL SECTION (Unaudited)
139

This page intentionally left blank
140

EX
HIB
IT J
-1
2015
2014
2013
2012
2011
2010
2009
2008
2007
2006
Gov
ernm
enta
l Act
ivit
ies:
Inve
sted
in C
apit
al A
sset
s,N
et o
f R
elat
ed D
ebt
21,4
91,9
16$
22
,029
,125
$
22
,911
,095
$
22
,859
,252
$
23
,554
,439
$
24
,384
,588
$
25
,095
,099
$
25
,881
,453
$
26
,168
,488
$
26
,832
,193
$
R
estr
icte
d51
0,49
2
502,
986
43
1,66
0
35
1,94
9
22
0,87
6
28
2,15
7
189,
785
91,6
57
31,8
12
955,
931
Unr
estr
icte
d(2
1,77
3,11
1)
2,23
7,14
8
2,
805,
165
3,
119,
820
4,
063,
779
3,
502,
274
3,43
3,76
0
1,40
0,01
8
2,73
1,40
9
1,82
7,39
5
Tot
al G
over
nmen
tal A
ctiv
itie
sN
et P
osit
ion
229,
297
24
,769
,259
26
,147
,920
26
,331
,021
27
,839
,094
28
,169
,019
28
,718
,644
27
,373
,128
28
,931
,709
29
,615
,519
Bus
ines
s-T
ype
Act
ivit
ies:
Inve
sted
in C
apit
al A
sset
s,N
et o
f R
elat
ed D
ebt
1,53
4,77
2
1,
753,
014
2,11
9,60
6
1,43
6,44
5
1,39
8,48
7
1,39
5,56
0
1,
282,
907
1,
310,
824
1,
370,
104
1,
468,
824
R
estr
icte
d-
-
-
-
-
-
-
-
-
1,38
9,60
4
Unr
estr
icte
d2,
255,
100
1,50
3,12
7
1,
638,
304
2,
304,
396
2,
268,
554
3,
208,
924
4,00
2,78
1
3,51
4,53
6
2,48
2,58
3
-
Tot
al B
usin
ess-
Typ
e A
ctiv
itie
sN
et P
osit
ion
3,78
9,87
2
3,
256,
141
3,75
7,91
0
3,74
0,84
1
3,66
7,04
1
4,60
4,48
4
5,
285,
688
4,
825,
360
3,
852,
687
2,
858,
428
Dis
tric
t-W
ide:
Inve
sted
in C
apit
al A
sset
s,N
et o
f R
elat
ed D
ebt
23,0
26,6
88
23
,782
,138
25
,030
,701
24
,295
,697
24
,952
,926
25
,780
,148
26
,378
,006
27
,192
,277
27
,538
,592
28
,301
,017
R
estr
icte
d51
0,49
2
502,
986
43
1,66
0
35
1,94
9
22
0,87
6
28
2,15
7
189,
785
91,6
57
31,8
12
2,34
5,53
5
Unr
estr
icte
d(1
9,51
8,01
1)
3,74
0,27
5
4,
443,
469
5,
424,
216
6,
332,
333
6,
711,
198
7,43
6,54
1
4,91
4,55
4
5,21
3,99
2
1,82
7,39
5
Tot
a l D
istr
ict-
Wid
e N
et P
osit
ion
4,01
9,16
9$
28
,025
,399
$
29
,905
,830
$
30
,071
,862
$
31
,506
,135
$
32
,773
,503
$
34
,004
,332
$
32
,198
,488
$
32
,784
,396
$
32
,473
,947
$
AT
LA
NT
IC C
OU
NT
Y S
PE
CIA
L S
ER
VIC
ES
SC
HO
OL
DIS
TR
ICT
NE
T P
OS
ITIO
N B
Y C
OM
PO
NE
NT
LA
ST
TE
N F
ISC
AL
YE
AR
S(A
ccru
al B
asis
of
Acc
oun
tin
g)
FIS
CA
L Y
EA
R E
ND
ING
JU
NE
30 ,
141

EX
HIB
IT J
-2
2015
2014
2013
2012
2011
2010
2009
2008
2007
2006
Exp
ense
s:G
over
nmen
tal A
ctiv
itie
sIn
stru
ctio
n:S
peci
al E
duca
tion
al I
nstr
ucti
on7,
607,
307
$
7,84
5,08
1$
7,
601,
339
$
11,2
19,5
41$
11,1
49,0
57$
11,5
76,2
16$
11,3
57,8
83$
12,1
78,6
05$
11,6
05,2
25$
10,2
25,3
18$
Oth
er
855,
485
76
1,45
7
769,
477
1,
151,
081
1,10
3,77
3
1,
087,
259
997,
651
83
7,66
9
829,
755
82
8,31
5
Sup
port
Ser
vice
s:S
tude
nt &
Ins
truc
tion
Rel
ated
Ser
vice
s2,
884,
228
3,03
8,66
9
3,
011,
649
4,21
2,37
0
4,
251,
924
4,33
3,61
1
3,
949,
841
3,99
6,71
5
3,
877,
206
3,59
3,11
1
G
ener
al A
dmin
istr
ativ
e S
ervi
ces
672,
983
63
1,21
6
604,
907
89
9,14
4
1,09
0,68
6
1,
497,
142
1,43
3,61
7
1,
526,
928
1,46
8,48
1
1,
262,
042
Sch
ool A
dmin
istr
ativ
e S
ervi
ces
1,17
4,99
4
1,
115,
928
1,08
9,89
0
1,
632,
110
1,60
1,94
9
91
2,73
4
970,
627
89
9,44
2
936,
755
88
3,17
6
Pla
nt O
pera
tion
s &
Mai
nten
ance
1,60
7,41
0
1,
653,
937
775,
391
2,
327,
684
2,19
6,97
9
2,
137,
797
2,16
9,67
5
2,
044,
254
2,05
8,52
0
2,
518,
188
Pup
il T
rans
port
atio
n29
,214
27,3
89
38
,272
44,4
53
56
,145
61,2
97
51
,088
46,2
57
80
,109
49,4
98
U
nall
ocat
ed B
enef
its
9,04
3,97
0
6,
750,
637
6,73
4,75
3
-
-
-
-
-
-
-
Cap
ital
Out
lay
-
-
-
32
,246
-
2,
067
23
2
2,
443
13,9
32
-
Una
lloc
ated
Dep
reci
atio
n79
8,07
9
889,
920
91
6,30
7
-
-
-
-
-
-
-
Tot
al G
over
nmen
tal A
ctiv
itie
s E
xpen
ses
24,6
73,6
70
22,7
14,2
34
21,5
41,9
85
21,5
18,6
29
21,4
50,5
13
21,6
08,1
23
20,9
30,6
14
21,5
32,3
13
20,8
69,9
83
19,3
59,6
48
Bus
ines
s-T
ype
Act
ivit
ies:
Foo
d S
ervi
ce69
5,01
3
709,
251
68
1,85
8
718,
931
67
3,02
3
669,
690
66
3,68
7
674,
572
64
3,92
2
632,
269
T
rans
port
atio
n7,
345,
473
7,51
0,04
5
7,
725,
596
7,57
5,92
0
7,
022,
680
6,78
0,31
0
7,
109,
580
6,97
1,98
0
6,
448,
539
4,89
6,80
3
In
stru
ctio
n3,
499,
857
3,46
2,62
0
4,
042,
881
3,78
8,68
9
3,
234,
016
3,33
4,69
9
3,
204,
979
2,29
0,25
4
2,
371,
551
4,10
5,46
7
Tot
al B
usin
ess-
Typ
e A
ctiv
itie
s E
xpen
se11
,540
,343
11
,681
,916
12
,450
,335
12
,083
,540
10
,929
,719
10
,784
,699
10
,978
,246
9,
936,
806
9,46
4,01
2
9,
634,
539
Tot
al D
istr
ict E
xpen
ses
36,2
14,0
13$
34,3
96,1
50$
33,9
92,3
20$
33,6
02,1
69$
32,3
80,2
32$
32,3
92,8
22$
31,9
08,8
60$
31,4
69,1
19$
30,3
33,9
95$
28,9
94,1
87$
Rev
enue
s:G
over
nmen
tal A
ctiv
itie
s:C
harg
es f
or S
ervi
ces:
Inst
ruct
ion
(Tui
tion
)17
,300
,771
$
17
,511
,058
$
17
,045
,538
$
16
,440
,380
$
17
,736
,399
$
17
,521
,091
$
18
,841
,028
$
15
,603
,048
$
16
,472
,680
$
15
,608
,045
$
O
pera
ting
Gra
nts
& C
ontr
ibut
ions
3,67
3,67
7
1,
555,
966
1,76
3,87
2
46
,464
9,78
3
251,
596
26
1,08
5
311,
074
26
7,38
7
801,
462
Tot
al G
over
nmen
tal A
ctiv
itie
sP
rogr
am R
even
ues
20,9
74,4
48
19,0
67,0
24
18,8
09,4
10
16,4
86,8
44
17,7
46,1
82
17,7
72,6
87
19,1
02,1
13
15,9
14,1
22
16,7
40,0
67
16,4
09,5
07
Bus
ines
s-T
ype
Act
ivit
ies:
Cha
rges
for
Ser
vice
s:F
ood
Ser
vice
238,
480
24
9,91
5
273,
208
25
1,79
2
257,
233
25
1,91
8
266,
283
26
5,26
1
255,
956
24
4,64
3
Tra
nspo
rtat
ion
7,55
2,62
3
7,
137,
544
7,98
8,91
4
8,
379,
071
6,57
6,25
7
6,
597,
983
7,69
5,33
7
7,
260,
097
6,93
6,28
8
4,
980,
494
Inst
ruct
ion
3,68
6,08
0
3,
428,
023
3,57
1,22
0
3,
101,
450
2,86
7,59
1
2,
888,
119
3,08
6,84
7
3,
064,
372
2,90
3,70
2
4,
546,
736
Ope
rati
ng G
rant
s an
d C
ontr
ibut
ions
228,
814
23
1,66
5
195,
504
20
8,70
4
215,
087
23
1,67
5
235,
763
21
1,94
8
203,
712
22
9,23
3
Tot
al B
usin
ess-
Typ
e A
ctiv
itie
sP
rogr
am R
even
ues
11,7
05,9
97
11,0
47,1
47
12,0
28,8
46
11,9
41,0
17
9,91
6,16
8
9,
969,
695
11,2
84,2
30
10,8
01,6
78
10,2
99,6
58
10,0
01,1
06
Tot
al D
istr
ict P
rogr
am R
even
ues
32,6
80,4
45$
30,1
14,1
71$
30,8
38,2
56$
28,4
27,8
61$
27,6
62,3
50$
27,7
42,3
82$
30,3
86,3
43$
26,7
15,8
00$
27,0
39,7
25$
26,4
10,6
13$
Net
(E
xpen
se)/
Rev
enue
:G
over
nmen
tal A
ctiv
itie
s(3
,699
,222
)$
(3
,647
,210
)$
(2
,732
,575
)$
(5
,031
,785
)$
(3
,704
,331
)$
(3
,835
,436
)$
(1
,828
,501
)$
(5
,618
,191
)$
(4
,129
,916
)$
(2
,950
,141
)$
B
usin
ess-
Typ
e A
ctiv
itie
s16
5,65
4
(634
,769
)
(421
,489
)
(142
,523
)
(1,0
13,5
51)
(815
,004
)
305,
984
86
4,87
2
835,
646
36
6,56
7
Tot
al G
over
nmen
t-W
ide
Net
Exp
ense
(3,5
33,5
68)
$
(4
,281
,979
)$
(3,1
54,0
64)
$
(5
,174
,308
)$
(4,7
17,8
82)
$
(4
,650
,440
)$
(1
,522
,517
)$
(4,7
53,3
19)
$
(3
,294
,270
)$
(2,5
83,5
74)
$
AT
LA
NT
IC C
OU
NT
Y S
PE
CIA
L S
ER
VIC
ES
SC
HO
OL
DIS
TR
ICT
CH
AN
GE
S I
N N
ET
PO
SIT
ION
- (
AC
CR
UA
L B
AS
IS O
F A
CC
OU
NT
ING
)L
AS
T T
EN
FIS
CA
L Y
EA
RS FIS
CA
L Y
EA
R E
ND
ING
JU
NE
30,
142

EX
HIB
IT J
-2
2015
2014
2013
2012
2011
2010
2009
2008
2007
2006
AT
LA
NT
IC C
OU
NT
Y S
PE
CIA
L S
ER
VIC
ES
SC
HO
OL
DIS
TR
ICT
CH
AN
GE
S I
N N
ET
PO
SIT
ION
- (
AC
CR
UA
L B
AS
IS O
F A
CC
OU
NT
ING
)L
AS
T T
EN
FIS
CA
L Y
EA
RS FIS
CA
L Y
EA
R E
ND
ING
JU
NE
30,
Gen
eral
Rev
enue
s &
Oth
er C
hang
es in
Net
Pos
itio
n:G
over
nmen
tal A
ctiv
itie
s:T
axes
- C
ount
y A
ppro
pria
tion
s2,
050,
096
$
2,05
0,09
6$
2,
039,
796
$
1,99
9,80
0$
1,
980,
000
$
1,98
0,00
0$
1,
980,
000
$
1,92
0,00
0$
1,
854,
000
$
1,80
0,00
0$
F
eder
al &
Sta
te A
id -
Not
Res
tric
ted
610,
235
11
6,23
3
215,
658
1,
623,
163
1,31
6,89
4
1,
293,
710
1,21
9,54
1
1,
471,
192
1,47
2,19
3
-
Mis
cell
aneo
us I
ncom
e16
1,43
8
223,
087
43
2,34
3
108,
554
14
5,04
6
79,4
91
85
,904
224,
737
21
8,81
3
550,
574
T
rans
fers
(305
,976
)
(133
,000
)
(139
,126
)
(215
,544
)
(74,
340)
(128
,078
)
(117
,503
)
(107
,801
)
(98,
900)
(90,
000)
Con
trib
uted
Ser
vice
s-
-
-
-
-
-
-
535,
000
-
-
C
ance
llat
ion
of P
rior
Yea
r P
ayab
les
60,5
82
12
,133
803
7,73
9
6,80
9
185
7,11
4
17,0
17
-
-
L
oss
on th
e D
ispo
sal o
f F
ixed
Ass
ets
-
-
-
-
-
-
(1,0
39)
(535
)
-
-
Adj
ustm
ent t
o C
apit
al A
sset
s-
-
-
-
-
60,5
03
-
-
-
-
R
ecei
vabl
e C
ance
lled
(57,
373)
-
-
-
-
-
-
-
-
-
Tot
al G
over
nmen
tal A
ctiv
itie
s2,
519,
002
2,26
8,54
9
2,
549,
474
3,52
3,71
2
3,
374,
409
3,28
5,81
1
3,
174,
017
4,05
9,61
0
3,
446,
106
2,26
0,57
4
Bus
ines
s-T
ype
Act
ivit
ies
:M
isce
llan
eous
Inc
ome
-
-
-
77
9
1,
768
5,
722
36
,841
-
-
-
T
rans
fers
305,
976
13
3,00
0
139,
126
21
5,54
4
74,3
40
12
8,07
8
117,
503
10
7,80
1
98,9
00
90
,000
Can
cell
atio
n of
Pri
or Y
ear
Pay
able
s62
,101
-
2,
608
-
-
-
-
-
-
-
Adj
ustm
ent t
o C
apit
al A
sset
s-
-
29
6,82
4
-
-
-
-
-
-
-
Tot
al B
usin
ess-
Typ
e A
ctiv
itie
s36
8,07
7
133,
000
43
8,55
8
216,
323
76
,108
133,
800
15
4,34
4
107,
801
98
,900
90,0
00
Tot
al G
over
nmen
t-W
ide
2,88
7,07
9$
2,
401,
549
$
2,98
8,03
2$
3,
740,
035
$
3,45
0,51
7$
3,
419,
611
$
3,32
8,36
1$
4,
167,
411
$
3,54
5,00
6$
2,
350,
574
$
Cha
nge
in N
et P
osit
ion:
Gov
ernm
enta
l Act
ivit
ies
(1,1
80,2
20)
$
(1,3
78,6
61)
$
(183
,101
)$
(1,5
08,0
73)
$
(329
,922
)$
(549
,625
)$
1,34
5,51
6$
(1
,558
,581
)$
(6
83,8
10)
$
(6
89,5
67)
$
B
usin
ess-
Typ
e A
ctiv
itie
s53
3,73
1
(501
,769
)
17,0
69
73
,800
(937
,443
)
(681
,204
)
460,
328
97
2,67
3
934,
546
45
6,56
7
Tot
al D
istr
ict
(646
,489
)$
(1
,880
,430
)$
(166
,032
)$
(1
,434
,273
)$
(1,2
67,3
65)
$
(1
,230
,829
)$
1,
805,
844
$
(585
,908
)$
25
0,73
6$
(233
,000
)$
143

EX
HIB
IT J
-3
2015
2014
2013
2012
2011
2010
2009
2008
2007
2006
Gen
eral
Fun
d:R
eser
ved
489,
731
$
30
9,69
1$
431,
660
$
1,
365,
844
$
2,
165,
853
$
28
2,15
7$
189,
785
$
91
,657
$
30
,866
$
73
9,13
9$
Ass
igne
d-
1,01
3,01
2
1,
040,
663
45,8
79
-
-
-
-
-
-
U
nass
igne
d2,
405,
779
1,80
4,83
1
2,
293,
645
2,56
2,48
6
2,
564,
614
-
-
-
-
-
U
nres
erve
d-
-
-
-
-
4,02
1,91
3
3,
947,
903
1,96
0,06
8
3,
403,
738
2,41
3,58
9
Tot
al G
ener
al F
und
2,89
5,51
0$
3,
127,
534
$
3,
765,
968
$
3,
974,
209
$
4,
730,
467
$
4,
304,
070
$
4,
137,
688
$
2,
051,
725
$
3,
434,
604
$
3,
152,
728
$
All
Oth
er G
over
nmen
tal F
unds
:A
ssig
ned,
Rep
orte
d in
:C
apit
al P
roje
ct F
und
20,7
61$
19
3,29
5$
-$
-$
98,9
22$
-$
5,30
2$
43
,651
$
57
,097
$
21
6,79
2$
Tot
al A
ll O
ther
Gov
ernm
enta
lF
unds
20,7
61$
19
3,29
5$
-
$
-
$
98,9
22$
-$
5,
302
$
43
,651
$
57
,097
$
21
6,79
2$
AT
LA
NT
IC C
OU
NT
Y S
PE
CIA
L S
ER
VIC
ES
SC
HO
OL
DIS
TR
ICT
FU
ND
BA
LA
NC
ES
AN
D G
OV
ER
NM
EN
TA
L F
UN
DS
LA
ST
TE
N F
ISC
AL
YE
AR
S(M
odif
ied
Acc
rual
Bas
is o
f A
ccou
nti
ng)
FIS
CA
L Y
EA
R E
ND
ING
JU
NE
30,
144

EX
HIB
IT J
-4
2015
2014
2013
2012
2011
2010
2009
2008
2007
2006
Rev
enue
s:C
ount
y A
ppro
pria
tion
s2,
050,
096
$
2,05
0,09
6$
2,
039,
796
$
1,99
9,80
0$
1,
980,
000
$
1,98
0,00
0$
1,
980,
000
$
1,92
0,00
0$
1,
854,
000
$
1,80
0,00
0$
T
uiti
on17
,300
,771
17,5
11,0
58
17,0
45,5
38
16,3
34,3
05
17,6
47,6
74
17,3
92,6
09
18,6
63,9
65
15,6
03,0
48
16,4
72,6
80
15,6
08,0
45
Inte
rest
Ear
ning
s1,
315
5,
189
7,63
1
76
9
187
2,
067
232
1,
451
240
39
9
Mis
cell
aneo
us19
4,42
8
227,
935
44
1,73
1
251,
526
24
3,36
7
217,
815
26
2,73
5
266,
354
25
6,28
2
525,
506
S
tate
Sou
rces
1,81
7,04
0
1,
550,
836
1,75
3,87
2
1,
481,
637
1,16
6,83
5
1,
338,
193
1,34
0,69
7
1,
593,
192
1,53
6,80
6
78
0,67
9
Fed
eral
Sou
rces
473,
389
11
1,32
6
208,
639
15
0,32
4
150,
059
19
5,20
4
139,
929
14
6,00
6
164,
119
20
,783
Tot
al R
even
ue21
,837
,039
21,4
56,4
40
21,4
97,2
07
20,2
18,3
61
21,1
88,1
22
21,1
25,8
88
22,3
87,5
58
19,5
30,0
51
20,2
84,1
27
18,7
35,4
12
Exp
endi
ture
s:In
stru
ctio
n:O
ther
Spe
cial
Ins
truc
tion
7,60
7,30
7
7,
845,
081
7,60
1,33
9
7,
635,
798
7,74
0,95
6
8,
144,
280
8,13
1,43
9
8,
660,
639
8,10
6,42
0
7,
531,
542
Oth
er I
nstr
ucti
on85
5,48
5
761,
457
76
9,47
7
783,
403
76
6,36
6
764,
925
71
4,24
7
595,
696
57
9,59
6
601,
031
S
uppo
rt S
ervi
ces:
Stu
dent
& I
nstr
ucti
on R
elat
ed2,
884,
228
3,03
8,66
9
3,
011,
649
2,86
6,85
6
2,
952,
174
3,04
8,84
9
2,
827,
806
2,84
2,20
6
2,
708,
285
2,66
5,72
8
S
choo
l Adm
inis
trat
ive
672,
983
63
1,21
6
604,
907
61
1,94
0
757,
282
64
2,14
1
694,
900
63
9,62
5
654,
337
64
7,64
7
Gen
eral
Adm
inis
trat
ive
450,
136
41
1,04
7
407,
138
35
7,71
9
369,
917
39
9,46
3
357,
009
40
0,70
7
406,
760
38
7,95
6
Cen
tral
Ser
vice
s72
4,85
8
704,
881
68
2,75
2
753,
063
74
2,34
0
688,
275
66
9,35
9
685,
146
61
8,99
6
612,
504
P
lant
Ope
rati
ons
& M
aint
enan
ce1,
620,
719
1,64
4,72
5
1,
654,
930
1,58
4,17
6
1,
525,
395
1,50
4,01
6
1,
553,
333
1,45
3,74
2
1,
437,
906
1,34
3,55
5
P
upil
Tra
nspo
rtat
ion
29,2
14
27
,389
38
,272
30
,253
38
,981
43
,125
36,5
76
32,8
95
55
,957
49
,497
U
nall
ocat
ed E
mpl
oyee
Ben
efit
s6,
846,
339
6,69
9,08
5
6,
708,
050
5,98
7,33
9
5,
633,
755
5,51
7,45
2
5,
149,
836
5,44
9,59
4
5,
217,
429
4,52
4,88
5
C
apit
al O
utla
y24
7,56
1
17,1
62
88,6
11
255,
189
68
,106
84
,389
95,0
50
610,
342
27
8,30
6
448,
563
Tot
al E
xpen
ditu
res
21,9
38,8
30
21
,780
,712
21
,567
,125
20
,865
,736
20
,595
,272
20
,836
,915
20
,229
,555
21
,370
,592
20
,063
,992
18
,812
,908
Exc
ess/
(Def
icie
ncy)
of
Rev
enue
sO
ver/
(Und
er)
Exp
endi
ture
s(1
01,7
91)
(3
24,2
72)
(69,
918)
(6
47,3
75)
592,
850
28
8,97
3
2,15
8,00
3
(1
,840
,541
)
220,
135
(7
7,49
6)
Oth
er F
inan
cing
Sou
rces
/(U
ses)
:C
ontr
ibut
ed S
ervi
ces
-
-
-
-
-
-
-
535,
000
-
-
C
ance
llat
ion
of P
rior
Yea
r P
ayab
les
60,5
82
12
,133
80
3
7,73
9
6,
809
185
7,
114
17,0
17
-
-
In
crea
se in
Cap
ital
Res
erve
-
-
-
75
,000
75
,000
15
6,74
9
100,
000
-
-
-
Tra
nsfe
r to
Cap
ital
Res
erve
-
-
-
(7
5,00
0)
(75,
000)
(1
00,0
00)
(1
00,0
00)
-
-
-
T
rans
fer
to E
mer
genc
y R
eser
ve-
-
-
-
-
(56,
749)
-
-
-
-
Tra
nsfe
rs I
n-
-
-
9,42
5
11
9,41
4
-
-
-
-
-
Tra
nsfe
rs O
ut(3
05,9
76)
(1
33,0
00)
(139
,126
)
(2
24,9
69)
(193
,754
)
(1
28,0
78)
(1
17,5
03)
(107
,801
)
(9
8,90
0)
(90,
000)
A
ppro
pria
tion
s C
ance
lled
(57,
373)
-
-
-
-
-
-
-
-
-
Tot
al O
ther
Fin
anci
ng S
ourc
es/
(Use
s)(3
02,7
67)
(1
20,8
67)
(138
,323
)
(2
07,8
05)
(67,
531)
(1
27,8
93)
(1
10,3
89)
444,
216
(9
8,90
0)
(90,
000)
Net
Cha
nge
in F
und
Bal
ance
s(4
04,5
58)
$
(4
45,1
39)
$
(208
,241
)$
(8
55,1
80)
$
525,
319
$
161,
080
$
2,
047,
614
$
(1
,396
,325
)$
121,
235
$
(167
,496
)$
Sou
rce:
Dis
tric
t Rec
ords
AT
LA
NT
IC C
OU
NT
Y S
PE
CIA
L S
ER
VIC
ES
SC
HO
OL
DIS
TR
ICT
CH
AN
GE
S I
N F
UN
D B
AL
AN
CE
S, G
OV
ER
NM
EN
TA
L F
UN
DS
LA
ST
TE
N F
ISC
AL
YE
AR
S(M
odif
ied
Acc
rual
Bas
is o
f A
ccou
nti
ng)
FIS
CA
L Y
EA
R E
ND
ING
JU
NE
30,
145

EXHIBIT J-5
FISCAL YEAR NON-RESIDENT SHAREDENDED JUNE 30, INTEREST FEES SERVICES MISCELLANEOUS TOTAL
2015 1,315$ 108,286$ 48,376$ 3,461$ 161,438$ 2014 5,189 118,769 55,486 43,643 223,0872013 7,631 129,518 111,281 183,913 432,3432012 769 106,075 104,251 3,534 214,6292011 187 243,367 243,5542010 70,160 149,722 219,8822009 52,088 210,879 262,9672008 162,861 61,876 224,7372007 201,916 15,951 217,8672006 135,744 390,161 525,905
Source: District Records
ATLANTIC COUNTY SPECIAL SERVICES SCHOOL DISTRICTGENERAL FUND - OTHER LOCAL REVENUE BY SOURCE
LAST TEN FISCAL YEARS(Modified Accrual Basis of Accounting)
146

EX
HIB
IT J
-16
2015
2014
2013
2012
2011
2010
2009
2008
2007
2006
Inst
ruct
ion:
Reg
ular
1010
1010
1010
108
88
Spe
cial
Edu
cati
on I
nstr
ucti
on59
5961
5957
5757
6058
62O
ther
Spe
cial
Edu
cati
on I
nstr
ucti
on14
214
213
514
014
515
414
116
015
715
7O
ther
Ins
truc
tion
al4
45
45
65
66
9N
onpu
blic
Sch
ool P
rogr
ams
43
32
22
Sup
port
Ser
vice
s:S
tude
nt &
Ins
truc
tion
al R
elat
ed S
ervi
ces
4343
4545
4348
4443
4648
Gen
eral
Adm
inis
trat
ion
Ser
vice
s2
22
22
22
22
2S
choo
l Adm
inis
trat
ion
Ser
vice
s8
88
89
1010
109
9B
usin
ess
Adm
inis
trat
ive
Ser
vice
s12
1212
1213
1211
1110
10P
lant
Ope
rati
ons
& M
aint
enan
ce16
1614
1817
1617
1616
11P
upil
Tra
nspo
rtat
ion
132
132
135
141
130
122
126
127
125
123
Foo
d S
ervi
ce8
89
99
99
98
8
Tot
al43
643
643
644
844
444
943
545
444
744
9
Sou
rce:
Dis
tric
t Rec
ords
AT
LA
NT
IC C
OU
NT
Y S
PE
CIA
L S
ER
VIC
ES
SC
HO
OL
DIS
TR
ICT
FU
LL
-TIM
E E
QU
IVA
LE
NT
DIS
TR
ICT
EM
PL
OY
EE
S B
Y F
UN
CT
ION
/PR
OG
RA
ML
AS
T T
EN
FIS
CA
L Y
EA
RS
FU
NC
TIO
N/P
RO
GR
AM
147

EX
HIB
IT J
-17
FIS
CA
LA
VE
RA
GE
AV
ER
AG
EY
EA
RD
AIL
YD
AIL
Y%
CH
AN
GE
IN
ST
UD
EN
TE
ND
ED
OP
ER
AT
ING
CO
ST
PE
RP
ER
CE
NT
AG
ET
EA
CH
ING
EL
EM
EN
TA
RY
MID
DL
EH
IGH
EN
RO
LL
ME
NT
AT
TE
ND
AN
CE
AV
ER
AG
E D
AIL
YA
TT
EN
DA
NC
EJU
NE
30,
EN
RO
LL
ME
NT
EX
PE
ND
ITU
RE
SP
UP
ILC
HA
NG
ES
TA
FFS
CH
OO
LS
CH
OO
LS
CH
OO
L(A
DE
)(A
DA
)E
NR
OL
LM
EN
TP
ER
CE
NT
AG
E
2015
406
21,7
27,3
4153
,516
069
6:1
6:1
6.5:
140
638
1-5
.82%
93.8
4%20
1443
121
,763
,500
50,4
950
696:
16:
16.
5:1
431.
138
8.5
-0.6
7%90
.12%
2013
439
21,5
50,1
0649
,089
071
6.2:
16.
2:1
6.2:
143
438
9-0
.91%
89.6
3%20
1243
819
,463
,680
44,4
380
597:
17:
17:
143
840
0-4
.16%
91.3
2%20
1145
719
,473
,436
42,6
110
578:
18.
5:1
7.5:
145
741
3-3
.99%
90.3
7%20
1049
920
,752
,526
41,5
880
578.
6:1
8.6:
18.
8:1
476
426
-2.8
6%89
.50%
2009
500
20,7
60,2
5041
,521
(0)
678:
18:
18:
149
044
04.
93%
89.8
0%20
0846
720
,760
,250
44,4
540
608:
18:
18:
146
742
7-0
.43%
91.4
3%20
0747
019
,785
,686
42,0
970
728:
18:
18:
146
942
7-2
.09%
91.0
4%20
0648
518
,737
,306
38,6
340
628:
18:
18:
147
942
5-5
.71%
88.7
3%
Sou
rce:
Dis
tric
t Rec
ords
AT
LA
NT
IC C
OU
NT
Y S
PE
CIA
L S
ER
VIC
ES
SC
HO
OL
DIS
TR
ICT
OP
ER
AT
ING
ST
AT
IST
ICS
LA
ST
TE
N F
ISC
AL
YE
AR
S
PU
PIL
/T
EA
CH
ER
RA
TIO
148

EX
HIB
IT J
-18
DIS
TR
ICT
BU
ILD
ING
S20
1520
1420
1320
1220
1120
1020
0920
0820
0720
06
Mai
n C
ampu
s -
May
s L
andi
ng (
2003
):S
quar
e F
eet
177,
000
177,
000
177,
000
177,
000
177,
000
177,
000
177,
000
177,
000
177,
000
177,
000
Cap
acit
y (S
tude
nts)
508
508
508
508
508
508
508
508
508
508
Enr
ollm
ent
406
431
439
438
457
499
500
471
470
476
Tra
nspo
rtat
ion
- M
ays
Lan
ding
Squ
are
Fee
t5,
700
5,70
05,
700
5,70
05,
700
5,70
05,
700
5,70
05,
700
5,70
0
Num
ber
of S
choo
ls a
t Jun
e 30
, 201
5:M
ain
Cam
pus
= 1
Oth
er =
1
Sou
rce:
Dis
tric
t Rec
ords
, AS
SA
AT
LA
NT
IC C
OU
NT
Y S
PE
CIA
L S
ER
VIC
ES
SC
HO
OL
DIS
TR
ICT
SC
HO
OL
BU
ILD
ING
IN
FO
RM
AT
ION
LA
ST
TE
N F
ISC
AL
YE
AR
S
149

EXHIBIT J-19
FISCALYEAR Mays Landing Campus
2015 427,027$ 2014 465,837 2013 484,235 2012 470,205 2011 637,223 2010 609,620 2009 629,165 2008 557,315 2007 551,285 2006 519,420
Total 5,351,332$
Source: District records
MAINTENANCE FOR SCHOOL FACILITIES11-000-261-xxx
ATLANTIC COUNTY SPECIAL SERVICES SCHOOL DISTRICTSCHEDULE OF REQUIRED MAINTENANCE
LAST TEN FISCAL YEARS
UNDISTRIBUTED EXPENDITURES - REQUIRED
150

EXHIBIT J-20
COVERAGE DEDUCTIBLECommercial Package Policy:
Property, Inland Marine & Automobile Physical Damage:Limit of Liability - Per Occurance 98,816,831 5,000
Public Official Bonds:Treasurer f School Monies 260,000Public Agency Compliance Officer 75,000
Comprehensive General Liability Coverage:Limit 31,000,000
Electronic Data Processing 822,000 1,000
Package Police Crime Coverage 1,000,000 1,000
Board Member Accident:Limit of Liability 100,000Aggregate 250,000
Student Accident (Compulsory):Maximum Benefit 1,000,000
Student Accident (Catastrophic):Maximum Benefit 5,000,000 25,000
Volunteer Accident:Maximum Benefit 250,000
Boiler and Machinery 100,000,000 5,000
Automobile Liability 31,000,000
Standard Worker's Compensation & Employer'sLiability Policy:
Workers Compensation - Coverage A StatutoryEmployee Liability Agreement - Converage B 2,000,000
School Board Legal Liability:Coverage A 31,000,000Coverage B Each Occurance 100,000 5,000
Policy Period 300,000 5,000
Pollution Liability:Each Occurance 1,000,000 25,000Policy Period 11,000,000 75,000
Cyber Risk Liability 2,000,000 20,000
ATLANTIC COUNTY SPECIAL SERVICES SCHOOL DISTRICTINSURANCE SCHEDULE
JUNE 30, 2015
151

This page intentionally left blank.
152

SINGLE AUDIT SECTION
153

This page intentionally left blank
154
EXHIBIT K-1
INDEPENDENT AUDITOR’S REPORT ON INTERNAL CONTROL OVER FINANCIAL REPORTING AND ON COMPLIANCE AND OTHER MATTERS BASED ON AN AUDIT OF
FINANCIAL STATEMENTS PERFORMED IN ACCORDANCE WITH GOVERNMENT AUDITING STANDARDS
Honorable President and Members of the Board of Education Atlantic County Special Services School District County of Atlantic Mays Landing, New Jersey 08830 We have audited, in accordance with the auditing standards generally accepted in the United States of America and the standards applicable to financial audits contained in Government Auditing Standards issued by the Comptroller General of the United States and audit requirements as prescribed by the Office of School Finance, Department of Education, State of New Jersey, the financial statements of the governmental and business-type activities, each major fund and the aggregate remaining fund information of the Atlantic County Special Services School District, as of and for the year ended June 30, 2015, and the related notes to the financial statements, which collectively comprise Atlantic County Special Services School District’s basic financial statements, and have issued our report thereon dated December 8, 2015. Internal Control Over Financial Reporting In planning and performing our audit of the financial statements, we considered Atlantic County Special Services School District's internal control over financial reporting (internal control) to determine the audit procedures that are appropriate in the circumstances for the purpose of expressing our opinions on the financial statements, but not for the purpose of expressing an opinion on the effectiveness of Atlantic County Special Services School District’s internal control. Accordingly, we do not express an opinion on the effectiveness of Atlantic County Special Services School District’s internal control. A deficiency in internal control exists when the design or operation of a control does not allow management or employees, in the normal course of performing their assigned functions, to prevent, or detect and correct, misstatements on a timely basis. A material weakness is a deficiency, or a combination of deficiencies, in internal control, such that there is a reasonable possibility that a material misstatement of the District’s financial statements will not be prevented, or detected and corrected on a timely basis. A significant deficiency is a deficiency, or a combination of deficiencies, in internal control that is less severe than a material weakness, yet important enough to merit attention by those charged with governance. Our consideration of internal control was for the limited purpose described in the first paragraph of this section and was not designed to identify all deficiencies in internal control that might be material weaknesses or significant deficiencies. Given these limitations, during our audit we did not identify any deficiencies in internal control that we consider to be material weaknesses. However, material weaknesses may exist that have not been identified.
155
Compliance and Other Matters As part of obtaining reasonable assurance about whether Atlantic County Special Services School District's financial statements are free from material misstatement, we performed tests of its compliance with certain provisions of laws, regulations, contracts, and grant agreements, noncompliance with which could have a direct and material effect on the determination of financial statement amounts. However, providing an opinion on compliance with those provisions was not an objective of our audit, and accordingly, we do not express such an opinion. The results of our tests disclosed no instances of noncompliance or other matters that are required to be reported under Government Auditing Standards and audit requirements as prescribed by the Office of School Finance, Department of Education, State of New Jersey. Purpose of this Report The purpose of this report is solely to describe the scope of our testing of internal control and compliance and the results of that testing, and not to provide an opinion on the effectiveness of the District’s internal control or on compliance. This report is an integral part of an audit performed in accordance with Government Auditing Standards and audit requirements as prescribed by the Office of School Finance, Department of Education, State of New Jersey, in considering the District’s internal control and compliance. Accordingly, this communication is not suitable for any other purpose.
Respectfully Submitted,
HOLMAN FRENIA ALLISON, P.C.
Robert W. Allison Certified Public Accountant Public School Accountant, No. 897
Toms River, New Jersey December 8, 2015
156

EXHIBIT K-2
INDEPENDENT AUDITOR’S REPORT ON COMPLIANCE FOR EACH MAJOR PROGRAM AND ON INTERNAL CONTROL OVER COMPLIANCE REQUIRED BY OMB CIRCULAR A-
133 AND NEW JERSEY OMB CIRCULAR 04-04 AND/OR 15-08
Honorable President and Members of the Board of Education Atlantic County Special Services School District County of Atlantic Mays Landing, New Jersey 08330 Report on Compliance for Each Major Federal and State Program We have audited Atlantic County Special Services School District’s compliance with the types of compliance requirements described in the OMB Circular A-133 Compliance Supplement and the New Jersey State Aid/Grant Compliance Supplement that could have a direct and material effect on each of the District’s major federal and state programs for the year ended June 30, 2015. Atlantic County Special Services School District’s major federal and state programs are identified in the Summary of Auditor’s Results section of the accompanying Schedule of Findings and Questioned Costs. Management’s Responsibility Management is responsible for compliance with the requirements of laws, regulations, contracts, and grants applicable to its federal and state programs. Auditor’s Responsibility Our responsibility is to express an opinion on compliance for each of Atlantic County Special Services School District’s major federal and state programs based on our audit of the types of compliance requirements referred to above. We conducted our audit of compliance in accordance with auditing standards generally accepted in the United States of America; the standards applicable to financial audits contained in Government Auditing Standards, issued by the Comptroller General of the United States; OMB Circular A-133, Audits of States, Local Governments, and Non-Profit Organizations; the New Jersey State Aid/Grant Compliance Supplement; the audit requirements prescribed by the Office of School Finance, Department of Education, State of New Jersey; and New Jersey OMB’s Circular 04-04 and 15-08, Single Audit Policy for Recipients of Federal Grants, State Grants and State Aid. Those standards, OMB Circular A-133 and New Jersey OMB’s Circulars 04-04 and 15-08 require that we plan and perform the audit to obtain reasonable assurance about whether noncompliance with the types of compliance requirements referred to above that could have a direct and material effect on a major federal
157
or state program occurred. An audit includes examining, on a test basis, evidence about Atlantic County Special Services School District’s compliance with those requirements and performing such other procedures as we considered necessary in the circumstances. We believe that our audit provides a reasonable basis for our opinion on compliance for each major federal and state program. However, our audit does not provide a legal determination of Atlantic County Special Services School District’s compliance. Opinion on Each Major Federal and State Program In our opinion, Atlantic County Special Services School District complied, in all material respects, with the types of compliance requirements referred to above that could have a direct and material effect on each of its major federal and state programs for the year ended June 30, 2015. Report on Internal Control Over Compliance Management of Atlantic County Special Services School District is responsible for establishing and maintaining effective internal control over compliance with the types of compliance requirements referred to above. In planning and performing our audit of compliance, we considered Atlantic County Special Services School District’s internal control over compliance with the types of requirements that could have a direct and material effect on each major federal or state program to determine the auditing procedures that are appropriate in the circumstances for the purpose of expressing an opinion on compliance for each major federal or state program and to test and report on internal control over compliance in accordance with OMB Circular A-133 and New Jersey OMB’s Circular(s) 04-04 and/or 15-08, but not for the purpose of expressing an opinion on the effectiveness of internal control over compliance. Accordingly, we do not express an opinion on the effectiveness of Atlantic County Special Services School District’s internal control over compliance. A deficiency in internal control over compliance exists when the design or operation of a control over compliance does not allow management or employees, in the normal course of performing their assigned functions, to prevent, or detect and correct, noncompliance with a type of compliance requirement of a federal or state program on a timely basis. A material weakness in internal control over compliance is a deficiency, or combination of deficiencies, in internal control over compliance, such that there is a reasonable possibility that material noncompliance with a type of compliance requirement of a federal or state program will not be prevented, or detected and corrected, on a timely basis. A significant deficiency in internal control over compliance is a deficiency, or a combination of deficiencies, in internal control over compliance with a type of compliance requirement of a federal or state program that is less severe than a material weakness in internal control over compliance, yet important enough to merit attention by those charged with governance. Our consideration of internal control over compliance was for the limited purpose described in the first paragraph of this section and was not designed to identify all deficiencies in internal control over compliance that might be material weaknesses or significant deficiencies. We did not identify any deficiencies in internal control over compliance that we consider to be material weaknesses. However, material weaknesses may exist that have not been identified.
158

The purpose of this report on internal control over compliance is solely to describe the scope of our testing of internal control over compliance and the results of that testing based on the requirements of OMB Circular A-133 and New Jersey OMB’s Circular(s) 04-04 and/or 15-08. Accordingly, this report is not suitable for any other purpose.
Respectfully Submitted,
HOLMAN FRENIA ALLISON, P.C.
Robert W. Allison Certified Public Accountant Public School Accountant, No. 897
Toms River, New Jersey December 8, 2015
159

This page intentionally left blank.
160

EX
HIB
IT K
-3S
CH
ED
UL
E A
GR
AN
TO
RP
RO
GR
AM
(AC
CO
UN
TS
UN
EA
RN
ED
DU
E T
OF
ED
ER
AL
ST
AT
EO
RB
AL
AN
CE
RE
CE
IVA
BL
E)
RE
VE
NU
EG
RA
NT
OR
CF
DA
PR
OJE
CT
AW
AR
DG
RA
NT
JUN
E 3
0,C
AS
HB
UD
GE
TA
RY
JUN
E 3
0,JU
NE
30,
JUN
E 3
0,N
UM
BE
RN
UM
BE
RA
MO
UN
TP
ER
IOD
2014
RE
CE
IVE
DE
XP
EN
DIT
UR
ES
2015
2015
2015
U.S
. DE
PA
RT
ME
NT
OF
AG
RIC
UL
TU
RE
PA
SS
ED
-T
HR
OU
GH
ST
AT
E D
EP
AR
TM
EN
T O
F E
DU
CA
TIO
N:
Ent
erpr
ise
Fun
d:F
ood
Dis
trib
utio
n P
rogr
am10
.550
N/A
16,0
05$
7/1/
14-6
/30/
15-
$
16,0
05$
(1
6,00
5)$
-
$
-
$
-$
S
choo
l Bre
akfa
st P
rogr
am10
.553
N/A
75,4
82
7/
1/14
-6/3
0/15
-
69
,023
(75,
482)
(6,4
59)
-
-
S
choo
l Bre
akfa
st P
rogr
am10
.553
N/A
62,6
78
7/
1/13
-6/3
0/14
(6,4
75)
6,47
5
-
-
-
-
N
atio
nal S
choo
l Lun
ch P
rogr
am10
.555
N/A
134,
499
7/
1/14
-6/3
0/15
-
12
2,88
8
(134
,499
)
(11,
611)
-
-
N
atio
nal S
choo
l Lun
ch P
rogr
am10
.555
N/A
115,
628
7/
1/13
-6/3
0/14
(11,
278)
11
,278
-
-
-
-
Tot
al U
.S. D
epar
tmen
t of
Agr
icul
ture
(17,
753)
22
5,66
9
(225
,986
)
(18,
070)
-
-
U.S
. DE
PA
RT
ME
NT
OF
ED
UC
AT
ION
PA
SS
ED
-T
HR
OU
GH
ST
AT
E D
EP
AR
TM
EN
T O
F E
DU
CA
TIO
N:
Gen
eral
Fun
d:S
peci
al E
duca
tion
Med
icai
d A
id93
.778
N/A
456,
821
7/
1/14
-6/3
0/15
-
45
6,82
1
(456
,821
)
-
-
-
Tot
al U
.S. D
epar
tmen
t of
Edu
cati
on-
456,
821
(4
56,8
21)
-
-
-
U.S
. DE
PA
RT
ME
NT
OF
LA
BO
R P
AS
SE
D-
TH
RO
UG
H S
TA
TE
DE
PA
RT
ME
NT
OF
ED
UC
AT
ION
:W
IA Y
outh
Act
ivit
ies
17.2
59N
/A16
,568
7/1/
14-6
/30/
15-
16,5
68
(1
6,56
8)
-
-
-
Tot
al U
.S. D
epar
tmen
t of
Edu
cati
on-
16,5
68
(1
6,56
8)
-
-
-
Tot
al F
eder
al A
war
ds(1
7,75
3)$
699,
058
$
(6
99,3
75)
$
(1
8,07
0)$
-
$
-$
PR
OG
RA
M T
ITL
E
AT
LA
NT
IC C
OU
NT
Y S
PE
CIA
L S
ER
VIC
ES
SC
HO
OL
DIS
TR
ICT
SC
HE
DU
LE
OF
EX
PE
ND
ITU
RE
S O
F F
ED
ER
AL
AW
AR
DS
- S
CH
ED
UL
E A
FO
R T
HE
FIS
CA
L Y
EA
R E
ND
ED
JU
NE
30,
201
5
FE
DE
RA
L G
RA
NT
OR
PA
SS
-TH
RO
UG
H G
RA
NT
OR
161

EX
HIB
IT K
-4S
CH
ED
UL
E B
GR
AN
T O
RA
CC
OU
NT
SS
TA
TE
BA
LA
NC
ER
EC
EIV
AB
LE
CU
MU
LA
TIV
EP
RO
JEC
TA
WA
RD
GR
AN
TJU
NE
30,
CA
SH
BU
DG
ET
AR
YJU
NE
30,
BU
DG
ET
AR
YT
OT
AL
NU
MB
ER
AM
OU
NT
PE
RIO
D20
14R
EC
EIV
ED
EX
PE
ND
ITU
RE
S20
15R
EC
EIV
AB
LE
EX
PE
ND
ITU
RE
S
Sta
te D
epar
tmen
t of
Edu
cati
on:
Gen
eral
Fun
d:O
n-B
ehal
f T
PA
F C
ontr
ibut
ion
- P
ensi
on(N
on-B
udge
ted)
15-4
95-0
34-5
095-
006
424,
210
7/1/
14-6
/30/
15-
$
42
4,21
0$
(4
24,2
10)
$
-
$
-$
424,
210
$
On-
Beh
alf
TP
AF
Con
trib
utio
n -
Pos
t-R
etir
emen
t Med
ical
(N
on-B
udge
ted)
15-4
95-0
34-5
095-
001
673,
434
7/1/
14-6
/30/
15-
67
3,43
4
(6
73,4
34)
-
-
673,
434
Rei
mbu
rsed
TP
AF
Soc
ial S
ecur
ity
Con
trib
utio
n (N
on-B
udge
ted)
15-4
95-0
34-5
095-
002
604,
374
7/1/
14-6
/30/
15-
46
6,13
1
(6
04,3
74)
(1
38,2
43)
-
60
4,37
4
R
eim
burs
ed T
PA
F S
ocia
l Sec
urit
yC
ontr
ibut
ion
(Non
-Bud
gete
d)14
-495
-034
-509
5-00
261
8,82
97/
1/13
-6/3
0/14
(138
,744
)
13
8,74
4
-
-
-
-
Tot
al G
ener
al F
und
(138
,744
)
1,
702,
519
(1
,702
,018
)
(1
38,2
43)
-
1,
702,
018
Sta
te D
epar
tmen
t of
Agr
icul
ture
:E
nter
pris
e F
und:
Nat
iona
l Sch
ool L
unch
Pro
gram
15-1
00-0
10-3
350-
023
2,82
87/
1/14
-6/3
0/15
-
2,58
9
(2
,828
)
(2
39)
-
2,
828
N
atio
nal S
choo
l Lun
ch P
rogr
am14
-100
-010
-335
0-02
32,
962
7/1/
13-6
/30/
14(2
46)
246
-
-
-
-
Tot
al E
nter
pris
e F
und
(246
)
2,
835
(2,8
28)
(239
)
-
2,82
8
Tot
al S
tate
Fin
anci
al A
ssis
tanc
e(1
38,9
90)
$ 1,
705,
354
$
(1
,704
,846
)(1
38,4
82)
$
-
$
1,70
4,84
6$
Les
s: A
ssis
tanc
e N
ot S
ubje
ct to
New
Jer
sey
OM
B C
ircu
lar(
s) 0
4-04
and
/or
15-0
8:O
n-B
ehal
f T
PA
F C
ontr
ibut
ion
- P
ensi
on (
Non
-Bud
gete
d)42
4,21
0O
n-B
ehal
f T
PA
F C
ontr
ibut
ion
- P
ost-
Ret
irem
ent M
edic
al (
Non
-Bud
gete
d)67
3,43
4
Tot
al S
tate
Fin
anci
al A
ssis
tanc
e S
ubje
ct to
New
Jer
sey
OM
B C
ircu
lar(
s) 0
4-04
and
/or
15-0
8(6
07,2
02)
$
AT
LA
NT
IC C
OU
NT
Y S
PE
CIA
L S
ER
VIC
ES
SC
HO
OL
DIS
TR
ICT
SC
HE
DU
LE
OF
EX
PE
ND
ITU
RE
S O
F S
TA
TE
FIN
AN
CIA
L A
SS
IST
AN
CE
- S
CH
ED
UL
E B
FO
R T
HE
FIS
CA
L Y
EA
R E
ND
ED
JU
NE
30,
201
5
ST
AT
E G
RA
NT
OR
/PR
OG
RA
M T
ITL
E
ME
MO
162

EXHIBIT K-5
ATLANTIC COUNTY SPECIAL SERVICES SCHOOL DISTRICT
NOTES TO SCHEDULES OF EXPENDITURES OF FEDERAL AWARDS AND STATE FINANCIAL ASSISTANCE
JUNE 30, 2015 Note 1. General The accompanying schedules of expenditures of federal awards and state financial assistance include federal and state award activity of the Board of Education of the Atlantic County Special Services School District. The Board of Education is defined in Note 1 to the Board’s basic financial statements. All federal and state awards received directly from federal and state agencies, as well as federal award and state financial assistance passed through other government agencies is included on the schedules of expenditures of federal awards and state financial assistance. Note 2. Basis of Accounting The accompanying schedules of expenditures of federal awards and state financial assistance is presented on the budgetary basis of accounting with the exception of programs recorded in the food service fund, which are presented using the accrual basis of accounting. These bases of accounting are described in Note 1 to the Board’s basic financial statements. Note 3. Relationship to Basic Financial Statements The basic financial statements present the general fund and special revenue fund on a GAAP basis. Budgetary comparison statements or schedules (RSI) are presented for the general fund and special revenue fund to demonstrate finance related legal compliance in which certain revenue is permitted by law or grant agreement to be recognized in the audit year, whereas for GAAP reporting, revenue is not recognized until the subsequent year or when expenditures have been made. The general fund is presented in the accompanying schedule on the modified accrual basis with the exception of the revenue recognition of the last state aid payment in the current budget year, which is mandated pursuant to N.J.S.A.18A:22-44.2. For GAAP purposes, that payment is not recognized until the subsequent budget year due to the state deferral and recording of the last state aid payment in the subsequent year. The special revenue fund is presented in the accompanying schedule on the grant accounting budgetary basis, which recognizes encumbrances as expenditures and also recognizes the related revenues, whereas the GAAP basis does not. The special revenue fund also recognizes the last state aid payment in the current budget year, consistent with N.J.S.A.18A:22-4.2. No adjustment is needed to reconcile from the budgetary basis to the GAAP basis. See Exhibit C-3 for a reconciliation of the budgetary basis to the modified accrual basis of accounting for the general and special revenue funds. Awards and financial assistance revenues are reported in the Board’s basic financial statements on a GAAP basis as presented as follows:
163

EXHIBIT K-5
ATLANTIC COUNTY SPECIAL SERVICES SCHOOL DISTRICT
NOTES TO SCHEDULES OF EXPENDITURES OF FEDERAL AWARDS AND STATE FINANCIAL ASSISTANCE
JUNE 30, 2015 Note 3. Relationship to Basic Financial Statements (continued)
Federal State Total
General Fund 473,389$ 1,702,018$ 2,175,407$ Capital Projects Fund - 115,022 115,022 Food Service Fund 225,986 2,828 228,814
Total 699,375$ 1,819,868$ 2,519,243$
Note 4. Relationship to Federal and State Financial Reports Amounts reported in the accompanying schedule agree with the amounts reported in the related federal and state financial reports. Note 5. Other Revenues and expenditures reported under the Food Distribution Program represents current year value received and current year distributions respectively. The amount reported as TPAF Pension Contributions represents the amount paid by the state on behalf of the District for the year ended June 30, 2015. TPAF Social Security Contributions represents the amount reimbursed by the state for the employer’s share of social security contributions for TPAF members for the year ended June 30, 2015. Note 6. State Loans Outstanding The Atlantic County Special Services School District had no loan balances outstanding at June 30, 2015.
164

EXHIBIT K-6
Financial Statements
Type of auditors' report issued: Unmodified
Internal control over financial reporting:1. Material weakness(es) identified? None Noted
2. Significant deficiencies identified that are not considered to be material weaknesses? None Noted
Noncompliance material to basic financial statements noted? None Noted
Federal Awards
Internal control over major programs:
1. Material weakness(es) identified? None Noted
2. Significant deficiencies identified that are not considered to be material weaknesses? None Noted
Type of auditor's report issued on compliance for major programs: Unmodified
Any audit findings disclosed that are required to be reported in accordance with section .510(a) of OMB Circular A-133? None Noted
Identification of major programs:
CFDA Numbers(s)
93.778
Dollar threshhold to distinguish between Type A programs: $300,000
Auditee qualified as low-risk? No
Special Education Medicaid Aid
ATLANTIC COUNTY SPECIAL SERVICES SCHOOL DISTRICTSCHEDULE OF FINDINGS & QUESTIONED COSTS
FOR THE FISCAL YEAR ENDED JUNE 30, 2015
Section I - Summary of Auditor's Results
Name of Federal Program or Cluster
165
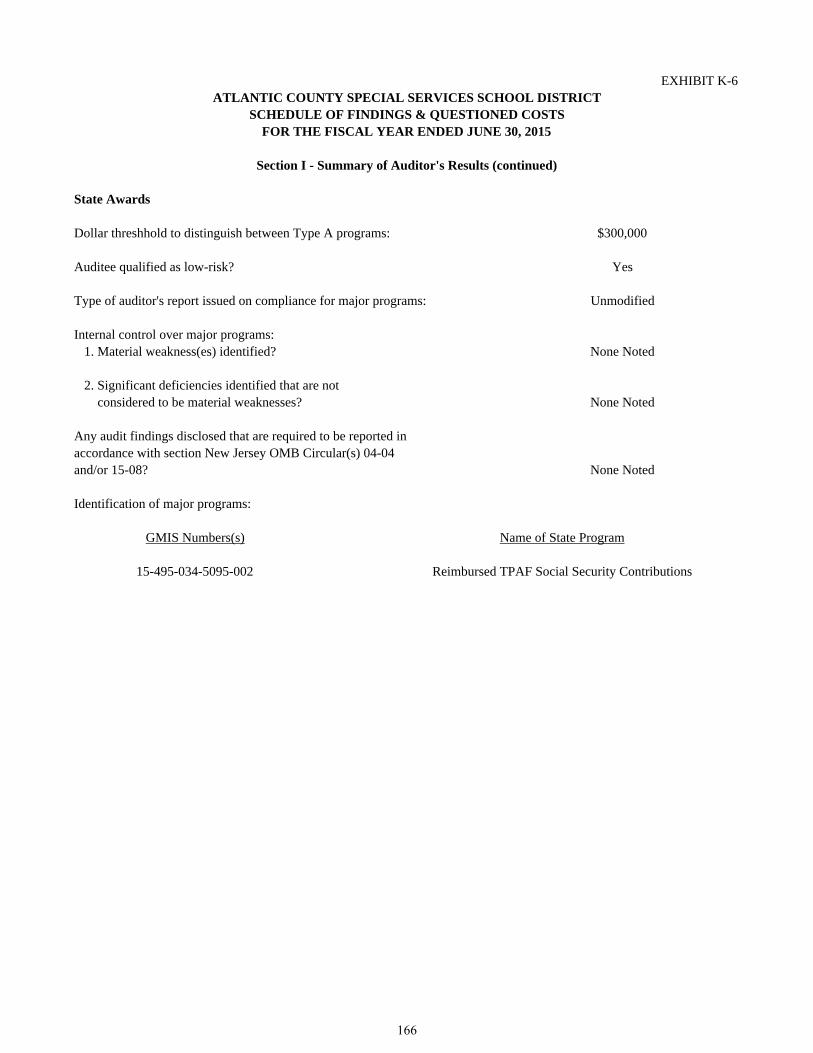
EXHIBIT K-6
State Awards
Dollar threshhold to distinguish between Type A programs: $300,000
Auditee qualified as low-risk? Yes
Type of auditor's report issued on compliance for major programs: Unmodified
Internal control over major programs:1. Material weakness(es) identified? None Noted
2. Significant deficiencies identified that are not considered to be material weaknesses? None Noted
Any audit findings disclosed that are required to be reported in accordance with section New Jersey OMB Circular(s) 04-04 and/or 15-08? None Noted
Identification of major programs:
GMIS Numbers(s)
15-495-034-5095-002
Name of State Program
Reimbursed TPAF Social Security Contributions
ATLANTIC COUNTY SPECIAL SERVICES SCHOOL DISTRICTSCHEDULE OF FINDINGS & QUESTIONED COSTS
FOR THE FISCAL YEAR ENDED JUNE 30, 2015
Section I - Summary of Auditor's Results (continued)
166

EXHIBIT K-6
No Current Year Findings.
ATLANTIC COUNTY SPECIAL SERVICES SCHOOL DISTRICTSCHEDULE OF FINDINGS & QUESTIONED COSTS
FOR THE FISCAL YEAR ENDED JUNE 30, 2015
Section II - Financial Statement Findings
This section identifies the significant deficiencies, material weaknesses, fraud, illegal acts, violations of provisions of contracts and grant agreements and abuse related to the financial statements for which Government Auditing Standards and audit requirements as prescribed by the Office of School Finance, Department of Education, State of New Jersey.
Section III - Federal Awards & State Financial Assistance Findings & Questioned Costs
This section identifies audit findings required to be reported by section .510(a) of Circular A-133 and New Jersey OMB's Circular(s) 04-04 and/or 15-08, as applicable.
No Current Year Findings.
167
EXHIBIT K-7
This section identifies the status of prior-year findings related to the basic financial statements and federal awards and state financial assistance that are required to be reported in accordance with Chapter 6.12 of Government Auditing Standards , U.S. OMB Circular A-133, and New Jersey OMB's Circular(s) 04-04 and/or 15-08, as applicable.
No Prior Year Findings.
ATLANTIC COUNTY SPECIAL SERVICES SCHOOL DISTRICTSUMMARY SCHEDULE OF PRIOR AUDIT FINDINGS & QUESTIONED
FOR THE FISCAL YEAR ENDED JUNE 30, 2015COSTS AS PREPARED BY MANAGEMENT
168