assessing measurement error in key informant reports: a ... · (lazarsfeld and menzel 1969; seidler...
TRANSCRIPT

Assessing Measurement Error in Key Informant Reports: A Methodological Note onOrganizational Analysis in MarketingAuthor(s): Lynn W. PhillipsSource: Journal of Marketing Research, Vol. 18, No. 4 (Nov., 1981), pp. 395-415Published by: American Marketing AssociationStable URL: http://www.jstor.org/stable/3151333Accessed: 03/03/2010 15:00
Your use of the JSTOR archive indicates your acceptance of JSTOR's Terms and Conditions of Use, available athttp://www.jstor.org/page/info/about/policies/terms.jsp. JSTOR's Terms and Conditions of Use provides, in part, that unlessyou have obtained prior permission, you may not download an entire issue of a journal or multiple copies of articles, and youmay use content in the JSTOR archive only for your personal, non-commercial use.
Please contact the publisher regarding any further use of this work. Publisher contact information may be obtained athttp://www.jstor.org/action/showPublisher?publisherCode=ama.
Each copy of any part of a JSTOR transmission must contain the same copyright notice that appears on the screen or printedpage of such transmission.
JSTOR is a not-for-profit service that helps scholars, researchers, and students discover, use, and build upon a wide range ofcontent in a trusted digital archive. We use information technology and tools to increase productivity and facilitate new formsof scholarship. For more information about JSTOR, please contact [email protected].
American Marketing Association is collaborating with JSTOR to digitize, preserve and extend access toJournal of Marketing Research.
http://www.jstor.org

LYNN W. PHILLIPS*
The author examines the reliability and validity of measures of organizational characteristics used in previous marketing studies in the areas of strategic planning and distribution channels. Key informants in 506 wholesale-distribution
companies provided reports on (1) characteristics of the firm's product portfolio and (2) characteristics of the firm's power-dependence relations with its major suppliers and customers. In contrast to previous investigations, which sampled only a single informant per unit of analysis, data were collected from multiple informants in each firm. Results showed that informant reports often achieved
convergent and discriminant validity when variance due to methods factors was explicitly modeled. However, partitioning of variance according to trait, method, and random error components showed that informant reports often exhibited less than 50% variance attributable to the trait factor under
investigation. Implications of the findings are discussed for those marketing studies which focus on organizations or organizational subunits as the unit
of analysis.
Assessing Measurement Error in Key Informant Reports: A Methodological Note
on Organizational Analysis in Marketing
Literature pertaining to marketing research meth- odology has traditionally focused on the procedures relevant to the design and conduct of investigations involving individuals as the unit of analysis. Advances in research methods have been mainly in the develop- ment of techniques for collecting and analyzing in-
*Lynn W. Phillips is Assistant Professor of Marketing, Graduate School of Business, Stanford University. He is currently Visiting Assistant Professor, Harvard Business School, Harvard University.
This research was supported by a grant from the Distribution Research and Education Foundation (DREF), Washington, D.C. DREF is the long-range research arm of the National Association of Wholesale-Distributors, whose membership participated in the study. Special thanks to Mr. Dirk Van Dongen, Executive Director and Treasurer of DREF, for providing access to companies and informants, and Mr. Louis H. T. Demhlow, President of GLT&T Inc., for acting as DREF liason and project supervisor. The contributions to the research by Richard P. Bagozzi, MIT, and Louis W. Ster, Northwestern University, are gratefully acknowl- edged. Conversations with Claes Fornell, University of Michigan, and Bobby Calder and Brian Sternthal, Northwestern University, also contributed to the development of ideas presented in this article.
formation on individuals' demographic characteristics, opinions, preferences, and purchase behavior. In re- cent years, however, marketing scholars and practi- tioners have shown an interest in the study of more complex units of analysis than the individual. Research paradigms have emerged which focus on the "buying center" (Bonoma, Bagozzi, and Zaltman 1978; Web- ster and Wind 1972), the "strategic business unit" (Buzzell, Gale, and Sultan 1975; Schoeffler, Buzzell, and Heany 1974), and the "distribution channel" (Bucklin 1966; Ster and El-Ansary 1977; Stern and Reve 1980) as the relevant unit of analysis. These paradigms are distinguished from previous frameworks in that they attempt to explain and predict the behavior of organizations or organizational subunits rather than individuals.
Interest in the study of organizational phenomena in marketing has introduced several novel methodo- logical problems. Research paradigms which focus on organizations often hypothesize construct relation- ships that cannot be tested by asking individuals to report strictly personal information such as their
395
Journal of Marketing Research Vol. XVIII (November 1981), 395-415

JOURNAL OF MARKETING RESEARCH, NOVEMBER 1981
feelings, opinions, or behavior (Seidler 1974). The reason is that organizations have characteristics dis- tinct from the characteristics of individuals (Lazarsfeld and Menzel 1969). For example, they have a particular type of organizational structure (Blau and Schoenherr 1971), pursue a particular type of marketing strategy (Buzzell, Gale, and Sultan 1975), maintain a portfolio of products with unique characteristics (Day 1977), and establish power-dependence relationships with the supplier and distributors in their environments (Pfeffer and Salancik 1979; Stern and El-Ansary 1977). Mea- surement of these and other organizational charac- teristics requires research methods different from those used to measure the characteristics of individuals (Lazarsfeld and Menzel 1969; Seidler 1974).
In marketing contexts, the measurement of organi- zational characteristics typically has entailed the use of a key informant method, a technique of collecting information about a social setting by interviewing a selected number of participants. The informants are chosen not on a random basis but because they have special qualifications such as particular status, spe- cialized knowledge, or even accessibility to the re- searcher. Although this data-gathering technique traditionally has been associated with ethnographic research such as participant observation studies (Lo- fland 1971), it may also be employed in survey contexts to obtain quantifiable responses rather than qualitative information. In this situation, survey respondents assuming the role of a key informant provide informa- tion at the aggregate or organizational unit of analysis by reporting on group or organizational properties rather than personal attitudes and behaviors (Seidler 1974).
Applications of key informant methods in marketing generally have been in conjunction with survey data- collection procedures, thus emphasizing the quantita- tive rather than the qualitative use of informants. Research employing this approach has spanned a variety of substantive areas within the field. In indus- trial marketing contexts, purchasing agent informants have provided information on the structure of the industrial buying center, phases of the industrial adop- tion process, and the impact of environmental in- fluences on organizational purchasing (see Silk and Kalwani 1980 for a review). Strategic planning studies have solicited information from division manager in- formants on the amount of guidance in marketing strategy received from headquarters (e.g., Brandt and Hulbert 1977), the quality of collaboration between headquarters and divisional subunits in planning and executing marketing programs (e.g., Brandt and Hul- bert 1976), the type of marketing objectives pursued by divisional subunits (e.g., Brandt and Hulbert 1975; Buzzell, Gale, and Sultan 1975), the overall quality of products sold by a business (e.g., Buzzell, Gale, and Sultan 1975; Farris and Buzzell 1979; Schoeffler,
Buzzell, and Heany 1974), and the extent of adoption and implementation of the marketing concept in the firm (see Lawton and Parasuraman 1980 for a review). In the study of distribution channels, executive infor- mants have reported on such diverse issues as the sources, types, and consequences of interchannel conflict (e.g., Lusch 1976; Rosenberg and Stern 1971); the amount of power exercised over company opera- tions by major suppliers and customers (e.g., El-An- sary and Stern 1972; Etgar 1974, 1976b, 1977, 1978; Hunt and Nevin 1974; Lusch 1976); aspects of the channel environment such as volatility in demand and the extent of interchannel competition (Etgar 1977); and various indicators of channel efficiency such as the quality of intrasystem communications and the degree of intrasystem duplication of activities (Etgar 1976a).
Despite the growing use of key informant methods in marketing, researchers using the approach have offered little evidence to document the reliability and validity of measurements obtained in this manner. In part, this neglect is attributable to the fact that inves- tigators have typically sampled only a single informant per unit of analysis and relied on survey responses by this individual as indicators of the organizational properties of interest. Collection of data from only a single key informant per unit of analysis precludes a rigorous assessment of the convergent and discrimi- nant validity of informant reports (Campbell and Fiske 1959; Phillips 1980). Further, it prohibits a determina- tion of the extent to which variation in measurements is due to (1) the concept of interest, (2) systematic sources of error (e.g., methods factors), or (3) random error (Bagozzi 1980; Joreskog 1974). Thus, the degree to which informant reports are valid indicators of the organizational characteristics they are intended to measure is an unresolved issue.'
Although marketing researchers using the key infor- mant method have neglected measurement error issues, there are compelling reasons for concern about the potential sources of error in informant reports. Researchers using the key informant method have often asked informants to perform complex tasks of social judgment on potentially sensitive or controver- sial issues. For example, in the PIMS studies, execu-
'Exceptions to the single-informant approach include the studies of El-Ansary and Stern (1972) and Rosenberg and Stern (1971). These investigators, however, failed to conduct any tests for the reliability and validity of measures. A limited number of researchers did attempt to control informant reliability by encouraging the key informant to consult records or other informants in answering particular questions (e.g., PIMS studies). These controls were informal and no efforts were made to estimate measurement error explicitly. For a comprehensive critique of these and other key informant studies in marketing and organizational sociology, see Phillips (1980) and Phillips and Bagozzi (1981).
396

ORGANIZATIONAL ANALYSIS IN MARKETING
tive informants were asked to estimate the percentage of products in the business' portfolio which were (1) superior, (2) equivalent, and (3) inferior to those of leading competitors (see Buzzell, Gale, and Sultan 1975; Schoeffler, Buzzell, and Heany 1974). Similarly, executive informants in distribution channel studies have been asked to estimate the amount of power or control suppliers have over distributors' operations in various marketing decision areas, such as prices charged and territories served (e.g., El-Ansary and Stern 1972; Etgar 1976b, 1978; Hunt and Nevin 1974). Asking informants to make social judgments about these types of issues may introduce numerous sources of error. If informant reports are viewed as a selective commentary on organizational policies or leadership, overreporting or underreporting of certain phenomena may occur as a function of the informant's position, job satisfaction, or other informant characteristics (McClintock, Brannen, and Maynard-Moody 1979; Patchen 1963; Seidler 1974). Different informants may use different information or events to form social judgments or give different weights to different in- formation. Factors related to the difficulty of observa- tion also may account for variation in informant reports, for example, the size of the organization, the breadth of information sources available to the informant, and the length of time the informant has been in the organization (Houston and Sudman 1975; Seidler 1974). To the extent that these sources of distortion influence the informant's social judgments about organizational properties, there will be a low degree of correspondence between informant reports and the organizational concepts they intend to repre- sent.
The purpose of this article is to assess the reliability and validity of measurements of organizational con- cepts obtained by key informant procedures. To address this issue, reports from multiple informants in 506 wholesale distribution companies are tested for their reliability and validity by a structural equation method (Bagozzi 1980; Joreskog 1974). For compa- rability, the research instruments to which informants responded in the study are similar to those used in previous single-informant studies in marketing. Spe- cifically, informants responded to (1) instruments similar to those used by Etgar (1974, 1976b, 1978) and other investigators (cf. El-Ansary and Stern 1972; Hunt and Nevin 1974; Lusch 1976) to measure power- dependence relationships in marketing channels, and (2) instruments used by the PIMS researchers (Buzzell, Gale, and Sultan 1975; Farris and Buzzell 1979; Schoeffler, Buzzell, and Heany 1974) to measure characteristics of a firm's product portfolio. First, the sampling and data collection procedures used in the study are described. Then the specific measures employed are explained and the procedures used to test for reliability and validity described. Finally, the
results for reliability and validity are reported and discussed.
SAMPLING AND DATA COLLECTION PROCEDURES
Data were collected from executive informants in 506 wholesale distribution companies. Access to companies and informants was provided by the Dis- tribution Research and Education Foundation (DREF), the research arm of the National Association of Wholesale Distributors (NAWD).
Organizational Sampling Procedures The sampling frame for the study was the 3372
wholesale distribution companies which held a mem- bership in the NAWD. All companies within the sam- pling frame were contacted by a letter from the director of NAWD to the CEO of each company. The letter described the purpose of the study and asked for the company's participation. CEOs were told that the purpose of the study was to identify those factors which make some wholesale distribution companies more successful than others. Anonymity of responses was assured for all persons and companies. As a prerequisite to participation, CEOs were asked to complete a participation form which provided the information necessary to complete the mailing of survey materials. Informant Sampling Procedures
On the participation form, CEOs were asked to supply the names and titles of other personnel in their company who would act as respondents. To provide a basis for the selection of knowledgeable informants, the topical areas of company operations covered in the survey were described to the CEO. CEOs were asked to select only those informants who were knowledgeable about the areas covered in the survey. CEOs were encouraged to designate more than two of their personnel to act as informants, provided that these individuals were knowledgeable. Survey Vehicle and Instruments
Completed participation forms were received from 682 firms. Surveys were then mailed to 2504 informants in the 682 firms. Surveys were mailed to the CEOs, who distributed them to the other informants and requested their completion. A description of the study was provided to familiarize informants with the study. Informants were instructed not to discuss specific questions until all surveys were completed and mailed. Each survey came attached with a separate return envelope.
Except for questions asked of the CEO about firm demographics and financial performance, all surveys were identical. In general, the questions asked of all informants were designed to measure concepts pertain- ing to characteristics of the firm's product portfolio, power-dependence relationships between the firm and its major suppliers and customers, and other factors expected to differentiate between high- and low-per- forming wholesale distributors (see Phillips 1980). Response Rates to Survey Instruments
For a company to be included in the analysis, responses had to be received from the CEO and at
397

JOURNAL OF MARKETING RESEARCH, NOVEMBER 1981
least one other informant. Companies which failed to meet these criteria were sent up to two reminders. Usable responses were received from 506 companies. Of these, 153 were two-informant companies (i.e., two informants including the CEO responded), 205 were three-informant companies, 138 were four-informant companies, and 10 were companies with more than four responding informants. The 1531 surveys received represented 61% of all surveys mailed. Intracompany response rate among participating companies was 78%.
The 506 organizations represented 15% of all firms originally asked to participate. To test for differences between participants and nonparticipants, data were collected from NAWD records on the firms originally contacted. The data consisted of reports of dollar dues paid to NAWD in 1979, which is a direct function of company sales volume. These data indicated that participants paid significantly higher dues than nonpar- ticipants. This self-selection bias is relevant to the extent that it could provide a rival explanation for the acceptance or rejection of convergent or discriminant validity. For example, participating companies which paid higher dues and obtained higher sales volumes may be characterized by more educated informants than nonparticipating companies, which in turn might contribute to the acceptance of convergent validity. Though this rival explanation does not explain the results presented hereafter, which indicate low conver- gence for certain indicators, the impact of third vari- ables associated with company participation/nonpar- ticipation cannot be ruled out entirely as a source of variation in informant reports.
Characteristics of the Key Informants Given the objectives of the research, it is necessary
to demonstrate that the key informants in the study constitute an appropriate sample on which to test the reliability and validity of informant reports. Several characteristics of the informants bear on this issue. First, the informants differed in title and positional status. This diversity is consistent with the Campbell- Fiske (1959) criteria that when different observers are used as methods, they should differ as much as possible in terms of their roles to help rule out the possibility that interinformant agreement might be due to a shared methods factor such as a positional bias, etc. Table 1 shows the frequency of informants by job title, which indicates that a modicum of diversity in data sources was achieved.
To assess further the qualifications of the informants, measures were taken on (1) number of years the informant had worked in the company and (2) the extent to which the informant participated in company decision making with respect to issues covered in the survey. Length of time in the organization was viewed as important because it is a potential factor relating to the difficulty of observation (Seidler 1974). Similarly, informant participation in decision making on issues related to survey topics reduces the possibility that failure to observe convergence is due to a knowledge deficiency artifact. Though an informant who does not participate in decisions still may have a good avenue to knowledge about the area in question, participation in decision areas related to those investigated in the
Table 1 DIVERSITY OF INFORMANTS, BY JOB TITLE
A bsolute Job title of informants frequency
Executive/President, Chief Operating Officer (includes 20 company chairmen) 469
Executive Vice President, Senior Vice President 134 Vice President, Marketing 149 Vice President (General V.P. or V.P. other
functional area) 178 Executive Secretary (Assistant) to the President 69 Sales Manager 229 Manager (other functional area, e.g., physical
distribution, advertising) 170 Salesperson 65 Purchasing Agent 46 Accounting Personnel 22
1531
survey appears to be a sufficient condition for estab- lishing the qualification of an informant.
Number of years the informant had worked for the company was operationalized by a self-report measure. Participation in decision making was assessed by asking informants how frequently they participated in deci- sions in 10 areas. Frequency of participation was assessed on a 7-point scale with scale stems of 1 = never, 2 = very rarely, 3 = rarely, 4 = sometimes, 5 = often, 6 = very often, 7 = always. A confirmatory factor analysis (Joreskog 1971) indicated two factors underlying the measurements. One factor referred to the informants' degree of participation in strategic marketing decisions and was indicated by items mea- suring participation in decisions on selecting the prod- ucts to be carried by the company, deciding how and from whom these products should be secured, making company pricing decisions, and negotiating with major suppliers. A second factor referred to the informants' degree of participation in strategic corporate policy decisions and was indicated by items measuring parti- cipation in personnel planning, acquiring company financing, and establishing company sales/promotional policies. Composite reliability for the set of measures for these two dimensions, obtained by the model developed by Werts, Linn, and Joreskog (1974), was .910 and .913, respectively.
Analysis of these informant characteristics indicated that the average non-CEO informant had worked in the company for 13.5 years, whereas the average CEO had been with the company 20.8 years. These data suggest that any failure to observe convergence in informant reports is unlikely to be due to the sample being composed of informants who were relatively new members to the firm and therefore had only limited knowledge of organizational issues. The data also indicate that the informants were participants in company decisions related to topical areas covered in the survey because average participation in decision making scores for all informants were equal to or above the scores that would be obtained if an informant checked "sometimes participate" for each item on each
398

ORGANIZATIONAL ANALYSIS IN MARKETING
scale. Thus any failure to observe convergence in informant reports is unlikely to be attributable to the fact that informants included in the study had no access to information about issues investigated in the survey.2
MEASURES
The tests for reliability and validity are illustrated on two sets of measurements included in the survey instrument. These measurements were adapted from previous single-informant investigations and were in- tended to measure (1) characteristics of the firm's power-dependence relations with its major suppliers and customers and (2) characteristics of the firm's product portfolio.3
Power-Dependence Measures
The power-dependence relations between the firm and its major suppliers and customers were measured in terms of (1) substitutability of major suppliers and customers, (2) supplier control over distributor opera- tions, (3) customer control over distributor operations, and (4) countervailing power of the distributor in relation to major suppliers. Measures for these con- cepts are described in Appendix A.
Substitutability of major suppliers and customers to the distributor was operationalized by a scale developed by Etgar (1974, 1976b). The supplier sub- stitutability measure asked informants to assess the degree of difficulty that the distributor would have in replacing one of its three leading suppliers (defmed in terms of total dollar purchases) should the company lose their business. The customer substitutability mea- sure asked informants to assess the degree of difficulty that the distributor would have in replacing one of its three leading customers (defined in terms of total dollar sales) should the company lose its business. The supplier substitutability measure is designated as SBSUP and the customer substitutability measure is designated SBCUS in Appendix A.4
Supplier control over distributor operations was measured with both global and specific operationaliza- tions of the concept (Patchen 1963). Global measures of control or power ask informants to make a global judgment about the amount of influence exercised by one social actor over another, without regard to influence exercised in specific areas (Patchen 1963).
2For a comprehensive analysis of these and other informant characteristics, as well as means and standard deviations of infor- mant characteristics by type of company and informant, see Phillips (1980).
3See Phillips (1980) for a report of the tests conducted for reliability and validity on all measurements included in the survey, as well as means and standard deviations of all variables.
4In pre-tests, informants had no difficulty in identifying the firm's top three suppliers or customers as defined in the survey. Average percentage concentration of purchases among top three suppliers was 44.1%, S.D. = 12.6, whereas average percentage concentration of sales among leading customers was 14.1%, S.D. = 3.1.
The global measure of supplier control was adopted from Etgar (1974, 1976b) and is denoted in Appendix A as SCNTG. This measure asked informants to estimate in general how much control the company's three leading suppliers have over distributor opera- tions. The specific measures assessed leading suppli- er's control over distributor operations in specific areas such as ordering policies, salesforce hiring and train- ing, and territories served. These specific control measures are denoted SC1 through SC5 in Appendix A. They are similar to those used by Etgar (1978) in his study of supplier control processes (cf. also El-Ansary and Stern 1972; Hunt and Nevin 1974).
Customer control over distributor operations also was operationalized with global and specific measures. The global measure is similar in structure and content to the global measure of supplier control. It is desig- nated CCNTG in Appendix A. The specific control measure tapped major customers' control over prices charged to them by the distributor. This item was developed specifically for the study and is designated CCNTP in Appendix A.
Countervailing power of the distributor in relation to its major suppliers was operationalized by two single-item indicators. One indicator was the counter- vailing power measure used by Etgar (1974, 1976b), which asked informants to report the percentage of customers that the company could shift to other suppliers should it lose any of its three leading suppliers as a source of resource acquisition. This item is designated CVPR in Appendix A. A second single-item indicator, developed specifically for the study, asked key informants to report on a 7-point Likert-type scale the amount of bargaining power exercised by the company in negotiating purchase agreements with its leading suppliers. This item is denoted BPWS in Appendix A.
Product Portfolio Measures
Two characteristics of the firm's product portfolio were measured: (1) quality of products and (2) prices of products relative to competition. Quality of products was assessed by asking informants to respond to a measure used in the PIMS studies. Informants were asked to judge the percentage of total company sales that originated from products and services that were (1) clearly superior, (2) approximately equivalent, and (3) clearly inferior to those of leading competitors. These three categories are denoted PRSP, PREQ, and PRIN, respectively, in Appendix A. Prices of products relative to competition was measured by a 5-point scale similar to that used in the PIMS studies. This item is denoted PRICES in Appendix A.
METHOD OF ANAL YSIS
Convergent validity refers to the degree to which multiple attempts to measure the same concept by different methods are in agreement (Campbell and
399
JOURNAL OF MARKETING RESEARCH, NOVEMBER 1981
Fiske 1959). In organizational research, the different methods may be different informants within the same organization (e.g., Seidler 1974), informants in dif- ferent organizations (e.g., Provan, Beyer, and Kryt- bosch 1980), informants and organizational documents (e.g., Pennings 1973), or other unobtrusive methods (e.g., Webb and Weick 1980). The more dissimilar the methods, the more rigorous the test (Campbell and Fiske 1959).
Convergent validity was assessed in this study by constructing a multitrait-multimethod (MM) matrix of correlations where n traits are measured by m methods (i.e., informants). For convergent validity to be achieved, it is necessary that (1) correlations between informants reporting on the same trait (termed "validi- ty correlations") be positive and statistically signifi- cant (Campbell and Fiske 1959) and (2) all variation and covariation in the MM matrix be due to the traits alone except for random error (Joreskog 1971, 1974). The latter criterion tests for the presence of methods factors as sources of variation in the data and examines whether the data conform to the numerous other validity desiderata suggested by Campbell and Fiske (1959).5 If convergent validity is achieved, it is appro- priate to test for discriminant validity. This step entails examining whether a particular concept differs from other concepts when measured by different methods.
All the hypotheses associated with convergent and discriminant validity can be tested by Joreskog's analysis of covariance structures method (Joreskog 1971, 1974). Specifically, examination of convergent and discriminant validity entails testing three sets of hypotheses or models: (1) the model testing for con- vergent validity, (2) the model testing for convergent validity with methods factor controls, and (3) the model testing for discriminant validity (Joreskog 1971, 1974).
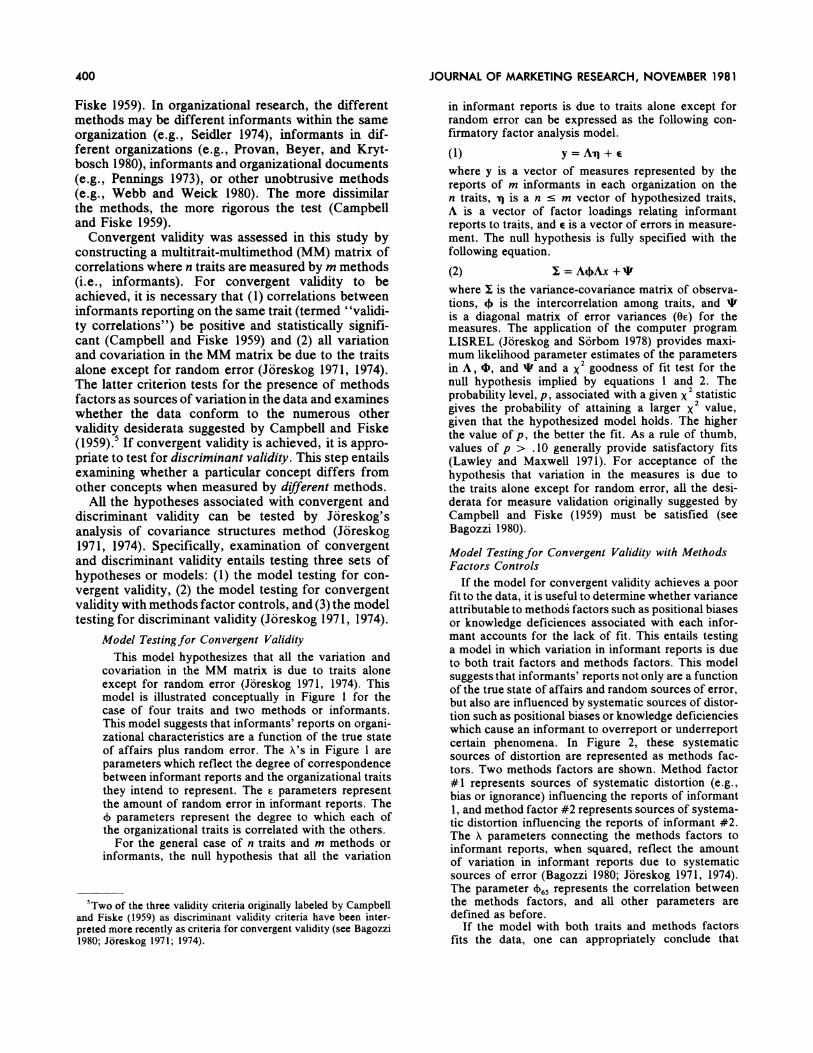
Model Testing for Convergent Validity This model hypothesizes that all the variation and
covariation in the MM matrix is due to traits alone except for random error (Joreskog 1971, 1974). This model is illustrated conceptually in Figure 1 for the case of four traits and two methods or informants. This model suggests that informants' reports on organi- zational characteristics are a function of the true state of affairs plus random error. The X's in Figure 1 are parameters which reflect the degree of correspondence between informant reports and the organizational traits they intend to represent. The e parameters represent the amount of random error in informant reports. The () parameters represent the degree to which each of the organizational traits is correlated with the others.
For the general case of n traits and m methods or informants, the null hypothesis that all the variation
5Two of the three validity criteria originally labeled by Campbell and Fiske (1959) as discriminant validity criteria have been inter- preted more recently as criteria for convergent validity (see Bagozzi 1980; Joreskog 1971; 1974).
in informant reports is due to traits alone except for random error can be expressed as the following con- firmatory factor analysis model.
(1) y = AI + E
where y is a vector of measures represented by the reports of m informants in each organization on the n traits, i is a n - m vector of hypothesized traits, A is a vector of factor loadings relating informant reports to traits, and e is a vector of errors in measure- ment. The null hypothesis is fully specified with the following equation.
(2) ? = bA4Ax +
where ? is the variance-covariance matrix of observa- tions, <4 is the intercorrelation among traits, and WI is a diagonal matrix of error variances (Oe) for the measures. The application of the computer program LISREL (Joreskog and Sorbom 1978) provides maxi- mum likelihood parameter estimates of the parameters in A, 4, and I and a x2 goodness of fit test for the null hypothesis implied by equations 1 and 2. The probability level, p, associated with a given x2 statistic gives the probability of attaining a larger x2 value, given that the hypothesized model holds. The higher the value of p, the better the fit. As a rule of thumb, values of p > .10 generally provide satisfactory fits (Lawley and Maxwell 1971). For acceptance of the hypothesis that variation in the measures is due to the traits alone except for random error, all the desi- derata for measure validation originally suggested by Campbell and Fiske (1959) must be satisfied (see Bagozzi 1980).
Model Testingfor Convergent Validity with Methods Factors Controls
If the model for convergent validity achieves a poor fit to the data, it is useful to determine whether variance attributable to methods factors such as positional biases or knowledge deficiences associated with each infor- mant accounts for the lack of fit. This entails testing a model in which variation in informant reports is due to both trait factors and methods factors. This model suggests that informants' reports not only are a function of the true state of affairs and random sources of error, but also are influenced by systematic sources of distor- tion such as positional biases or knowledge deficiencies which cause an informant to overreport or underreport certain phenomena. In Figure 2, these systematic sources of distortion are represented as methods fac- tors. Two methods factors are shown. Method factor #1 represents sources of systematic distortion (e.g., bias or ignorance) influencing the reports of informant 1, and method factor #2 represents sources of systema- tic distortion influencing the reports of informant #2. The X parameters connecting the methods factors to informant reports, when squared, reflect the amount of variation in informant reports due to systematic sources of error (Bagozzi 1980; Joreskog 1971, 1974). The parameter b,65 represents the correlation between the methods factors, and all other parameters are defined as before.
If the model with both traits and methods factors fits the data, one can appropriately conclude that
400

ORGANIZATIONAL ANALYSIS IN MARKETING
Figure 1 MODEL TESTING FOR CONVERGENT VALIDITY IN INFORMANT REPORTS
e4 e1 ?2 e7 ?8
convergent validity was achieved when methods factors were taken into account. The validity of informant reports is then assessed by examining the amount of variance in each report due to trait, method, and error (Bagozzi 1980; Joreskog 1971, 1974).
For the general case of n traits and m methods (informants), the factor-loading matrix for this model may be expressed as:
( I0 x* o
(3) A=
m
0 0
0
A** m
where X* is an n x n diagonal matrix, and X** is a column vector of order n. This formulation allows a measure to load both on a trait factor (via X*) and a methods factor (via X**). If one assumes that the correlation of trait and methods factors is partitioned as
(4) 4) 0
,, = _ 0 b2_-
where 4)' is the correlation matrix for trait factors and +2 is the correlation matrix for methods factors, it follows that "method factors are sources of variation and covariation in the data that remain after all trait factors have been eliminated" (Joreskog 1971, p. 128). Substitution of equations 3 and 4 into the general equation 2 yields the variance-covariance matrix, X, for the n trait and m method MM matrix. The application of LISREL provides maximum likelihood estimates of the parameters in A, 4), and t and an overall goodness- of-fit test. Thus, it permits partitioning of variance attributable to trait, method, and error, where trait variance is equal to A*2, methods variance is equal to K2**, and error variance is equal to 02 (Bagozzi 1980).
Model Testingfor Discriminant Validity Discriminant validity will be achieved when the
measures of each trait converge on their respective true scores and the true scores achieve uniqueness from one another. Joreskog (1974) shows that this will occur when the true score correlations in 4) are signifi- cantly lower than 1.00. Using LISREL, one may test
401

JOURNAL OF MARKETING RESEARCH, NOVEMBER 1981
Figure 2 MODEL TESTING FOR CONVERGENT VALIDITY IN INFORMANT REPORTS WITH METHODS FACTOR CONTROLS
4 65
the hypothesis of discriminant validity by taking the difference in X2 values between the model leaving the off-diagonal elements of 4( free and the model con- straining the off-diagonals of + which relate the true scores to be unity (Joreskog 1971, 1974). Thus, if the hypothetical model of Figure 1 achieved a good fit to the data, discriminant validity would be tested by constraining each of the 4) intercorrelations in Figure I to be 1.0, and comparing the fit of this model with the fit of the initial Figure 1 model, where the 4 parameters were unconstrained. Tests for individual (b parameters may also be conducted by this approach. This may be warranted if one of the trait intercorrela-
tions is particularly high (i.e., close to unity) and the others are not.
Other Procedural Issues For an MM matrix analysis, the number of methods
measuring each trait must be a constant for each unit of analysis (Campbell and Fiske 1959). Otherwise, a complete matrix of trait and method correlations cannot be generated. Because the number of informants per company varied it was not possible to construct an MM matrix with observations from all companies and all informants. To overcome this problem, split halves of informants were created for each company. This
402

ORGANIZATIONAL ANALYSIS IN MARKETING
entailed rank ordering all the informants in a company by their positional status. Position was chosen as a classification variable because it is often mentioned as a plausible source of distortion in informant reports (McClintock, Brannen, and Maynard-Moddy 1979; Seidler 1974).
The order in which job titles appear in Table 1 was the basis for rank ordering informants in each company according to their positional status. In ranking job titles by position, higher ranks were assigned to those titles which reflected (1) higher formal authority and (2) a higher probability of its holder exhibiting vested interest when reporting on strategic company marketing issues. Rank ordering according to positional status correlated significantly with participation in strategic corporate policy decisions (r = .35, p < .01) and participation in strategic marketing decisions (r = .20, p < .01). Because one would expect positional status to be correlated with participation in strategic decisions, the observed correlations constitute evidence for the "face validity" of the classification scheme.
Once informants were rank ordered by position they were placed into split halves. In all two-informant companies, the first split half was the CEO and the other half was the other responding informant. In all three-informant companies, the first split half was the CEO and the second was the mean responses of the other two informants. In all four-informant companies, the first split half was mean responses of the CEO and the informant closest to him/her in formal position, and the second half consisted of the mean responses of the other two informants responding from the company. Similar split-half procedures were used for those 10 companies which had more than four respond- ing informants.
The advantage of the split-half approach is twofold. First, it allows each half to be labeled in a meaningful way (e.g., high versus low position), which is useful in interpreting the results for the reliability of different methods.6 Second, it allows the tests for validity to be conducted across the entire sample of companies. Because it is unlikely that one would be able to sample the same number of informants in every company, this approach is useful because it solves the problem of standardizing the number of methods across organi- zations. The disadvantage of the approach is that for those split halves formed by taking the mean responses of two informants, a regression to the mean phenome- non may be present. That is, an informant's response which is highly discrepant from others will be less so when averaged with another informant's response. This effect might enhance the possibility of achieving convergent validity due to an artifact of procedure. To guard against this possibility, all tests for convergent and discriminant validity were also conducted on all two-informant (N = 153), three-informant (N = 205),
6Analyses were also conducted on several instruments comparing results from split halves formed on position scores with split halves formed randomly. The tests for convergent and discriminant validity yielded similar conclusions, suggesting no artifact due to the way split halves were constructed.
and four-informant companies (N = 148), whereas for the 10 companies with more than four informants reporting only the top four informants in positional status were used. Thus, in each of these subsamples, all analyses are based on individual informant reports and not split halves of informants.
A final procedural point pertains to the decision on which traits to include in a particular MM matrix analysis. To provide a strong test for convergent and discriminant validity, MM matrices were constructed by including traits in the matrix which were as concep- tually similar as possible. This meant that measures of the firm's power-dependence relationships with its major suppliers were included in a separate MM matrix from the measures of power-dependence relations with major customers. Similarly, measures of characteristics of the firm's product portfolio were included in a separate MM matrix. This mode of analysis enhances the possibility of detecting methods factors as sources of systematic error in the data, because methods factors such as positional biases, if present, should be evident in informants' responses to multiple questions referring to the same issue.
TESTS FOR CON VERGENT AND DISCRIMINANT VALIDITY7
Characteristics of the Firm's Power-Dependence Relations With Its Major Suppliers
The measures of supplier control over distributor operations in five specific areas were included in a separate MM matrix analysis. Appendix B shows the MM matrix of correlations for the five traits and two split halves of informants across the entire sample.8 Note that in this MM matrix, the validity correlations are positive and statistically significant and, in all but a few cases, exceed the correlations across measures
7Though the confirmatory factor analysis procedures used in testing for convergent and discriminant validity assume interval level measurement, the data are measured at an ordinal level. This apparent violation of assumptions is not a major problem in the split-half analyses, as the averaging of informants' responses helps to ensure that the data have the desired distributional properties. However, in the two-, three-, and four-informant samples, where no averaging of responses occurs, the data are measured at an ordinal level. This raises the question of whether the statistical method used is robust against this kind of deviation from distribu- tional assumptions. Olsson (1979) notes that application of factor analysis to discrete data may lead to incorrect conclusions when the distributions of the observed variables are highly skewed. Examination of the data in the split-half sample and the various subsamples indicated that this was not the case for the measures investigated. Olsson (1979) also shows that correlation coefficients computed from ordinal data by procedures which assume interval level measures typically underestimate the true correlation. Conse- quently, the measures of association reported hereafter are con- servative estimates and cause the reliability estimates obtained to be conservative.
8The MM matrices of correlations for the two-, three-, and four-informant company subsamples were too long to be reported. The MM matrices for all subsample analyses reported are available from the author upon request.
403
JOURNAL OF MARKETING RESEARCH, NOVEMBER 1981
of different constructs. Thus, the measures appear to satisfy several of the criteria established by Camp- bell and Fiske (1959) for convergent and discriminant validity. Notice, however, the nonuniform pattern of correlations throughout each of the MM matrices. For example, split-half #1's measure of the first trait (SC 1) is more highly correlated with split-half #l's measure of the second trait (SC2) than with split-half #2's measure of the second trait. This nonuniform pattern holds across traits and methods, suggesting the pres- ence of some methods factors as a source of variation in the data.
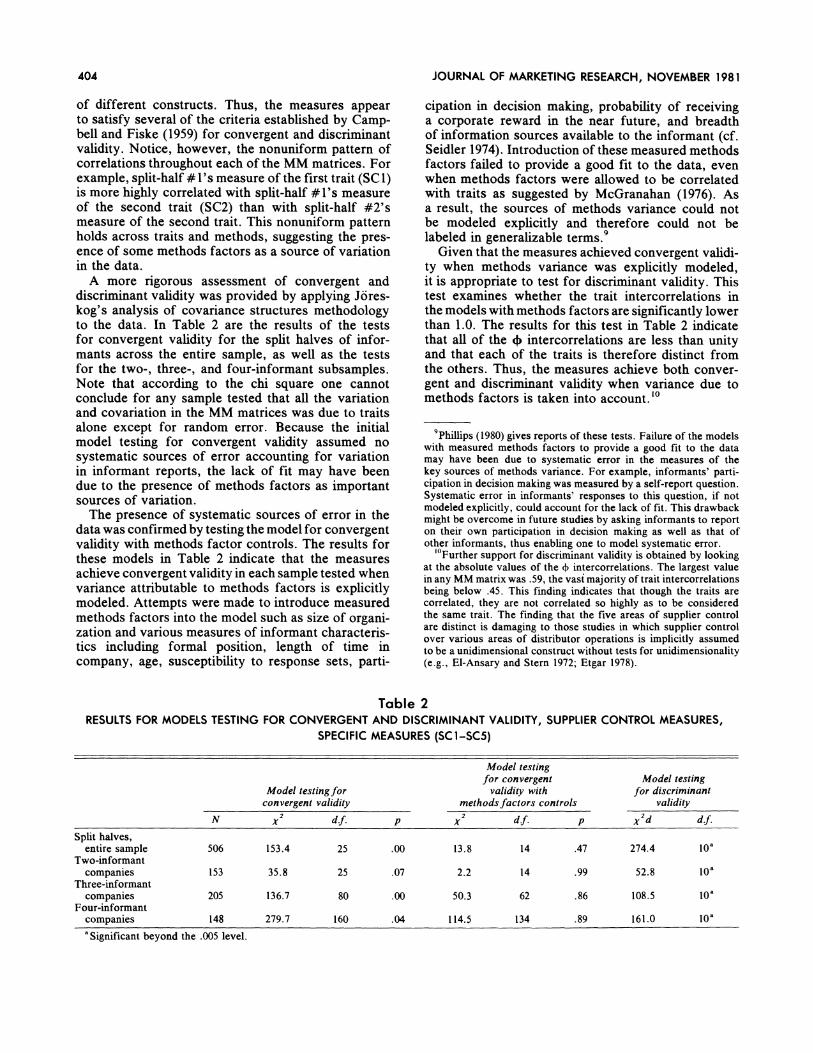
A more rigorous assessment of convergent and discriminant validity was provided by applying Jores- kog's analysis of covariance structures methodology to the data. In Table 2 are the results of the tests for convergent validity for the split halves of infor- mants across the entire sample, as well as the tests for the two-, three-, and four-informant subsamples. Note that according to the chi square one cannot conclude for any sample tested that all the variation and covariation in the MM matrices was due to traits alone except for random error. Because the initial model testing for convergent validity assumed no systematic sources of error accounting for variation in informant reports, the lack of fit may have been due to the presence of methods factors as important sources of variation.
The presence of systematic sources of error in the data was confirmed by testing the model for convergent validity with methods factor controls. The results for these models in Table 2 indicate that the measures achieve convergent validity in each sample tested when variance attributable to methods factors is explicitly modeled. Attempts were made to introduce measured methods factors into the model such as size of organi- zation and various measures of informant characteris- tics including formal position, length of time in company, age, susceptibility to response sets, parti-
cipation in decision making, probability of receiving a corporate reward in the near future, and breadth of information sources available to the informant (cf. Seidler 1974). Introduction of these measured methods factors failed to provide a good fit to the data, even when methods factors were allowed to be correlated with traits as suggested by McGranahan (1976). As a result, the sources of methods variance could not be modeled explicitly and therefore could not be labeled in generalizable terms.9
Given that the measures achieved convergent validi- ty when methods variance was explicitly modeled, it is appropriate to test for discriminant validity. This test examines whether the trait intercorrelations in the models with methods factors are significantly lower than 1.0. The results for this test in Table 2 indicate that all of the 4b intercorrelations are less than unity and that each of the traits is therefore distinct from the others. Thus, the measures achieve both conver- gent and discriminant validity when variance due to methods factors is taken into account.'0
9Phillips (1980) gives reports of these tests. Failure of the models with measured methods factors to provide a good fit to the data may have been due to systematic error in the measures of the key sources of methods variance. For example, informants' parti- cipation in decision making was measured by a self-report question. Systematic error in informants' responses to this question, if not modeled explicitly, could account for the lack of fit. This drawback might be overcome in future studies by asking informants to report on their own participation in decision making as well as that of other informants, thus enabling one to model systematic error.
'?Further support for discriminant validity is obtained by looking at the absolute values of the 4 intercorrelations. The largest value in any MM matrix was .59, the vast majority of trait intercorrelations being below .45. This finding indicates that though the traits are correlated, they are not correlated so highly as to be considered the same trait. The finding that the five areas of supplier control are distinct is damaging to those studies in which supplier control over various areas of distributor operations is implicitly assumed to be a unidimensional construct without tests for unidimensionality (e.g., El-Ansary and Stern 1972; Etgar 1978).
Table 2 RESULTS FOR MODELS TESTING FOR CONVERGENT AND DISCRIMINANT VALIDITY, SUPPLIER CONTROL MEASURES,
SPECIFIC MEASURES (SC1-SC5)
Model testing for convergent Model testing
Model testingfor validity with for discriminant convergent validity methodsfactors controls validity
N 2 d.f. x2 d.f. p x2d d.f.
Split halves, entire sample 506 153.4 25 .00 13.8 14 .47 274.4 10a
Two-informant companies 153 35.8 25 .07 2.2 14 .99 52.8 10O
Three-informant companies 205 136.7 80 .00 50.3 62 .86 108.5 10a
Four-informant companies 148 279.7 160 .04 114.5 134 .89 161.0 10O
aSignificant beyond the .005 level.
404

ORGANIZATIONAL ANALYSIS IN MARKETING
Table 3 PARTITIONING OF VARIANCE DUE TO TRAIT, METHOD,
AND ERROR FOR THE MEASURES OF SUPPLIER CONTROL OVER DISTRIBUTOR OPERATIONS (SPECIFIC MEASURES),
BY SUBSAMPLE
Variance components Trait Method Error
Split halves, entire sample First split half (informants high in
positional status/includes CEO)
Supplier control over: Minimum order size (SCI) Mix of units ordered (SC2) Training of salesmen (SC3) Hiring of salesmen (SC4) Territories served (SC5)
Second split half (informants lower in positional status)
Supplier control over: Minimum order size (SC1) Mix of units ordered (SC2) Training of salesmen (SC3) Hiring of salesmen (SC4) Territories served (SC5)
Two-informant companies Informant 1 (high positional status/
CEO)
Supplier control over: Minimum order size (SCI) Mix of units ordered (SC2) Training of salesmen (SC3) Hiring of salesmen (SC4) Territories served (SC5)
Informant 2 (non-CEO/lower positional status)
Supplier control over: Minimum order size (SC1) Mix of units ordered (SC2) Training of salesmen (SC3) Hiring of salesmen (SC4) Territories served (SC5)
Three-informant companies Informant 1
Supplier control over: Minimum order size (SC1) Mix of units ordered (SC2) Training of salesmen (SC3) Hiring of salesmen (SC4) Territories served (SC5)
Informant 2
Supplier control over: Minimum order size (SC1) Mix of units ordered (SC2) Training of salesmen (SC3) Hiring of salesmen (SC4) Territories served (SC5)
Informant 3
Supplier control over: Minimum order size (SC1)
.81
.92
.14
.62
.64
.27
.18
.55
.22
.52
.68
.70
.26
.25
.48
.21
.20
.35 c1
.02
.01
.65
.13
.06
.10
.10
.28
.24
.06
.04
.03
.14
.24
.16
.21
.25
.10 nr
.17
.07
.21
.25
.29
.63
.72
.17
.54
.43
.28
.27
.60
.51
.36
.58
.55
.55 41
Table 3 (Continued)
Variance components Trait Method Error
Mix of units ordered (SC2) Training of salesmen (SC3) Hiring of salesmen (SC4) Territories served (SC5)
Four-informant companies Informant 1
Supplier control over: Minimum order size (SC1) Mix of units ordered (SC2) Training of salesmen (SC3) Hiring of salesmen (SC4) Territories served (SC5)
Informant 2
Supplier control over: Minimum order size (SC1) Mix of units ordered (SC2) Training of salesmen (SC3) Hiring of salesmen (SC4) Territories served (SC5)
Informant 3
Supplier control over: Minimum order size (SC1) Mix of units ordered (SC2) Training of salesmen (SC3) Hiring of salesmen (SC4) Territories served (SC5)
Informant 4
Supplier control over: Minimum order size (SC1) Mix of units ordered (SC2) Training of salesmen (SC3) Hiring of salesmen (SC4) Territories served (SC5)
.28
.13
.26
.43
.30
.36
.29
.36
.39
.36
.36
.38
.49
.44
.32
.43
.30
.37
.44
.27
.26
.30
.36
.39
.14
.19
.18
.14
.09
.07
.15
.21
.19
.04
.02
.14
.24
.19
.14
.06
.21
.13
.11
.13
.07
.25
.11
.11
.58
.68
.56
.43
.61
.57
.56
.43
.42
.60
.62
.48
.27
.37
.54
.51
.49
.50
.45
.60
.67
.45
.53
.50
.5 V06 .19 Performing the above tests leads to the partitioning of total variance due to trait, method, and error shown in Table 3. Examination of the trait variances in Table 3 shows that certain informants (or split halves of informants) serve as more reliable informants than
.20 .13 .67 others on certain supplier control issues, and that the .18 .19 .63
.11 .18 .61 reliability of certain informants varies somewhat by
.22 .21 .57 subsample. For example, in the split halves and
.31 .16 .53 two-informant samples, supplier control over distribu- tor operations in various areas is often best measured by the first informant (the CEO), whereas in the three-
.61 .02 .37 and four-informant company subsamples, supplier
.37 .08 .55 control is best measured by informants lower in
.84 .01 .15 positional status than the CEO. This finding may be
.26 .53 .21 due to the fact that the three- and four-informant .63 .06 .31 companies were larger than the two-informant companies in terms of number of employees (see Phillips 1980), and decentralization in decision making allowed non-CEO informants to participate more in
405
JOURNAL OF MARKETING RESEARCH, NOVEMBER 1981
negotiations with major suppliers. Nevertheless, given that more than half of the 55 trait variances in Table 3 are below 50% and that only four exceed 70%, we must conclude that none of the informants provided better than moderately valid measures of the power- dependence concepts.
The results for other measures of the firm's power- dependence relationships with its major suppliers were similar to the results obtained for the supplier control (specific) measures. An MM matrix analysis was performed on the measures of supplier substitutability (SBSUP), countervailing power of the distributor (as measured by CVPR and BPWS), and supplier control over distributor operations (global measure SCNTG). Appendix B shows the MM matrices of correlations for these measures for the split halves of informants. "
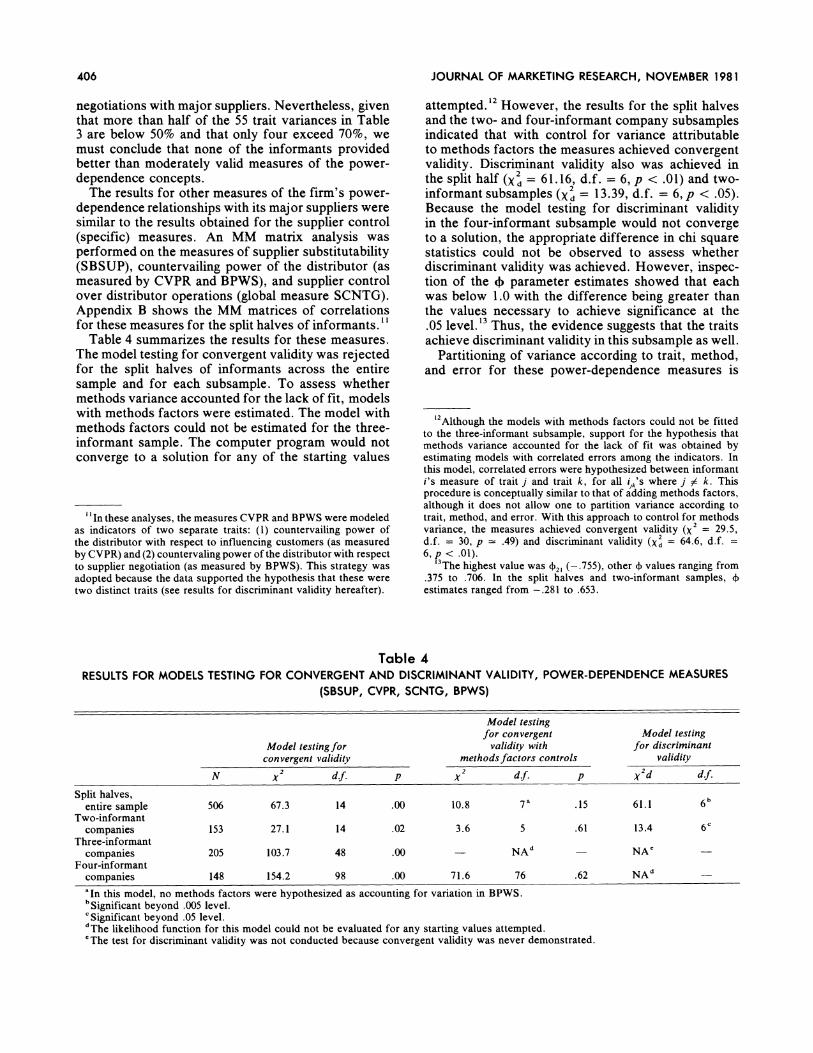
Table 4 summarizes the results for these measures. The model testing for convergent validity was rejected for the split halves of informants across the entire sample and for each subsample. To assess whether methods variance accounted for the lack of fit, models with methods factors were estimated. The model with methods factors could not be estimated for the three- informant sample. The computer program would not converge to a solution for any of the starting values
" In these analyses, the measures CVPR and BPWS were modeled as indicators of two separate traits: (1) countervailing power of the distributor with respect to influencing customers (as measured by CVPR) and (2) countervaling power of the distributor with respect to supplier negotiation (as measured by BPWS). This strategy was adopted because the data supported the hypothesis that these were two distinct traits (see results for discriminant validity hereafter).
attempted.12 However, the results for the split halves and the two- and four-informant company subsamples indicated that with control for variance attributable to methods factors the measures achieved convergent validity. Discriminant validity also was achieved in the split half (X2 = 61.16, d.f. = 6, p < .01) and two- informant subsamples (X2 = 13.39, d.f. = 6, p < .05). Because the model testing for discriminant validity in the four-informant subsample would not converge to a solution, the appropriate difference in chi square statistics could not be observed to assess whether discriminant validity was achieved. However, inspec- tion of the ) parameter estimates showed that each was below 1.0 with the difference being greater than the values necessary to achieve significance at the .05 level.13 Thus, the evidence suggests that the traits achieve discriminant validity in this subsample as well.
Partitioning of variance according to trait, method, and error for these power-dependence measures is
'2Although the models with methods factors could not be fitted to the three-informant subsample, support for the hypothesis that methods variance accounted for the lack of fit was obtained by estimating models with correlated errors among the indicators. In this model, correlated errors were hypothesized between informant i's measure of trait j and trait k, for all i,;'s where j # k. This procedure is conceptually similar to that of adding methods factors, although it does not allow one to partition variance according to trait, method, and error. With this approach to control for methods variance, the measures achieved convergent validity (X2 = 29.5, d.f. = 30, p = .49) and discriminant validity (X2 = 64.6, d.f. = 6, p < .01).
3The highest value was (21 (-.755), other 4 values ranging from .375 to .706. In the split halves and two-informant samples, 4) estimates ranged from -.281 to .653.
Table 4 RESULTS FOR MODELS TESTING FOR CONVERGENT AND DISCRIMINANT VALIDITY, POWER-DEPENDENCE MEASURES
(SBSUP, CVPR, SCNTG, BPWS)
Model testing for convergent Model testing
Model testingfor validity with for discriminant convergent validity methodsfactors controls validity
N 2 d.f. p X2 d.f. p 2d d.f.
Split halves, entire sample 506 67.3 14 .00 10.8 7a .15 61.1 6b
Two-informant companies 153 27.1 14 .02 3.6 5 .61 13.4 6c
Three-informant companies 205 103.7 48 .00 NAd NAe
Four-informant companies 148 154.2 98 .00 71.6 76 .62 NAd
aIn this model, no methods factors were hypothesized as accounting for variation in BPWS. bSignificant beyond .005 level. CSignificant beyond .05 level. dThe likelihood function for this model could not be evaluated for any starting values attempted. eThe test for discriminant validity was not conducted because convergent validity was never demonstrated.
406

ORGANIZATIONAL ANALYSIS IN MARKETING
shown in Table 5. In general, the results show that informants who provided the most reliable information on supplier control (SCNTG) tended to be informants high in positional status, whereas informants in lower positions typically provided as good as or better measures of countervailing power (CVPR, BPWS) and
Table 5 PARTITIONING OF VARIANCE DUE TO TRAIT, METHOD,
AND ERROR FOR THE MEASURES OF SBSUP, CVPR, SCNTG, AND BPWS
Variance components Trait Method Error
Split halves, entire sample First split half
SBSUP CVPR SCNTG BPWS
Second split half SBSUP CVPR SCNTG BPWS
Two-informant companies Informant 1
SBSUP CVPR SCNTG BPWS
Informant 2 SBSUP CVPR SCNTG BPWS
Four-informant companies Informant 1
SBSUP CVPR SCNTG BPWS
Informant 2 SBSUP CVPR SCNTG BPWS
Informant 3 SBSUP CVPR SCNTG BPWS
Informant 4 SBSUP CVPR SCNTG BPWS
.46
.31
.53
.36
.38
.29
.26
.44
.03
.36
.00
.00
.11
.00
.28
.00
.31 .00
.22 .15
.72a .01
.60 .01
.31
.27
.08
.47
.14
.17
.36
.15
.29
.06
.10
.31
.53
.70
.29
.44
.03
.13
.14
.28
.21
.00
.56
.00
.34
.39
.19
.12
.36
.12
.16
.06
.05
.19
.19
.02
.97
.04
.09
.00
.51
.33
.47
.64
.51
.71
.46
.56
.68
.63
.27
.39
.48
.73
.36
.52
.52
.44
.45
.73
.35
.82
.74
.63
.42
.11
.52
.54
.00
.83
.77
.72 aTrait variance for this measure should be viewed cautiously,
because the t-value associated with the trait factor loading was not significant at the .05 level, indicating that the factor loading was not significantly different from zero.
supplier substitutability (SBSUP) than their higher- ranking counterparts. Nevertheless, on the basis of the amount of trait variance shown for each power measurement, one must conclude that none of the informants provided better than moderately valid measures of these concepts.
Characteristics of the Firm's Power-Dependence Relations With Its Major Customers
The measures of customer control over distributor operations (CCNTP and CCNTG) and substitutability of major customers (SBCUS) were included in a separate MM matrix analysis. Appendix B shows the MM matrices of correlations for the split halves. The measures failed to achieve convergent validity in the split-halves sample (X2 = 59.7, d.f. = 6, p = .00), the two-informant subsample (X2 = 29.3, d.f. = 6, p - .00), the three-informant subsample (X2 = 54.7, d.f. = 24, p - .00), and the four-informant subsample (X2 = 112.2, d.f. = 51, p = .00). To assess whether methods variance accounted for the lack of fit, at- tempts were made to estimate models with both trait and methods factors. However, the model with trait and methods factors was underidentified for the split- half and two-informant samples. 4 The likelihood function for the model for the four-informant sub- samples was not evaluable for any starting values attempted.15
The model with three traits and three methods provided a good fit to the data for the three-informant sample (x2 = 8.5, d.f. = 12, p = .75), indicating that the measures achieved convergent validity when methods variance was taken into account. However, examination of the b intercorrelations showed that
14A necessary condition for model identification is that d.f. > 0, where d.f. = 1/2 (q) * (q + 1)- t, where q is the number of indicators and t is the total number of parameters to be estimated (Joreskog and Sorbom 1978). The model with three traits and two methods factors is therefore underidentified, as there are six indicators and 22 parameters to be estimated, yielding -1 degrees of freedom (cf. Bagozzi 1980, Chapter 5). However, by estimating a model hypothesizing five correlated errors among the indicators, it was possible to show that the measures achieved convergent validity when methods variance was controlled for. In the split- halves sample, a model hypothesizing five correlated errors (cov E3E1, cov E5 e, cov E462, cov E6e2, cov E5E3)achieved convergent (X2 = .76, d.f. = 1, p = .38) and discriminant validity (Xd = 67.8, d.f. = 3, p < .01). In the two-informant subsample, a model hypothesizing the same five correlated errors achieved convergent validity (X2 = .99, d.f. = 1, p = .32). However, we could not reject the hypothesis that 21 = 1.0 (X2 = .97, d.f. = 1, p < .25). Thus, for this subsample, the customer substitutability and customer control concepts, as measured by SBCUS and CCNTG, cannot be viewed as distinct traits. The customer control concept as measured by CCNTP did, however, achieve discrimination from the other traits (x2 = 34.0, d.f. = 2, p < .01).
5 A model hypothesizing eight correlated errors (cov yEE1, cov 6E62, COV ?7E3, COV E8E4, COV 9E5, COV E 1066, COV ?9E, I,COV 12E 8)
achieved convergent (X2 = 40.6, d.f. = 43, p = .58) and discriminant validity (X2 = 48.9, d.f. = 3, p < .01).
407

JOURNAL OF MARKETING RESEARCH, NOVEMBER 1981
421 = .98, which is not significantly different from 1.0 (X2 = .002, d.f. = 1, p < .90). Therefore, one must conclude that the substitutability concept and the customer control concept, as measured by SBCUS and the global measure CCNTG, are not distinct traits. Although the concept of customer control over prices, as measured by CCNTP, did achieve discriminant validity from the other traits (X = 12.5, d.f. = 2, p < .01), trait variances for the measures of this concept ranged from 9 to 53%. Thus, one must conclude that none of the informants provided highly valid measures of this power-dependence concept.
Characteristics of the Firm's Product Portfolio The MM matrices for the measures of product
quality (PRSP, PREQ, PRIN) and prices of products relative to competition (PRICES) are shown in Appen- dix B for the split-half sample. All four measures could not be included in the same MM matrix because the three product quality measures are not independent (all three must sum to 100%-see Appendix A). Because informants judged the majority of products
sold as being in the PREQ category (mean = 61.1%, S.D. = 27.0), the PRSP and PRIN measures can be viewed as relatively independent indicators. There- fore, they were entered into the same MM matrix with the PRICES measure, and PREQ was entered into a separate MM matrix with the PRICES measure. The results for both these MM matrices, summarized in Table 6, show that the measures achieved conver- gent and discriminant validity in five of the eight subsamples tested. Results for models hypothesizing correlated errors among indicators, reported in foot- notes to Table 6, indicate that the measures achieved convergent and discriminant validity in the other three subsamples when variance due to methods factors was controlled for. However, as shown in Tables 7 and 8, the variance attributable to the trait is less than 50% for almost all measures and informants, indicating low validity of the measures.
DISCUSSION
The findings indicate that informant reports on organizational characteristics often fail to serve as
Table 6 RESULTS FOR MODELS TESTING FOR CONVERGENT AND DISCRIMINANT VALIDITY, PRODUCT PORTFOLIO MEASURES
Model testing for convergent Model testing
Model testingfor validity with for discriminant convergent validity methodsfactors controls validity
Sample N 2 d.f. p x2 df. p x2d d.f.
Measures included in MM matrix: PREQ, PRICES
Split halves, entire sample 506 .34 1 .56 - NAa 46.3 1b
Two-informant companies 153 .67 1 .41 -NAa -9.6 b
Three-informant companies 205 21.8 8 .01 - NAC' NAd
Four-informant companies 148 18.61 19 .48 NAa 14.3 b
Measures included in MM matrix: PRSP, PRIN, PRICES Split halves,
entire sample 506 15.2 6 .02 NA'2 NA Two-informant
companies 153 7.8 6 .26 - NA - 18.8 3b Three-informant
companies 205 42.6 24 .01 - NAe3 - NA Four-informant
companies 148 58.1 51 .23 NAa 37.7 3b
aThis model was not estimated because convergent validity was achieved without introducing methods factors. bSignificant beyond the .005 level. CThis model could not be estimated because it was underidentified. dThe test for discriminant validity was not conducted because convergent validity was never demonstrated. eThe likelihood function for this model could not be evaluated for any starting values attempted. 'A model hypothesizing correlated errors between the second informant's reports on PREQ and PRICES and the third informant's
reports on PREQ and PRICES achieved convergent (X2 = 4.9, d.f. = 6, p = .56) and discriminant validity (X2 = 42.3, d.f. = 1, p < .01).
2A model hypothesizing correlated errors between the first informant's reports on PRSP and PRIN and the second informant's reports on PRSP and PRIN achieved convergent (x2 = 3.3, d.f. = 4, p - .51) and discriminant validity (x2 = 79.3, d.f. = 3, p < .01).
3A model hypothesizing correlated errors between the second informant's reports on PRSP and PRICES and the third informant's
reports on PRSP and PRICES achieved convergent (X2 = 29.2, d.f. = 22, p = .14) and discriminant validity (Xa = 53.8, d.f. = 3, p < .01).
408

ORGANIZATIONAL ANALYSIS IN MARKETING
Table 7 PARTITIONING OF VARIANCE ACCORDING TO TRAIT,
METHOD, AND ERROR FOR MEASURES OF CHARACTERISTICS OF FIRM'S PRODUCT PORTFOLIO
Variance components Trait Error
Split halves, entire sample First split half (informants high in
positional status/includes CEO) * % of products
equivalent to competition * Prices relevant to competition
Second split half (informants lower in positional status) * % of products
equivalent to competition * Prices relative to competition
'wo-informant companies Informant 1 (high positional status/
CEO) * % of products
equivalent to competition * Prices relative to
competition Informant 2 (non-CEO/lower
positional status) * % of products
equivalent to competition * Prices relative to
competition
our-informant companies Informant 1 (high positional status/
CEO) * % of products
equivalent to competition * Prices relative to competition Non-CEO informants/lower positional status:
Informant 2 * % of products
equivalent to competition * Prices relative to
competition Informant 3
* % of products equivalent to competition
* Prices relative to competition
Informant 4 * % of products
equivalent to competition * Prices relative to
competition
.51 .49
.46 .54
.24 .76
.46 .54
.89a
.48
.11
.52
.08
.21
.92
.79
.26 .56
.30 .70
.44 .56
.28 .72
.18
.36
.13
.82
.64
.87
.17 .83
aTrait variance for this measure should be viewed cautiously, as the t-valve associated with the trait factor loading was not significant at the .05 level, indicating that the factor loading was not significantly different from zero.
highly valid indicators of the concepts they intend to represent. Though the degree of consensus among informants reporting on the same trait was statistically significant in almost all cases, informant reports failed to satisfy more stringent validity criteria. For those measures which achieved both convergent and dis- criminant validity, partitioning of variance according to trait, method, and error showed that informant reports were typically characterized by less than 50% variance attributable to the trait. This means that variance in the measures due to error factors (both random and systematic) was larger than variance due to trait factors. As a result, the measures and the methods used to assess the organizational characteris- tics under study must be viewed as questionable.
Further evidence for the lack of validity is obtained by examining the correlations in Appendix B between measures of different constructs hypothesized to be causally related. For example, quality of products sold as measured by PRSP, PREQ, and PRIN should be significantly associated with prices relative to competition as measured by PRICES. PRSP should be positively correlated with PRICES, and PREQ and PRIN should be negatively correlated with PRICES (cf. Buzzell, Gale, and Sultan 1975; Schoeffler, Buz- zell, and Heaney 1974). Yet, as shown in Appendix B, correlations between these measures are often low and in some cases insignificant (e.g., PRIN and PRICES), suggesting attenuation due to measurement error. Similar conclusions emerge when one examines the correlations between the measures of distributor countervailing power (CVPR) and supplier control (SCNTG). These constructs are hypothesized by cer- tain investigators to be causally related (cf. Etgar 1976b; Pfeffer and Salancik 1979). Yet, as shown in Appendix B, correlations between these measures, though statistically significant when indicated by cer- tain informants, are insignificant when measured by other informants (e.g., CVPR #1 with SCNTG #2). Failure to observe statistically significant correlations between all indicators of concepts linked in a theoreti- cal network is further evidence of the invalidity of measures. 16
In sum, the results suggest that asking survey respondents to assume the role of a key informant is a method which may introduce considerable mea- surement error into the analysis for at least two reasons. First, asking key informants to make complex social judgments about organizational characteristics may place unrealistic demands on them as respondents, thereby increasing random measurement error. The
'6This validity criterion is referred to as nomological validity (Campbell 1960; Bagozzi 1980). For a more comprehensive discus- sion of nomological validity, as well as further tests for nomological validity of the measures reported here, see Phillips (1980) and Phillips and Bagozzi (1981).
T
F
409

JOURNAL OF MARKETING RESEARCH, NOVEMBER 1981
Table 8 PARTITIONING OF VARIANCE ACCORDING TO TRAIT,
METHOD, AND ERROR FOR MEASURES OF CHARACTERISTICS OF FIRM'S PRODUCT PORTFOLIO
Variance components
Trait Error
Two-informant companies Informant 1 (high positional status/CEO)
% of products superior to competition % of products inferior to competition Prices relative to competition
Informant 2 (non-CEO / lower positional status) % of products superior to competition % of products inferior to competition Prices relative to competition
Four-informant companies Informant 1 (high positional status/CEO)
% of products superior to competition % of products inferior to competition Prices relative to competition
Non-CEO informants/lower positional status: Informant 2
% of products superior to competition % of products inferior to competition Prices relative to competition
Informant 3 % of products superior to competition % of products inferior to competition Prices relative to competition
Informant 4 % of products superior to competition % of products inferior to competition Prices relative to competition
.33
.09
.61
.29
.33
.17
.23
.17
.32
.48
.27
.26
.21
.18
.37
.15
.01
.15
.67
.91
.39
.71
.67
.83
.77
.83
.68
.52
.73
.74
.79
.82
.63
.85
.99
.85
substantial random error components in several of the tables, especially Tables 7 and 8, are consistent with this interpretation. Second, distortions in key informant reports may be attributable to systematic sources of error such as bias or ignorance. The data in Tables 2-5 provide support for this interpretation. These data indicate that a significant portion of the variation in informants' responses is due to methods factors such as positional biases or knowledge defi- ciencies associated with each informant. Thus, the data are consistent with the view that aspects of the informant reporting process may result in both random and systematic sources of error in one's measurement of organizational characteristics.
Examination of Threats to Valid Inference
Although the evidence suggests that aspects of the informant reporting process operate as causal factors influencing measurement error, certain rival explana- tions must be examined to enhance confidence in the findings. One alternative interpretation is that the failure of informant reports to exhibit high trait variances may have been due to a single methodologi- cal artifact common to all informants (e.g., lack of interest in the survey topic, a self-report bias) which
led to errorful responses and low interinformant agreement. However, this explanation does not fully order the study findings. Note first that the models with multiple traits and multiple methods factors often achieved a good fit to the data (see Tables 2 and 4). In each of these models the correlation between the methods factors was significantly less than 1.0 for all models tested. These findings are inconsistent with the hypothesis of a single methods factor. They indicate that a separate methods factor (e.g., positional bias, etc.) associated with each informant was captur- ing part of the variation in the data, thus supporting the contention that systematic sources of distortion are one of the causal antecedents of measurement error. Moreover, if a single methods factor such as lack of interest in the survey topic were operative, none of the measures included in the survey instrument should have achieved high trait variances. Yet several of the measures included in the study, although not reported here, did have both high validity correlations and high trait variances. For example, a series of indicators adopted from Etgar (1976a) to measure the extent of the firm's adoption of advanced distribution technologies (e.g., use of computer in accounting, inventory control, etc.) showed validity correlations in the .6 to .85 range and trait variances ranging from 50% to more than 90% (see Phillips 1980; Phillips and Bagozzi 1981). Similarly, other items referring to relatively objective, observable phenomena achieved trait variances in excess of 50% (see Phillips 1980). Considered together, these data suggest that the results are not due to a single methods factor which produced substantial measurement error in all indicators.
A second alternative interpretation of the data is that failure to observe high trait variances for several of the measures was due to characteristics of the population studied. One may contend that wholesale distribution firms are atypical of the organizations or organizational subunits often studied in marketing contexts. They buy from a wide range of suppliers and market a wide range of products to a diverse customer base. Therefore, asking executives for social judgments about supplier-distributor relationships, product portfolio characteristics, and customer-dis- tributor relations is a more difficult task than would be faced by executives in other organizational settings (e.g., a division of a major firm; c.f. Schoeffler, Buzzell, and Heany (1974)). Moreover, the firms studied were relatively small organizations (mean number of employees 70.4, S.D. = 98.2). Although some investigators contend that small size helps to minimize the impact of methods factors related to the difficulty of observation (e.g., Seidler 1974), this effect probably depends on the type of information being sought. Large multidivisional firms may have more well established competitive intelligence systems than small organizations. As a result, the top-level
410

ORGANIZATIONAL ANALYSIS IN MARKETING
executive in a larger firm may be more familiar with the relative prices and quality of the firm's products than his/her counterpart in a smaller company. If this were the case, higher trait variances might have been observed for informant reports obtained from a sample of larger, more sophisticated companies.
Although one cannot rule out the second alternative explanation without conducting a similar study in other organizational settings, the study findings are similar to those of other investigators who have reported low intermethod correlations between key informants reporting on the same trait (e.g., Davis 1971; Molnar and Rogers 1979; Provan, Beyer, and Krytbosch 1980; Silk and Kalwani 1980; Spekman 1977). These studies addressed different issues and used different measures than the present study, and were conducted in dissimi- lar settings. The consistency of results across studies supports the view that asking survey respondents to serve as key informants may introduce considerable measurement error into the analysis. Thus, until more is known about the causal antecedents of measurement error in key informant reports, researchers should not assume that errorful reporting by informants is a problem associated only with particular types of or- ganizations or issues.
A final alternative interpretation of the study find- ings is that the substantial random error components found for several of the indicators may be due simply to poor measures, and that the results are therefore due to the specific items used rather than the fact that key informants were employed. Note first that this explanation alone cannot account for the findings for the models with methods factors (Tables 2-5), which indicate that a significant portion of the variation in informants' responses was attributable to dif- ferences in informant characteristics. Nevertheless, the interpretation may have merit in explaining some of the findings such as those in Tables 7 and 8, where methods variance was insignificant. The problem here is that the finding of substantial random measurement error may have been due to other factors besides inadequate measures, such as the complexity of the judgment task facing the informant, inadequate organ- izational constructs, and so on. Thus, it is not clear whether random error components are the result of aspects of the informant reporting process, inadequate measures, or some combination of these and other factors.
One way to address this issue, at least in part, is to examine the convergent validity of informants' reports at a monomethod level of analysis (see Phillips and Bagozzi 1981). This could have been done by asking each informant the same question twice as in a test-retest study, and checking for internal consis- tency in informants' responses. Alternatively, each informant could have been asked to respond to multiple survey items designed to measure the same concept, and internal consistency among these responses as-
sessed. A finding of high internal consistency in informants' reports at the monomethod level of analy- sis and low between-informant agreement at a multi- method level of analysis would constitute further support for the view that aspects of the informant reporting process, and not the inadequacy of measures, were the causal antecedents of measurement error. In contrast, a finding of low degrees of agreement in informant reports at both the monomethod and multimethod levels of analysis would support the view that inadequate measures were to blame for lack of convergence.
Because there was no information by which to assess the internal consistency of informant's reports at a monomethod level of analysis for the measures report- ed here, these alternative explanations cannot be tested empirically. However, findings for other indicators included in the survey instrument supported the view that aspects of the informant reporting process were an important antecedent of measurement error (see Phillips 1980; Phillips and Bagozzi 1981). Informants' reports on multiple items designed to measure the same concept often showed a high degree of internal consistency at the monomethod level of analysis, with reliability coefficients ranging from .7 to .93. However, these same measures exhibited significantly lower degrees of agreement and lower trait variances when tested at a multimethod (i.e., between-informant) level of analysis. These findings reaffirm the need to avoid relying on reports provided by a single informant, because estimates of internal consistency in informant reports at a monomethod level of analysis may over- state the amount of trait variance captured by one's measures. Only when variance due to methods factors (e.g., positional biases of informants, knowledge defi- ciencies, etc.) is explicitly modeled can one conduct a rigorous assessment of the reliability and validity of informant reports.
IMPLICA TIONS FOR FUTURE RESEARCH The findings support the contention that the mono-
method single-informant approach to the measurement of organizational characteristics should be abandoned. Whenever possible, key informant reports should be validated by the reports of other informants, and/or other dissimilar attempts to measure the same organ- izational trait (c.f. Webb and Weick 1979). Use of only a single informant per unit of analysis, though common in marketing studies, does not permit a strong assessment of convergent or discriminant validity because variation in measurements due to methods factors cannot be modeled. Further, when reports from a single informant on a single measure are included as indicators of unobservable variables in a causal model attempting to test substantive relationships, one must assume that the unobservable variables are measured perfectly and without error by the single informant's reports (Bagozzi 198Q; Joreskog and Sor-
411
JOURNAL OF MARKETING RESEARCH, NOVEMBER 1981
bom 1978). The study results show that this assumption is naive and unlikely to be justified, yet this assumption underlies virtually all of the marketing studies in which the key informant method has been used. Failure to model explicitly systematic errors in measurement, where they are present, can lead to biased and incon- sistent parameter estimates of the influence of the independent variables in a causal model (see Bagozzi 1980). Consequently, the construct relationships dem- onstrated in previous studies should be questioned, because the results may be spurious as a result of methods factors. 17
The results suggest that future investigations should devote greater attention to informant selection criteria. The findings from Tables 3, 5, 7, and 8 indicate that no single informant is likely to be found who is the "most reliable informant" on all issues. Examination of the trait variances for the various measures shows that high-ranking informants tended to be more reliable sources of information than their lower status coun- terparts on some issues but not on others, with no discernible pattern emerging across all measures. These results also lead one to question the use of a single informant in a study investigating multiple constructs. They suggest a need to avoid relying on a common set of informants within a single organiza- tion as sources of information on each of the concepts under investigation, as was done in this study. Rather, investigators may wish to gather data from different multiple informants for each of the constructs under study. For example, certain informants might report on the firm's external relations and others could report on the firm's internal structural characteristics. Though such an approach would be time-consuming and expensive, and would require extensive presurvey contact with each organization to select informants, the gains in terms of reliability and validity might well offset the costs.
Finally, the findings also suggest that in future key informant investigations, certain strategies should be adopted in an attempt to reduce measurement error in informant reports. Researchers often ask questions in such a way as to increase the complexity of the socialjudment required of the informant. For example, the questions on interorganizational influence used by Etgar (1976b), i.e., SBSUP, SCNTG, etc., asked informants to report on the firm's power-dependence relations with a group of organizations (three leading suppliers) rather than a single supplier. These questions may increase measurement error if different responses are appropriate for each of the three leading suppliers, as respondents might have difficulty forming social
17For a review and illustration of the statistical procedures available for controlling for measurement error in testing substantive hypotheses, see Phillips (1980) and Phillips and Bagozzi (1981; cf. Bagozzi 1980).
judgments or might use different mathematical rules in resolving the discrepancy between the appropriate responses for each supplier. Similarly, asking execu- tives to judge the prices or quality of products sold relative to competition for all products in a product line is likely to be a more difficult judgment task than rating a single product. Asking questions in a manner which requires less demanding social judg- ments on the part of the informant should attenuate measurement error. Questions which ask informants to report on relatively objective, observable phenome- na also should be less demanding and less subject to distorting influences (c.f. Davis, Douglas, and Silk 1980; Phillips 1980). As a result, this approach to informant interviewing should help to reduce mea- surement error.
CONCLUSION
Marketing studies which take organizations or or- ganizational subunits as the relevant unit of analysis offer the potential of opening new avenues of theoreti- cal inquiry within the field. However, the methodo- logical problems in conducting field research on or- ganizations are new to marketing scholars and practi- tioners. Much work has been done to improve research methods in situations where individuals constitute the unit of analysis, but little effort has been made to apply the same standards for valid inference to situa- tions involving more complex units of analysis. The research described is an attempt to provide a more rigorous basis for evaluating the magnitude and in- fluence of nonsampling errors in marketing studies involving organizations as the unit of analysis.
APPENDIX A
MEASURES INCLUDED IN STUD 18
I. Measures of power-dependence relations between the distributor and its major suppliers All informants were asked the following set of questions: "These questions concern your company's rela- tionship with its 3 LEADING SUPPLIERS (i.e., your company's top 3 suppliers in terms of total dollar volume purchases made by your company)." A. Supplier control over distributor operations:
specific measures (SC1-5) How much do you agree or disagree with the following statements? (SCI) Our leading suppliers have a lot of con-
trol over the minimum order size our company orders from them.
18See Phillips (1980) for order in which questions were asked, as well as a copy of the entire survey instrument.
412

ORGANIZATIONAL ANALYSIS IN MARKETING
(SC2) Our leading suppliers have little control over the mix of units our company orders from them. (reverse scored)
(SC3) Our leading suppliers have little control over how our company trains its sales- men. (reverse scored)
(SC4) Our leading suppliers have little control over our company's decisions on the hiring of salesmen. (reverse scored)
(SC5) Our leading suppliers have a lot of con- trol over our company's decisions on the territories we sell their products in.
Possible responses ranged from 1 (strongly disagree) to 7 (strongly agree).
B. Substitutability of major suppliers: SBSUP
Suppose one of your company's three (3) lead- ing suppliers decided to drop your company as its distributor due to reorganizational con- siderations. How difficult would it be for your company to replace it? Possible responses were 1 = very easy, 2 = relatively easy, 3 = not too difficult and not too easy, 4 = considerably difficult, 5 = very difficult.
C. Countervailing power of distributor: global measure (CVPR) Suppose one of your company's three (3) lead- ing suppliers decided to drop your company as its distributor due to reorganizational con- siderations. What % of your customers could be shifted then by your company to other suppliers? Is it . . .
less than 10% 51-60% 10-20% 61-70% 21-30% _ 71-80% 31-40% 81-90% 41-50% _ more than 90%
D. Countervailing power of distributor: specific measure (BPWS) How much do you agree or disagree with the following statement? "Our company has a considerable amount of bargaining power in negotiating purchase agreements with its lead- ing suppliers." Responses ranged from 1 (strongly disagree) to 7 (strongly agree).
E. Supplier control over distributor operations: global measure (SCNTG) In general, how much control would you say your leading suppliers have on the way your company runs its business? Possible responses were 1 = very little, 2 = a little, 3 = some, 4 = quite a lot, 5 = very much.
II. Measures of power-dependence relations between distributor and its major customers All informants were asked the following set of questions. "These questions concern your company's rela-
tionship with its 3 leading customers (i.e., your company's top 3 customers in terms of total dollar volume sales)." A. Substitutability of major customers: SBCUS
Suppose one of your company's three (3) lead- ing customers decided to drop your company as a supplier due to competitive considerations. How difficult would it be for your company to replace it? Possible responses were 1 = very easy, 2 = relatively easy, 3 not too difficult and not too easy, 4 = considerably difficult, 5 = very difficult.
B. Customer control over distributor operations: global measure (CCNTG) In general, how much control would you say your leading customers have on the way you run your business? Possible responses were 1 = very little, 2 = a little, 3 = some, 4 = quite a lot, 5 = very much.
C. Customer control over distributor operations: specific measure (CCNTP) How much do you agree or disagree with the following statement? "Our leading customers have a lot of influence on the prices our company charges them."
Responses ranged from 1 (strongly disagree) to 7 (strongly agree).
III. Measures of characteristics of the firm's product portfolio A. Quality of products sold: PRSP, PREQ, PRIN
All informants were asked the following ques- tion: "We would like to obtain some assessment of the quality of the products sold by this company as they compare to those of the company's leading competitors. For purposes of this study, product quality refers to some- thing seen by the customer and covers both article sold and the associated service package. Please indicate your estimate of the proportion of total company sales that originate from products and services that you would judge as . . .
(PRSP) clearly superior to those of leading competitors
(PREQ) approximately equivalent to those of leading competitors
(PRIN) clearly inferior to those of leading competitors
_% of total company sales accounted for by this type of product
% of total company sales accounted for by this type of product
_% of total company sales accounted for by this type of product
(percentages should sum to 100%)
B. Prices relative to competition: PRICES
413

JOURNAL OF MARKETING RESEARCH, NOVEMBER 1981
Please check the response category below that best describes in general how the prices of your company's products compare to those of your leading competitors. Our prices are: 1. _10% or more higher than
most of our leading competitors'.
2. _5 to 10% higher than most of our leading competi- tors'.
3. _2 to 5% higher than most of our leading competi- tors'.
4. _within 2% lower or higher than most of our leading competitors'.
5. _2 to 5% lower than most of our leading competi- tors'.
6. _5 to 10% lower than most of our leading competi- tors'.
7. 10% or more lower than most of our leading competitors'.
(This item was reverse scored in analysis.)
APPENDIX B
MUL TITRAIT-MULTIMETHOD CORRELA TIONS USED IN TESTS FOR CONVERGENT AND DISCRIMINANT
VALIDITY'9
Power-dependence measures, distributor-supplier, specific measures, split halves-entire sample (N = 506, for r > .09, p < .05)
1 2 3 4 5 6 7 8 9 10 1. SCI #1 1.0
SC1 #2 SC2 #1 SC2 #2 SC3 #1 SC3 #2 SC4 #1 SC4 #2 SC5 #1 SC5 #2
.48
.29
.14
.16
.10
.18
.10
.12
.04
1.0 .17 .22 .08 .17 .12 .20 .03 .10
1.0 .42 .12 .09 .19 .11 .15 .11
1.0 .09 .17 .10 .17 .04 .12
1.0 .38 .31 .12 .32 .16
1.0 .09 1.0 .31 .41 1.0 .25 .19 .07 1.0 .33 .11 .12 .59
Power-dependence measures, split halves-entire sample (N = 506, for r > .09, p < .05)
SBSUP #1 SBSUP #2 CVPR #1 CVPR #2 SCNTG #1 SCNTG #2 BPWS #1 BPWS #2
1 2 1.0 .40 1.0
-.34 -.16 -.20 -.25
.35 .26
.21 .38 -.23 -.19 -.19 -.19
3 4 5 6 7 8
1.0 .29
-.25 -.02
.20
.20
1.0 -.22 1.0 -.15 .35
.17 -.17
.21 -.22
1.0 -.08 1.0 -.18 .40 1.0
Power-dependence measures, distributor-customer, split halves-entire sample (N = 506, for r > .09, p < .05)
1 2 3 4 5 6 1. SBCUS #1 1.0 2. SBCUS #2 .30 1.0 3. CCNTG #1 .34 .23 1.0 4. CCNTG #2 .22 .35 .34 1.0 5. CCNTP #1 .27 .14 .39 .20 1.0 6. CCNTP #2 .12 .25 .26 .34 .45 1.0
Product portfolio measures: PREQ, PRICES, split halves-entire sample (N - 506, for r > .09, p < .05)
1 2 3 4 1. PREQ #1 1.0 2. PREQ #2 .35 1.0 3. PRICES #1 -.21 -.13 1.0 4. PRICES #2 -.20 -.15 .46 1.0
Product portfolio measures: PRSP, PRIN, PRICES, split halves-entire sample (N = 506, for r > .09, p < .05)
1 2 3 4 5 6 1. PRSP #1 2. PRSP #2 3. PRIN #1 4. PRIN #2 5. PRICES #1 6. PRICES #2
1.0 .40 .03
-.03 .21 .21
1.0 -.10 -.13
.13
.14
1.0 .16 .01
-.01
1.0 -.01
.06 1.0 .46 1.0
REFERENCES
Bagozzi, Richard P. (1980), Causal Models in Marketing. New York: John Wiley & Sons, Inc.
Blau, Peter and Richard Schoenherr (1971), The Structure of Organizations. New York: Basic Books.
Bonoma, Thomas, Richard P. Bagozzi, and Gerald Zaltman (1978), "The Dyadic Paradigm in Marketing Thought," in Organizational Buying Behavior, T. Bonoma and G. Zaltman, eds. Chicago: American Marketing Association.
Brandt, William K. and James M. Hulbert (1975), "Organi- zational Structure and Marketing Strategy in the Multina- tional Subsidiary," Proceedings of the A merican Marketing Association, 37 (Spring-Fall), 320-25.
and (1976), "Patterns of Communications in the Multinational Corporation: An Empirical Study," Journal of International Business Studies, 7 (Spring) 57-64.
and (1977), "Headquarters Guidance in Mar- keting Strategy in the Multinational Subsidiary," Colum- bia Journal of World Business, 12 (Winter), 7-14.
Bucklin, Louis P. (1966), A Theory of Distribution Channel Structure. Berkeley: Institute of Business and Economic Research.
Buzzell, Robert D., Bradley Gale, and Robert Sultan (1975), "Market Share-A Key to Profitability," Harvard Busi- ness Review, 53 (January-February), 97-106.
Campbell, Donald T. (1960), "Recommendations for APA Test Standards Regarding Construct, Trait, or Discrimi- nant Validity," American Psychologist, 15, 546-53.
and Donald W. Fiske (1959), "Convergent and Dis- criminant Validation by the Multitrait-Multimethod Ma- trix," Psychological Bulletin, 56, 81-105.
Davis, Harry (1971), "Measurement of Husband-Wife In-
2. 3. 4. 5. 6. 7. 8. 9.
10.
1. 2. 3. 4. 5. 6. 7. 8.
414
ORGANIZATIONAL ANALYSIS IN MARKETING
fluence in Consumer Purchase Decisions," Journal of Marketing Research, 8 (August), 305-12.
, Susan P. Douglas, and Alvin Silk (1980), "A Cross National Comparison of the Reliability of Selected Mea- surements from Consumer Surveys," working paper, Massachusetts Institute of Technology.
Day, George (1977), "Diagnosing the Product Portfolio," Journal of Marketing, 41 (July), 29-38.
El-Ansary, Adel and Louis W. Ster (1972), "Power Mea- surement in the Distribution Channel," Journal of Market- ing Research, 9 (February), 47-52.
Etgar, Michael (1974), "An Empirical Analysis of the Mo- tivations for the Development of Centrally Controlled Vertical Marketing Systems: The Case of the Property and Casualty Insurance Industry," Ph.D. thesis, Univer- sity of California at Berkeley.
(1976a), "The Effect of Administrative Control on the Efficiency of Vertical Marketing Systems," Journal of Marketing Research, 13 (February), 12-24.
(1976b), "Channel Domination and Countervailing Power in Distributive Channels," Journal of Marketing Research, 13 (August) 25-62.
(1977), "Channel Environment and Channel Leader- ship," Journal of Marketing Research, 14 (February), 69-76.
(1978), "Selection of an Effective Channel Control Mix," Journal of Marketing, 42 (July), 53-8.
Farris, Paul W. and Robert D. Buzzell (1979), "Why Adver- tising and Promotional Costs Vary: Some Cross Sectional Analyses," Journal of Marketing, 43 (Fall), 112-22.
Houston, Michael and Seymour Sudman (1975), "A Meth- odological Assessment of the Use of Key Informants," Social Science Research, 4, 151-64.
Hunt, Shelby and John Nevin (1974), "Power in a Channel of Distribution: Sources and Consequences," Journal of Marketing Research, 11 (May), 186-93.
Joreskog, Karl (1971), "Statistical Analysis of Congeneric Tests," Psychometrika, 36, 109-33.
(1974), "Analyzing Psychological Data by Structural Analysis of Covariance Matrices," in R. C. Atkinson et al., eds. San Francisco: Freeman, 1-56.
and Dag Sorbom (1978), LISREL: Analysis of Linear Structural Relationships by Method of Maximum Likeli- hood. Chicago: National Educational Resources.
Kenney, David (1976), "An Empirical Application of Con- firmatory Factor Analysis to the Multitrait-Multimethod Matrix," Journal of Experimental Social Psychology, 12, 247-52.
Lawley, D. N. and A. E. Maxwell (1971), Factor Analysis as a Statistical Method. London: Butterworth.
Lawton, Leigh and A. Parasuraman (1980), "The Impact of the Marketing Concept on New Product Planning," Journal of Marketing, 44 (Winter), 19-25.
Lazarsfeld, Paul and Herbert Menzel (1969), "On the Rela- tionship Between Individual and Collective Properties," in Complex Organizations: A Sociological Reader, A. Etzioni, ed. New York: Holt, Rinehart, and Winston, Inc.
Lofland, John (1971), Analyzing Social Settings. New York: John Wiley & Sons, Inc.
Lusch, Robert (1976), "Sources of Power: Their Impact on Intrachannel Conflict," Journal of Marketing Research, 13 (November), 382-90.
McClintock, Charles C., Diane Brannen, and Steven May-
nard-Moody (1979), "Applying the Logic of Sample Sur- veys to Qualitative Case Studies: The Case Cluster Meth- od," Administrative Science Quarterly, 24, 613-29.
McGranahan, David (1976), "Correcting for Informant Bias," American Sociological Review, 4, 176-8.
Molnar, Joseph J. and David I. Rogers (1979), "A Compara- tive model of Inter-Organizational Conflict," A dministra- tive Science Quarterly, 24, 406-25.
Olsson, Ulf (1979), "Maximum Likelihood Estimation of the Polychoric Correlation Coefficient," Psychometrika, 44, 443-59.
Patchen, Marvin (1963), "Alternative Questionnaire Ap- proaches to the Measurement of Influence in Organiza- tions," American Journal of Sociology, 69, 41-52.
Pennings, Johannes (1973), "Measures of Organizational Structure: A Methodological Note," American Journal of Sociology, 79, 686-704.
Pfeffer, Jeffrey and Gerald Salancik (1978), The External Control of Organizations: A Resource Dependence Per- spective. New York: Harper and Row.
Phillips, Lynn W. (1980), "On Studying Collective Behavior: Methodological Issues in the Use of Key Informants," unpublished Ph.D. thesis, Northwestern University.
and Richard P. Bagozzi (1981), "On Measuring Organizational Properties," working paper, Stanford Uni- versity, Graduate School of Business.
Provan, Keith, Janice Beyer, and Carlos Krytbosch (1980), "Environmental Linkages and Power in Resource-Depen- dence Relations Between Organizations," Administrative Science Quarterly, 25, 200-25.
Rosenberg, Larry and Louis W. Stern (1971), "Conflict Measurement in the Distribution Channel," Journal of Marketing Research, 8 (November), 437-42.
Schoeffler, Sidney, Robert D. Buzzell, and Donald F. Heany (1974), "Impact of Strategic Planning on Profit Perfor- mance," Harvard Business Review, 52 (March-April), 137-45.
Seidler, John (1974), "On Using Informants: A Technique for Collecting Quantitative Data and Controlling for Mea- surement Error in Organization Analysis," American Sociological Review, 39, 816-31.
Silk, Alvin and Manohar Kalwani (1980), "Measuring In- fluence in Organizational Purchase Decisions," working paper, Massachusetts Institute of Technology.
Spekman, Robert (1977), "A Contingency Approach to Power Relationships Within the Industrial Buying Task Group," unpublished Ph.D. thesis, Northwestern Univer- sity.
Stern, Louis W. and Adel El-Ansary (1977), Marketing Channels. Englewood Cliffs, New Jersey: Prentice Hall, Inc.
and Torger Reve (1980), "Distribution Channels as Political Economies: A Framework for Comparative Analysis," Journal of Marketing, 44 (Summer) 52-64.
Webb, Eugene J. and Karl Weick (1979), "Unobtrusive Measures in Organization Theory: A Reminder," Admin- istrative Science Quarterly, 24, 650-9.
Webster, Frederick and Yoram Wind (1972), Organization Buying Behavior. Englewood Cliffs, New Jersey: Prentice Hall, Inc.
Werts, C., Robert Linn, and Karl Joreskog (1974), "Inter- class Reliability Estimates: Testing Structural Assump- tions," Educational and Psychological Measurement, 34, 25-33.
415