arctic ozone loss in siberia in 2011 and 2012
TRANSCRIPT

AMTD6, 2955–2978, 2013
Arctic ozone loss inSiberia in 2011 and
2012
V. Dorokhov et al.
Title Page
Abstract Introduction
Conclusions References
Tables Figures
J I
J I
Back Close
Full Screen / Esc
Printer-friendly Version
Interactive Discussion
Discussion
Paper
|D
iscussionP
aper|
Discussion
Paper
|D
iscussionP
aper|
Atmos. Meas. Tech. Discuss., 6, 2955–2978, 2013www.atmos-meas-tech-discuss.net/6/2955/2013/doi:10.5194/amtd-6-2955-2013© Author(s) 2013. CC Attribution 3.0 License.
EGU Journal Logos (RGB)
Advances in Geosciences
Open A
ccess
Natural Hazards and Earth System
Sciences
Open A
ccess
Annales Geophysicae
Open A
ccess
Nonlinear Processes in Geophysics
Open A
ccess
Atmospheric Chemistry
and Physics
Open A
ccess
Atmospheric Chemistry
and Physics
Open A
ccess
Discussions
Atmospheric Measurement
Techniques
Open A
ccess
Atmospheric Measurement
Techniques
Open A
ccess
Discussions
Biogeosciences
Open A
ccess
Open A
ccess
BiogeosciencesDiscussions
Climate of the Past
Open A
ccess
Open A
ccess
Climate of the Past
Discussions
Earth System Dynamics
Open A
ccess
Open A
ccess
Earth System Dynamics
Discussions
GeoscientificInstrumentation
Methods andData Systems
Open A
ccess
GeoscientificInstrumentation
Methods andData Systems
Open A
ccess
Discussions
GeoscientificModel Development
Open A
ccess
Open A
ccess
GeoscientificModel Development
Discussions
Hydrology and Earth System
SciencesO
pen Access
Hydrology and Earth System
Sciences
Open A
ccess
Discussions
Ocean Science
Open A
ccess
Open A
ccess
Ocean ScienceDiscussions
Solid Earth
Open A
ccess
Open A
ccess
Solid EarthDiscussions
The Cryosphere
Open A
ccess
Open A
ccess
The CryosphereDiscussions
Natural Hazards and Earth System
Sciences
Open A
ccess
Discussions
This discussion paper is/has been under review for the journal Atmospheric MeasurementTechniques (AMT). Please refer to the corresponding final paper in AMT if available.
Arctic ozone loss in Siberiain 2011 and 2012V. Dorokhov1, N. Tsvetkova1, V. Yushkov1, H. Nakajima2, G. Ivlev3, A. Makshtas4,N. Tereb5, F. Goutail6, A. Pazmino6, and J.-P. Pommereau6
1Central Aerological Observatory, Moscow, Russia2National Institute for Environmental Studies, Tsukuba, Japan3V. E. Zuev Institute of Atmospheric Optics, Tomsk, Russia4Arctic and Antarctic Research Institute, St. Petersburg, Russia5Institute of Experimental Meteorology, Obninsk, Russia6LATMOS, CNRS-Universite de Versailles St Quentin, Guyancourt, France
Received: 8 February 2013 – Accepted: 12 March 2013 – Published: 22 March 2013
Correspondence to: H. Nakajima ([email protected])
Published by Copernicus Publications on behalf of the European Geosciences Union.
2955

AMTD6, 2955–2978, 2013
Arctic ozone loss inSiberia in 2011 and
2012
V. Dorokhov et al.
Title Page
Abstract Introduction
Conclusions References
Tables Figures
J I
J I
Back Close
Full Screen / Esc
Printer-friendly Version
Interactive Discussion
Discussion
Paper
|D
iscussionP
aper|
Discussion
Paper
|D
iscussionP
aper|
Abstract
The atmospheric ozone plays an important role in understanding of the processesoccurring in the atmosphere and changes in the climate. Total ozone observationsin Siberia were performed by Brewer MKIV No. 049 spectrophotometer in Tomsk,Western Siberia and SAOZ UV-Vis spectrometers deployed along the Arctic Circle in5
Salekhard aerological station since 1998 and Zhigansk aerological station in EasternSiberia since 1991. We also use 2Z-ECC ozonesondes for ozone profile observationsin winter–spring period at the Salekhard aerological station at the in Western Siberiaand ECC-6A sondes at the drifting North Pole station NP-38 in the Central Arctic area.During the winter–spring season in 2011, Arctic ozone in the 19–21 km altitude region10
was observed to be more than 70 % less that typical values. In the winter–spring of2012, on the other hand, Arctic conditions were overall much warmer than in 2011, andno evidence of significant ozone loss was seen above the Asiatic regions of RussianFederation.
The aim of the paper is to describe which and where these measurements were car-15
ried out and illustrate their performances by some examples of ozone data measured inWestern and Eastern Siberia, Russia such as that which occurred in the winter–springseason of 2011.
1 Introduction
Monitoring and evaluations of the ozone layer are carried out using Brewer MKII spec-20
trophotometer (Dorokhov, 1990; Kerr et al., 1990; Dorokhov et al., 1995; Nerushevand Tereb, 2003), Brewer MKIV spectrophotometer (Belan et al., 2008, 2011), SAOZspectrometer (Pommereau and Goutail, 1988; Goutail et al., 1994, 2005; Hendricket al., 2011), ozonesonde (Rex et al., 1997, 2006; Sugita et al., 2006; Yushkov et al.,2002; Tsvetkova et al., 2002, 2007), filter M-124 ozonometer (Bazhenov and Burlakov,25
2011), and satellite instruments. For ozone monitoring in Russia we are using Brewer
2956
AMTD6, 2955–2978, 2013
Arctic ozone loss inSiberia in 2011 and
2012
V. Dorokhov et al.
Title Page
Abstract Introduction
Conclusions References
Tables Figures
J I
J I
Back Close
Full Screen / Esc
Printer-friendly Version
Interactive Discussion
Discussion
Paper
|D
iscussionP
aper|
Discussion
Paper
|D
iscussionP
aper|
spectrophotometers for total ozone observations at Kislovodsk (43.7◦ N, 42.7◦ E), Ob-ninsk (55.1◦ N, 36.6◦ N) and Tomsk (56.5◦ N, 85.1◦ E). Total ozone and NO2 measure-ments from SAOZ UV-Vis spectrometers are carried out at the Salekhard aerologicalstation (66.5◦ N, 66.7◦ E) in the Western Siberia and Zhigansk aerological station (66.8,123.4) in Eastern Siberia. Ozone profile measurements are carried out at Salekhard5
aerological station and NP-38 station in 2011. Salekhard is currently the only place forregular vertical ozone profile observations in winter–spring conditions in Russian Fed-eration. The map of the Brewer, SAOZ and ozonesonde stations in Russia in 2012 isshown in Fig. 1.
2 The discovery10
2.1 Brewer ozone spectrophotometer
The Brewer ozone spectrophotometer was developed in the 1970s and introduced intothe global network in 1982 to measure total ozone in the atmosphere. The Brewerinstrument derives total column ozone from UV measurements using two operationalmodes: observing either direct sunlight (DS) or zenith sky (ZS) scattered sunlight. The15
purpose of the spectrometer optical subassembly is to accept light through the en-trance slit and disperse it into a high-quality spectrum along the exit-slit focal plane.The spectrometer is a modified Ebert type with focal length 16 cm, and aperture ratiof / 6. Six exit slits are positioned along the exit focal plane at the ozone or NO2 operat-ing wavelengths 303.2 nm (302.1 for mercury wavelength calibration), 306.3/431.4 nm,20
310.1/437.3 nm, 313.5/442.8 nm, 316.8/448.1 nm and 320.1/453.2 nm with 0.6/0.9 nmresolution. Wavelength is adjusted by rotating the grating with a stepper motor whichdrives a micrometer acting on a lever arm. The wavelength calibration procedure iscapable of measuring the wavelength setting with a precision of 0.0001 nm, and ofcontrolling the wavelength setting to 0.006 nm in the UV region. At the exit of the spec-25
trometer is a cylindrical mask which exposes only one wavelength slit at a time. The
2957
AMTD6, 2955–2978, 2013
Arctic ozone loss inSiberia in 2011 and
2012
V. Dorokhov et al.
Title Page
Abstract Introduction
Conclusions References
Tables Figures
J I
J I
Back Close
Full Screen / Esc
Printer-friendly Version
Interactive Discussion
Discussion
Paper
|D
iscussionP
aper|
Discussion
Paper
|D
iscussionP
aper|
mask is positioned by a stepper motor which cycles through all five operating wave-lengths, approximately once per second.
The Brewer total ozone measurements at Yakutsk (62.0◦ N, 129.7◦ E), EasternSiberia have been conducted with ground-based Brewer spectrophotometer since1992. The data of total ozone observations at Yakutsk station during winter–spring5
periods in 1992–2006 provided many days of total ozone observations inside and out-side the polar vortex and allowed an investigation of the long-term variability of the totalozone in different seasons. The calibrations in Yakutsk (1996, 2001, 2005) using travel-ing reference instrument Brewer MKII No 017 have provided the Brewer MKII No 045 tobe a stable and well-maintained spectrophotometer. Continuing calibrating the Brewer10
spectrophotometers using the traveling standard will help maintaining the high-qualitytotal ozone observations with the Brewer network in Russia.
The Brewer MKII No 043 spectrophotometer is installed at Kislovodsk high-mountainstation of Obukhov Institute of Atmospheric physics Russia Academy of Science(KHMS) and is located at 2070 meters above sea level in the Northern Caucasus,15
Russia. Brewer MKII No 044 spectrophotometer is used for total ozone measure-ments at the Institute of Experimental Meteorology (IEM) at Obninsk city near Moscow.Total ozone observations by the Brewer MKIV No 049 spectrophotometer at Tomsk,Central Siberia, have been conducted since 2003. All Russian Brewer instruments in2012 were calibrated by International Ozone Services Incorporated (IOS), Toronto, On-20
tario, Canada using traveling Brewer standard spectrophotometer in IEM, Obninsk, inSeptember 2012. IOS provides worldwide ozone and UV calibration services to cus-tomers with Brewer Ozone Spectrophotometer instruments.
2.2 SAOZ UV-Vis spectrometer
Ozone measurements in the visible Chappuis bands between 450–600 nm for the first25
time allow the continuous monitoring of the species throughout the year at the latitudeof the polar circle, in all weather conditions. The first paper about SAOZ observations inthe Arctic area was published by Pommereau and Goutail in (1988). SAOZ (Systeme
2958
AMTD6, 2955–2978, 2013
Arctic ozone loss inSiberia in 2011 and
2012
V. Dorokhov et al.
Title Page
Abstract Introduction
Conclusions References
Tables Figures
J I
J I
Back Close
Full Screen / Esc
Printer-friendly Version
Interactive Discussion
Discussion
Paper
|D
iscussionP
aper|
Discussion
Paper
|D
iscussionP
aper|
d’Analyse par Observation Zenitale) is a UV-visible diode array spectrometer devel-oped at the Service d’Aeronomie, CNRS, France in the late 80s, after the discovery ofthe ozone hole by Farman et al. (1985), for monitoring stratospheric ozone (O3) andnitrogen dioxide (NO2). The SAOZ is manufactured at the Laboratory for AtmosphericResearch (LATMOS) for measuring total ozone, nitrogen dioxide and some other atmo-5
spheric trace gases (BrO, O4). The spectrometer uses the technique of measurementsin the ultraviolet and visible wavelengths of sun in the registration of the zenith sky.
The SAOZ consists of a commercial Jobin-Yvon CP200 flat field spectrometerequipped with a holographic 360 grmm−1 grating and a Hamamatsu 1024 diode ar-ray uncooled detector, with a 50 micron entrance slit allowing an average resolution on10
the order of 1 nm in the range 300–600 nm. The spectrometer is housed in a dust- andwater-proof container with a quartz window to enable measurements from the zenithsky. The instrument is driven by a PC (with Windows 95 operating system) and recordsand analysis the spectra in real time. Measurements are performed from sunrise tosunset, until the Solar Zenith Angle (SZA) reaches 94. The exposure time is adjusted15
automatically between 0.1 s to 60 s in order to optimize the signal, and the spectra areadded to memory during a 60 s duty cycle. The dark current is measured each timethe duration of exposure changes, and is then subtracted. Averages of ozone and NO2morning and evening vertical columns are measured between 87 and 91 SZA. SAOZperformance has been continuously evaluated during all NDACC UV intercomparison20
campaigns. The wavelength range of the SAOZ instrument is in the Chappuis band ofozone absorption, with a spectral resolution of 1 nm for version V-1024. Measurementaccuracy is 6 % for total ozone and 10 % for nitrogen dioxide. Data for the atmosphericcontent of O3 and NO2 measured by SAOZ spectrometers are available at the WorldSAOZ database, since 1988 from Dumont d’Urville station in the Southern Hemisphere,25
since 1989 from the Sodankyla observatory in Finland, and from additional SAOZ sta-tions in 1990–1991. The first Asiatic SAOZ station started operation in December of1991 at Zhigansk aerological station, Eastern Siberia. A SAOZ spectrometer has beenoperating at Salekhard aerological station, Western Siberia since 1998.
2959
AMTD6, 2955–2978, 2013
Arctic ozone loss inSiberia in 2011 and
2012
V. Dorokhov et al.
Title Page
Abstract Introduction
Conclusions References
Tables Figures
J I
J I
Back Close
Full Screen / Esc
Printer-friendly Version
Interactive Discussion
Discussion
Paper
|D
iscussionP
aper|
Discussion
Paper
|D
iscussionP
aper|
2.3 ECC oznesonde
The Electrochemical Concentration Cell (ECC) ozonesonde was originally built by Wal-ter Komhyr in 1969. The ozonesonde is a lightweight, balloon-borne instrument that ismated to a conventional meteorological radiosonde. As the balloon carrying the instru-ment package ascends through the atmosphere, and the ozonesonde telemeters to5
a ground receiving station information on ozone and standard meteorological quanti-ties such as pressure, temperature and humidity. The balloon will ascend to altitudes ofabout 35 km before it bursts. The heart of the ozonesonde is an electrochemical con-centration cell (ECC) that senses ozone as is reacts with a dilute solution of potassiumiodide to produce a weak electrical current proportional to the ozone concentration of10
the sampled air.The first ozonesonde vertical profile measurements in Russia were started at Heiss
Island, Franz Josef Land in the Central Arctic in 1989 as part of joint project betweenthe Central Aerological Observatory and University of Wyoming. This activity took placein 1989–1992. Afterwards, ozone profile observations were carried out at the Yakutsk15
aerological station (62.0◦ N, 129.7◦ E) from December 1994 until 2006, Rylsk (51.6◦ N,34.7◦ E) in 1997–1998 and the Salekhard aerological station (66.5◦ N, 66.7◦ E) sinceJanuary 1997. At the present time, the Salekhard aerological station is the only placefor ozone profile observations in Russia. Vertical ozone profile observations in Yakutsk,Eastern Siberia were carried out in 1995–2002 under a joint ozone project between20
NIES, Japan and CAO, Russia. This project was closed in 2002. In 2003–2005 verticalozone profile measurements were made at the Yakutsk aerological station as part of theEU funded project Quantitative understanding of ozone losses by bipolar investigations(QUOBI). This station was closed in 2006 and ozone profile observations in the Arcticregions of Russia are now possible at Salekhard, Western Siberia, and NP-38 drifting25
station (2011), Central Arctic.
2960
AMTD6, 2955–2978, 2013
Arctic ozone loss inSiberia in 2011 and
2012
V. Dorokhov et al.
Title Page
Abstract Introduction
Conclusions References
Tables Figures
J I
J I
Back Close
Full Screen / Esc
Printer-friendly Version
Interactive Discussion
Discussion
Paper
|D
iscussionP
aper|
Discussion
Paper
|D
iscussionP
aper|
3 Analysis
3.1 Brewer total ozone observations in Central Siberia
Total ozone in the middle of March 2011 was less than usual about 130–150 Dob-son Unit (DU), and the negative ozone anomaly has been observed even in the firstdecade of April. Such a large and long listed Arctic ozone loss was possible due to the5
significant denitrification in the Arctic stratosphere at abnormally low stratospheric tem-perature and formation of polar stratospheric clouds (Manney et al., 2011; Balis et al.,2011). The level of total ozone over the territory of the Russian Federation in 2011 wassignificantly lower than that observed in the late 1970s, but above the minimum in thelate 1990s. Spring time anomaly in high latitudes has been one of the most significant10
ozone anomalies in the Northern Hemisphere for the time more than half a centuryof observations. This is a record amount of ozone loss over the entire period of ob-servations in the Arctic. The previous record was observed in winter–spring seasonof 2004/2005 and was 116 DU. The Arctic ozone loss 2011 was well observed by theBrewer, SAOZ and 2Z-ECC ozonesonde network at the polar latitudes in the Russian15
Federation.The Brewer spectrophotometers were originally designed for total ozone measure-
ments. In 2011 we have only one Brewer spectrophotometer in the Asiatic part ofRussia, which was nearby the Arctic area where the Arctic ozone losses have beenobserved. The low total ozone was measured in Tomsk by Brewer MKIV No 049 spec-20
trophotometer between in the first two weeks of April. In March–April 2011 a very lowtotal ozone observations were carried out at Brewer stations in Scandinavia. The lowozone values were registrated in Finland at Sodankula station. The Sodankyla (67.4◦ N,26.6◦ E) total ozone measurements have been performed with a Brewer spectropho-tometer since 1988. On 9 March 2011, the Brewer MKII No 037 instrument at the north-25
ern Polar Circle measured as low as 242 DU. The Brewer MKII spectrophotometer inAndøya, Norway (69.3◦ N, 16.0◦ E), operated by NILU and the University of Tromsø,observed the same low total ozone values in in middle of March. Unusually low ozone
2961
AMTD6, 2955–2978, 2013
Arctic ozone loss inSiberia in 2011 and
2012
V. Dorokhov et al.
Title Page
Abstract Introduction
Conclusions References
Tables Figures
J I
J I
Back Close
Full Screen / Esc
Printer-friendly Version
Interactive Discussion
Discussion
Paper
|D
iscussionP
aper|
Discussion
Paper
|D
iscussionP
aper|
columns were measured from mid-March to first decade of April 2011 at all Arctic sta-tions compared to the previous years. The low total ozone 259 DU was measured atthe Sammit station (72.6◦ N, 38.5◦ W) in Greenland on 28 March 2011. The Brewerspectrophotometer is used in the Canadian stratospheric ozone and UV monitoringprogram, with 12 sites established in Canada that routinely collect and process data on5
a daily basis. The instruments measure total ozone and spectral UV irradiation (290–325 nm) every 10–20 min during the daytime. The Brewer spectrophotometers in theNorthern Canada measured the total ozone values which were 20–25 % below theclimatic norm at the end of February to mid-March 2011.
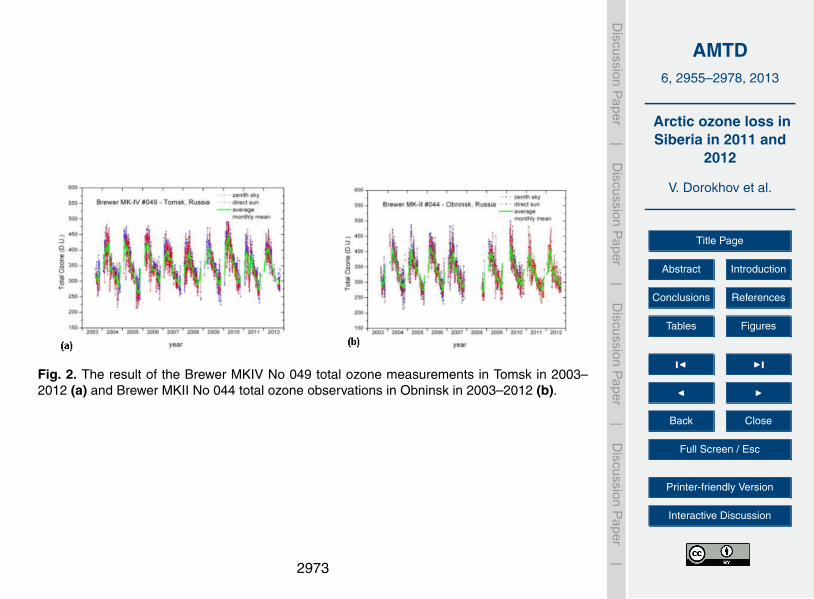
The result of the Brewer MKIV No 049 total ozone measurements in Tomsk in 2003–10
2012 are presented in Fig. 2. The result of the Brewer total ozone measurements inObninsk and Tomsk in 2011 are shown in Fig. 3. The Brewer MKIV No 049 spectropho-tometer at Tomsk station in Central Siberia is the best instrument for good quality andhigh precision ground-based total ozone measurements in the Asiatic part of Rus-sia. The Brewer Data Management System (BDMS) is located with the World Ozone15
and Ultraviolet Radiation Data Centre (WOUDC) and both are located in Toronto andoperated by Environment Canada staff. The BDMS acts as the permanent archive ofCanadian Brewer data. Although the main focus of the BDMS initially was for Canadiandata only, this system is now available to the international Brewer community. The dataof the Brewer spectrophotometer total ozone measurements in Russia are available20
from the WOUDC database http://www.woudc.org/data e.html.
3.2 SAOZ network in Russia
An unprecedented depletion of Earth’s protective ozone layer above the Arctic in the2010/2011 Arctic winter and spring has been documented (Manney et al., 2011),caused by an unusually prolonged period of low temperatures in the stratosphere. The25
unusually large Arctic ozone loss in 2011 appears to resulting from an extreme mete-orological event and there is no indication of possible strengthening related to climatechange. Unusually low ozone columns were measured from mid-March to late March
2962
AMTD6, 2955–2978, 2013
Arctic ozone loss inSiberia in 2011 and
2012
V. Dorokhov et al.
Title Page
Abstract Introduction
Conclusions References
Tables Figures
J I
J I
Back Close
Full Screen / Esc
Printer-friendly Version
Interactive Discussion
Discussion
Paper
|D
iscussionP
aper|
Discussion
Paper
|D
iscussionP
aper|
and first decade of April 2011 compared to the previous years (Pommereau et al.,2012).
In collaboration with the French CNRS within the frame of the Network for the De-tection of Atmospheric Composition Change (NDACC), two SAOZ instruments are op-erated at the polar circle where those instruments allow year round observations: in5
Zhigansk in Eastern Siberia operating since 1991 and in Salekhard in Western Siberiasince 1998. Altogether these instruments cover a vast polar region in the NorthernHemisphere allowing the monitoring of amplitude of Arctic ozone destruction each year.As an example, those instruments significantly contributed to the quantification of theunprecedented loss in 2011 caused by a combination of long lasting denoxified vor-10
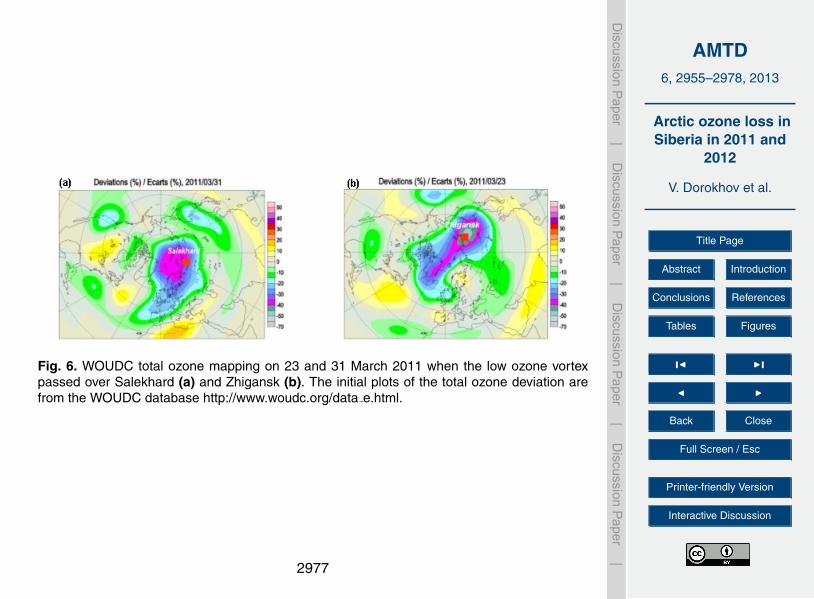
tex resulting in a record daily loss rate never seen before in the Arctic. Indeed as onemay see in the WOUDC ozone mapping, the ozone depleted polar vortex passed overSalekhard and Zhigansk in late March–early April 2011 where losses of about 40 %were observed above the two stations located at the northern Polar Circle.
The total ozone reduction in the vortex conditions was 38±3 % or 165 DU in 201115
with the loss rate 0.2 % per day until mid-February and 0.8 % per day between 20February and 20 March 2011. The total ozone was as low as 235 DU at Zhigansk on23 March 2011 and 242 DU in Salekhard on 31 March 2011. The SAOZ spectrometerobserved low total ozone values 250–270 DU in Salekhard during the first week ofApril 2011 when the polar vortex was still located in this area. The SAOZ instrument at20
Zhigansk station did not measure low total ozone at this time. The SAOZ low total ozonelevels in winter–spring period of 2011 are well documented in Fig. 4 for Salekhardand Zhigansk. The total ozone reduction in the vortex conditions in 2012 was about14 %±4 % or 60 DU and the loss rate 0.35 % per day between end of December andearly February 2012.25
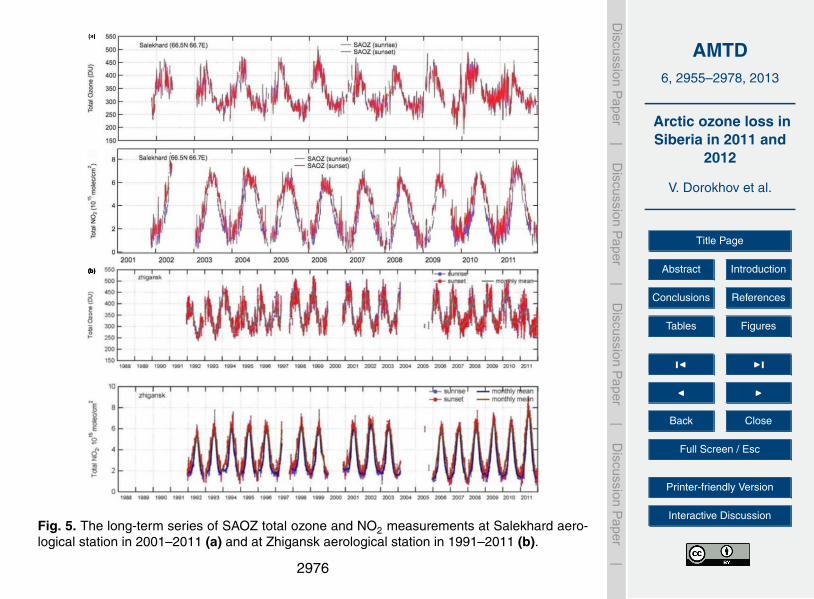
The SAOZ long-term total ozone and NO2 dataset at Zhigansk aerological station in1991–2011 and at Salekhard aerological station in 2001–2011 are presented in Fig. 5.The total ozone loss for some days in January and March 2011 are shown in Fig. 6for Salekhard and Zhigansk stations, when the polar vortex was located above the
2963

AMTD6, 2955–2978, 2013
Arctic ozone loss inSiberia in 2011 and
2012
V. Dorokhov et al.
Title Page
Abstract Introduction
Conclusions References
Tables Figures
J I
J I
Back Close
Full Screen / Esc
Printer-friendly Version
Interactive Discussion
Discussion
Paper
|D
iscussionP
aper|
Discussion
Paper
|D
iscussionP
aper|
stations. The measurements of total ozone and NO2 by SAOZ instruments in Russia,providing data all year round, cover a vast polar regions in the Northern Hemisphere.The data of total ozone and NO2 observations by the SAOZ UV-Vis spectrometersin Russia are submitted and presented at the World SAOZ database in France http://saoz.obs.uvsq.fr/SAOZ-RT.html and at the NDACC database http://www.ndsc.ncep.5
noaa.gov/.
3.3 Ozonesounding in Siberia
At the Yakutsk aerological stations coordinated ozonesonde flights were started inlate 1994. At the same time coordinated measurements of vertical ozone distributionwere made by European scientists at 30 stations of the Northern Hemisphere in the10
frame of international program on investigation of mechanisms of ozone layer deple-tion. Ozonesonde flights were performed in a manner to monitor the changes of ozoneconcentration in the same air masses. For this purpose the local time and date ofozonesonde launches were determined using the daily forecasts of air mass trajec-tories. Using the data of balloon ozonesounding at Yakutsk quantitative estimation of15
ozone depletion in the lower stratosphere were made for spring months of 1995–1997inside and outside the polar vortex. Comparison of given estimations of daily ozonevariations with theoretical rates of photochemical ozone reduction make it possible toconclude about chemical ozone depletion mechanism during spring months inside thepolar vortex at the territory of Eastern Siberia.20
It is well established that extensive depletion of ozone, initiated by heterogeneousreactions on polar stratospheric clouds can occur in both the Arctic and Antarctic lowerstratosphere. Moreover, it has been shown that ozone loss rates in the Arctic regionin recent years reached values comparable to those over the Antarctic. But until nowthe accumulated ozone losses over the Arctic have been much smaller than those25
over the Antarctic, mainly because the period of Arctic ozone loss has not persistedfar into springtime. If the apparent cooling trend in the Arctic lower stratosphere isreal, more dramatic ozone losses may occur in the future (Manney et al., 1994, 1995;
2964
AMTD6, 2955–2978, 2013
Arctic ozone loss inSiberia in 2011 and
2012
V. Dorokhov et al.
Title Page
Abstract Introduction
Conclusions References
Tables Figures
J I
J I
Back Close
Full Screen / Esc
Printer-friendly Version
Interactive Discussion
Discussion
Paper
|D
iscussionP
aper|
Discussion
Paper
|D
iscussionP
aper|
von der Gathe et al., 1995; Rex et al., 1997; Tsvetkova et al., 1997; Solomon, 1999).The model calculations of the rate of chemical ozone loss in the lower stratosphereusing the chemical transport model have proved to be underestimated relative to theexperimental observation in Eastern Siberia within the zone of action of the circum-polar stratospheric vortex. This discrepancy may have resulted from the fact that the5
process of intensive ozone depletion during the spring months due to the formation ofpolar stratospheric clouds of orographic nature not only over Scandinavian mountains,but also over the Urals, has not been taken into account in the model concerned. Toverify this hypothesis, balloon-borne measurements were carried out of ozone verticaldistribution at Salekhard station located on the lee side at air masses transport in the10
atmosphere with westerly winds. The measurements at Yakutsk and Salekhard stationswere performed during 1996/1997 season, i.e. from the beginning of the formation ofthe polar stratospheric cyclone and during the period of its intensive development anddestruction in winter and spring.
The measurements of the vertical ozone distribution were so coordinated with15
balloon-borne measurements conducted at other European stations as to help traceozone changes within the same air masses of the Northern Hemisphere. Balloon-borne ozone data and weather data on temperature and potential vorticity fields havebeen analyzed to show that during the spring months of 1998 and 1999 in contrastto the same period of 1995 and 1996, no intense processes of the chemical loss of20
stratospheric ozone had been observed over the polar latitudes of Western and East-ern Siberia. Such an interannual variability of ozone amount in the lower stratosphere,within the zone of action of the northern circumpolar vortex, is due to the weatherconditions of its formation.
During the winter–spring season of 2011 the observed ozone decrease exceeded25
70 % within the 19–21 km altitude range. During the winter–spring season of 2012 wehave seen usual Arctic conditions and no significant ozone loss above Salekhard sta-tion. Ozonesonde data from the Salekhard station during the Arctic winter–spring sea-son of 2010/2011 and 2011/2012 are available from the NDACC database. Chemical
2965
AMTD6, 2955–2978, 2013
Arctic ozone loss inSiberia in 2011 and
2012
V. Dorokhov et al.
Title Page
Abstract Introduction
Conclusions References
Tables Figures
J I
J I
Back Close
Full Screen / Esc
Printer-friendly Version
Interactive Discussion
Discussion
Paper
|D
iscussionP
aper|
Discussion
Paper
|D
iscussionP
aper|
ozone destruction occurs over the Arctic and Antarctic regions in local winter–spring.In the Antarctic, essentially complete removal of lower-stratospheric ozone currentlyresults in an ozone hole every year, whereas in the Arctic, ozone loss is highly variablefrom year to year and has until now been much more limited. We study the Arctic ozonelosses using the results of the ozonesonde observations in the Arctic during the Match5
campaigns in 1994–2012. The two main aims of Match campaigns are to measure thechemical ozone loss in polar regions, and to check our understanding of the underlyingprocesses. The idea of Match campaign is to probe, i.e. to determine the ozone contentof, a lot of air parcels twice during their way through the atmosphere. This is achievedby coordinating the soundings roughly in the following way. The trajectories (transport10
paths) of air masses, which had been measured by ozonesondes previously, are an-alyzed and forecasted by meteorologists at the Freie Universitat Berlin (FU Berlin).These trajectories are checked for cases when such an air mass reaches the vicinity ofone of the participating measuring sites (ozonesonde station) within 10 days. The staffat the ozonesonde station gets informed and is asked to launch an ozonesonde in order15
to examine the same air mass for a second time. A decrease in the ozone concentra-tion within the time period of the two sonde flights can then be attributed to chemicalozone depletion. Due to the great number of sonde pairs, statistically significant ozoneloss rates can be determined.
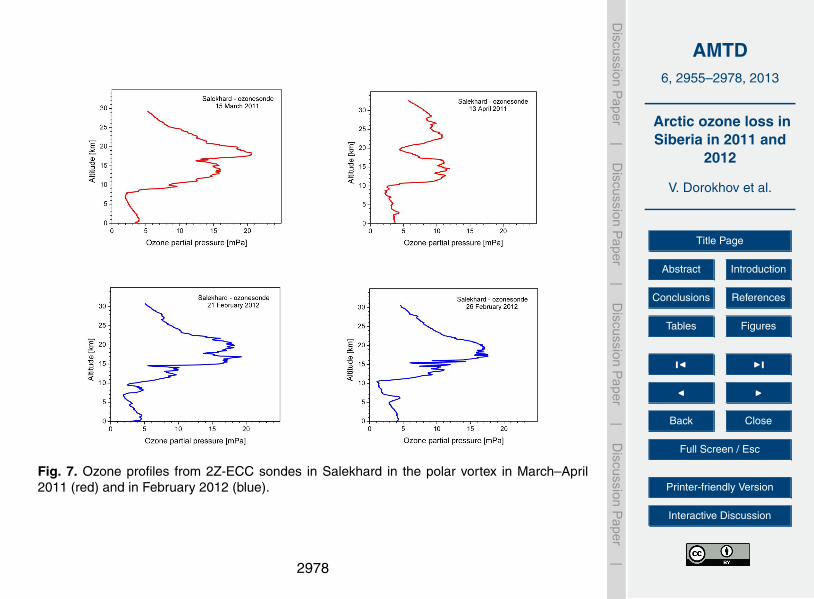
Some results of ozone sounding at the Salekhard aerological station in polar vor-20
tex conditions in March–April 2011 and February 2012 are shown in Fig. 7. The total150 ozonesondes were launched at Yakutsk aerological station in Eastern Siberia dur-ing the winter–spring season of 1994–2006 and 250 ozonesondes, version 2Z-ECC,were used for vertical ozone profile observations at the Salekhard aerological stationin Western Siberia, Russia. The data of the Salekhard ozonesonde measurements in25
2005–2012 are available from the NDACC database ftp://ftp.cpc.ncep.noaa.gov/ndacc/station/salekhar/ames/o3sonde/.
2966

AMTD6, 2955–2978, 2013
Arctic ozone loss inSiberia in 2011 and
2012
V. Dorokhov et al.
Title Page
Abstract Introduction
Conclusions References
Tables Figures
J I
J I
Back Close
Full Screen / Esc
Printer-friendly Version
Interactive Discussion
Discussion
Paper
|D
iscussionP
aper|
Discussion
Paper
|D
iscussionP
aper|
4 Conclusions
Brewer spectrophotometers detected anomalously low total ozone at Tomsk and Ob-ninsk stations in March–April 2011. The January–March 2012 total ozone observationsfrom these Brewer spectrophotometers in Russia did not show any episodes of unusu-ally low total ozone, nor did those from the Brewer station in Kislovodsk in contrast5
with measurements from the SAOZ spectrometers at the NDACC stations in Salekhard(40 % in March) and Zhigansk (up to 40 % on some days in March and April 2011). Themeasurements of total ozone and NO2 by SAOZ instruments in Russia provide dataall year round. The unprecedented depletion of Earth’s protective ozone layer abovethe Arctic in winter and spring 2011, caused by an unusually prolonged period of low10
temperatures in the stratosphere, is reflected in the measurements presented here. InJanuary–March 2012, SAOZ observations in Russia did not show any evidence of un-usually low Arctic ozone. During the winter–spring season in 2011, Arctic ozone in the19–21 km altitude region was observed to be more than 70 % less that typical values.In the winter–spring of 2012, on the other hand, Arctic conditions were overall much15
warmer than in 2011, and no evidence of significant ozone loss was seen above theSalekhard area.
Acknowledgements. The authors thank Tatiana Popova, Vladimir Balashov from Salekhardaerological station, Western Siberia for SAOZ and ozonesonde operation in 1997–2012. Wethank Vasily Lyulkin from Zhigansk aerological station, Eastern Siberia for SAOZ operation20
in 2005–2012. This work was partly supported by the French CNES and CNRS/INSU withinthe NDACC/OVSQ programme and by Roshydromet, Russia. We thank the staff from DropletMeasurement Technologies, Boulder, Colorado, USA for discussions and help with new ECCozonesonde 2Z-V7 activation. We also thank Gloria L. Manney from NorthWest Research As-sociates, NM, USA and Peter von der Gathen from Alfred Wegener Institute for Polar and25
Marine Research, Potsdam, Germany for discussions and help during the initial phase of paperpreparation. This project was partly supported by National Institute for Environmental Studies,Tsukuba, Japan.
2967
AMTD6, 2955–2978, 2013
Arctic ozone loss inSiberia in 2011 and
2012
V. Dorokhov et al.
Title Page
Abstract Introduction
Conclusions References
Tables Figures
J I
J I
Back Close
Full Screen / Esc
Printer-friendly Version
Interactive Discussion
Discussion
Paper
|D
iscussionP
aper|
Discussion
Paper
|D
iscussionP
aper|
References
Balis, D., Isaksen, I. S. A., Zerefos, C., Zyrichidou, I., Eleftheratos, K., Tourpali, K., Bojkov, R.,Rognerud, B., Stordal, F., Søvde, O. A., and Orsolini, Y.: Observed and modelled recordozone decline over the Arctic during winter/spring 2011, Geophys. Res. Lett., 38, L23801,doi:10.1029/2011GL049259, 2011.5
Bazhenov, O. E. and Burlakov, V. D.: Anomalous decrease of the level of the total ozone contentover Tomsk and northern territory of Russia in March–April 2011, Atmos. Ocean. Opt., 24,915–919, 2011.
Belan, B. D., Ivlev, G. A., and Sklyadneva, T. K.: Variations of UV-B radiation in Tomsk in 2003–2007, Atmos. Ocean. Opt., 21, 535–539, 2008.10
Belan, B. D., Ivlev, G. A., and Sklyadneva, T. K.: Influence of a city on the incoming UV radiationfrom results of many-year monitoring near Tomsk-city, Atmos. Ocean. Opt., 24, 1113–1119,2011.
Dorokhov, V. M.: Observations of the total ozone content inthe arctic over Heiss Island (81◦ N)in winter 1989, Atmos. Ocean. Opt., 3, 89–94, 1990.15
Dorokhov, V. M. and Potapova, T. E.: Observation of total content of atmospheric ozone in highArctic latitudes, Atmos. Ocean. Opt., 8, 451–454, 1995.
Dorokhov, V. M., Dolgii, S. V., Ivanov, Yu. S., and Sitnikova, V. I.: Observation of the total ozonecontent in the atmosphere over the Arctic during the polar night of 1991, Atmos. Ocean. Opt.,4, 601–603, 1991.20
Dorokhov, V. M., Potapova, T. E., Goutail, F., and Pommereau, J.-P.: Studying a negative ozoneanomaly in the East Siberian ozone maximum in winter and spring of 1995, Meteorologiia iGidrologiia, 6, 53–62, 1996.
Goutail, F., Pommereau, J.-P., Sarkissian, A., Kyro, E., and Dorokhov, V.: Total nitro-gen dioxide at the Arctic polar circle since 1990, Geophys. Res. Lett., 21, 1371–1374,25
doi:10.1029/93GL01783, 1994.Goutail, F., Pommereau, J.-P., Lefevre, F., van Roozendael, M., Andersen, S. B., Kastad
Høiskar, B.-A., Dorokhov, V., Kyro, E., Chipperfield, M. P., and Feng, W.: Early unusual ozoneloss during the Arctic winter 2002/2003 compared to other winters, Atmos. Chem. Phys., 5,665–677, doi:10.5194/acp-5-665-2005, 2005.30
Hendrick, F., Pommereau, J.-P., Goutail, F., Evans, R. D., Ionov, D., Pazmino, A., Kyro, E.,Held, G., Eriksen, P., Dorokhov, V., Gil, M., and Van Roozendael, M.: NDACC/SAOZ
2968

AMTD6, 2955–2978, 2013
Arctic ozone loss inSiberia in 2011 and
2012
V. Dorokhov et al.
Title Page
Abstract Introduction
Conclusions References
Tables Figures
J I
J I
Back Close
Full Screen / Esc
Printer-friendly Version
Interactive Discussion
Discussion
Paper
|D
iscussionP
aper|
Discussion
Paper
|D
iscussionP
aper|
UV-visible total ozone measurements: improved retrieval and comparison with correl-ative ground-based and satellite observations, Atmos. Chem. Phys., 11, 5975–5995,doi:10.5194/acp-11-5975-2011, 2011.
Kerr, J. B., McElroy, C. T., Wardle, D. I., and Dorokhov, V.: Measurements of Arctic total ozoneduring the polar winter, Atmos. Ocean, 28, 383–392, doi:10.1080/07055900.1990.9649384,5
1990.Manney, G. L., Froidevaux, L., Waters, J. W., Zurek, R. W., Read, W. G., Elson, L. S.,
Kumer, J. B., Mergenthaler, J. L., Roche, A. E., O’Neill, A., Harwood, R. S., MacKenzie, I.,and Swinbank, R.: Chemical depletion of ozone in the Arctic lower stratosphere during winter1992–1993, Nature, 370, 429–434, doi:10.1038/370429a0, 1994.10
Manney, G. L., Zurek, R. W., Froidevaux, L., and Waters, J. W.: Evidence for Arctic ozonedepletion in late February and early March 1994, Geophys. Res. Lett., 22, 2941–2944,doi:10.1029/95GL02229, 1995.
Manney, G. L., Santee, M. L., Rex, M., Livesey, N. J., Pitts, M. C., Veefkind, P., Nash, E. R.,Wohltmann, I., Lehmann, R., Froidevaux, L., Poole, L. R., Schoeberl, M. R., Haffner, D. P.,15
Davies, J., Dorokhov, V., Gernandt, H., Johnson, B., Kivi, R., Kyro, E., Larsen, N., Levelt, P. F.,Makshtas, A., McElroy, C. T., Nakajima, H., Parrondo, M. C., Tarasick, D. W., von der Ga-then, P., Walker, K. A., and Zinoviev, N. S.: Unprecedented Arctic ozone loss in 2011, Nature,478, 469–475, doi:10.1038/nature10556, 2011.
Nerushev, A. F. and Tereb, N. V.: Comparison of ground-based and satellite measurements of20
surface ultraviolet radiation exposures for the Central European region of Russia, Earth Res.Space, 5, 35–42, 2003.
Pommereau, J. P. and Goutail, F.: O3 and NO2 ground-based measurements by visiblespectrometry during Arctic winter and spring 1988, Geophys. Res. Lett., 15, 891–894,doi:10.1029/GL015i008p00891, 1988.25
Pommereau, J.-P., Goutail, F., Lefevre, F., Pazmino, A., Adams, C., Dorokhov, V., Eriksen, P.,Kivi, R., Stebel, K., Zhao, X., and van Rozendael, M.: Why unprecedented ozone loss in theArctic in 2011? Is it related to climatic change?, Atmos. Chem. Phys. Discuss., 13, 311–343,doi:10.5194/acpd-13-311-2013, 2013.
Rex, M., Harris, N. R. P., von der Gathen, P., Lehmann, R., Braathen, G. O., Reimer, E.,30
Beck, A., Chipperfield, M. P., Alfier, R., Allaart, M., O’Connor, F., Dier, H., Dorokhov, V.,Fast, H., Gil, M., Kyro, E., Litynska, Z., Mikkelsen, I. S., Molyneux, M. G., Nakane, H.,
2969
AMTD6, 2955–2978, 2013
Arctic ozone loss inSiberia in 2011 and
2012
V. Dorokhov et al.
Title Page
Abstract Introduction
Conclusions References
Tables Figures
J I
J I
Back Close
Full Screen / Esc
Printer-friendly Version
Interactive Discussion
Discussion
Paper
|D
iscussionP
aper|
Discussion
Paper
|D
iscussionP
aper|
Notholt, J., Rummukainen, M., Viatte, P., and Wenger, J.: Prolonged stratospheric ozoneloss in the 1995–96 Arctic winter, Nature, 389, 835–838, doi:10.1038/39849, 1997.
Rex, M., Salawitch, R. J., Deckelmann, H., von der Gathen, P., Harris, N. R. P., Chipper-field, M. P., Naujokat, B., Reimer, E., Allaart, M., Andersen, S. B., Bevilacqua, R., Braa-then, G. O., Claude, H., Davies, J., De Backer, H., Dier, H., Dorokhov, V., Fast, H., Gerd-5
ing, M., Hoppel, K., Johnson, B., Kyro, E., Litynska, Z., Moore, D., Nagai, T., Parrondo, M. C.,Risley, D., Skrivankova, P., Stubi, R., Trepte, C., Viatte, P., and Zerefos, C.: Arctic winter2005: implications for stratospheric ozone loss and climate change, Geophys. Res. Lett., 33,L23808, doi:10.1029/2006GL026731, 2006.
Solomon, S.: Stratospheric ozone depletion: a review of concepts and history, Rev. Geophys.,10
37, 275–316, doi:10.1029/1999RG900008, 1999.Sugita, T., Nakajima, H., Yokota, T., Kanzawa, H., Gernandt, H., Herber, A., von der Gathen, P.,
Konig-Langlo, G., Sato, K., Dorokhov, V., Yushkov, V. A., Murayama, Y., Yamamori, M., Godin-Beekmann, S., Goutail, F., Roscoe, H. K., Deshler, T., Yela, M., Taalas, P., Kyro, E., Olt-mans, S. J., Johnson, B. J., Allaart, M., Litynska, Z., Klekociuk, A., Andersen, S. B., Braa-15
then, G. O., De Backer, H., Randall, C. E., Bevilacqua, R. M., Taha, G., Thomason, L. W.,Irie, H., Ejiri, M. K., Saitoh, N., Tanaka, T., Terao, Y., Kobayashi, H., and Sasano, Y.:Ozone profiles in the high-latitude stratosphere and lower mesosphere measured by theImproved Limb Atmospheric Spectrometer (ILAS)-II: comparison with other satellite sensorsand ozonesondes, J. Geophys. Res., 111, D11S02, doi:10.1029/2005JD006439, 2006.20
Tsvetkova, N. D., Yushkov, V. A., Dorokhov, V. M., and Zaitcev, I. G.: Some results of mea-surements of vertical ozone distribution over Yakutsk during the 1995–96, Meteorologiia iGidrologiia, 9, 45–51, 1997.
Tsvetkova, N. D., Nakane, H., Lukyanov, A. N., Yushkov, V. A., Dorokhov, V. M., Zaitsev, I. G.,and Sitnikova, V. I.: Estimation of the winter–spring rates of ozone depletion within the strato-25
spheric Arctic cyclone in Siberia in 1995–2000 from balloon measurements, Izv. Atmos.Ocean. Phy+, 38, 184–192, 2002.
Tsvetkova, N. D., Yushkov, V. A., Lukyanov, A.N, Dorokhov, V. M., and Nakane, H.: Record-breaking chemical destruction of ozone in the Arctic during the winter of 2004/2005, Izv.Atmos. Ocean. Phy+, 43, 592–598, doi:10.1134/S0001433807050076, 2007.30
von der Gathen, P., Rex, M., Harris, N. R. P., Lucic, D., Knudsen, B. M., Braathen, G. O.,Backer, H. D., Fabian, R., Fast, H., Gil, M., Kyro, E., Mikkelsen, I. S., Rummukainen, M.,
2970
AMTD6, 2955–2978, 2013
Arctic ozone loss inSiberia in 2011 and
2012
V. Dorokhov et al.
Title Page
Abstract Introduction
Conclusions References
Tables Figures
J I
J I
Back Close
Full Screen / Esc
Printer-friendly Version
Interactive Discussion
Discussion
Paper
|D
iscussionP
aper|
Discussion
Paper
|D
iscussionP
aper|
Stahelin, J., and Varotsos, C.: Observational evidence for chemical ozone depletion over theArctic in winter 1991–92, Nature, 375, 131–134, doi:10.1038/375131a0, 1995.
Yushkov, V. A., Nakane, H., Tsvetkova, N. D., Dorokhov, V. M., Sitnikova, V. I., andLukyanov, A. N.: Investigation of ozone loss during winter–spring period of 2000 usingdata of balloon measurements and ground-based observations in Siberia, Meteorologiia i5
Gidrologiia, 12, 27–35, 2002.WMO: Scientific Assessment of Ozone Depletion: 2006, Global Ozone Research and Monitor-
ing Project-Report No. 52, World Meteorological Organisation, Geneva, Switzerland, 516 pp.,2011.
2971

AMTD6, 2955–2978, 2013
Arctic ozone loss inSiberia in 2011 and
2012
V. Dorokhov et al.
Title Page
Abstract Introduction
Conclusions References
Tables Figures
J I
J I
Back Close
Full Screen / Esc
Printer-friendly Version
Interactive Discussion
Discussion
Paper
|D
iscussionP
aper|
Discussion
Paper
|D
iscussionP
aper|
1
1
Brewer SAOZ sonde 2
3
4
Fig. 1. The location of the Brewer, SAOZ and ozonesonde stations in Russia.
2972
AMTD6, 2955–2978, 2013
Arctic ozone loss inSiberia in 2011 and
2012
V. Dorokhov et al.
Title Page
Abstract Introduction
Conclusions References
Tables Figures
J I
J I
Back Close
Full Screen / Esc
Printer-friendly Version
Interactive Discussion
Discussion
Paper
|D
iscussionP
aper|
Discussion
Paper
|D
iscussionP
aper|
Fig. 2. The result of the Brewer MKIV No 049 total ozone measurements in Tomsk in 2003–2012 (a) and Brewer MKII No 044 total ozone observations in Obninsk in 2003–2012 (b).
2973

AMTD6, 2955–2978, 2013
Arctic ozone loss inSiberia in 2011 and
2012
V. Dorokhov et al.
Title Page
Abstract Introduction
Conclusions References
Tables Figures
J I
J I
Back Close
Full Screen / Esc
Printer-friendly Version
Interactive Discussion
Discussion
Paper
|D
iscussionP
aper|
Discussion
Paper
|D
iscussionP
aper|
Fig. 3. The result of the Brewer MKIV No 049 total ozone measurements in Tomsk in 2011(a) and the Brewer MKII No 044 total ozone measurements in Obninsk in 2011 (b). The initialplots are from the WOUDC database http://www.woudc.org/data e.html.
2974

AMTD6, 2955–2978, 2013
Arctic ozone loss inSiberia in 2011 and
2012
V. Dorokhov et al.
Title Page
Abstract Introduction
Conclusions References
Tables Figures
J I
J I
Back Close
Full Screen / Esc
Printer-friendly Version
Interactive Discussion
Discussion
Paper
|D
iscussionP
aper|
Discussion
Paper
|D
iscussionP
aper|
Fig. 4. SAOZ spectrometerr total ozone real-time data at the Salekhard aerological station(a) and at the Zhigansk aerological station (b) in January–April 2011. The initial plots are fromthe World SAOZ real time database http://saoz.obs.uvsq.fr/SAOZ-RT.html.
2975
AMTD6, 2955–2978, 2013
Arctic ozone loss inSiberia in 2011 and
2012
V. Dorokhov et al.
Title Page
Abstract Introduction
Conclusions References
Tables Figures
J I
J I
Back Close
Full Screen / Esc
Printer-friendly Version
Interactive Discussion
Discussion
Paper
|D
iscussionP
aper|
Discussion
Paper
|D
iscussionP
aper|
(b)
Fig. 5. The long-term series of SAOZ total ozone and NO2 measurements at Salekhard aero-logical station in 2001–2011 (a) and at Zhigansk aerological station in 1991–2011 (b).
2976
AMTD6, 2955–2978, 2013
Arctic ozone loss inSiberia in 2011 and
2012
V. Dorokhov et al.
Title Page
Abstract Introduction
Conclusions References
Tables Figures
J I
J I
Back Close
Full Screen / Esc
Printer-friendly Version
Interactive Discussion
Discussion
Paper
|D
iscussionP
aper|
Discussion
Paper
|D
iscussionP
aper|
Fig. 6. WOUDC total ozone mapping on 23 and 31 March 2011 when the low ozone vortexpassed over Salekhard (a) and Zhigansk (b). The initial plots of the total ozone deviation arefrom the WOUDC database http://www.woudc.org/data e.html.
2977
AMTD6, 2955–2978, 2013
Arctic ozone loss inSiberia in 2011 and
2012
V. Dorokhov et al.
Title Page
Abstract Introduction
Conclusions References
Tables Figures
J I
J I
Back Close
Full Screen / Esc
Printer-friendly Version
Interactive Discussion
Discussion
Paper
|D
iscussionP
aper|
Discussion
Paper
|D
iscussionP
aper|
1
1
2
Fig. 7. Ozone profiles from 2Z-ECC sondes in Salekhard in the polar vortex in March–April2011 (red) and in February 2012 (blue).
2978