an advanced impact of arctic stratospheric ozone changes
TRANSCRIPT

Vol.:(0123456789)1 3
Climate Dynamics (2018) 51:4029–4041 https://doi.org/10.1007/s00382-018-4402-1
An advanced impact of Arctic stratospheric ozone changes on spring precipitation in China
Fei Xie1 · Xuan Ma1 · Jianping Li1,2 · Jinlong Huang3 · Wenshou Tian3 · Jiankai Zhang3 · Yongyun Hu4 · Cheng Sun1 · Xin Zhou5 · Juan Feng1 · Yun Yang1
Received: 21 August 2017 / Accepted: 29 May 2018 / Published online: 23 August 2018 © Springer-Verlag GmbH Germany, part of Springer Nature 2018
AbstractThe effect of spring Arctic Stratospheric Ozone (ASO) changes on spring precipitation in China is analyzed using observa-tions, reanalysis data, and the Whole Atmosphere Community Climate Model version 4 (WACCM4). We find that Febru-ary–March mean ASO changes have a significant impact on April–May mean precipitation over Loess Plateau and middle–lower reaches of the Yangtze River—two important grain-producing regions with large populations. Changes in the polar vortex link the ASO to precipitation in China. Stratospheric circulation anomalies caused by ASO changes can propagate to the North Pacific. An increase in ASO leads to enhanced westerlies in the high and low latitudes of the North Pacific but weakened westerly in the mid-latitudes of the North Pacific. The circulation anomalies over the North Pacific, forced by the increase of ASO, can extend westwards to East Asia, leading to an abnormal anticyclone in the East Asian upper and middle troposphere, and an abnormal cyclone in the lower troposphere. This enhances the warm and humid airstream from Western Pacific to Chinese mainland and strengthens upwelling over Loess Plateau and middle–lower reaches of the Yangtze River. These conditions enhance precipitation in central China during positive ASO anomaly events and reduce precipitation dur-ing negative events. The WACCM4 simulations support the results from statistical analysis of observations and reanalysis data. Our results suggest that ASO variation can serve as a predictor of spring precipitation variation over Loess Plateau and middle–lower reaches of the Yangtze River.
1 Introduction
Stratospheric ozone protects life on Earth by absorbing solar radiation in the ultraviolet range of the spectrum (e.g., Kerr and Mcelroy 1993; Lubin and Jensen 1995; Chipperfield et al. 2015) and has an important impact on temperature through atmospheric radiative heating (e.g., Haigh 1994; Ramaswamy et al. 1996; Forster and Shine 1997; Tian et al. 2010). Radiative heating influences stratospheric circula-tion and can further influence tropospheric weather and climate (e.g., Baldwin and Dunkerton 2001; Graf and Wal-ter 2005; Cagnazzo and Manzini 2009; Ineson and Scaife 2009; Thompson et al. 2011; Reichler et al. 2012; Xie et al. 2012; Karpechko et al. 2014; Kidston et al. 2015; Zhang et al. 2016; Li et al. 2016). Thus, stratospheric ozone plays an important role in the climate system.
In recent years, the impact of south polar stratospheric ozone on climate change has received widespread atten-tion (e.g., Son et al. 2008; Feldstein 2011; Kang et al. 2011; Thompson et al. 2011; Gerber and Son 2014; Waugh et al. 2015) due to significant ozone depletion in the south polar
This paper is a contribution to the special issue on East Asian Climate under Global Warming: Understanding and Projection, consisting of papers from the East Asian Climate (EAC) community and the 13th EAC International Workshop in Beijing, China on 24–25 March 2016, and coordinated by Jianping Li, Huang-Hsiung Hsu, Wei-Chyung Wang, Kyung-Ja Ha, Tim Li, and Akio Kitoh.
* Xuan Ma [email protected]
1 College of Global Change and Earth System Science, Beijing Normal University, Beijing, China
2 Laboratory for Regional Oceanography and Numerical Modeling, Qingdao National Laboratory for Marine Science and Technology, Qingdao, China
3 Key Laboratory for Semi-Arid Climate Change of the Ministry of Education, College of Atmospheric Sciences, Lanzhou University, Lanzhou, China
4 Atmospheric and Oceanic Sciences, School of Physics, Peking University, Beijing, China
5 Plateau Atmosphere and Environment Key Laboratory of Sichuan Province, College of Atmospheric Science, Chengdu University of Information Technology, Chengdu, China

4030 F. Xie et al.
1 3
stratosphere (Farman et al. 1985; Pawson and Naujokat 1999; Randel and Wu 1999, 2007; Solomon 1999; Labitzke and Naujokat 2000). At the end of the twentieth century, Antarctic stratospheric ozone losses exceeded 40% of the total ozone (Randel and Wu 2007). The decreased Antarctic ozone results in a temperature decrease through the strong radiation cooling effect, which enhances the meridional gra-dient of temperature and westerly winds. This process even-tually leads to a stronger south polar vortex, corresponding to a positive trend in the Southern Annular Mode, which has a significant influence on the Southern Hemispheric cli-mate (Thompson and Solomon 2002; Gillett and Thompson 2003; Thompson et al. 2011). The signal of enhanced winds related to the Southern Annular Mode can extend from the stratosphere to the surface (Son et al. 2010; Thompson et al. 2011), causing evident climate warming on the eastern Ant-arctic Peninsula and cooling in the Antarctic interior over the past few decades (Turner et al. 2005; Marshall et al. 2006). Previous studies demonstrated that stratospheric cooling caused by the Antarctic ozone hole results in a poleward shift of the extratropical westerly jet and extension of the Hadley cell in the Southern Hemisphere during austral summer (Son et al. 2010; Min and Son 2013). Furthermore, simulations and observations indicated that the displace-ment of the westerly jet was also associated with a pole-ward shift of the subtropical dry zone, with reduced rainfall in mid-latitudes and increased rainfall in the high latitudes of the Southern Hemisphere (Son et al. 2009; Polvani et al. 2011). In addition, it was shown that the variations in storm tracks and ocean circulation in the Southern Hemisphere were clearly affected by the Antarctic ozone hole (Yin 2005; Russell et al. 2006; Bitz and Polvani 2012).
At the end of the twentieth century, Arctic ozone deple-tion was not as obvious as its Antarctic counterpart because the Arctic polar cap is relatively warm in winter and spring (Montzka et al. 2011). Previously, it was considered that the reaction of the Northern Hemisphere surface climate to Arctic ozone losses was less evident (Thompson and Solomon 2005). Gradually, the connection between Arctic ozone loss and trop-ospheric climate change over the Northern Hemisphere has been revealed in observations and simulations. Some studies noted a significant surface air temperature (SAT) warming trend in the mid-to-high latitudes of the Eurasian continent since the late 1970s (Folland et al. 1990; Hurrell 1996; Jones et al. 1999). Though inevitably connected to the increase in atmospheric greenhouse gas concentrations, the warming trend was also found to be strongly connected with enhanced west-erly winds caused by Arctic stratospheric ozone depletion (Hu and Tung 2003; Hu et al. 2005). Ivy et al. (2017) reported that a large fraction of the variability in the March–April surface temperature in certain regions of the Northern Hemisphere is associated with variation in March Arctic ozone. Recently, numerous modeling studies have analyzed the possible linkage
between Arctic stratospheric ozone and tropospheric climate. Cheung et al. (2014) used the low Arctic stratospheric ozone anomalies in 2011 reported by the Earth Observing Sys-tem (EOS) Microwave Limb Sounder (MLS) to predict the tropospheric climate associated with ASO changes. Using ECHAM5 simulations, Karpechko et al. (2014) investigated the surface climate with specified ozone anomalies and sea surface temperatures. Based on numerical experiments, Smith and Polvani (2014) and Calvo et al. (2015) found that the sig-nal of spring ASO changes can propagate to the ground, result-ing in changes to the climate of the mid-to-high latitudes of the Northern Hemisphere; this includes changes to sea level pressure (SLP) and the tropospheric jet. Xie et al. (2016) dem-onstrated that the impacts of ASO variation on the surface climate of the Northern Hemisphere are not limited to the mid-to-high latitudes but could extend to the tropics via the combination of the high-latitude stratosphere-to-troposphere pathway and extratropical-to-tropical climate teleconnection. They found that ASO variation lead El Niño–Southern Oscil-lation (ENSO) events by around 20 months.
Smith and Polvani (2014) and Calvo et al. (2015) also investigated the relationship between spring ASO changes and precipitation in the Northern Hemisphere. However, these studies mainly focused on precipitation in Europe and North America. The effect of spring ASO changes on precipitation in Asia has received less attention. China—Asia’s most populous country—is sensitive to spring precipitation changes because precipitation is an important factor affecting agricultural pro-duction. Numerous studies have investigated the factors that influence spring precipitation in China (e.g., Zhang et al. 1999; Cai et al. 2002; Chen et al. 2003, 2009; Yang and Lau 2004; Chen and Qian 2005; Liu et al. 2005; Feng and Li 2011; Zhu et al. 2011; Xiong et al. 2012a, b; Xu et al. 2013; Li et al. 2015, 2016a; Yu et al. 2015). It is uncertain whether the ASO also has a significant impact on precipitation over China.
In this study, we report a strong link between ASO and spring precipitation in China and focus on analyzing the relationship between ASO variations and spring precipita-tion anomalies and the associated mechanisms. The remain-der of the paper is organized as follows. Section 2 describes the data and simulations used in this study. In Sect. 3, we show results for the variation in spring precipitation over China associated with ASO anomalies and explore the rel-evant mechanisms. The results of the model simulations are discussed in Sect. 4. Finally, we draw conclusion and sum-marize the results in Sect. 5.
2 Data and simulations
The ASO index is defined as the Arctic stratospheric ozone averaged for the latitude of 60°–90°N at an altitude of 100–50 hPa after removing the seasonal cycle and trend.

4031An advanced impact of Arctic stratospheric ozone changes on spring precipitation in China
1 3
Monthly mean ozone is taken from the Stratospheric Water and OzOne Satellite Homogenized (SWOOSH) dataset which is a merged record of stratospheric ozone and water vapor measurements taken by a number of limb sounding and solar occultation satellites over the previous 30 years, spanning 1984–2013 (Davis et al. 2016). Moreover, its pri-mary product is a monthly-mean zonal–mean gridded dataset containing ozone and water vapor data from the SAGE-II/III, UARS HALOE, UARS MLS, and Aura MLS instruments. The horizontal resolution and vertical pressure range of the ozone data are 2.5° zonal mean (latitude: 89°S–89°N) and 316–1 hPa (31 levels), respectively. For more information, see http://www.esrl.noaa.gov/csd/group s/csd8/swoos h. The ASO index based on SWOOSH ozone is in good agreement with that (Fig. 1; r = 0.94) given by the Global Ozone Chem-istry and Related trace gas Data Records for the Stratosphere (GOZCARDS, 1984–2013) project (Froidevaux et al. 2015). The zonal mean satellite-based GOZCARDS (1984–2013) is produced from high quality data from past missions (e.g., SAGE, HALOE data) as well as ongoing missions (ACE-FTS and Aura MLS). Its meridional resolution is 10° with 25 pressure levels from the surface up to 0.1 hPa.
Precipitation datasets come from three sources: 160–sta-tion monthly mean rainfall data provided by the National Meteorological Information Center of the China Meteoro-logical Administration (CMA) at a horizontal resolution of 0.5° which is the newest released rainfall dataset avail-able for the region and is built from observations recorded at 2472 long-term stations (Shen et al. 2010); the Global Precipitation Climatology Project (GPCP) monthly rainfall which has merged rain gauge stations, satellites, sounding observations to estimate monthly rainfall on a 2.5° global grid; the Global Precipitation Climatology Centre (GPCC) monthly precipitation data calculated from global station data at a horizontal resolution of 1.0°. Other datasets includ-ing monthly-mean wind fields and geopotential height used
in this study are obtained from the NCEP/Department of Energy (DOE) Reanalysis 2 (NCEP-2) following to the NCEP/NCAR Reanalysis Project (NCEP-1) (Kalnay et al. 1996; Kistler et al. 2001), regarding as an updated NCEP-1 and correcting the known errors.
Whole Atmosphere Community Climate Model version 4 (WACCM4), a part of the National Center for Atmos-pheric Research (NCAR) Community Climate Model, is used to simulate the precipitation response in China to the Arctic stratospheric ozone anomalies. WACCM4 is part of the Community Earth System Model (CESM) frame-work developed by the National Center for Atmospheric Research (Hurrell et al. 2013). In this study, we use ver-sion CESM1.0.6. WACCM4 also encompasses the Com-munity Atmospheric Model version 4 (CAM4), and as such includes all of its physical parameterizations (Neale et al. 2013). This improved version of WACCM uses a coupled system made up of four components, namely atmosphere, ocean (Danabasoglu et al. 2012), land, and sea ice (Hol-land et al. 2012). WACCM4 uses a finite-volume dynamical core, with 66 vertical levels extending from the ground to 4.5 × 10− 6 hPa (~ 145 km geometric altitude), and a vertical resolution of 1.1–1.4 km in the tropical tropopause layer and the lower stratosphere (located below a height of 30 km). The simulations presented in this paper are performed at a horizontal resolution of 1.9° × 2.5°, and do not include interactive chemistry (Garcia et al. 2007). More details about WACCM4 are available in Marsh et al. (2013). Fixed greenhouse gas (GHG) values, averages of emissions sce-nario A2 of the Intergovernmental Panel on Climate Change (IPCC) (WMO 2003) over the period 1995–2005, are used in the model’s radiation scheme. The prescribed ozone forc-ing used in our experiments is a 12-month seasonal cycle averaged over the period 1995–2005 from CMIP5 ensemble mean ozone output. The Quasi Biennial Oscillation (QBO) phase signals with a 28-month fixed cycle are included in WACCM4 as an external forcing for zonal wind.
Here, we designed three time-slice experiments (R1–R3) to investigate the effects of spring Arctic stratospheric ozone increase and decrease on the precipitation in China. An overview of all experiments is given in Table 1. All the experiments were all run for 33 years, with the first 3 years excluded for the model spin-up and only the last 30 years are used for our analysis.
3 Variation in precipitation in China associated with spring ASO anomalies
Correlation coefficients between February–March mean ASO index and April–May mean precipitation based on dif-ferent datasets are shown in Fig. 2a–c. A common and inter-esting phenomenon is that February–March ASO variations
Fig. 1 ASO represented by a time series of February–March mean ozone from SWOOSH ozone (black line) and GOZCARDS ozone (blue line) from 1984 to 2013. Data are averaged between 60°–90°N at 100–50 hPa, and the seasonal cycle and linear trend are removed

4032 F. Xie et al.
1 3
are significantly correlated with the April–May precipita-tion anomalies over the Loess Plateau and the middle–lower reaches of the Yangtze River. This result is in good agree-ment with that for ozone from GOZCARDS (Fig. 2d–f). Although there are some differences in the six panels, this is likely due to the different resolutions of these precipitation datasets. In the following, we use SWOOSH ozone data for detail analysis.
To further analyze the relationship between Febru-ary–March ASO and April–May precipitation over the Loess Plateau and the middle–lower reaches of the Yangtze River, we show time series of February–March ASO changes and April–May precipitation anomalies averaged over the region
105°–120°E and 25°–45°N (Fig. 3a). The correlation coef-ficient between the two time series reaches 0.57 and is signifi-cant at the 95% confidence level. However, February–March ASO changes are not significantly correlated with simulta-neous (February–March) precipitation variations (Fig. 3b, r = 0.0). The ASO changes lead precipitation anomalies by about 1–2 months, implying that positive (negative) spring ASO anomalies are associated with more (less) spring precipi-tation in the central region of China. Further analysis confirms that the strongest relationship is between the February–March ASO and April–May precipitation in China (not shown). This may be because the strongest changes to ASO occur in Febru-ary and March, caused by the breakdown of the Arctic polar
Table 1 CESM-WACCM4 experiments with various specified ozone forcing
a Integration time for time-slice runs is 33 yearsb To avoid the effect of the boundary of ozone change on the Arctic stratospheric circulation simulation, the replaced region (30°–90°N, 300–30 hPa) was larger than the region used to define the ASO index (60°–90°N, 100–50 hPa)
Expa Specified ozone forcing Other forcing
R1 Time-slice run as the control experiment used case F_2000_WACCM_SC. The specified ozone forcing is a 12-month cycle of monthly ozone averaged from 1995 to 2005
Fixed solar constant, fixed greenhouse gas (GHG) values (aver-ages of emissions scenario A2 of the Intergovernmental Panel on Climate Change (WMO, 2003) over the period 1995–2005), volcanic aerosols (from the Stratospheric Processes and their Role in Climate (SPARC) Chemistry–Climate Model Validation (CCMVal) REF-B2 scenario recommendations), and QBO phase signals with a 28-month zonal wind fixed cycle
R2 Same as R1, except that the February–March ozone in the region 30°–90°N at 300–30 hPab is decreased by 15% compared with R1
Same as R1
R3 Same as R1, except that February–March ozone in the region 30°–90°N at 300–30 hPa is increased by 15% compared with R1
Same as R1
(a) (b) (c)
(d) (e) (f)
Fig. 2 Correlation coefficients between the February–March mean ASO index and the April–May mean precipitation anomalies for the period 1984–2013. ASO indexes are calculated using (a–b) SWOOSH and (d–f) GOZCARDS data, and the precipitation data-
sets are based on (a, d) CMA, (b, e) GPCP and (c, f) GPCC. Hatched regions are statistically significant at the (a–c) 95% and (d–f) 90% confidence level according to Student’s t test. Precipitation anomalies are calculated by removing the seasonal cycle and linear trend

4033An advanced impact of Arctic stratospheric ozone changes on spring precipitation in China
1 3
vortex. The 1–2 months delayed effect of ASO on precipita-tion is because the stratospheric circulation signal caused by changes to ASO needs 1–2 months to propagate to the North-ern Hemispheric surface (Smith and Polvani 2014; Calvo et al. 2015; Xie et al. 2016; Ivy et al. 2017).
To further verify the connection between February–March ASO variation and April–May precipitation in the central region of China, a composite analysis is performed with respect to the February–March ASO index from SWOOSH ozone (Fig. 1). Positive and negative ASO anomaly events are identified using ± 1 standard deviation. The February–March ASO index is positive in 1987, 1998, 1999, 2001, 2002, 2004 and 2010, while it is negative in 1993, 1995, 1996, 1997, 2000 and 2011 (Table 2). The ASO increases (decreases) by an average of 10.8% (11.2%) during the positive (negative) ASO anomaly events. Figure 4 shows the differences in April–May mean precipitation anomalies over China between positive and negative February–March ASO anomaly events. The pat-tern of composite precipitation anomalies is similar to that for the correlation coefficients between the February–March
ASO index and April–May precipitation anomalies over China (Fig. 2); i.e., positive rainfall anomalies in the Loess Plateau and the middle–lower reaches of the Yangtze River in the posi-tive ASO anomalies events. Note, however, that the significant regions in Figs. 2 and 4 are not exactly the same. In Fig. 2, the rainfall anomaly region is over the Loess Plateau, while Fig. 4 highlights the lower reaches of the Yangtze River. The difference may result from the fact that the composite Fig. 4 is influenced by the rainfall climatology, whereas the correla-tion coefficient is independent of the magnitude of the rainfall.
The above analysis reveals a strong statistical relationship between February–March ASO variation and April–May precipitation in the central region of China. According to the 1–2 month lead–lag correlation, this relationship sug-gests that ASO changes influence precipitation variability. A question arises here: what processes are responsible for this relationship? In general, surface precipitation change is closely linked with circulation variations; therefore, we first examine the relationships between ASO, wind and geo-potential height.
Previously, Xie et al. (2017) demonstrated that the ASO has a lagged impact on mid–high latitude circulation, and showed that stratospheric circulation anomalies caused by ASO changes can rapidly extend to the lower troposphere in the high latitudes of the Northern Hemisphere. The
Fig. 3 a Time series of February–March mean ASO index (black line) and April–May mean precipitation (blue line) anomalies for 1984–2013. The ASO from SWOOSH and precipitation is averaged over the region 25°–45°N and 105°–120°E from CMA. b Is the same as a, but for both February–March mean ASO index (black line) and precipitation (blue line). The correlation coefficient between the two time series is given in the upper right corner of each panel
Table 2 Positive (left column) and negative (right column) ASO anomaly events based on SWOOSH ozone for the period of 1984–2013 ana-lyzed in this paper
ASO index > 1 STD ASO index < − 1 STD
1987, 1998, 1999, 2001, 2002, 2004, 2010 1993, 1995, 1996, 1997, 2000, 2011
Fig. 4 Difference in April–May mean precipitation (mm/day) over China between positive and negative ASO anomaly events from 1984 to 2013. Hatching indicates areas that are statistically significant at the 95% confidence level. The selected ASO anomalous events are given in Table 2. ASO data are from SWOOSH and precipitation data from CMA
4034 F. Xie et al.
1 3
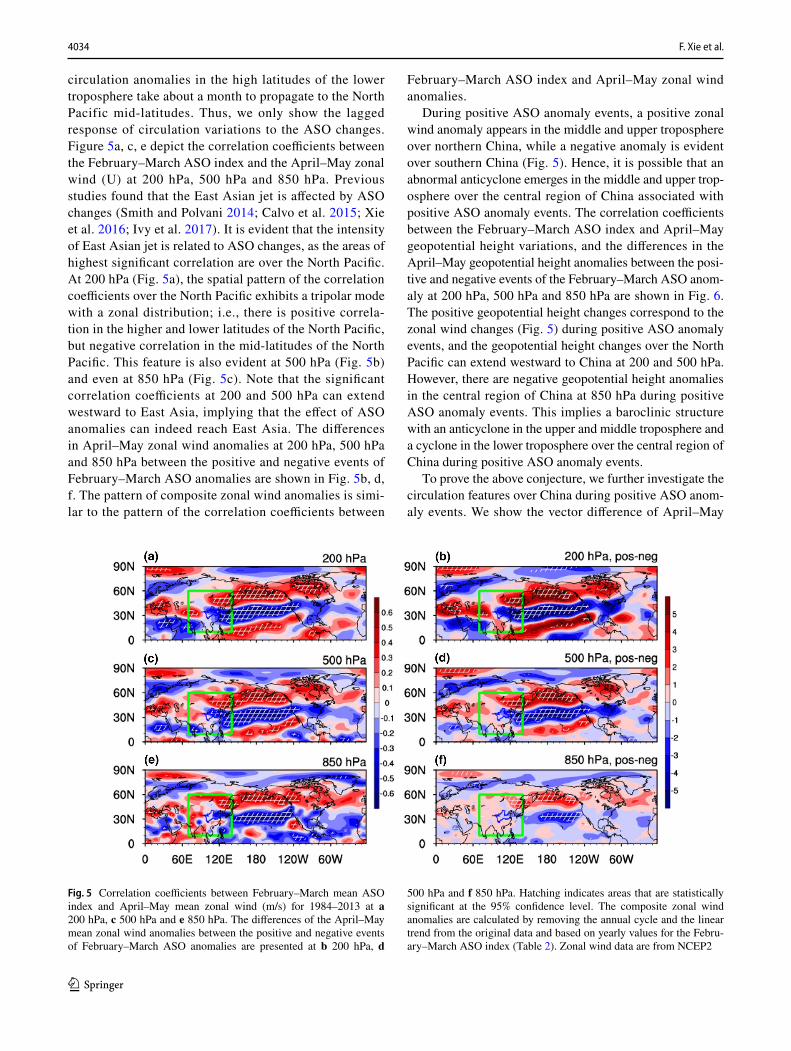
circulation anomalies in the high latitudes of the lower troposphere take about a month to propagate to the North Pacific mid-latitudes. Thus, we only show the lagged response of circulation variations to the ASO changes. Figure 5a, c, e depict the correlation coefficients between the February–March ASO index and the April–May zonal wind (U) at 200 hPa, 500 hPa and 850 hPa. Previous studies found that the East Asian jet is affected by ASO changes (Smith and Polvani 2014; Calvo et al. 2015; Xie et al. 2016; Ivy et al. 2017). It is evident that the intensity of East Asian jet is related to ASO changes, as the areas of highest significant correlation are over the North Pacific. At 200 hPa (Fig. 5a), the spatial pattern of the correlation coefficients over the North Pacific exhibits a tripolar mode with a zonal distribution; i.e., there is positive correla-tion in the higher and lower latitudes of the North Pacific, but negative correlation in the mid-latitudes of the North Pacific. This feature is also evident at 500 hPa (Fig. 5b) and even at 850 hPa (Fig. 5c). Note that the significant correlation coefficients at 200 and 500 hPa can extend westward to East Asia, implying that the effect of ASO anomalies can indeed reach East Asia. The differences in April–May zonal wind anomalies at 200 hPa, 500 hPa and 850 hPa between the positive and negative events of February–March ASO anomalies are shown in Fig. 5b, d, f. The pattern of composite zonal wind anomalies is simi-lar to the pattern of the correlation coefficients between
February–March ASO index and April–May zonal wind anomalies.
During positive ASO anomaly events, a positive zonal wind anomaly appears in the middle and upper troposphere over northern China, while a negative anomaly is evident over southern China (Fig. 5). Hence, it is possible that an abnormal anticyclone emerges in the middle and upper trop-osphere over the central region of China associated with positive ASO anomaly events. The correlation coefficients between the February–March ASO index and April–May geopotential height variations, and the differences in the April–May geopotential height anomalies between the posi-tive and negative events of the February–March ASO anom-aly at 200 hPa, 500 hPa and 850 hPa are shown in Fig. 6. The positive geopotential height changes correspond to the zonal wind changes (Fig. 5) during positive ASO anomaly events, and the geopotential height changes over the North Pacific can extend westward to China at 200 and 500 hPa. However, there are negative geopotential height anomalies in the central region of China at 850 hPa during positive ASO anomaly events. This implies a baroclinic structure with an anticyclone in the upper and middle troposphere and a cyclone in the lower troposphere over the central region of China during positive ASO anomaly events.
To prove the above conjecture, we further investigate the circulation features over China during positive ASO anom-aly events. We show the vector difference of April–May
Fig. 5 Correlation coefficients between February–March mean ASO index and April–May mean zonal wind (m/s) for 1984–2013 at a 200 hPa, c 500 hPa and e 850 hPa. The differences of the April–May mean zonal wind anomalies between the positive and negative events of February–March ASO anomalies are presented at b 200 hPa, d
500 hPa and f 850 hPa. Hatching indicates areas that are statistically significant at the 95% confidence level. The composite zonal wind anomalies are calculated by removing the annual cycle and the linear trend from the original data and based on yearly values for the Febru-ary–March ASO index (Table 2). Zonal wind data are from NCEP2

4035An advanced impact of Arctic stratospheric ozone changes on spring precipitation in China
1 3
horizontal wind in the region 70°–140°E and 10°–60°N between positive and negative events of the February–March ASO anomaly (Fig. 7). An anticyclone is found in the upper and middle troposphere (Fig. 7a, b), while there is a cyclone in the lower troposphere over the central region of China during positive ASO anomaly events (Fig. 7c). The anti-cyclone in the upper troposphere and cyclone in the lower troposphere would result in upwelling at this area.
Figure 8a shows a longitude–height cross-section of dif-ferences in the April–May vertical velocity (averaged over 25°–45°N) between positive and negative events of the February–March ASO anomaly. There is a large negative vertical velocity anomaly (enhanced upwelling) in the tropo-sphere at 105°–120°E during positive ASO anomaly events. A longitude–latitude cross-section of differences in the April–May vertical velocity (averaged over 1000–500 hPa) over the region 70°–140°E and 10°–60°N between positive and negative events of the February–March ASO anomaly is shown in Fig. 8b. The abnormal rising airflow appears over the Loess Plateau and the middle–lower reaches of the Yangtze River. It is evident that tropospheric upwelling will be enhanced over the central region of China if the ASO is anomalously high in spring.
According to Figs. 7 and 8, circulation anomalies over the central region of China, which are related to spring ASO anomalies, create conditions that favor spring precipitation in this area: first, changes to the west side of the East Asian jet (Figs. 5, 6) during positive ASO anomaly events enhance the warm and humid airstream from the Pacific Ocean to the Chinese Mainland (Fig. 7); second, these changes lead to an
anticyclone in the upper troposphere and a cyclone in the lower troposphere over the central region of China, which results in anomalous upwelling over this region (Fig. 8). The increase of water vapor concentration in the atmosphere with enhanced upwelling over the Loess Plateau and the mid-dle–lower reaches of the Yangtze River results in more pre-cipitation over this area during positive ASO anomaly events (Fig. 4), and vice versa.
4 Simulated variations in precipitation in China forced by spring ASO anomalies
In Sect. 3, we investigated precipitation variability in China associated with ASO anomalies in spring, and the driving mechanism, using statistical analysis of observations and reanalysis data. In this section, we use WACCM4 simu-lations to further verify our results. First, we examine the simulation capability of WACCM4 for predicting precipita-tion in China. Figure 9a shows a longitude–latitude cross-section of the April–May mean total precipitation field over the region 70°–140°E and 10°–60°N around the year 2000 for experiment R1. (For details of the experiments please refer to Table 1). The precipitation climatology in April and May simulated by WACCM4 is similar to the observations. Both model and observations show more precipitation south of latitude 20°N, over southern China and the East Sea, but the simulated precipitation intensity is slightly larger than that observed.
Fig. 6 As in Fig. 5, but for geopotential height (m) from NCEP2

4036 F. Xie et al.
1 3
Figure 10 shows the difference in precipitation between the R3 and R2 experiments. The ASO increase forces a statistically significant (95% confidence level) increase in April–May precipitation over the Loess Plateau and the middle–lower reaches of the Yangtze River (Fig. 10a). The
pattern of April–May precipitation anomalies in Fig. 10a is similar to both the distribution of significant correlation coefficients between the February–March ASO index and April–May precipitation anomalies (Fig. 2) and the differ-ence in April–May mean precipitation anomaly over China between positive and negative events of the February–March ASO (Fig. 4) where ASO and precipitation are all from observations. However, the simulated intensity of precipi-tation anomalies is smaller than that observed over northern China, but is larger over the southern and eastern Tibetan Plateau (Fig. 10a). In addition, there are three obvious nega-tive precipitation centers in Fig. 10a, but they are not sig-nificant and not seen in the observations. This may be due to that the model convection parameterization scheme over and around the Tibetan Plateau is not perfect. The difference in February–March precipitation between R3 and R2 is shown in Fig. 10b. These differences are small and not significant. This suggests that the February–March ASO has no signifi-cant impact on simultaneous (February–March) precipita-tion in China but can significantly affect April–May precipi-tation (Fig. 10a). This result from the simulations supports results from our statistical analysis of observations (Fig. 3).
We analyze the mechanism through which the ASO anomaly affects precipitation in the simulations by explor-ing the circulation and geopotential height anomalies forced by February–March ASO anomalies. Figure 11 shows the forced April–May circulation and geopotential height anom-alies at 200 hPa, 500 hPa and 850 hPa. The spatial distribu-tion of these anomalies from the WACCM4 simulations is consistent with results from our earlier statistical analysis (Figs. 5, 6). The East Asian jet is significantly influenced by ASO anomaly forcing. The circulation anomalies over the North Pacific exhibit a tripolar mode with a zonal distribu-tion; i.e., with enhanced westerlies in the higher and lower latitudes of the North Pacific but weakened westerly in the mid-latitudes (Fig. 11a, c, e). The geopotential height anom-alies correspond well to the circulation changes (Fig. 11b, d, f). In the simulations, the circulation and geopotential height anomalies forced by ASO changes can extend westward to East Asia.
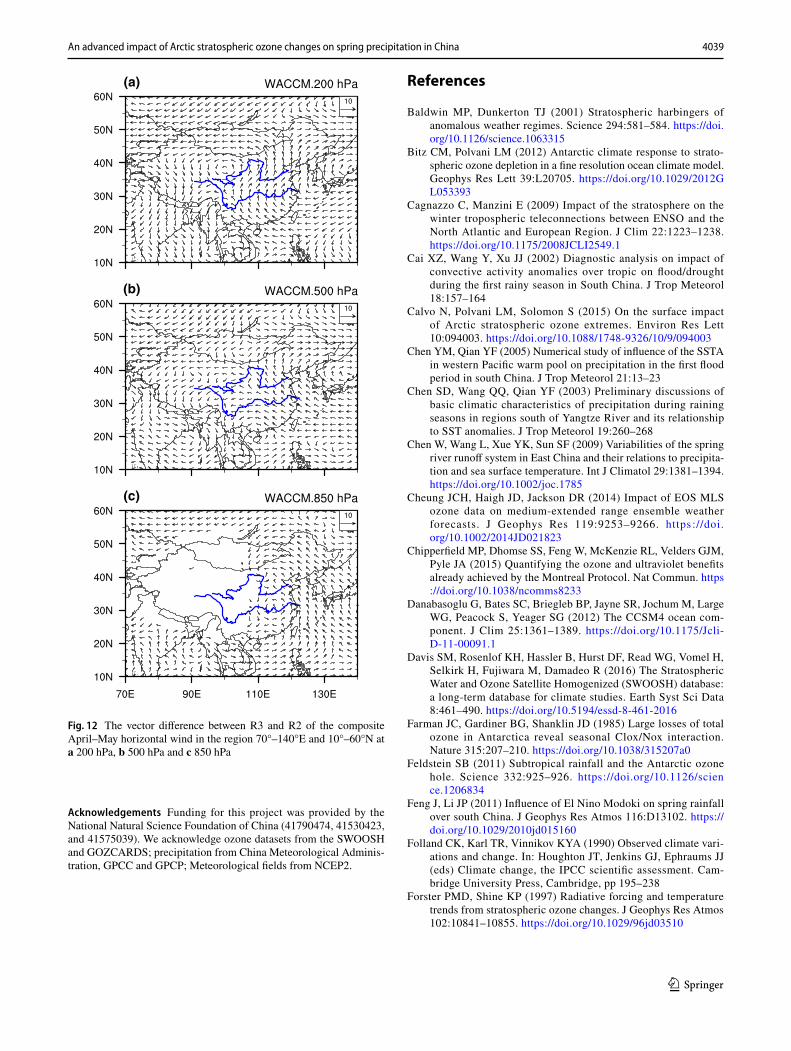
Figure 12 shows the vector difference in April–May hori-zontal wind between R3 and R2, in the region 70°–140°E and 10°–60°N. An abnormal anticyclone in the East Asian upper and middle troposphere (Fig. 12a, b) and an abnormal cyclone in the lower troposphere (Fig. 12c) are forced by an increase in ASO. As stated in Sect. 3, this circulation pattern will enhance the warm and humid airflow from the Pacific Ocean to China, increase the water vapor content over the central region of China, and strengthen upwelling over the Loess Plateau and the middle–lower reaches of the Yangtze River. In summary, the simulation results support the results from our statistical analysis of observations and reanalysis data.
(a)
(b)
(c)
Fig. 7 The vector difference in April–May horizontal wind in the region 70°–140°E and 10°–60°N between positive and negative events of the February–March ASO anomaly at a 200 hPa, b 500 hPa and c 850 hPa from 1984 to 2013. Colored regions are statistically significant at the 90% (light yellow) and 95% (dark yellow) confi-dence levels. The composite horizontal wind anomalies are calcu-lated by removing the annual cycle and linear trend from the original data and based on yearly values of the February–March ASO index (Table 2). Horizontal wind data are from NCEP2

4037An advanced impact of Arctic stratospheric ozone changes on spring precipitation in China
1 3
Our results are similar to those of Smith and Polvani (2014), showing that the circulation variations over Alaska and Eastern Europe are significantly correlated with ASO changes. However, Smith and Polvani (2014) did not find significant circulation changes over the North Pacific caused
Fig. 8 a Longitude–height cross-section of the April–May verti-cal velocity (averaged over 25°–45°N) difference between the posi-tive and negative events of the February–March ASO anomaly from 1984 to 2013. Hatching indicates areas that are statistically significant at the 95% confidence level. Vertical velocity (Pa/s) is from NCEP2
data. b Is the same as a, but displayed as a longitude–latitude cross-section, with the vertical velocity averaged over 1000–500 hPa. The composite vertical velocity anomalies are calculated by removing the annual cycle and linear trend from the original data and based on yearly values of the February–March ASO index (Table 2)
Fig. 9 a Longitude–latitude cross-section of April–May mean pre-cipitation (mm/day) in experiment R1. b Is the same as a, but for the GPCP data during the period 1995–2005. Details of the experiments are given in Table 1
(a)
(b)
Fig. 10 The difference in a April–May and b February–March mean precipitation (mm/day) between experiments R3 and R2. Shaded areas are significant at the 95% confidence level based on Student’s t test

4038 F. Xie et al.
1 3
by ASO changes. Calvo et al. (2015) pointed out that the ASO changes can significantly affect the circulation anoma-lies in the North Pacific, consistent with our results. It is pos-sible that Smith and Polvani (2014) did not find the signal over the North Pacific because their model is not state-of-the-art for stratospheric simulation.
5 Summary and conclusions
Using observational and reanalysis datasets together with WACCM4, we find an advanced impact (1–2 months) of spring Arctic stratospheric ozone changes on spring precipi-tation in China. When the February–March ASO is anoma-lously high (low), April–May precipitation will increase (decrease) in the Loess Plateau and the middle–lower reaches of the Yangtze River, two regions important for grain production in China. We have also revealed the under-lying mechanisms behind this relationship.
To reveal the underlying mechanisms, horizontal wind, geopotential height, and vertical velocity changes associated
with ASO anomalies are also analyzed. The East Asian jet is significantly influenced by ASO anomalies. The circu-lation anomalies over the North Pacific exhibit a tripolar mode with a zonal distribution; i.e., enhanced westerlies in higher and lower latitudes of the North Pacific, but weekend westerly in the mid-latitude North Pacific. The circulation anomalies forced by an increase of ASO can extend west-wards to East Asia, leading to an abnormal anticyclone in the upper and middle troposphere and an abnormal cyclone in the lower troposphere. This case enhances the warm and humid airstream from the Pacific Ocean to the Chinese Mainland and strengthens the upwelling over the Loess Plateau and the middle–lower reaches of the Yangtze River. These conditions result in more precipitation in the central region of China during positive ASO events, and vice versa for negative ASO events. Results from WACCM4 simula-tions of the impact of February–March Arctic stratospheric ozone on the April–May precipitation in the Loess Plateau and the middle–lower reaches of the Yangtze River support the results drawn from the statistical analysis of observations and reanalysis data.
Fig. 11 The difference in April–May mean zonal wind (a, c and e) and geopotential height (b, d and f) between R3 and R2 at 200 hPa (a, b), 500 hPa (c, d), and 850 hPa (e, f)
4039An advanced impact of Arctic stratospheric ozone changes on spring precipitation in China
1 3
Acknowledgements Funding for this project was provided by the National Natural Science Foundation of China (41790474, 41530423, and 41575039). We acknowledge ozone datasets from the SWOOSH and GOZCARDS; precipitation from China Meteorological Adminis-tration, GPCC and GPCP; Meteorological fields from NCEP2.
References
Baldwin MP, Dunkerton TJ (2001) Stratospheric harbingers of anomalous weather regimes. Science 294:581–584. https ://doi.org/10.1126/scien ce.10633 15
Bitz CM, Polvani LM (2012) Antarctic climate response to strato-spheric ozone depletion in a fine resolution ocean climate model. Geophys Res Lett 39:L20705. https ://doi.org/10.1029/2012G L0533 93
Cagnazzo C, Manzini E (2009) Impact of the stratosphere on the winter tropospheric teleconnections between ENSO and the North Atlantic and European Region. J Clim 22:1223–1238. https ://doi.org/10.1175/2008J CLI25 49.1
Cai XZ, Wang Y, Xu JJ (2002) Diagnostic analysis on impact of convective activity anomalies over tropic on flood/drought during the first rainy season in South China. J Trop Meteorol 18:157–164
Calvo N, Polvani LM, Solomon S (2015) On the surface impact of Arctic stratospheric ozone extremes. Environ Res Lett 10:094003. https ://doi.org/10.1088/1748-9326/10/9/09400 3
Chen YM, Qian YF (2005) Numerical study of influence of the SSTA in western Pacific warm pool on precipitation in the first flood period in south China. J Trop Meteorol 21:13–23
Chen SD, Wang QQ, Qian YF (2003) Preliminary discussions of basic climatic characteristics of precipitation during raining seasons in regions south of Yangtze River and its relationship to SST anomalies. J Trop Meteorol 19:260–268
Chen W, Wang L, Xue YK, Sun SF (2009) Variabilities of the spring river runoff system in East China and their relations to precipita-tion and sea surface temperature. Int J Climatol 29:1381–1394. https ://doi.org/10.1002/joc.1785
Cheung JCH, Haigh JD, Jackson DR (2014) Impact of EOS MLS ozone data on medium-extended range ensemble weather forecasts. J Geophys Res 119:9253–9266. https ://doi.org/10.1002/2014J D0218 23
Chipperfield MP, Dhomse SS, Feng W, McKenzie RL, Velders GJM, Pyle JA (2015) Quantifying the ozone and ultraviolet benefits already achieved by the Montreal Protocol. Nat Commun. https ://doi.org/10.1038/ncomm s8233
Danabasoglu G, Bates SC, Briegleb BP, Jayne SR, Jochum M, Large WG, Peacock S, Yeager SG (2012) The CCSM4 ocean com-ponent. J Clim 25:1361–1389. https ://doi.org/10.1175/Jcli-D-11-00091 .1
Davis SM, Rosenlof KH, Hassler B, Hurst DF, Read WG, Vomel H, Selkirk H, Fujiwara M, Damadeo R (2016) The Stratospheric Water and Ozone Satellite Homogenized (SWOOSH) database: a long-term database for climate studies. Earth Syst Sci Data 8:461–490. https ://doi.org/10.5194/essd-8-461-2016
Farman JC, Gardiner BG, Shanklin JD (1985) Large losses of total ozone in Antarctica reveal seasonal Clox/Nox interaction. Nature 315:207–210. https ://doi.org/10.1038/31520 7a0
Feldstein SB (2011) Subtropical rainfall and the Antarctic ozone hole. Science 332:925–926. https ://doi.org/10.1126/scien ce.12068 34
Feng J, Li JP (2011) Influence of El Nino Modoki on spring rainfall over south China. J Geophys Res Atmos 116:D13102. https ://doi.org/10.1029/2010j d0151 60
Folland CK, Karl TR, Vinnikov KYA (1990) Observed climate vari-ations and change. In: Houghton JT, Jenkins GJ, Ephraums JJ (eds) Climate change, the IPCC scientific assessment. Cam-bridge University Press, Cambridge, pp 195–238
Forster PMD, Shine KP (1997) Radiative forcing and temperature trends from stratospheric ozone changes. J Geophys Res Atmos 102:10841–10855. https ://doi.org/10.1029/96jd0 3510
(a)
(b)
(c)
Fig. 12 The vector difference between R3 and R2 of the composite April–May horizontal wind in the region 70°–140°E and 10°–60°N at a 200 hPa, b 500 hPa and c 850 hPa

4040 F. Xie et al.
1 3
Froidevaux L, Anderson J, Wang HJ, Fuller RA, Schwartz MJ, San-tee ML, Livesey NJ, Pumphrey HC, Bernath PF, Russell JM, McCormick MP (2015) Global OZone Chemistry And Related trace gas Data records for the Stratosphere (GOZCARDS): methodology and sample results with a focus on HCl, H2O, and O3. Atmos Chem Phys 15:10471–10507. https ://doi.org/10.5194/acp-15-10471 -2015
Garcia RR, Marsh DR, Kinnison DE, Boville BA, Sassi F (2007) Simulation of secular trends in the middle atmosphere, 1950–2003. J Geophys Res Atmos 112:D09301. https ://doi.org/10.1029/2006J D0074 85
Gerber EP, Son SW (2014) Quantifying the summertime response of the Austral Jet Stream and Hadley Cell to stratospheric ozone and greenhouse gases. J Clim 27:5538–5559. https ://doi.org/10.1175/Jcli-D-13-00539 .1
Gillett NP, Thompson DWJ (2003) Simulation of recent Southern Hemispheric climate change. Science 302:273–275. https ://doi.org/10.1126/scien ce.10874 40
Graf HF, Walter K (2005) Polar vortex controls coupling of North Atlantic Ocean and atmosphere. Geophys Res Lett 32:L01704. https ://doi.org/10.1029/2004G L0206 64
Haigh JD (1994) The role of stratospheric ozone in modulating the solar radiative forcing of climate. Nature 370:544–546. https ://doi.org/10.1038/37054 4a0
Holland MM, Bailey DA, Briegleb BP, Light B, Hunke E (2012) Improved sea ice shortwave radiation physics in CCSM4: the impact of melt ponds and aerosols on Arctic sea ice. J Clim 25:1413–1430. https ://doi.org/10.1175/Jcli-D-11-00078 .1
Hu YY, Tung KK (2003) Possible ozone-induced long-term changes in planetary wave activity in late winter. J Clim 16: 3027–3038. https://doi.org/10.1175/1520-0442(2003)016<3027:Polcip>2.0.Co;2
Hu YY, Tung KK, Liu JP (2005) A closer comparison of early and late-winter atmospheric trends in the northern hemisphere. J Clim 18:3204–3216. https ://doi.org/10.1175/Jcli3 468.1
Hurrell JW (1996) Influence of variations in extratropical wintertime teleconnections on Northern-Hemisphere temperature. Geophys Res Lett 23:665–668. https ://doi.org/10.1029/96gl0 0459
Hurrell JW, Holland MM, Gent PR, Ghan S, Kay JE, Kushner PJ, Lamarque JF, Large WG, Lawrence D, Lindsay K, Lipscomb WH, Long MC, Mahowald N, Marsh DR, Neale RB, Rasch P, Vavrus S, Vertenstein M, Bader D, Collins WD, Hack JJ, Kiehl J, Marshall S (2013) The community earth system model: a framework for col-laborative research. Bull Am Meteorol Soc 94:1339–1360. https ://doi.org/10.1175/Bams-D-12-00121 .1
Ineson S, Scaife AA (2009) The role of the stratosphere in the Euro-pean climate response to El Niño. Nat Geosci 2:32–36. https ://doi.org/10.1038/NGEO3 81
Ivy DJ, Solomon S, Calvo N, Thompson DW (2017) Observed connec-tions of Arctic stratospheric ozone extremes to Northern Hemi-sphere surface climate. Environ Res Lett 12:024004
Jones PD, New M, Parker DE, Martin S, Rigor IG (1999) Surface air temperature and its changes over the past 150 years. Rev Geophys 37:173–199. https ://doi.org/10.1029/1999r g9000 02
Kalnay E, Kanamitsu M, Kistler R, Collins W, Deaven D, Gandin L, Iredell M, Saha S, White G, Woollen J, Zhu Y, Chelliah M, Ebi-suzaki W, Higgins W, Janowiak J, Mo KC, Ropelewski C, Wang J, Leetmaa A, Reynolds R, Jenne R, Joseph D (1996) The NCEP/NCAR 40-years reanalysis project. Bull Am Meteorol Soc 77:437–471. https://doi.org/10.1175/1520-0477(1996)077<0437:Tnyrp>2.0.Co;2
Kang SM, Polvani LM, Fyfe JC, Sigmond M (2011) Impact of polar ozone depletion on subtropical precipitation. Science 332:951–954. https ://doi.org/10.1126/scien ce.12021 31
Karpechko AY, Perlwitz J, Manzini E (2014) A model study of tropo-spheric impacts of the Arctic ozone depletion of 2011. J Geophys
Res Atmos 119:7999–8014. https ://doi.org/10.1002/2013j d0213 50
Kerr JB, Mcelroy CT (1993) Evidence for large upward trends of ultra-violet-B radiation linked to ozone depletion. Science 262:1032–1034. https ://doi.org/10.1126/scien ce.262.5136.1032
Kidston J, Scaife AA, Hardiman SC, Mitchell DM, Butchart N, Bald-win MP, Gray LJ (2015) Stratospheric influence on tropospheric jet streams, storm tracks and surface weather. Nat Geosci 8:433–440. https ://doi.org/10.1038/NGEO2 424
Kistler R, Kalnay E, Collins W, Saha S, White G, Woollen J, Chelliah M, Ebisuzaki W, Kanamitsu M, Kousky V, van den Dool H, Jenne R, Fiorino M (2001) The NCEP/NCAR 50-year reanalysis: Monthly means CD-ROM and docu-mentation. Bull Am Meteorol Soc 82:247–267. https://doi.org/10.1175/1520-0477(2001)082<0247:Tnnyrm>2.3.Co;2
Labitzke K, Naujokat B (2000) The lower Arctic stratospheric in winter since 1952. SPARC Newsl 15:11–14
Li WJ, Zuo JQ, Song YL, Liu JP, Li Y, Shen YY, Li JX (2015) Changes in spatio–temporal distribution of drought/flood disaster in south-ern China under global climate warming. Meteorol Mon 41:261–271. https ://doi.org/10.7519/j.issn.1000-0526.2015.03.001
Li WJ, Zhang RN, Sun CH, Ren HC, Liu JP, Zuo JQ, Li X (2016a) Recent research advances on the interannual-interdecadal vari-ations of drought/flood in South China and associated causes. J Appl Meteorol Sci 27:577–591. https ://doi.org/10.11898 /1001-7313.20160 507
Li F, Vikhliaev YV, Newman PA, Pawson S, Perlwitz J, Waugh DW, Douglass AR (2016b) Impacts of interactive stratospheric chem-istry on Antarctic and Southern Ocean climate change in the Goddard Earth Observing System, Version 5 (GEOS-5). J Clim 29:3199–3218. https ://doi.org/10.1175/Jcli-D-15-0572.1
Liu B, Xu M, Henderson M, Qi Y (2005) Observed trends of precipi-tation amount, frequency, and intensity in China, 1960–2000. J Geophys Res Atmos 110:D08103. https ://doi.org/10.1029/2004J D0048 64
Lubin D, Jensen EH (1995) Effects of clouds and stratospheric ozone depletion on ultraviolet radiation trends. Nature 377:710–713. https ://doi.org/10.1038/37771 0a0
Marsh DR, Mills MJ, Kinnison DE, Lamarque JF, Calvo N, Pol-vani LM (2013) Climate change from 1850 to 2005 simu-lated in CESM1(WACCM). J Clim 26:7372–7391. https ://doi.org/10.1175/Jcli-D-12-00558 .1
Marshall GJ, Orr A, van Lipzig NPM, King JC (2006) The impact of a changing Southern Hemisphere Annular Mode on Antarctic Peninsula summer temperatures. J Clim 19:5388–5404. https ://doi.org/10.1175/Jcli3 844.1
Min SK, Son SW (2013) Multimodel attribution of the Southern Hemi-sphere Hadley cell widening: major role of ozone depletion. J Geophys Res Atmos 118:3007–3015. https ://doi.org/10.1002/jgrd.50232
Montzka S, Reimann S, Engel A, Kruger K, Sturges W, Blake D, Dorf M, Fraser P, Froidevaux L, Jucks K (2011) Scientific assessment of ozone depletion: 2010. Global Ozone Research and Monitoring Project-Report No. 51
Neale RB, Richter J, Park S, Lauritzen PH, Vavrus SJ, Rasch PJ, Zhang MH (2013) The mean climate of the Community Atmosphere Model (CAM4) in forced SST and fully coupled experiments. J Clim 26:5150–5168. https ://doi.org/10.1175/Jcli-D-12-00236 .1
Pawson S, Naujokat B (1999) The cold winter of the middle 1990s in the northern lower stratosphere. J Geophys Res Atmos 104:14209–14222. https ://doi.org/10.1029/1999j d9002 11
Polvani LM, Waugh DW, Correa GJP, Son SW (2011) Stratospheric ozone depletion: the main driver of twentieth-century atmospheric circulation changes in the Southern Hemisphere. J Clim 24:795–812. https ://doi.org/10.1175/2010J CLI37 72.1

4041An advanced impact of Arctic stratospheric ozone changes on spring precipitation in China
1 3
Ramaswamy V, Schwarzkopf MD, Randel WJ (1996) Fingerprint of ozone depletion in the spatial and temporal pattern of recent lower-stratospheric cooling. Nature 382:616–618. https ://doi.org/10.1038/38261 6a0
Randel WJ, Wu F (1999) Cooling of the Arctic and Antarctic polar stratosphere due to ozone depletion. J Clim 12:1467–1479
Randel WJ, Wu F (2007) A stratospheric ozone profile data set for 1979–2005: variability, trends, and comparisons with column ozone data. J Geophys Res Atmos 112:D06313. https ://doi.org/10.1029/2006J D0073 39
Reichler T, Kim J, Manzini E, Kroger J (2012) A stratospheric connec-tion to Atlantic climate variability. Nat Geosci 5:783–787. https ://doi.org/10.1038/NGEO1 586
Russell JL, Dixon KW, Gnanadesikan A, Stouffer RJ, Toggweiler JR (2006) The Southern Hemisphere westerlies in a warming world: propping open the door to the deep ocean. J Clim 19:6382–6390. https ://doi.org/10.1175/Jcli3 984.1
Shen Y, Feng M, Zhang H, Gao F (2010) Interpolation methods of China daily precipitation data. J Appl Meteorol Sci 21:279–286
Smith KL, Polvani LM (2014) The surface impacts of Arctic strato-spheric ozone anomalies. Environ Res Lett 9:074015. https ://doi.org/10.1088/1748-9326/9/7/07401 5
Solomon S (1999) Stratospheric ozone depletion: a review of con-cepts and history. Rev Geophys 37:275–316. https ://doi.org/10.1029/1999r g9000 08
Son SW, Polvani LM, Waugh DW, Akiyoshi H, Garcia R, Kinnison D, Pawson S, Rozanov E, Shepherd TG, Shibata K (2008) The impact of stratospheric ozone recovery on the Southern Hemisphere west-erly jet. Science 320:1486–1489. https ://doi.org/10.1126/scien ce.11559 39
Son SW, Tandon NF, Polvani LM, Waugh DW (2009) Ozone hole and Southern Hemisphere climate change. Geophys Res Lett 36:L15705. https ://doi.org/10.1029/2009G L0386 71
Son SW, Gerber EP, Perlwitz J, Polvani LM, Gillett NP, Seo KH, Eyring V, Shepherd TG, Waugh D, Akiyoshi H, Austin J, Baum-gaertner A, Bekki S, Braesicke P, Bruhl C, Butchart N, Chip-perfield MP, Cugnet D, Dameris M, Dhomse S, Frith S, Garny H, Garcia R, Hardiman SC, Jockel P, Lamarque JF, Mancini E, Marchand M, Michou M, Nakamura T, Morgenstern O, Pitari G, Plummer DA, Pyle J, Rozanov E, Scinocca JF, Shibata K, Smale D, Teyssedre H, Tian W, Yamashita Y (2010) Impact of strato-spheric ozone on Southern Hemisphere circulation change: a mul-timodel assessment. J Geophys Res Atmos 115:D00M07. https ://doi.org/10.1029/2010J D0142 71
Thompson DWJ, Solomon S (2002) Interpretation of recent Southern Hemisphere climate change. Science 296:895–899. https ://doi.org/10.1126/scien ce.10692 70
Thompson DWJ, Solomon S (2005) Recent stratospheric climate trends as evidenced in radiosonde data: global structure and tropospheric linkages. J Clim 18:4785–4795. https ://doi.org/10.1175/Jcli3 585.1
Thompson DWJ, Solomon S, Kushner PJ, England MH, Grise KM, Karoly DJ (2011) Signatures of the Antarctic ozone hole in South-ern Hemisphere surface climate change. Nat Geosci 4:741–749. https ://doi.org/10.1038/NGEO1 296
Tian WS, Chipperfield MP, Stevenson DS, Damoah R, Dhomse S, Dudhia A, Pumphrey H, Bernath P (2010) Effects of
stratosphere-troposphere chemistry coupling on tropospheric ozone. J Geophys Res Atmos 115:D00m04. https ://doi.org/10.1029/2009j d0135 15
Turner J, Colwell SR, Marshall GJ, Lachlan-Cope TA, Carleton AM, Jones PD, Lagun V, Reid PA, Iagovkina S (2005) Antarctic cli-mate change during the last 50 years. Int J Climatol 25:279–294. https ://doi.org/10.1002/Joc.1130
Waugh DW, Garfinkel CI, Polvani LM (2015) Drivers of the recent tropical expansion in the Southern Hemisphere: changing SSTs or ozone depletion? J Clim 28:6581–6586. https ://doi.org/10.1175/Jcli-D-15-0138.1
WMO (World Meteorological Organization) (2003) Scientific Assess-ment of Ozone depletion: 2002. In: Global Ozone Research and Monitoring Project, Report No. 47, Geneva, pp 498
Xie F, Li J, Tian W, Feng J, Huo Y (2012) Signals of El Niño Modoki in the tropical tropopause layer and stratosphere. Atmos Chem Phys 12:5259–5273. https ://doi.org/10.5194/acp-12-5259-2012
Xie F, Li JP, Tian WS, Fu Q, Jin FF, Hu YY, Zhang JK, Wang WK, Sun C, Feng J, Yang Y, Ding RQ (2016) A connection from Arctic stratospheric ozone to El Niño–Southern Oscillation. Environ Res Lett 11:124026. https ://doi.org/10.1088/1748-9326/11/12/12402 6
Xie F, Li JP, Zhang JK, Tian WS, Hu YY, Zhao S, Sun S, Ding RQ, Feng J, Yang Y (2017) Variations in North Pacific sea surface temperature caused by Arctic stratospheric ozone anomalies. Environ Res Lett 12:114023. https ://doi.org/10.1088/1748-9326/aa900 5
Xiong GM, Chen QL, Wei LX, Hu DQ (2012a) Influences of the deflection of stratospheric polar vortex on winter precipitation of China. J Appl Meteorol Sci 23:683–690
Xiong GM, Chen QL, Zhu KY, Fan GZ (2012b) Relationship between stratospheric polar vortex change and temperature, precipitation in winter of China. Plateau Meteorol 31:1001–1006
Xu K, Zhu CW, He JH (2013) Two types of El Niño-related Southern Oscillation and their different impacts on global land precipita-tion. Adv Atmos Sci 30:1743–1757. https ://doi.org/10.1007/s0037 6-013-2272-3
Yang FL, Lau KM (2004) Trend and variability of China precipitation in spring and summer: linkage to sea-surface temperatures. Int J Climatol 24:1625–1644. https ://doi.org/10.1002/joc.1094
Yin JH (2005) A consistent poleward shift of the storm tracks in simu-lations of 21st century climate. Geophys Res Lett 32:L18701. https ://doi.org/10.1029/2005G L0236 84
Yu GC, Chen W, Xu PQ, Ma Y (2015) Mechanistic analysis of the influence of the latent heat associated with the Kuroshio Cur-rent on Chinese rainfall anomalies in spring. Clim Environ Res 20:600–610. https ://doi.org/10.3878/j.issn.1006-9585.2015.15050
Zhang RH, Sumi A, Kimoto M (1999) A diagnostic study of the impact of El Nino on the precipitation in China. Adv Atmos Sci 16:229–241. https ://doi.org/10.1007/Bf029 73084
Zhang J, Tian WS, Chipperfield MP, Xie F, Huang J (2016) Persistent shift of the Arctic polar vortex towards the Eurasian continent in recent decades. Nat Clim Change 6:1094–1099
Zhu CW, Zhou XJ, Zhao P, Chen LX, He JH (2011) Onset of East Asian subtropical summer monsoon and rainy season in China. Sci China Earth Sci 54:1845–1853. https ://doi.org/10.1007/s1143 0-011-4284-0