aravind mamidi presentation on energy saving...
TRANSCRIPT

Aravind Mamidi30 th Aug 2017
Honeywell Internal
Presentation on Energy saving Projects

Honeywell Confidential - © 2017 by Honeywell International Inc. All rights reserved.
Honeywell Technology Solutions - Global Presence
2
ChinaShanghai
Beijing
Other locations
IndiaBengaluru
Hyderabad
Madurai
Guru gram
Czech
RepublicPrague
Brno
MexicoMexico City
Chihuahua
Juarez
Tijuana
1994Established in India
+9,000Employees globally
50%+Engineers focused on software
100%CMMI Maturity Level 5 certified
Businesses We Serve
Aerospace Home and Building Technologies
Performance Materials and Technologies
Safety and Productivity Solutions

PRESENTATION ON
CII NATIONAL AWARD FOR EXCELLENCE IN ENERGY MANAGEMENT
30th August to 1st Sep 2017
BYReshmi ShankarAravind Mamidi
Sholapur Vijay Kumar

Building 1 Building 2 RemarksNo of Floors G+4 G+2
Area 125733 Sq. ft. 28000 Sq. ft.
Year of operation 2008 2016
Contracted demand 1550 kva
MAX Demand 1163 kva
DG capacity 1055 X2 Kva ,380 Kva 1 no's
Occupancy 90% ( 1250 )
Operating Hours 9 hours 5 days week 9 Hours 5 days week Labs(12000 sq ft area), Go Direct Flight services and server rooms operates 24X7
Annual energy use is around 34 lakh KWH with the spend of 2.75 crores , including diesel cost
Site profile -- HTS Hyderabad, Telangana

5
Installation of solar water heater (2014)
Investment –Rs 70000
Savings – 14151 KWh -INR 1,20,280
ROI - 0.6 years
Timer for street lights (2015)
Investment – INR 45000
Savings -4908 Kwh –INR 41,788
ROI – 0.9 years
LED street lights , cove lighting parking lighting (2016)
Investment –Rs 685000
Savings – 61762 kwh , INR 5,24,927
ROI – 1.1 years
Installation of adiabatic system (2015)
Investment : INR 10.08 lakhs
Savings : 43334 Kwh INR 3,68,333
ROI 2.5 years
Installation new aerators for Taps (2016)Investment – Rs 22 000Savings – 1141 Kwh Rs 9,700 ROI – 2.5 years
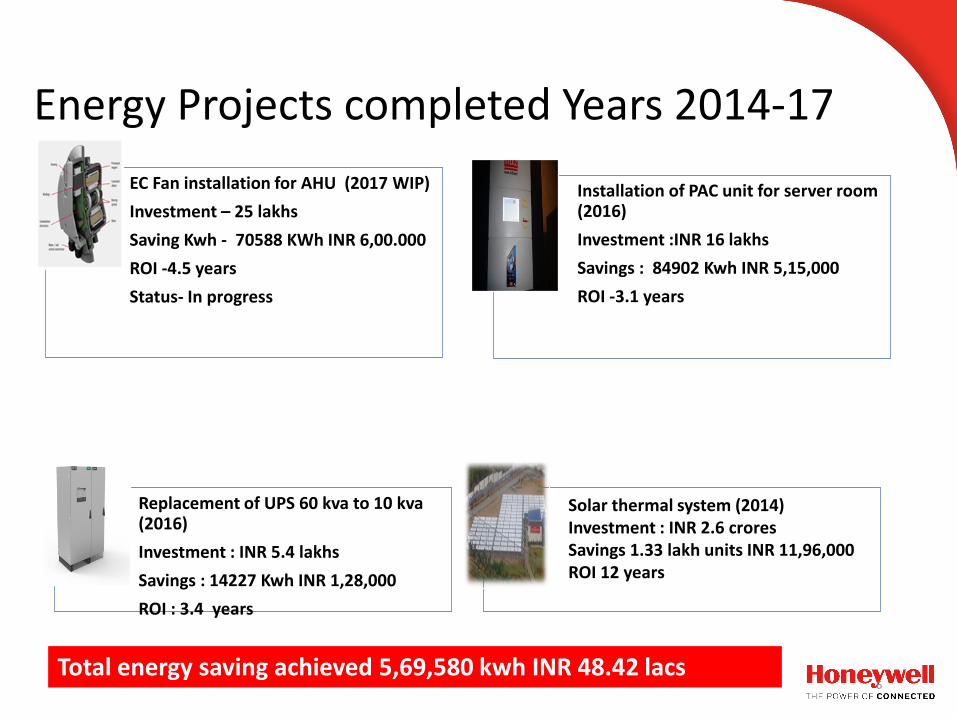
Energy Projects completed Years 2014-17
6
EC Fan installation for AHU (2017 WIP)
Investment – 25 lakhs
Saving Kwh - 70588 KWh INR 6,00.000
ROI -4.5 years
Status- In progress
Installation of PAC unit for server room (2016)
Investment :INR 16 lakhs
Savings : 84902 Kwh INR 5,15,000
ROI -3.1 years
Replacement of UPS 60 kva to 10 kva(2016)
Investment : INR 5.4 lakhs
Savings : 14227 Kwh INR 1,28,000
ROI : 3.4 years
Solar thermal system (2014)Investment : INR 2.6 crores Savings 1.33 lakh units INR 11,96,000ROI 12 years
Energy Projects completed Years 2014-17
Total energy saving achieved 5,69,580 kwh INR 48.42 lacs

Energy Projects Planned in the years 2018
7
Solar PV 100 kW
Investment :INR 55 lacs
Savings : 155000 Kwh INR 13.17 lacs
ROI -4.2 years - On Hold due to Phase III construction on Hold .
Occupancy control for conference room AC units.
Investment : INR 1.2 lacs
Savings : App 4500 kwh INR 38250
ROI : 4 years planned in 2018
Wheeling energy PPAInvestment TBD ROI – TBD Principally got clearance from management

8
170072
254508
145000
569580
0
100000
200000
300000
400000
500000
600000
Energy saving KWH
2014 2015 2016 Total
THE
GREEN
METRICS
455.7 tons
48.42
lakhsINR
$71.201 K
Co2 Mitigation
Monetary Saving
569680kWh
Power Saving
Energy saving Trend – HTS HYD year 2014-16

© 2015 by Honeywell International Inc. All rights reserved.
Additional Disclaimers As Needed (Consult Legal)
ENERGY SAVINGS TREND
2014 compared to 2013 – Saving 170,072 kWh
9
Baseline-2013 KWH 2,481,349
2014 Actual Consumption in KWH 2,875,177
2014 Normalized consumption in KWH 2,311,277
Savings Achieved in KWH 170,072
% of savings achieved in 2014 compared to 2013 7%
2,481,349 2,311,277
2,875,177
-
500,000
1,000,000
1,500,000
2,000,000
2,500,000
3,000,000
3,500,000
Baseline-2013 KWH 2014 Normalizedconsumption in KWH
2014 Actual Consumptionin KWH
Increase in working days
Increase in Occupancy
Increase in Operational hours
Weather ImpactLoad Addition

© 2015 by Honeywell International Inc. All rights reserved.
Additional Disclaimers As Needed (Consult Legal)
ENERGY SAVINGS TREND
2015 compared to 2014 – 254,508 kWh
10
Baseline-2014 KWH 2,875,177
2015 Actual Consumption in KWH 3,200,945
2015 Normalized consumption in KWH 2,605,673
Savings Achieved in KWH 254,508
% of savings achieved in 2015 compared to 2014 9.37%
2,875,177
2,605,673
3,200,945
-
500,000
1,000,000
1,500,000
2,000,000
2,500,000
3,000,000
3,500,000
Baseline-2014 KWH 2015 Normalizedconsumption in KWH
2015 ActualConsumption in KWH
Increase in
Occupancy
Increase in operational hours
Load Addition
Weather Impact
© 2015 by Honeywell International Inc. All rights reserved.
Additional Disclaimers As Needed (Consult Legal)
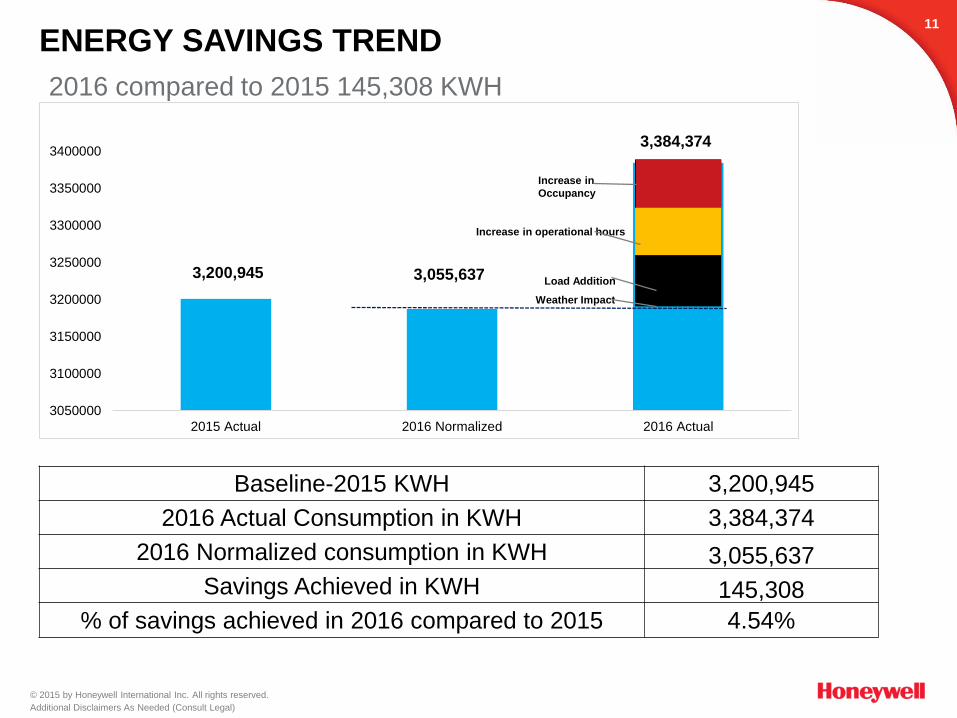
ENERGY SAVINGS TREND
2016 compared to 2015 145,308 KWH
kWh
11
Baseline-2015 KWH 3,200,945
2016 Actual Consumption in KWH 3,384,374
2016 Normalized consumption in KWH 3,055,637
Savings Achieved in KWH 145,308
% of savings achieved in 2016 compared to 2015 4.54%
3050000
3100000
3150000
3200000
3250000
3300000
3350000
3400000
2015 Actual 2016 Normalized 2016 Actual
Load Addition
Increase in operational hours
Increase in
Occupancy
Weather Impact
3,200,945 3,055,637
3,384,374
© 2015 by Honeywell International Inc. All rights reserved.
Additional Disclaimers As Needed (Consult Legal)
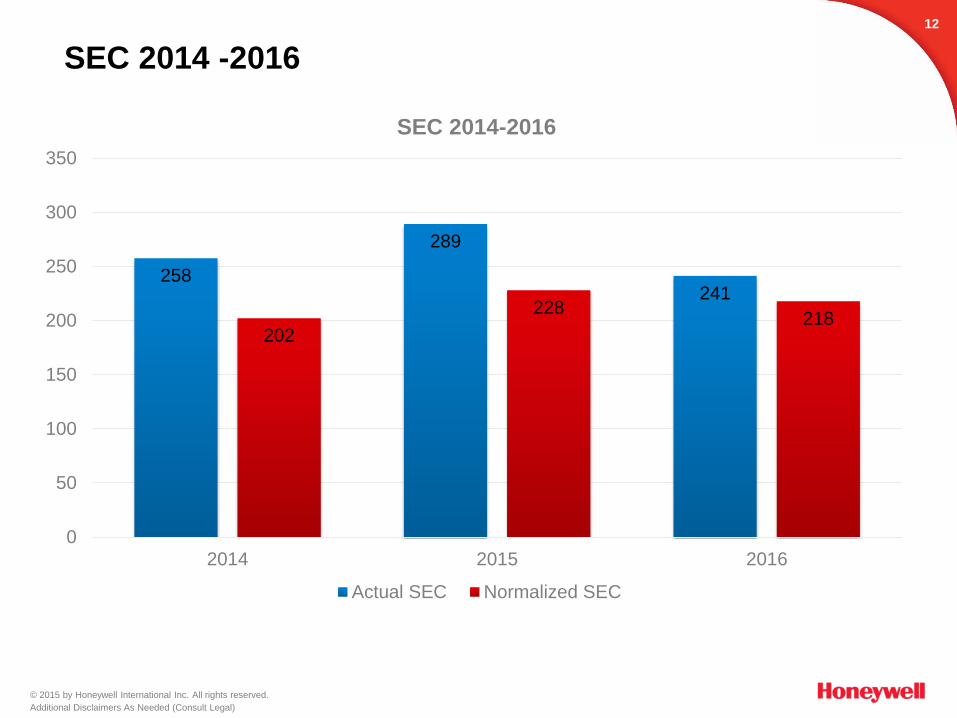
SEC 2014 -2016
12
258
289
241
202
228218
0
50
100
150
200
250
300
350
2014 2015 2016
SEC 2014-2016
Actual SEC Normalized SEC
13
HVAC46%
UPS21%
Lighting 7%
Raw power 16%
UTILITY
10%
HVAC UPS Lighting Raw power UTLTY
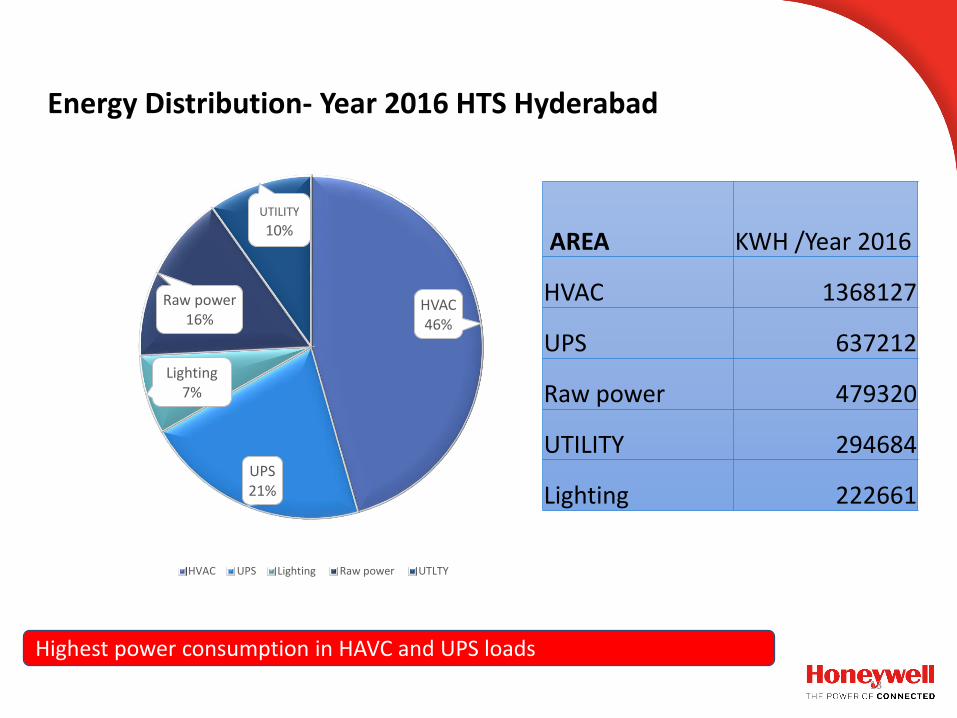
AREA KWH /Year 2016
HVAC 1368127
UPS 637212
Raw power 479320
UTILITY 294684
Lighting 222661
Energy Distribution- Year 2016 HTS Hyderabad
Highest power consumption in HAVC and UPS loads
14
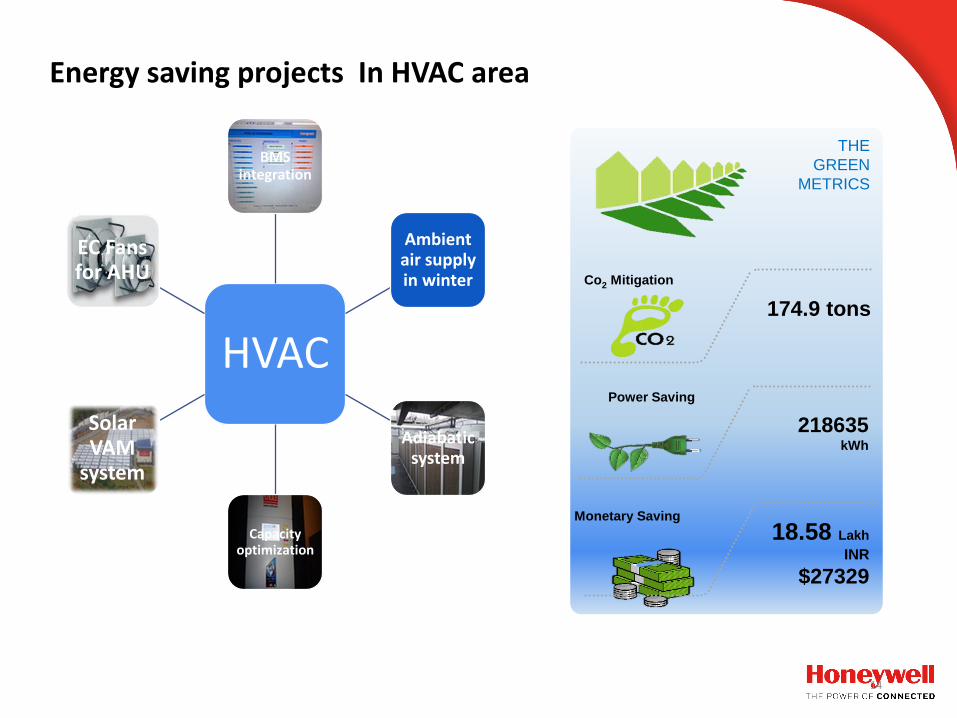
HVAC
BMS integration
Ambient air supply in winter
Adiabatic system
Capacity optimization
Solar VAM
system
EC Fans for AHU
Energy saving projects In HVAC area
THE
GREEN
METRICS
174.9 tons
18.58 Lakh
INR
$27329
Co2 Mitigation
Monetary Saving
218635kWh
Power Saving

© 2015 by Honeywell International Inc. All rights reserved.
Additional Disclaimers As Needed (Consult Legal)
© 2015 by Honeywell International Inc. All rights reserved.
Additional Disclaimers As Needed (Consult Legal)
Savings achieved 2016 –Rs 515100 ($7575) – Investment Rs 16 lacs ROI 3.1 years
15
KAIZEN
CAMPUS : HTSL - HYDERABAD KAIZEN AREA :
TARGET
KAIZEN START
KAIZEN FINISH
BENEFITS: 1. Phase out of
R-22 refrigerant, ECO
friendly gas
2. Energy savings – 84902
KWH
KAIZEN .No:
02
PROBLEM / PRESENT STATUS:
BEFORE COUNTER MEASURE :
AFTER
RESULTS: 1. Phase out of R-22 refrigerant and using
eco- friendly refrigerant
2. Cost savings due to lesser capacity of PAC
(existing 16.5TRx2 Nos package AC
replaced with 9TRx2 Nos Precision AC
resulting in energy saving of $18 K so far
$8k per year
3. Investment INRS 1025 lacs
KAIZEN THEME: Safety, Cost IDEA: Phasing out of R-22 refrigerant to achieve energy savings
by replacing Packaged AC (16HP)with Precision AC(7.5HP) with
ECO friendly Gas
TEAM MEMBERS: Venkat
Rao, Sivakumar, A.
Suresh, G. Suresh
RESULT AREA
Server room AC system S Q D C P
Server room AC
15-12-15
17-7-16
1st PAC
unit
installed
2nd APC
Installatio
n Packag
ed unit
only
used
Energy saving &
Eco friendly gas
Idea implemented on server room AC system
Before
Month KWH
15-Apr 8274
15-May 8651
15-Jun 8510
16-Feb 6460
16-Mar 7791
16-Apr 9350
Total 49036
Avg 8173
After
Month KWH
15-Jul 2895
15-Aug 2782
15-Sep 2190
16-Jul 3520
16-Aug 3651
16-Sep 3698
Total 18736
Avg 3123

16
Work station UPS Lab UPS Server UPS FOC UPS PHASE-2 FOC UPS
120KVA-1 120KVA-2120KVA-5
120KVA-3 120KVA-4 40KVA-1 40KVA-2 60KVA-1 60KVA-2 80KVA 10KVA-1 10KVA-2
2016 21.70% 23% 23% 27.10% 26.90% 19% 18.60% 3.60% 0.00% - - -
2017 20.60% 22%22.00
%27.20% 27.40% 15.90% 15.70% - - 6.80% 9% 14.70%
UPS load sharing details 2
1.7
0%
23
%
23
% 27
.10
%
26
.90
%
19
%
18
.60
%
3.6
0%
0.0
0%
0 0 020
.60
%
22
%
22
.00
%
27
.20
%
27
.40
%
15
.90
%
15
.70
%
0 0 6.8
0%
9%
14
.70
%
0.00%
10.00%
20.00%
30.00%
120KVA-1 120KVA-2 120KVA-5 120KVA-3 120KVA-4 40KVA-1 40KVA-2 60KVA-1 60KVA-2 80KVA 10KVA-1 10KVA-2
Work station UPS Lab UPS Server UPS FOC UPS PHASE-2 FOC UPS
UPS Max load Recorded
2016 2017
UPS NO LOAD POWER CONSUMPTION DETAILS
Load Per hour Per day consumption Per month Kwh Per yearKwh Cost /year INR
120KVA UPS 10 Amps 6.2534 150.0816 4502.4 54028.8 459244.8 459244 saving
80KVA UPS 8 Amps 5.0027 120.0648 3601.944 43223.328 367398.288
60 KVA 6 Amps 3.752 90.048 2161.152 25933.824 220437.504
40 KVA UPS 4 Amps 2.501 60.024 1800.72 21608.64 183673.44
10KVA UPS 2 Amps 1.2507 30.0168 900.504 10806.048 91851.408 128586.1 Saving
Note : consumption considered based on input from OEM
© 2015 by Honeywell International Inc. All rights reserved.
Additional Disclaimers As Needed (Consult Legal)
© 2015 by Honeywell International Inc. All rights reserved.
Additional Disclaimers As Needed (Consult Legal)
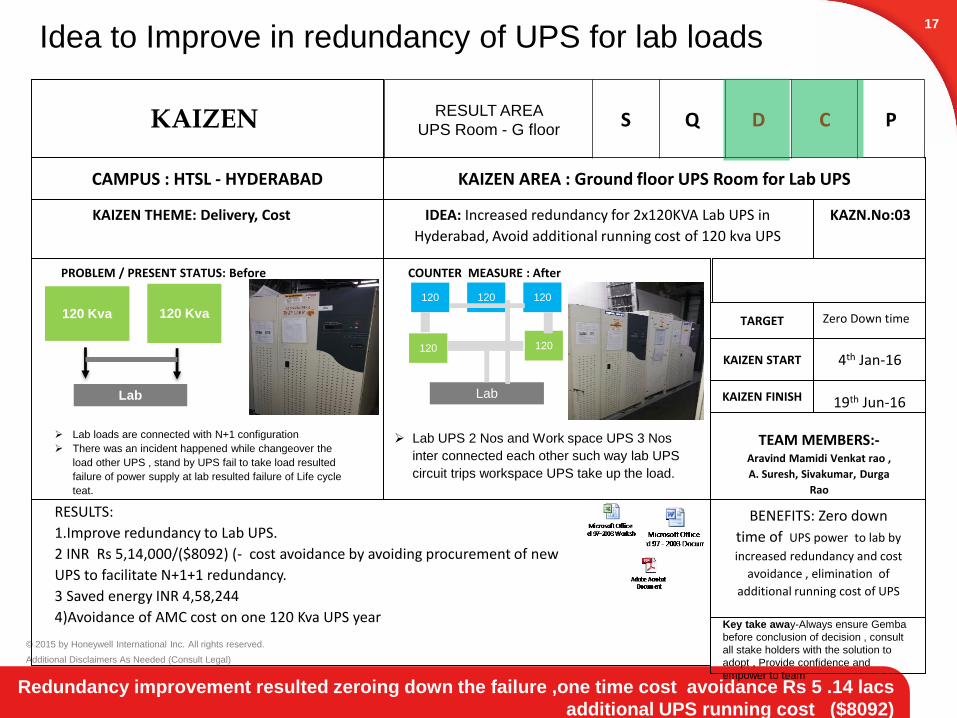
Redundancy improvement resulted zeroing down the failure ,one time cost avoidance Rs 5 .14 lacs
additional UPS running cost ($8092)
17
KAIZEN
CAMPUS : HTSL - HYDERABAD KAIZEN AREA : Ground floor UPS Room for Lab UPS
TARGET
KAIZEN START
KAIZEN FINISH
4th Jan-16
BENEFITS: Zero down
time of UPS power to lab by
increased redundancy and cost
avoidance , elimination of
additional running cost of UPS
KAZN.No:03
PROBLEM / PRESENT STATUS: Before COUNTER MEASURE : After
RESULTS:
1.Improve redundancy to Lab UPS.
2 INR Rs 5,14,000/($8092) (- cost avoidance by avoiding procurement of new
UPS to facilitate N+1+1 redundancy.
3 Saved energy INR 4,58,244
4)Avoidance of AMC cost on one 120 Kva UPS year
KAIZEN THEME: Delivery, Cost IDEA: Increased redundancy for 2x120KVA Lab UPS in
Hyderabad, Avoid additional running cost of 120 kva UPS
TEAM MEMBERS:-Aravind Mamidi Venkat rao ,
A. Suresh, Sivakumar, Durga
Rao
Zero Down time
RESULT AREA
UPS Room - G floor S Q D C P
19th Jun-16
Lab UPS 2 Nos and Work space UPS 3 Nos
inter connected each other such way lab UPS
circuit trips workspace UPS take up the load.
120 Kva 120 Kva
Lab
120
120
120
120 120
Lab
Lab loads are connected with N+1 configuration
There was an incident happened while changeover the
load other UPS , stand by UPS fail to take load resulted
failure of power supply at lab resulted failure of Life cycle
teat.
Idea to Improve in redundancy of UPS for lab loads
Key take away-Always ensure Gemba
before conclusion of decision , consult
all stake holders with the solution to
adopt , Provide confidence and
empower to team

© 2015 by Honeywell International Inc. All rights reserved.
Additional Disclaimers As Needed (Consult Legal)
© 2015 by Honeywell International Inc. All rights reserved.
Additional Disclaimers As Needed (Consult Legal)
Energy saving 1.28 lacs/year ( $1128) and one time cost avoidance of Rs 6,00,000($9000) ROI 3.4
years
18
KAIZEN
CAMPUS : HTSL - HYDERABAD KAIZEN AREA :Flight Operation Services area
TARGET
KAIZEN START
KAIZEN FINISH
Sep 2016
BENEFITS: Reduction in
energy consumption by
optimizing UPS capacity.
Key take away : Ensure right
capacity based business dynamics ,
always consult business for right
solution
KAZN.No:05
PROBLEM / PRESENT STATUS: Before COUNTER MEASURE : After
RESULTS:
1)Optimized load , energy saving & cost avoidance
3) Project cost Rs 5.40 lacs
4) One time cost avoidance Rs 6.0 lacs. By using removed UPS to other block.
5) Energy saving Rs 1.28 lacs /annum
6)Reduction in AMC cost first year 2nd year onwards Rs 25000
KAIZEN THEME: Energy saving IDEA: Replacement of overrated UPS 60 kva with 10KVA UPS
TEAM MEMBERS:-
Aravind Vukatal
sona.Lokesh, Venkat rao
,Sivakumar
Reduction in energy
consumption
RESULT AREA – FOC
center S Q D C P
31st Dec-16
Procured 2 Nos of 10 Kva UPS replaced with 60
Kva UPS to keep optimized load.& to achieve
energy saving
60 Kva 60 Kva
FOC
10
kav
a
10
kva
FOC
Constantly UPS load found not more than 3.55 ( 60 Kva)
Observed load never go increase & explored business
dynamics there is no increase of loads in future
Idea implemented on UPS capacity Optimization for FOC
19
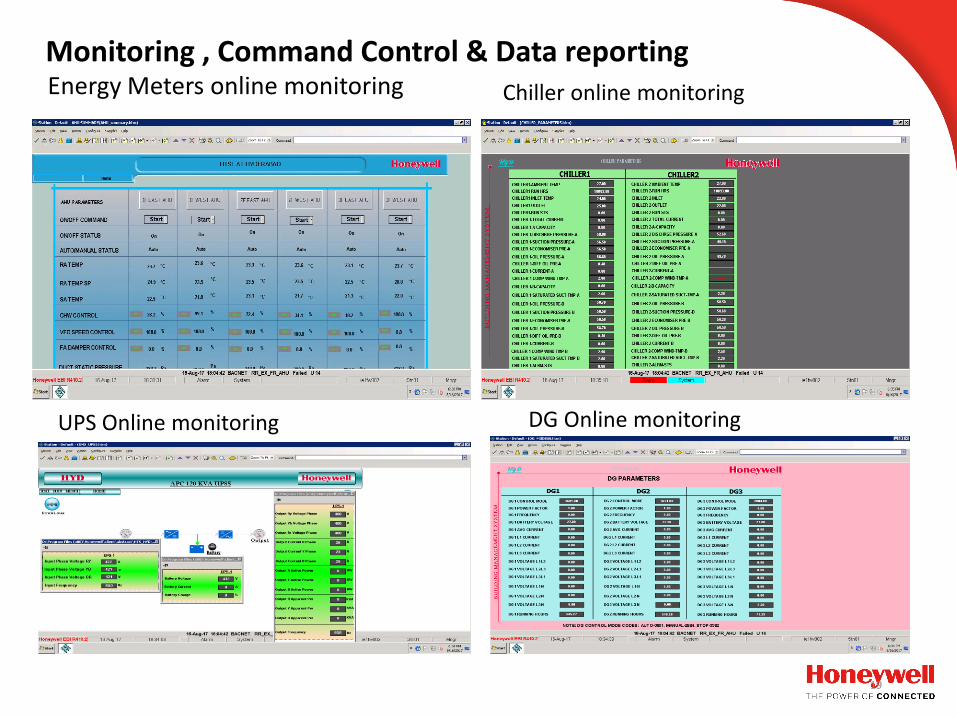
Energy Meters online monitoring
UPS Online monitoring DG Online monitoring
Chiller online monitoring
Monitoring , Command Control & Data reporting
20
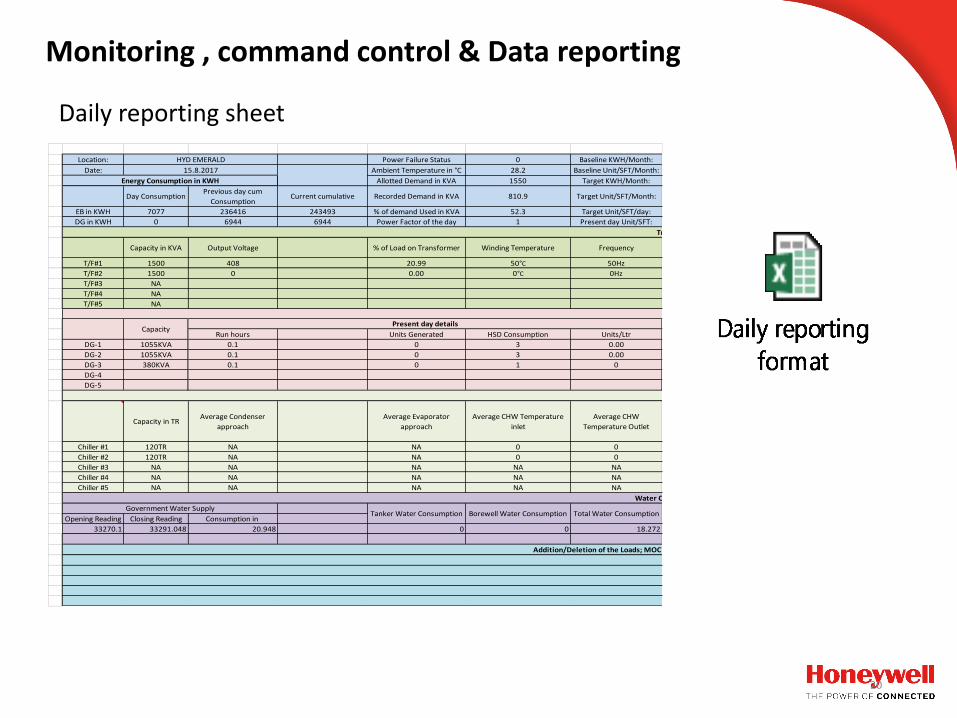
Monitoring , command control & Data reporting
Location: Power Failure Status 0 Baseline KWH/Month:
Date: Ambient Temperature in °C 28.2 Baseline Unit/SFT/Month:
Allotted Demand in KVA 1550 Target KWH/Month:
Day ConsumptionPrevious day cum
ConsumptionCurrent cumulative Recorded Demand in KVA 810.9 Target Unit/SFT/Month:
EB in KWH 7077 236416 243493 % of demand Used in KVA 52.3 Target Unit/SFT/day:
DG in KWH 0 6944 6944 Power Factor of the day 1 Present day Unit/SFT:
Capacity in KVA Output Voltage % of Load on Transformer Winding Temperature Frequency
T/F#1 1500 408 20.99 50°C 50Hz
T/F#2 1500 0 0.00 0°C 0Hz
T/F#3 NA
T/F#4 NA
T/F#5 NA
Run hours Units Generated HSD Consumption Units/Ltr
DG-1 1055KVA 0.1 0 3 0.00
DG-2 1055KVA 0.1 0 3 0.00
DG-3 380KVA 0.1 0 1 0
DG-4
DG-5
Capacity in TRAverage Condenser
approach
Average Evaporator
approach
Average CHW Temperature
inlet
Average CHW
Temperature Outlet
Chiller #1 120TR NA NA 0 0
Chiller #2 120TR NA NA 0 0
Chiller #3 NA NA NA NA NA
Chiller #4 NA NA NA NA NA
Chiller #5 NA NA NA NA NA
Opening Reading Closing Reading Consumption in
33270.1 33291.048 20.948 0 0 18.272
HYD EMERALD
15.8.2017
Energy Consumption in KWH
Transformer Details
DG Details
CapacityPresent day details
Chiller Details
Water Consumption details in KL
Government Water SupplyTanker Water Consumption Borewell Water Consumption Total Water Consumption
Addition/Deletion of the Loads; MOC details or Any additional information from the Facility
Daily reporting sheet
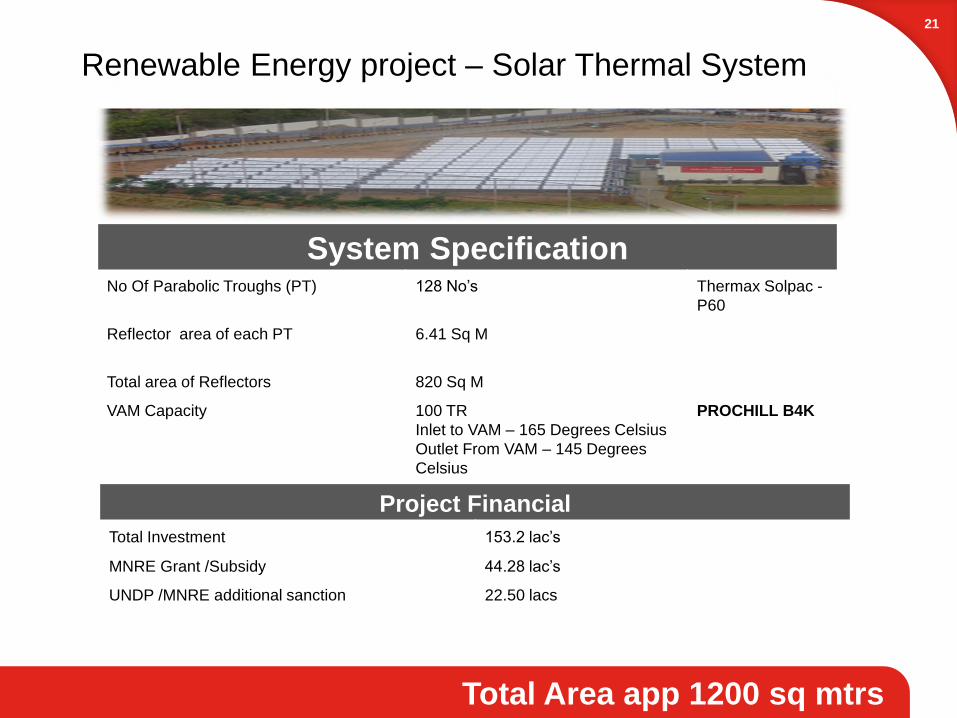
Total Area app 1200 sq mtrs
21
System Specification No Of Parabolic Troughs (PT) 128 No’s Thermax Solpac -
P60
Reflector area of each PT 6.41 Sq M
Total area of Reflectors 820 Sq M
VAM Capacity 100 TR
Inlet to VAM – 165 Degrees Celsius
Outlet From VAM – 145 Degrees
Celsius
PROCHILL B4K
Project Financial
Total Investment 153.2 lac’s
MNRE Grant /Subsidy 44.28 lac’s
UNDP /MNRE additional sanction 22.50 lacs
Renewable Energy project – Solar Thermal System
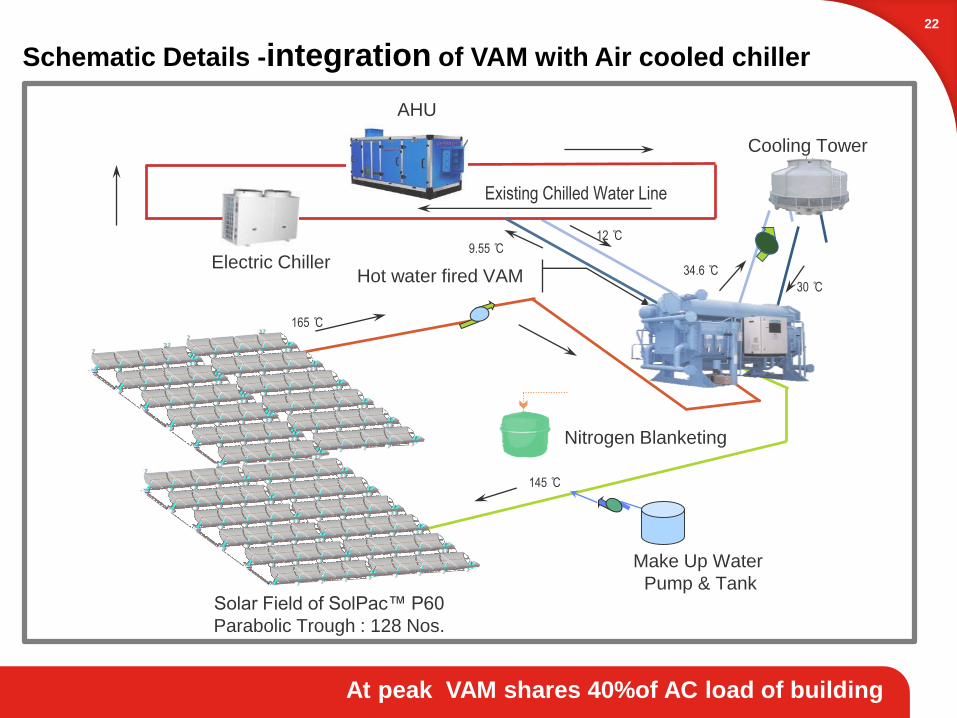
Schematic Details -integration of VAM with Air cooled chiller
At peak VAM shares 40%of AC load of building
22
145 ̊C
30 ̊C
12 ̊C9.55 ̊C
Hot water fired VAM
Cooling Tower
Make Up Water
Pump & TankSolar Field of SolPac™ P60
Parabolic Trough : 128 Nos.
Nitrogen Blanketing
165 ̊C
34.6 ̊C
Existing Chilled Water Line
Electric Chiller
AHU
23
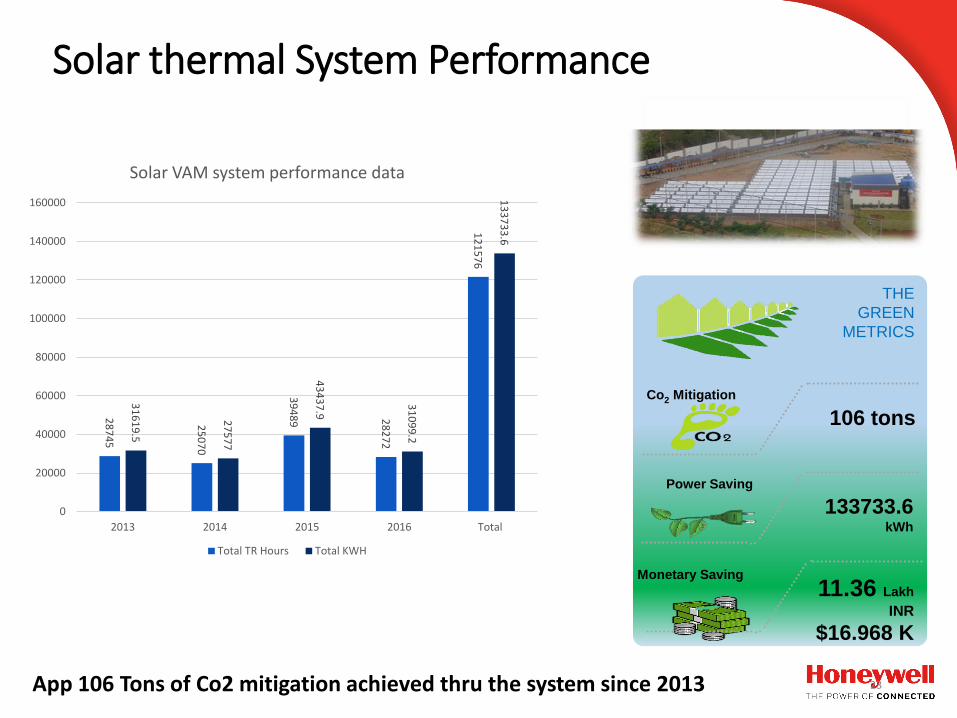
THE
GREEN
METRICS
106 tons
11.36 Lakh
INR
$16.968 K
Co2 Mitigation
Monetary Saving
133733.6kWh
Power Saving
Solar thermal System Performance
28
74
5
25
07
0
39
48
9 28
27
2
12
15
76
31
61
9.5
27
57
7
43
43
7.9
31
09
9.2
13
37
33
.6
0
20000
40000
60000
80000
100000
120000
140000
160000
2013 2014 2015 2016 Total
Solar VAM system performance data
Total TR Hours Total KWH
App 106 Tons of Co2 mitigation achieved thru the system since 2013

24Total 269 running hours of Air Cooled chiller avoided since last 2 years
469.06…
631TRH
1106TRH
AC Load sharing TRH on Dt 7th Feb 2017
VAM Air Cooled Total load
VAM
Air CooledChiller
Load sharing details of existing chiller
Months
2015 Actual TR
Hour
2016 Actual TR
Hour
2017 Actual TR
HourTarget TRH
chiller running hrs. avoidance
Jan 5776.5 0 1046 15517Feb 7975.8 5287.4 5505.01 13380Mar 5440.4 5654.8 2442.01 13661Apr 5189.18 4422 0 12246May 4925.27 5103 0 9640Jun 0 0 0 4192Jul 1293 0 0 0
Aug 284.39 0 0Sep 1267.7 0 3708Oct 1856.18 1783 8997Nov 2127 4286 10322Dec 3354 1736 12463Total 39489.42 28272.2 8993.02

25
NABERS
Global SEC
26
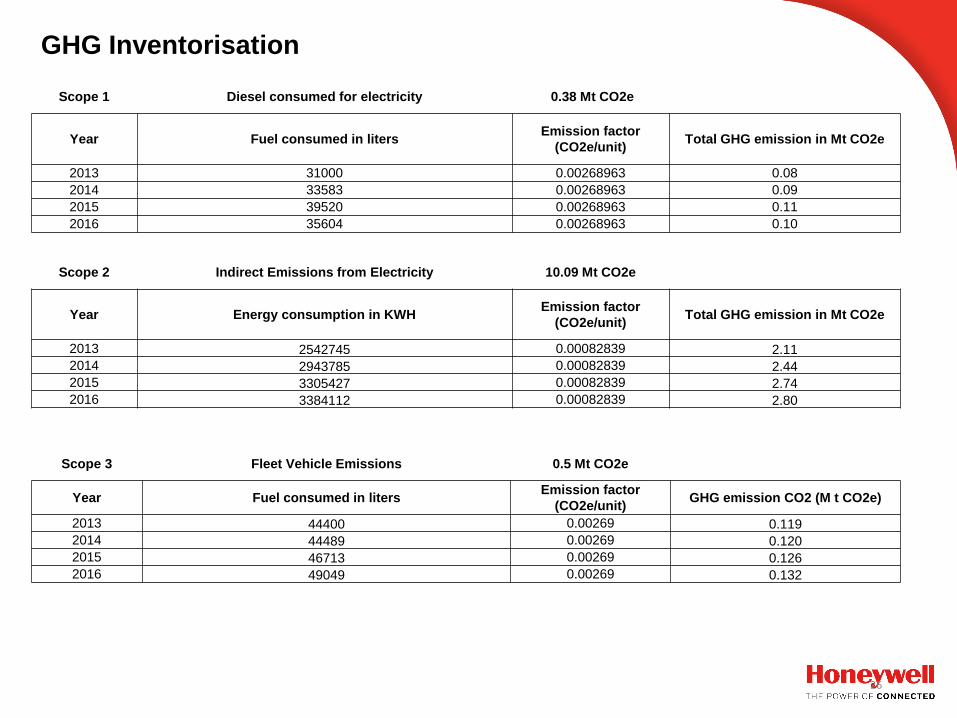
Scope 1 Diesel consumed for electricity 0.38 Mt CO2e
Year Fuel consumed in litersEmission factor
(CO2e/unit)Total GHG emission in Mt CO2e
2013 31000 0.00268963 0.08
2014 33583 0.00268963 0.09
2015 39520 0.00268963 0.11
2016 35604 0.00268963 0.10
Scope 2 Indirect Emissions from Electricity 10.09 Mt CO2e
Year Energy consumption in KWHEmission factor
(CO2e/unit)Total GHG emission in Mt CO2e
2013 2542745 0.00082839 2.11
2014 2943785 0.00082839 2.44
2015 3305427 0.00082839 2.74
2016 3384112 0.00082839 2.80
Scope 3 Fleet Vehicle Emissions 0.5 Mt CO2e
Year Fuel consumed in litersEmission factor
(CO2e/unit)GHG emission CO2 (M t CO2e)
2013 44400 0.00269 0.119
2014 44489 0.00269 0.120
2015 46713 0.00269 0.126
2016 49049 0.00269 0.132
GHG Inventorisation
Honeywell Confidential - © 2017 by Honeywell International Inc. All rights reserved.
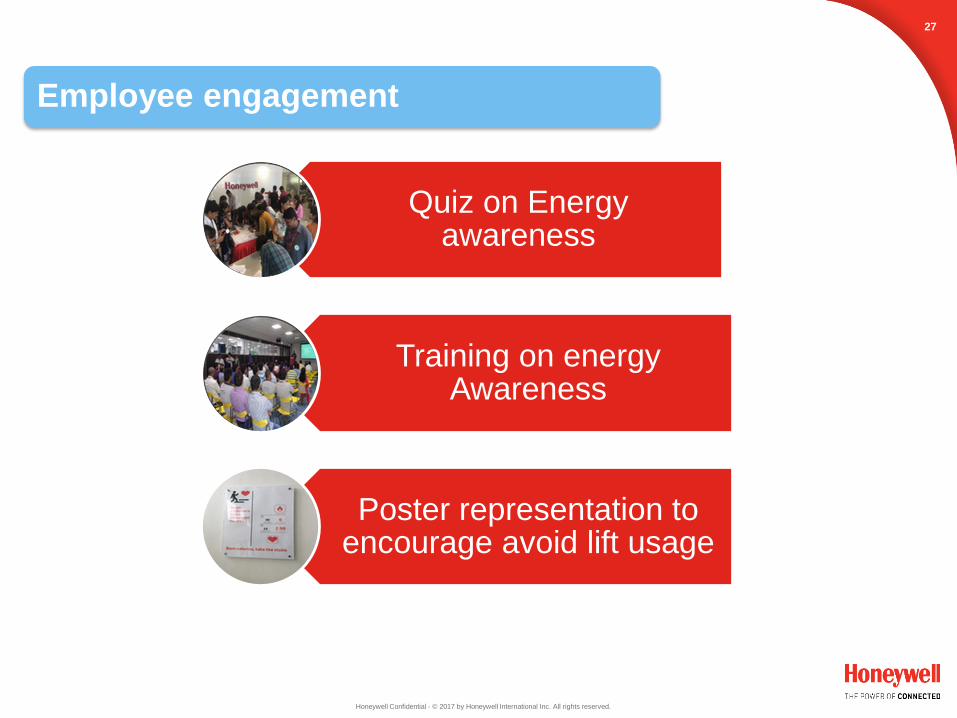
Employee engagement
27
Safety week quiz
Ergo workout session
Stress management
ERT Training
First aid training
Health talk
Quiz on Energy awareness
Training on energy Awareness
Poster representation to encourage avoid lift usage
Honeywell Confidential - © 2017 by Honeywell International Inc. All rights reserved.
© 2015 by Honeywell International Inc. All rights reserved.
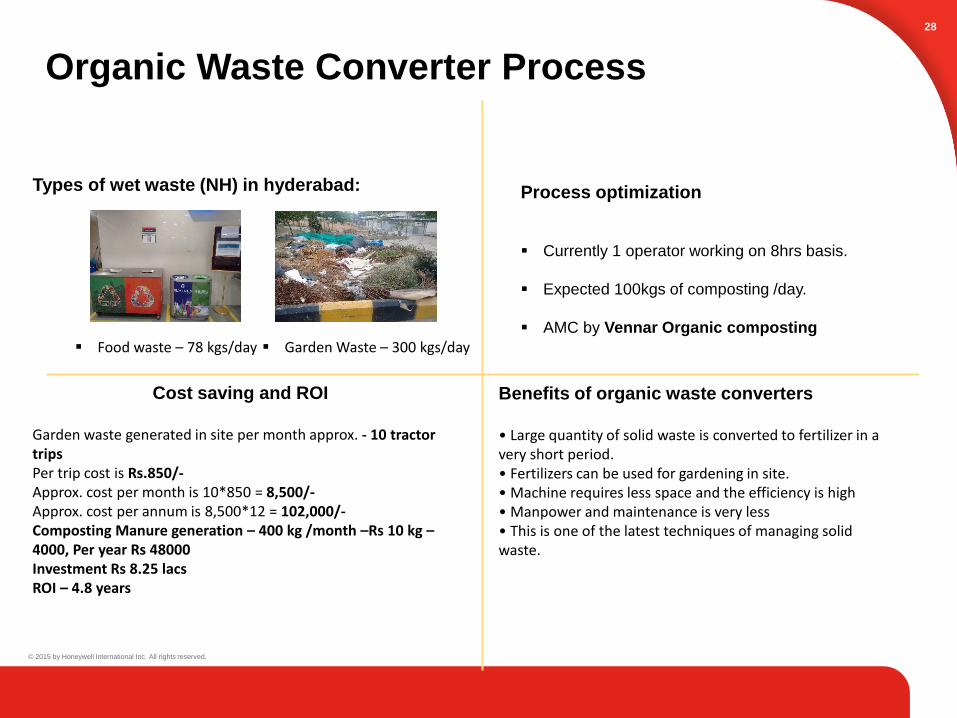
Organic Waste Converter Process
28
Types of wet waste (NH) in hyderabad: Process optimization
Currently 1 operator working on 8hrs basis.
Expected 100kgs of composting /day.
AMC by Vennar Organic composting
Food waste – 78 kgs/day Garden Waste – 300 kgs/day
Cost saving and ROI
Garden waste generated in site per month approx. - 10 tractor tripsPer trip cost is Rs.850/-Approx. cost per month is 10*850 = 8,500/-Approx. cost per annum is 8,500*12 = 102,000/-Composting Manure generation – 400 kg /month –Rs 10 kg –4000, Per year Rs 48000Investment Rs 8.25 lacsROI – 4.8 years
Benefits of organic waste converters
• Large quantity of solid waste is converted to fertilizer in a very short period. • Fertilizers can be used for gardening in site.• Machine requires less space and the efficiency is high • Manpower and maintenance is very less • This is one of the latest techniques of managing solid waste.

Honeywell Confidential - © 2017 by Honeywell International Inc. All rights reserved.
Awards and Recognition- HTS India - Hyderabad
29
Best Development Centre for HTS,
Hyderabad by Hyderabad Software
Enterprises Association, India
Solar Thermal System Installation
recognition for best
demonstration project HTS,
Hyderabad campus
Energy Efficient Unit
Certification By CII for HTS,
Hyderabad campus in the year
2016
Honeywell HYD Wins Best
CSR award at 25th HYSEA
Awards;
HTS HYD wins The golden Peacock
Award in the Event of 19th July 2017
World Congress Environmental.

Honeywell Confidential - © 2017 by Honeywell International Inc. All rights reserved.
30
Honeywell is building a smarter, safer,
and more sustainable world.
THAT’S THE POWER OF CONNECTED.
THAT’S THE POWER OF HONEYWELL.
Connected Aircraft | Connected Automobile | Connected Home | Connected BuildingConnected Plant | Connected Supply Chain | Connected Worker
This document contains certain statements that may be deemed “forward-looking statements” within the meaning of Section 21E of the Securities Exchange Act of 1934. All statements, other than statements of historical fact, that address activities, events or developments that we or our management intends, expects, projects, believes or anticipates
will or may occur in the future are forward-looking statements. Such statements are based upon certain assumptions and assessments made by our management in light of their experience and their perception of historical trends, current economic and industry conditions, expected future developments and other factors they believe to be appropriate.
The forward-looking statements included in this release are also subject to a number of material risks and uncertainties, including but not limited to economic, competitive, governmental, and technological factors affecting our operations, markets, products, services and prices. Such forward-looking statements are not guarantees of future performance,
and actual results, developments and business decisions may differ from those envisaged by such forward-looking statements. We identify the principal risks and uncertainties that affect our performance in our Form 10-K and other filings with the Securities and Exchange Commission.