appendix g. load duration curves - ohio epa river and bay tributaries appendix g nutrient and...
TRANSCRIPT
Appendix G.
Load Duration Curves
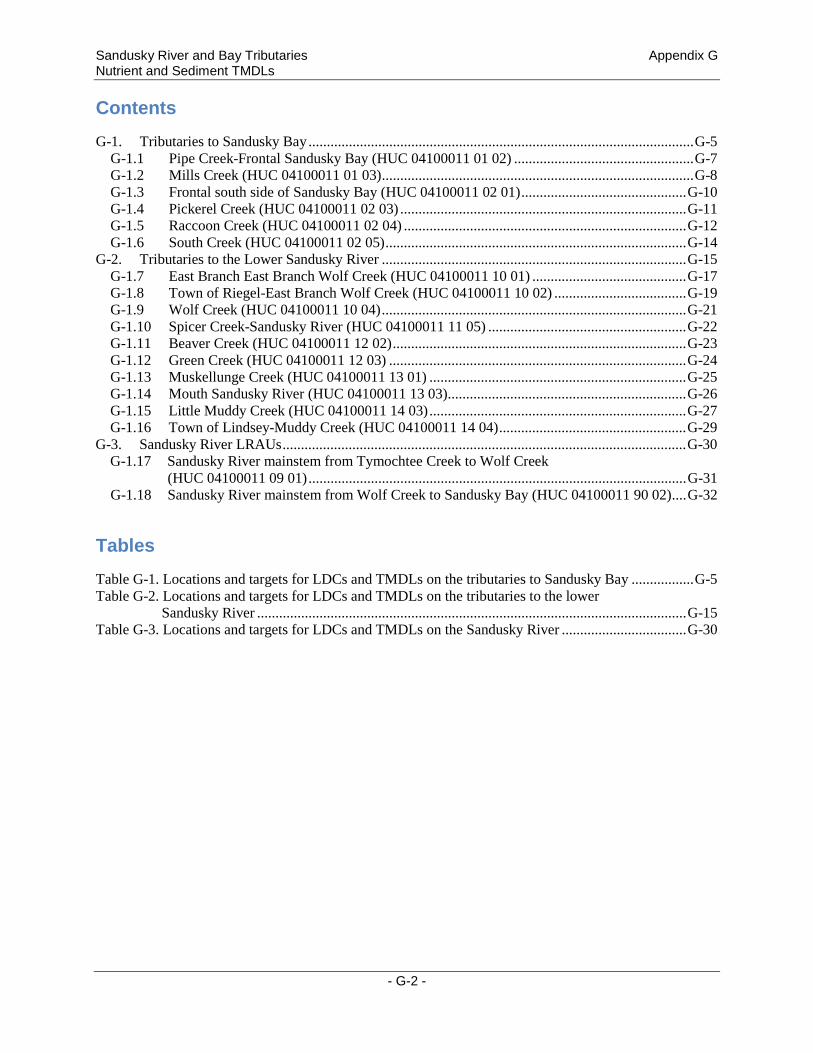
Sandusky River and Bay Tributaries Appendix G Nutrient and Sediment TMDLs Contents G-1. Tributaries to Sandusky Bay ......................................................................................................... G-5
G-1.1 Pipe Creek-Frontal Sandusky Bay (HUC 04100011 01 02) ................................................. G-7 G-1.2 Mills Creek (HUC 04100011 01 03) ..................................................................................... G-8 G-1.3 Frontal south side of Sandusky Bay (HUC 04100011 02 01) ............................................. G-10 G-1.4 Pickerel Creek (HUC 04100011 02 03) .............................................................................. G-11 G-1.5 Raccoon Creek (HUC 04100011 02 04) ............................................................................. G-12 G-1.6 South Creek (HUC 04100011 02 05) .................................................................................. G-14
G-2. Tributaries to the Lower Sandusky River ................................................................................... G-15 G-1.7 East Branch East Branch Wolf Creek (HUC 04100011 10 01) .......................................... G-17 G-1.8 Town of Riegel-East Branch Wolf Creek (HUC 04100011 10 02) .................................... G-19 G-1.9 Wolf Creek (HUC 04100011 10 04) ................................................................................... G-21 G-1.10 Spicer Creek-Sandusky River (HUC 04100011 11 05) ...................................................... G-22 G-1.11 Beaver Creek (HUC 04100011 12 02) ................................................................................ G-23 G-1.12 Green Creek (HUC 04100011 12 03) ................................................................................. G-24 G-1.13 Muskellunge Creek (HUC 04100011 13 01) ...................................................................... G-25 G-1.14 Mouth Sandusky River (HUC 04100011 13 03) ................................................................. G-26 G-1.15 Little Muddy Creek (HUC 04100011 14 03) ...................................................................... G-27 G-1.16 Town of Lindsey-Muddy Creek (HUC 04100011 14 04) ................................................... G-29
G-3. Sandusky River LRAUs .............................................................................................................. G-30 G-1.17 Sandusky River mainstem from Tymochtee Creek to Wolf Creek (HUC 04100011 09 01) ....................................................................................................... G-31 G-1.18 Sandusky River mainstem from Wolf Creek to Sandusky Bay (HUC 04100011 90 02) .... G-32
Tables Table G-1. Locations and targets for LDCs and TMDLs on the tributaries to Sandusky Bay ................. G-5 Table G-2. Locations and targets for LDCs and TMDLs on the tributaries to the lower Sandusky River ..................................................................................................................... G-15 Table G-3. Locations and targets for LDCs and TMDLs on the Sandusky River .................................. G-30
- G-2 -
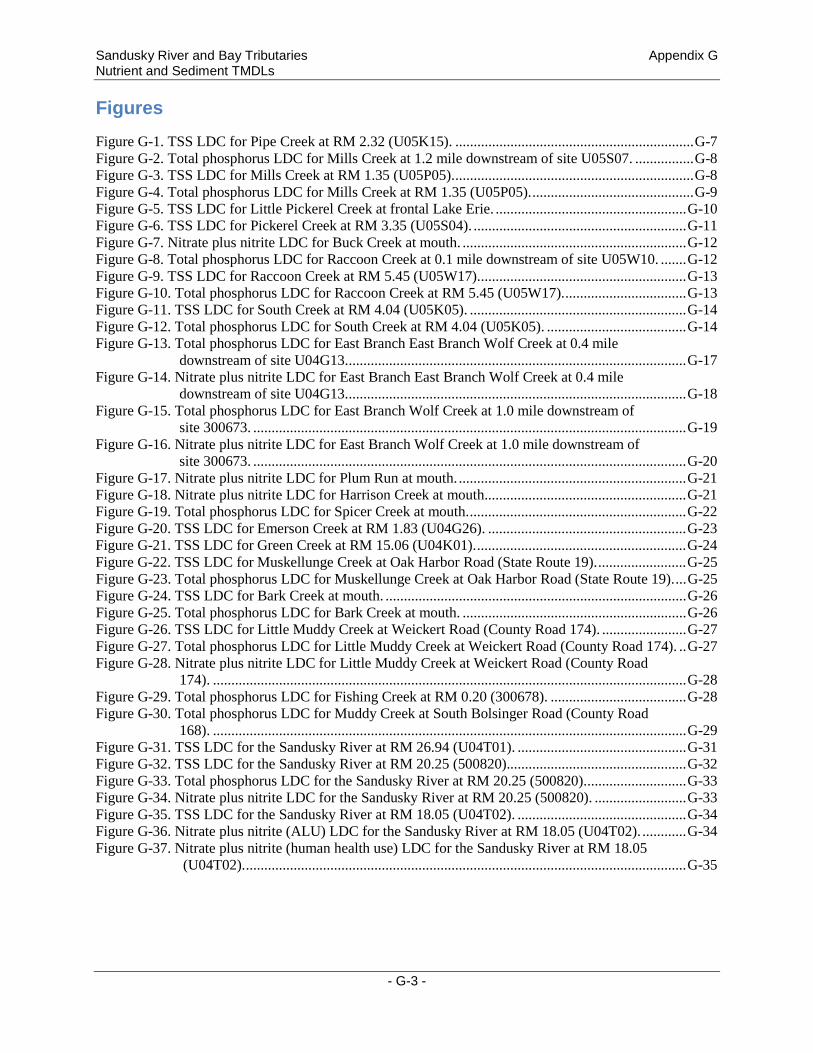
Sandusky River and Bay Tributaries Appendix G Nutrient and Sediment TMDLs Figures Figure G-1. TSS LDC for Pipe Creek at RM 2.32 (U05K15). ................................................................. G-7 Figure G-2. Total phosphorus LDC for Mills Creek at 1.2 mile downstream of site U05S07. ................ G-8 Figure G-3. TSS LDC for Mills Creek at RM 1.35 (U05P05). ................................................................. G-8 Figure G-4. Total phosphorus LDC for Mills Creek at RM 1.35 (U05P05). ............................................ G-9 Figure G-5. TSS LDC for Little Pickerel Creek at frontal Lake Erie. .................................................... G-10 Figure G-6. TSS LDC for Pickerel Creek at RM 3.35 (U05S04). .......................................................... G-11 Figure G-7. Nitrate plus nitrite LDC for Buck Creek at mouth. ............................................................. G-12 Figure G-8. Total phosphorus LDC for Raccoon Creek at 0.1 mile downstream of site U05W10. ....... G-12 Figure G-9. TSS LDC for Raccoon Creek at RM 5.45 (U05W17). ........................................................ G-13 Figure G-10. Total phosphorus LDC for Raccoon Creek at RM 5.45 (U05W17). ................................. G-13 Figure G-11. TSS LDC for South Creek at RM 4.04 (U05K05). ........................................................... G-14 Figure G-12. Total phosphorus LDC for South Creek at RM 4.04 (U05K05). ...................................... G-14 Figure G-13. Total phosphorus LDC for East Branch East Branch Wolf Creek at 0.4 mile downstream of site U04G13. ............................................................................................ G-17 Figure G-14. Nitrate plus nitrite LDC for East Branch East Branch Wolf Creek at 0.4 mile downstream of site U04G13. ............................................................................................ G-18 Figure G-15. Total phosphorus LDC for East Branch Wolf Creek at 1.0 mile downstream of site 300673. ...................................................................................................................... G-19 Figure G-16. Nitrate plus nitrite LDC for East Branch Wolf Creek at 1.0 mile downstream of site 300673. ...................................................................................................................... G-20 Figure G-17. Nitrate plus nitrite LDC for Plum Run at mouth. .............................................................. G-21 Figure G-18. Nitrate plus nitrite LDC for Harrison Creek at mouth....................................................... G-21 Figure G-19. Total phosphorus LDC for Spicer Creek at mouth. ........................................................... G-22 Figure G-20. TSS LDC for Emerson Creek at RM 1.83 (U04G26). ...................................................... G-23 Figure G-21. TSS LDC for Green Creek at RM 15.06 (U04K01). ......................................................... G-24 Figure G-22. TSS LDC for Muskellunge Creek at Oak Harbor Road (State Route 19). ........................ G-25 Figure G-23. Total phosphorus LDC for Muskellunge Creek at Oak Harbor Road (State Route 19). ... G-25 Figure G-24. TSS LDC for Bark Creek at mouth. .................................................................................. G-26 Figure G-25. Total phosphorus LDC for Bark Creek at mouth. ............................................................. G-26 Figure G-26. TSS LDC for Little Muddy Creek at Weickert Road (County Road 174). ....................... G-27 Figure G-27. Total phosphorus LDC for Little Muddy Creek at Weickert Road (County Road 174). .. G-27 Figure G-28. Nitrate plus nitrite LDC for Little Muddy Creek at Weickert Road (County Road 174). ................................................................................................................................. G-28 Figure G-29. Total phosphorus LDC for Fishing Creek at RM 0.20 (300678). ..................................... G-28 Figure G-30. Total phosphorus LDC for Muddy Creek at South Bolsinger Road (County Road 168). ................................................................................................................................. G-29 Figure G-31. TSS LDC for the Sandusky River at RM 26.94 (U04T01). .............................................. G-31 Figure G-32. TSS LDC for the Sandusky River at RM 20.25 (500820)................................................. G-32 Figure G-33. Total phosphorus LDC for the Sandusky River at RM 20.25 (500820). ........................... G-33 Figure G-34. Nitrate plus nitrite LDC for the Sandusky River at RM 20.25 (500820). ......................... G-33 Figure G-35. TSS LDC for the Sandusky River at RM 18.05 (U04T02). .............................................. G-34 Figure G-36. Nitrate plus nitrite (ALU) LDC for the Sandusky River at RM 18.05 (U04T02). ............ G-34 Figure G-37. Nitrate plus nitrite (human health use) LDC for the Sandusky River at RM 18.05 (U04T02). ........................................................................................................................ G-35
- G-3 -
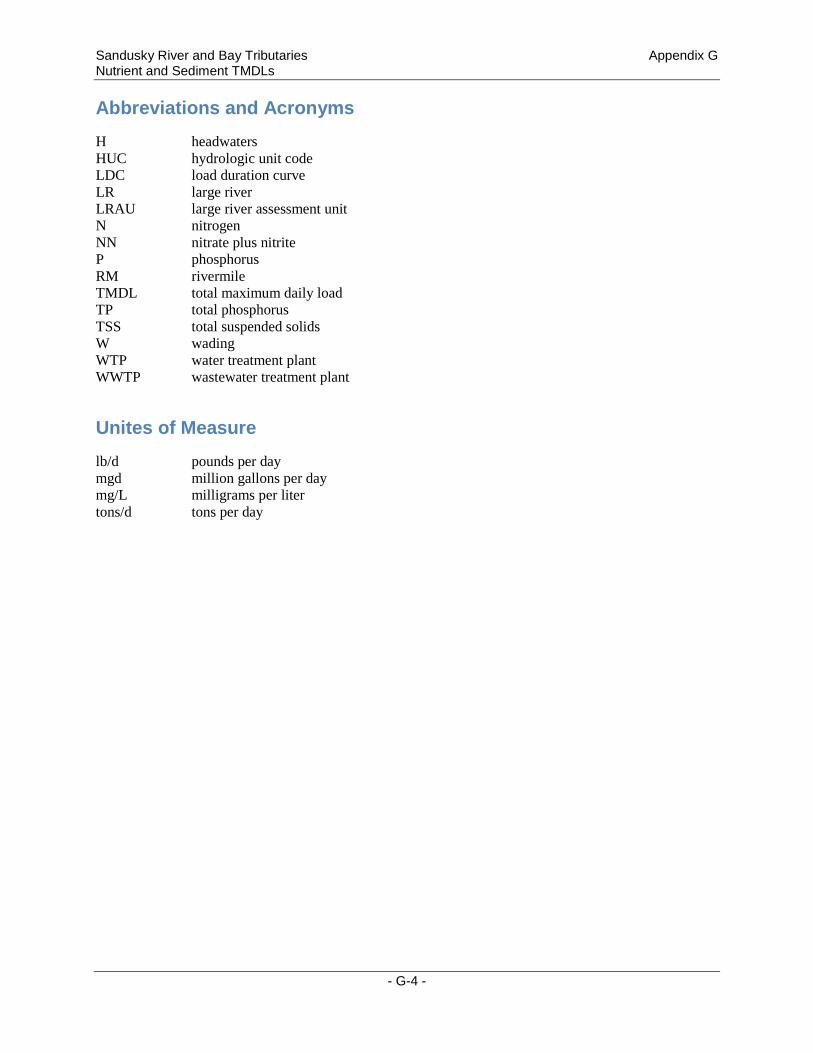
Sandusky River and Bay Tributaries Appendix G Nutrient and Sediment TMDLs Abbreviations and Acronyms H headwaters HUC hydrologic unit code LDC load duration curve LR large river LRAU large river assessment unit N nitrogen NN nitrate plus nitrite P phosphorus RM rivermile TMDL total maximum daily load TP total phosphorus TSS total suspended solids W wading WTP water treatment plant WWTP wastewater treatment plant
Unites of Measure lb/d pounds per day mgd million gallons per day mg/L milligrams per liter tons/d tons per day
- G-4 -
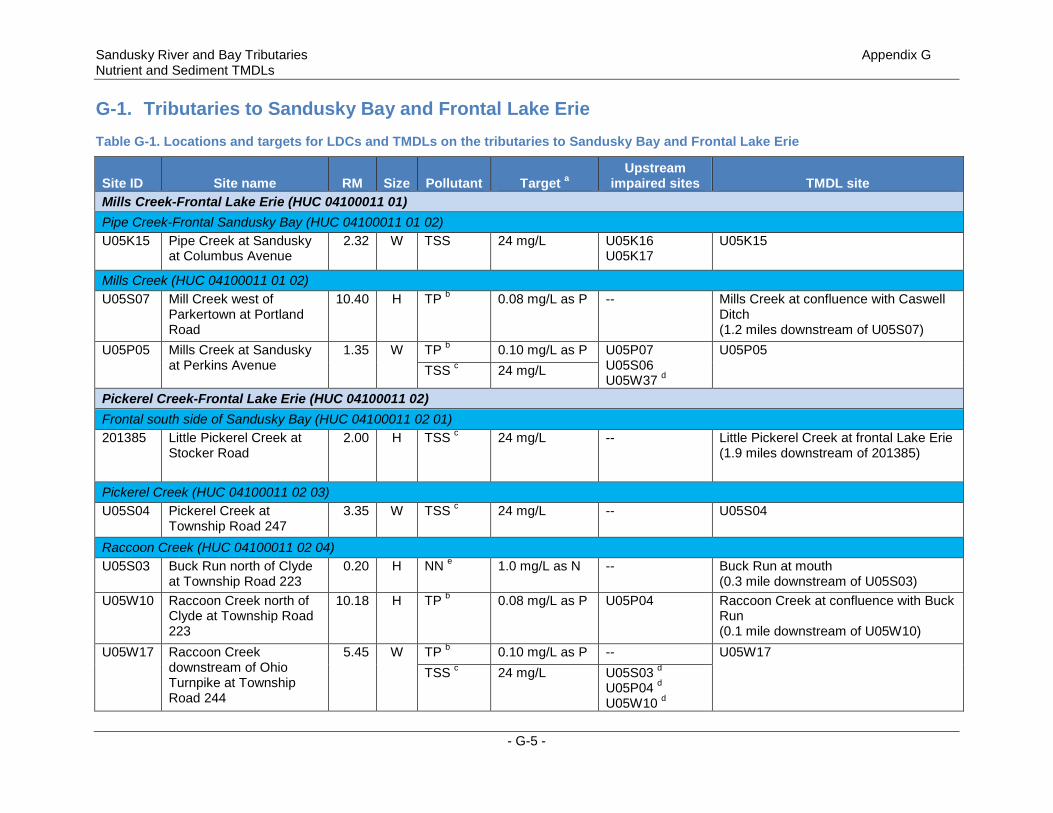
Sandusky River and Bay Tributaries Appendix G Nutrient and Sediment TMDLs G-1. Tributaries to Sandusky Bay and Frontal Lake Erie Table G-1. Locations and targets for LDCs and TMDLs on the tributaries to Sandusky Bay and Frontal Lake Erie
Site ID Site name RM Size Pollutant Target a Upstream
impaired sites TMDL site Mills Creek-Frontal Lake Erie (HUC 04100011 01) Pipe Creek-Frontal Sandusky Bay (HUC 04100011 01 02) U05K15 Pipe Creek at Sandusky
at Columbus Avenue 2.32 W TSS 24 mg/L U05K16
U05K17 U05K15
Mills Creek (HUC 04100011 01 02) U05S07 Mill Creek west of
Parkertown at Portland Road
10.40 H TP b 0.08 mg/L as P -- Mills Creek at confluence with Caswell Ditch (1.2 miles downstream of U05S07)
U05P05 Mills Creek at Sandusky at Perkins Avenue
1.35 W TP b 0.10 mg/L as P U05P07 U05S06 U05W37 d
U05P05 TSS c 24 mg/L
Pickerel Creek-Frontal Lake Erie (HUC 04100011 02) Frontal south side of Sandusky Bay (HUC 04100011 02 01) 201385 Little Pickerel Creek at
Stocker Road 2.00 H TSS c 24 mg/L -- Little Pickerel Creek at frontal Lake Erie
(1.9 miles downstream of 201385)
Pickerel Creek (HUC 04100011 02 03) U05S04 Pickerel Creek at
Township Road 247 3.35 W TSS c 24 mg/L -- U05S04
Raccoon Creek (HUC 04100011 02 04) U05S03 Buck Run north of Clyde
at Township Road 223 0.20 H NN e 1.0 mg/L as N -- Buck Run at mouth
(0.3 mile downstream of U05S03) U05W10 Raccoon Creek north of
Clyde at Township Road 223
10.18 H TP b 0.08 mg/L as P U05P04 Raccoon Creek at confluence with Buck Run (0.1 mile downstream of U05W10)
U05W17 Raccoon Creek downstream of Ohio Turnpike at Township Road 244
5.45 W TP b 0.10 mg/L as P -- U05W17 TSS c 24 mg/L U05S03 d
U05P04 d U05W10 d
- G-5 -
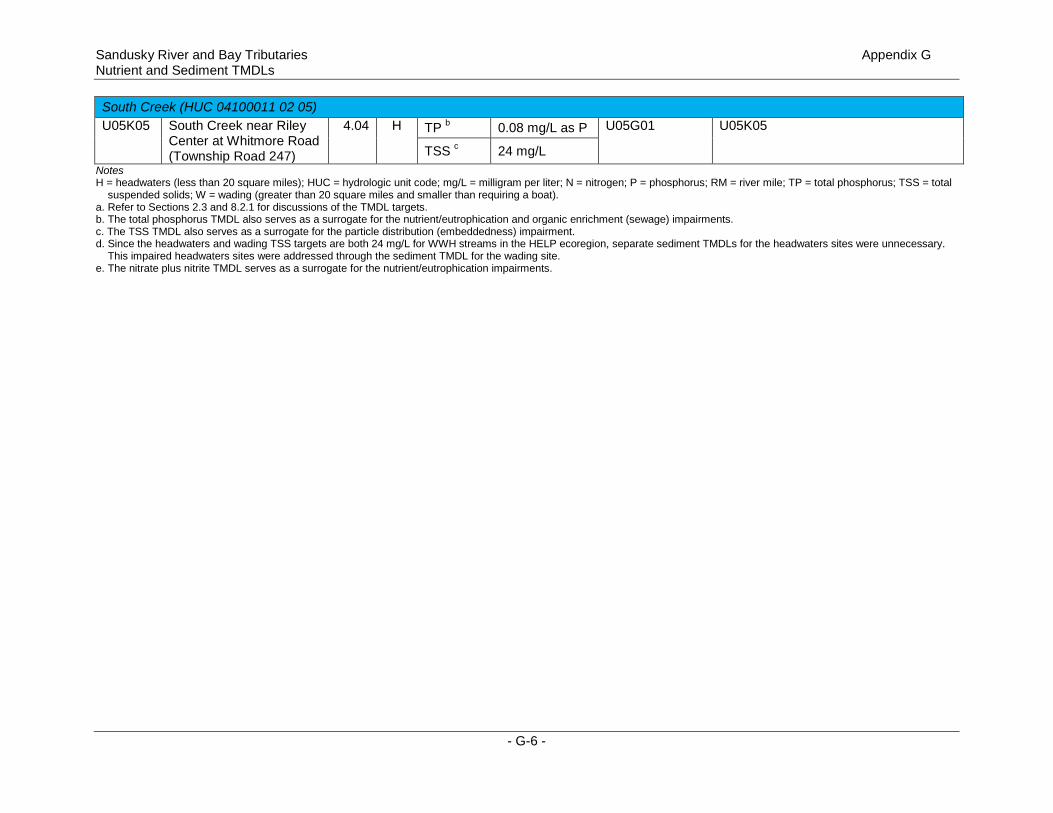
Sandusky River and Bay Tributaries Appendix G Nutrient and Sediment TMDLs South Creek (HUC 04100011 02 05) U05K05 South Creek near Riley
Center at Whitmore Road (Township Road 247)
4.04 H TP b 0.08 mg/L as P U05G01 U05K05
TSS c 24 mg/L Notes H = headwaters (less than 20 square miles); HUC = hydrologic unit code; mg/L = milligram per liter; N = nitrogen; P = phosphorus; RM = river mile; TP = total phosphorus; TSS = total
suspended solids; W = wading (greater than 20 square miles and smaller than requiring a boat). a. Refer to Sections 2.3 and 8.2.1 for discussions of the TMDL targets. b. The total phosphorus TMDL also serves as a surrogate for the nutrient/eutrophication and organic enrichment (sewage) impairments. c. The TSS TMDL also serves as a surrogate for the particle distribution (embeddedness) impairment. d. Since the headwaters and wading TSS targets are both 24 mg/L for WWH streams in the HELP ecoregion, separate sediment TMDLs for the headwaters sites were unnecessary.
This impaired headwaters sites were addressed through the sediment TMDL for the wading site. e. The nitrate plus nitrite TMDL serves as a surrogate for the nutrient/eutrophication impairments.
- G-6 -
Sandusky River and Bay Tributaries Nutrient and Sediment TMDLs
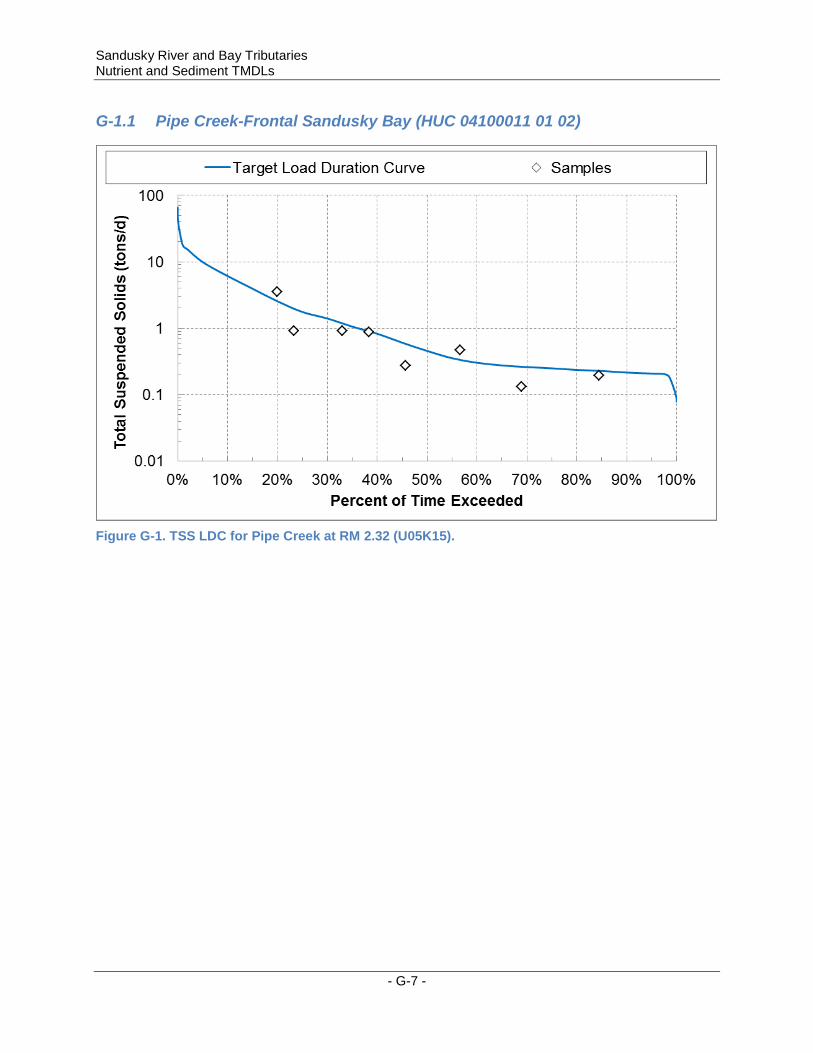
G-1.1 Pipe Creek-Frontal Sandusky Bay (HUC 04100011 01 02)
Figure G-1. TSS LDC for Pipe Creek at RM 2.32 (U05K15).
- G-7 -
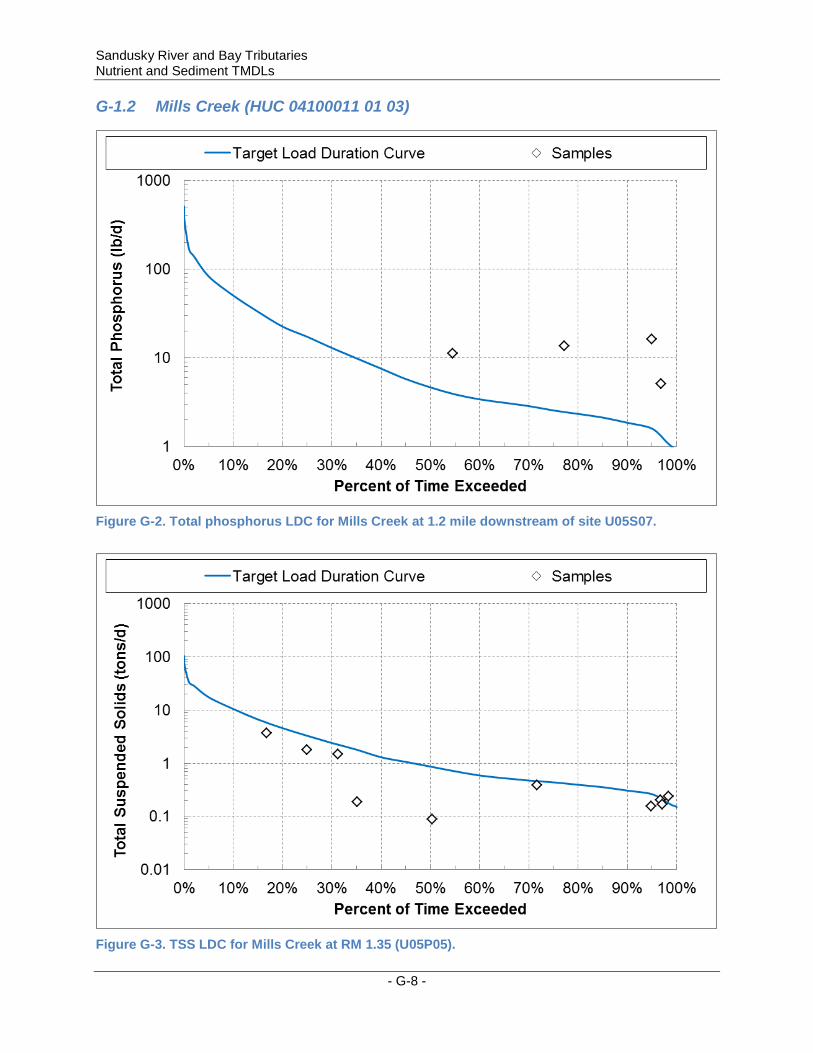
Sandusky River and Bay Tributaries Nutrient and Sediment TMDLs G-1.2 Mills Creek (HUC 04100011 01 03)
Figure G-2. Total phosphorus LDC for Mills Creek at 1.2 mile downstream of site U05S07.
Figure G-3. TSS LDC for Mills Creek at RM 1.35 (U05P05).
- G-8 -
Sandusky River and Bay Tributaries Nutrient and Sediment TMDLs
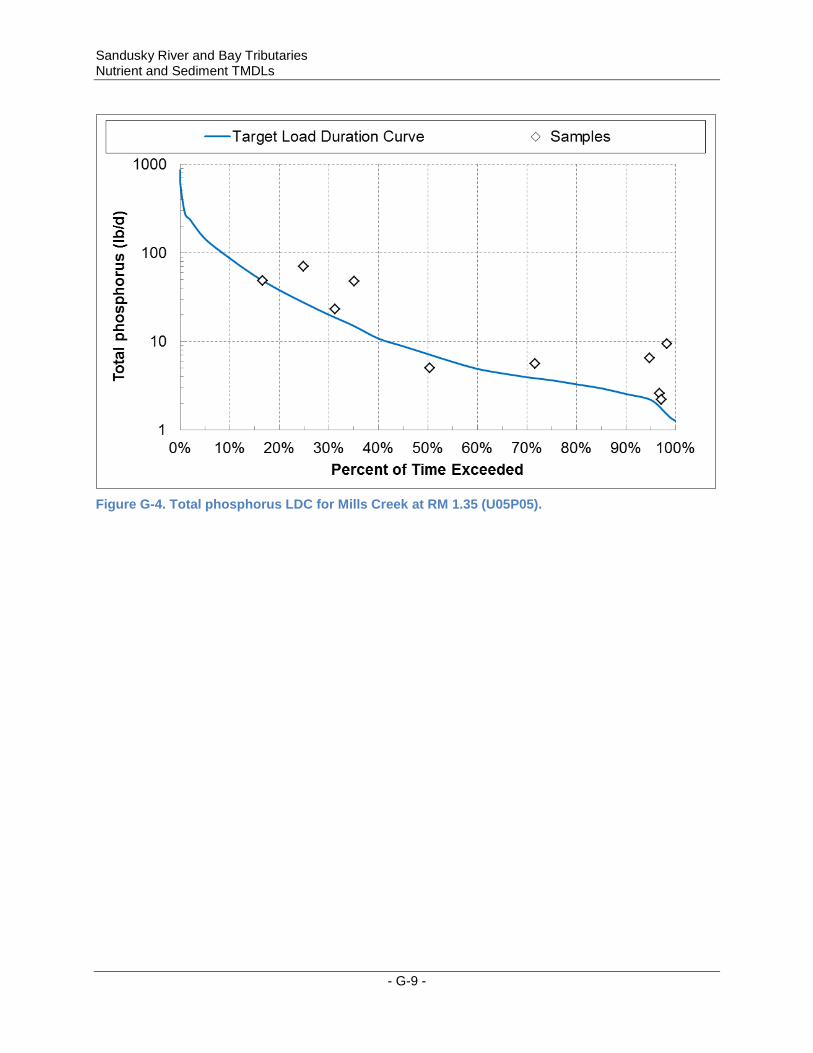
Figure G-4. Total phosphorus LDC for Mills Creek at RM 1.35 (U05P05).
- G-9 -
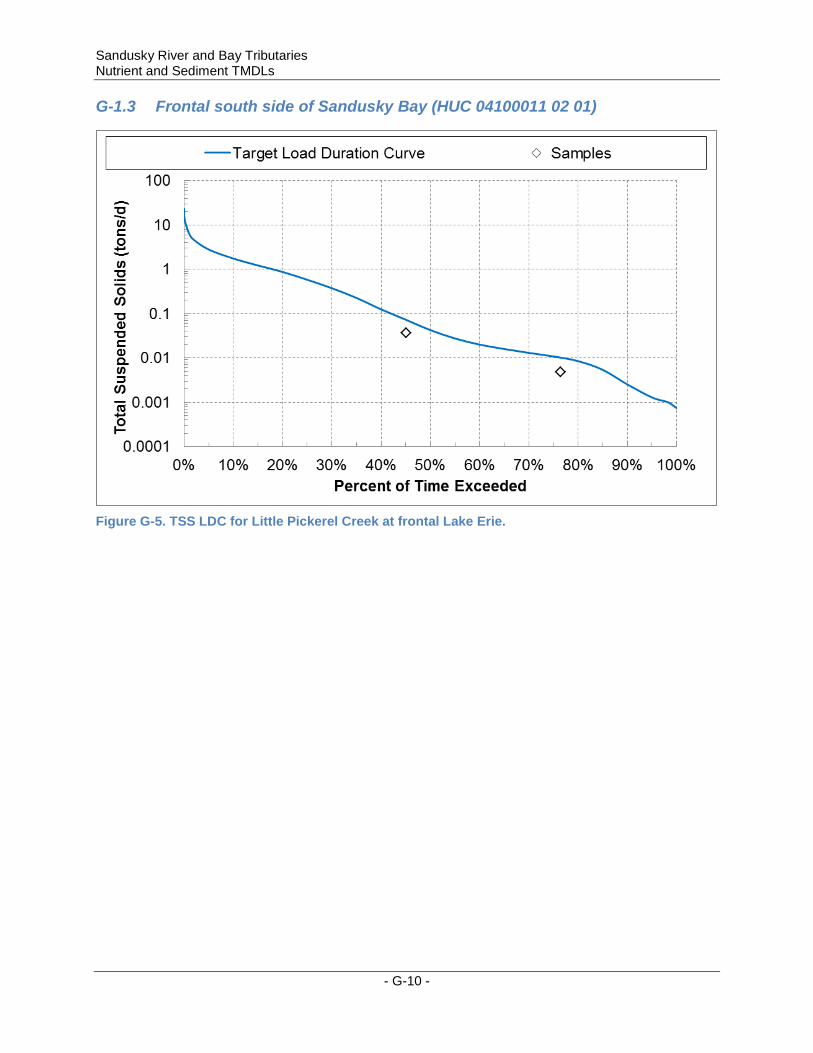
Sandusky River and Bay Tributaries Nutrient and Sediment TMDLs G-1.3 Frontal south side of Sandusky Bay (HUC 04100011 02 01)
Figure G-5. TSS LDC for Little Pickerel Creek at frontal Lake Erie.
- G-10 -
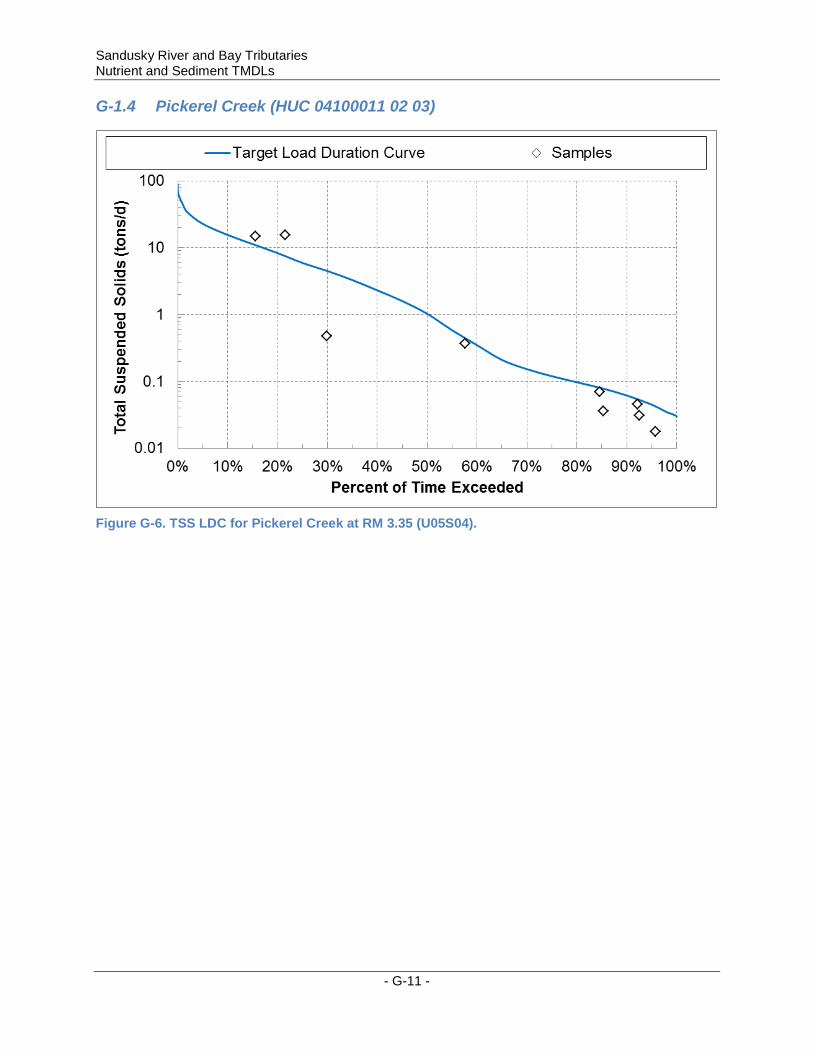
Sandusky River and Bay Tributaries Nutrient and Sediment TMDLs G-1.4 Pickerel Creek (HUC 04100011 02 03)
Figure G-6. TSS LDC for Pickerel Creek at RM 3.35 (U05S04).
- G-11 -
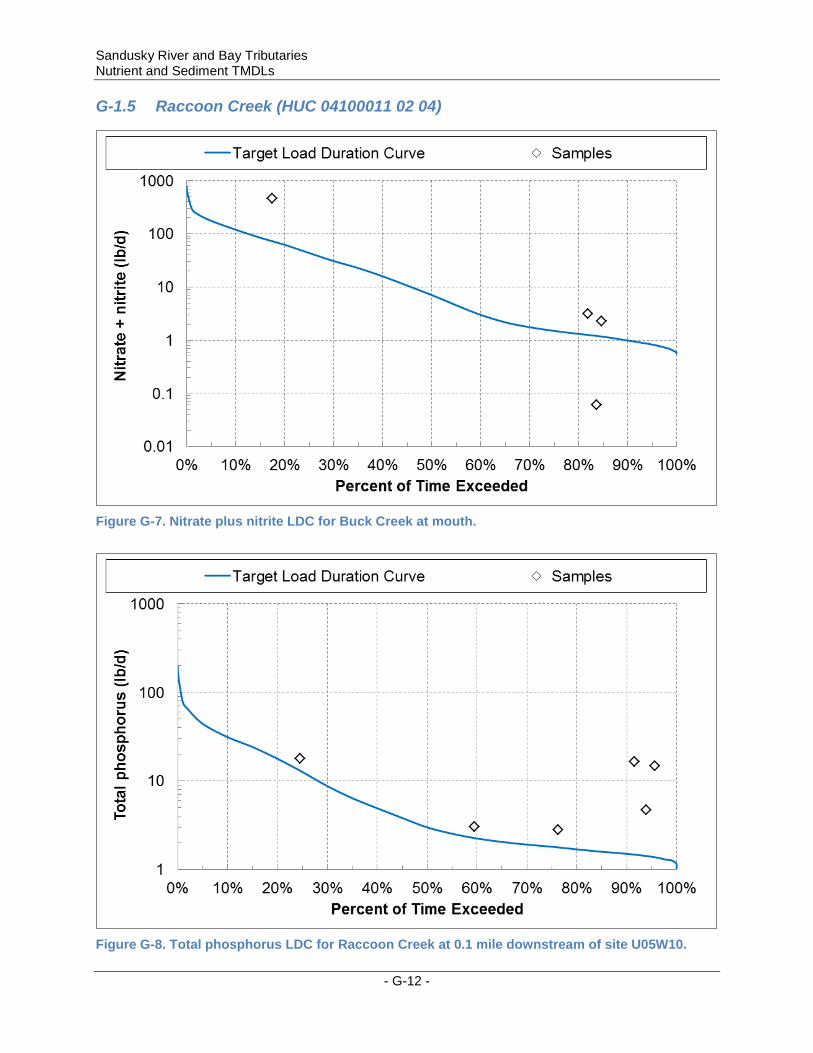
Sandusky River and Bay Tributaries Nutrient and Sediment TMDLs G-1.5 Raccoon Creek (HUC 04100011 02 04)
Figure G-7. Nitrate plus nitrite LDC for Buck Creek at mouth.
Figure G-8. Total phosphorus LDC for Raccoon Creek at 0.1 mile downstream of site U05W10.
- G-12 -
Sandusky River and Bay Tributaries Nutrient and Sediment TMDLs
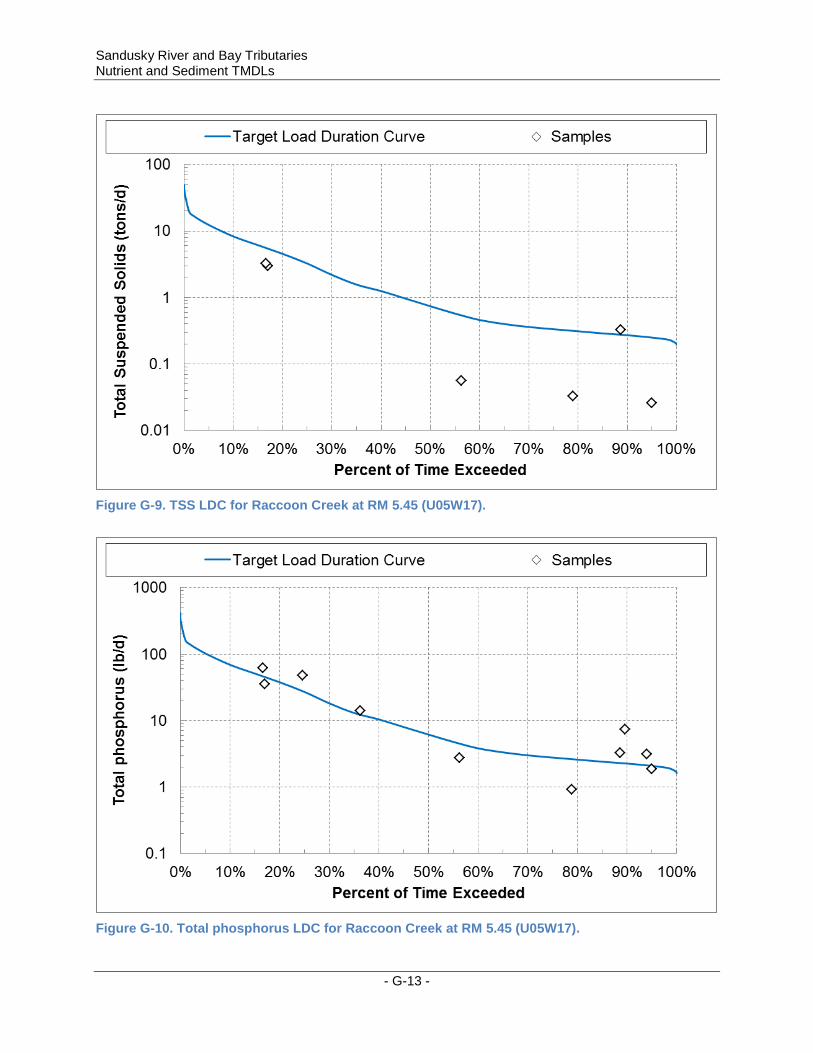
Figure G-9. TSS LDC for Raccoon Creek at RM 5.45 (U05W17).
Figure G-10. Total phosphorus LDC for Raccoon Creek at RM 5.45 (U05W17).
- G-13 -
Sandusky River and Bay Tributaries Nutrient and Sediment TMDLs G-1.6 South Creek (HUC 04100011 02 05)
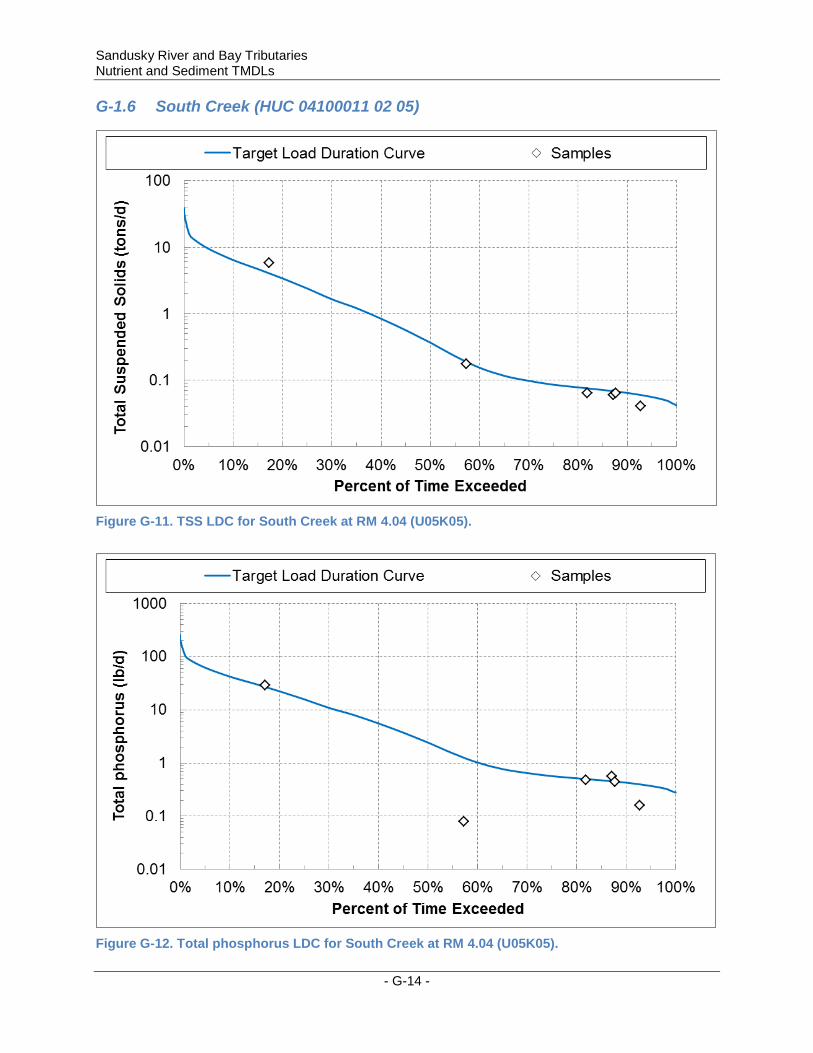
Figure G-11. TSS LDC for South Creek at RM 4.04 (U05K05).
Figure G-12. Total phosphorus LDC for South Creek at RM 4.04 (U05K05).
- G-14 -
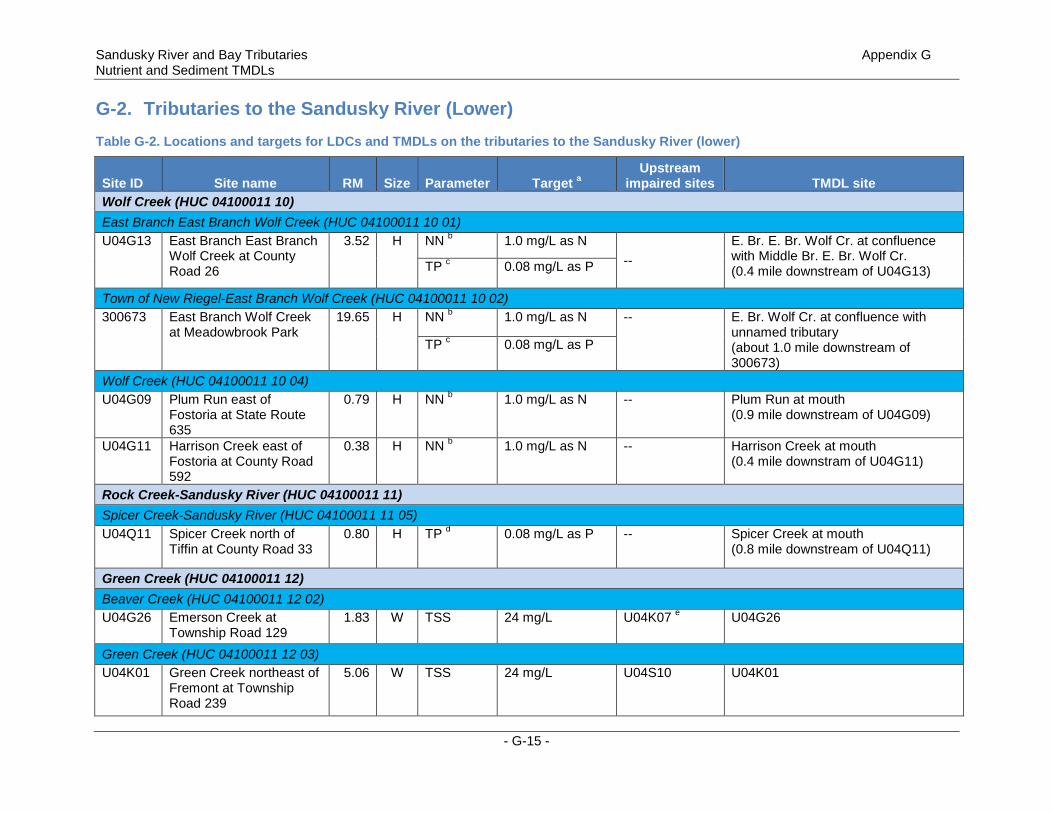
Sandusky River and Bay Tributaries Appendix G Nutrient and Sediment TMDLs G-2. Tributaries to the Sandusky River (Lower) Table G-2. Locations and targets for LDCs and TMDLs on the tributaries to the Sandusky River (lower)
Site ID Site name RM Size Parameter Target a Upstream
impaired sites TMDL site Wolf Creek (HUC 04100011 10) East Branch East Branch Wolf Creek (HUC 04100011 10 01) U04G13 East Branch East Branch
Wolf Creek at County Road 26
3.52 H NN b 1.0 mg/L as N --
E. Br. E. Br. Wolf Cr. at confluence with Middle Br. E. Br. Wolf Cr. (0.4 mile downstream of U04G13) TP c 0.08 mg/L as P
Town of New Riegel-East Branch Wolf Creek (HUC 04100011 10 02) 300673 East Branch Wolf Creek
at Meadowbrook Park 19.65 H NN b 1.0 mg/L as N -- E. Br. Wolf Cr. at confluence with
unnamed tributary (about 1.0 mile downstream of 300673)
TP c 0.08 mg/L as P
Wolf Creek (HUC 04100011 10 04) U04G09 Plum Run east of
Fostoria at State Route 635
0.79 H NN b 1.0 mg/L as N -- Plum Run at mouth (0.9 mile downstream of U04G09)
U04G11 Harrison Creek east of Fostoria at County Road 592
0.38 H NN b 1.0 mg/L as N -- Harrison Creek at mouth (0.4 mile downstram of U04G11)
Rock Creek-Sandusky River (HUC 04100011 11) Spicer Creek-Sandusky River (HUC 04100011 11 05) U04Q11 Spicer Creek north of
Tiffin at County Road 33 0.80 H TP d 0.08 mg/L as P -- Spicer Creek at mouth
(0.8 mile downstream of U04Q11)
Green Creek (HUC 04100011 12) Beaver Creek (HUC 04100011 12 02) U04G26 Emerson Creek at
Township Road 129 1.83 W TSS 24 mg/L U04K07 e U04G26
Green Creek (HUC 04100011 12 03) U04K01 Green Creek northeast of
Fremont at Township Road 239
5.06 W TSS 24 mg/L U04S10 U04K01
- G-15 -
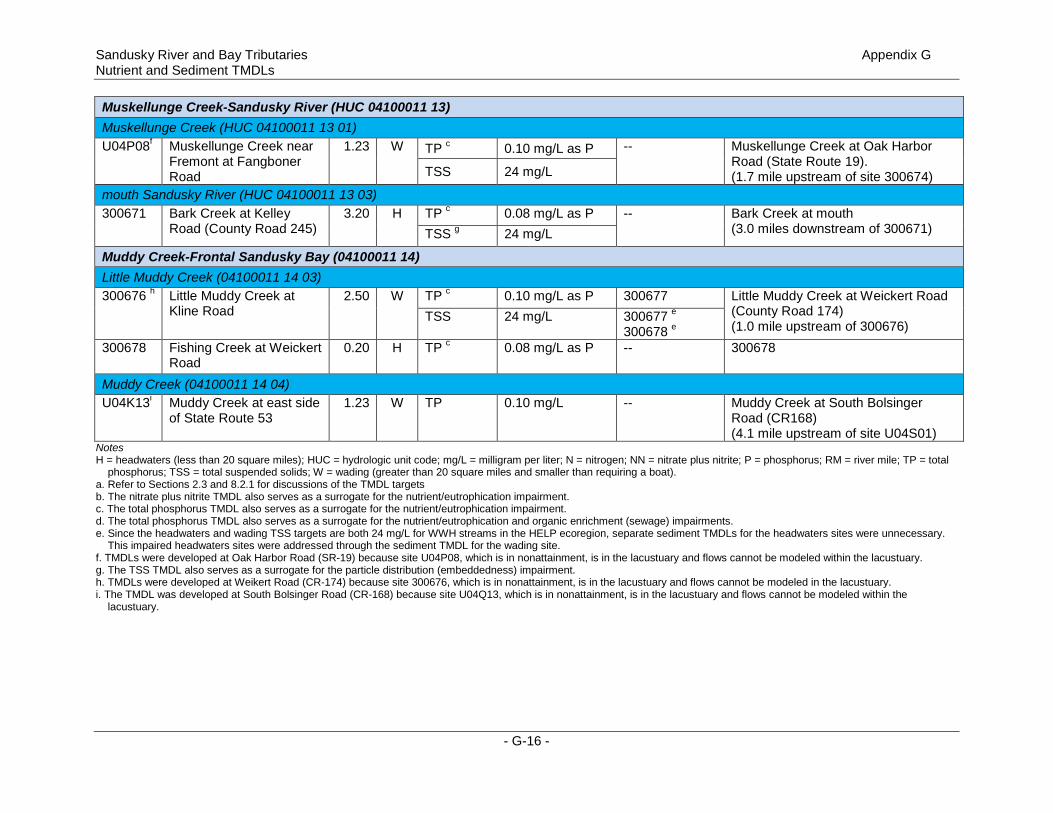
Sandusky River and Bay Tributaries Appendix G Nutrient and Sediment TMDLs Muskellunge Creek-Sandusky River (HUC 04100011 13) Muskellunge Creek (HUC 04100011 13 01) U04P08f Muskellunge Creek near
Fremont at Fangboner Road
1.23 W TP c 0.10 mg/L as P -- Muskellunge Creek at Oak Harbor Road (State Route 19). (1.7 mile upstream of site 300674) TSS 24 mg/L
mouth Sandusky River (HUC 04100011 13 03) 300671 Bark Creek at Kelley
Road (County Road 245) 3.20 H TP c 0.08 mg/L as P -- Bark Creek at mouth
(3.0 miles downstream of 300671) TSS g 24 mg/L
Muddy Creek-Frontal Sandusky Bay (04100011 14) Little Muddy Creek (04100011 14 03) 300676 h Little Muddy Creek at
Kline Road 2.50 W TP c 0.10 mg/L as P 300677 Little Muddy Creek at Weickert Road
(County Road 174) (1.0 mile upstream of 300676)
TSS 24 mg/L 300677 e 300678 e
300678 Fishing Creek at Weickert Road
0.20 H TP c 0.08 mg/L as P -- 300678
Muddy Creek (04100011 14 04) U04K13i Muddy Creek at east side
of State Route 53 1.23 W TP 0.10 mg/L -- Muddy Creek at South Bolsinger
Road (CR168) (4.1 mile upstream of site U04S01)
Notes H = headwaters (less than 20 square miles); HUC = hydrologic unit code; mg/L = milligram per liter; N = nitrogen; NN = nitrate plus nitrite; P = phosphorus; RM = river mile; TP = total
phosphorus; TSS = total suspended solids; W = wading (greater than 20 square miles and smaller than requiring a boat). a. Refer to Sections 2.3 and 8.2.1 for discussions of the TMDL targets b. The nitrate plus nitrite TMDL also serves as a surrogate for the nutrient/eutrophication impairment. c. The total phosphorus TMDL also serves as a surrogate for the nutrient/eutrophication impairment. d. The total phosphorus TMDL also serves as a surrogate for the nutrient/eutrophication and organic enrichment (sewage) impairments. e. Since the headwaters and wading TSS targets are both 24 mg/L for WWH streams in the HELP ecoregion, separate sediment TMDLs for the headwaters sites were unnecessary.
This impaired headwaters sites were addressed through the sediment TMDL for the wading site. f. TMDLs were developed at Oak Harbor Road (SR-19) because site U04P08, which is in nonattainment, is in the lacustuary and flows cannot be modeled within the lacustuary. g. The TSS TMDL also serves as a surrogate for the particle distribution (embeddedness) impairment. h. TMDLs were developed at Weikert Road (CR-174) because site 300676, which is in nonattainment, is in the lacustuary and flows cannot be modeled in the lacustuary. i. The TMDL was developed at South Bolsinger Road (CR-168) because site U04Q13, which is in nonattainment, is in the lacustuary and flows cannot be modeled within the
lacustuary.
- G-16 -
Sandusky River and Bay Tributaries Appendix G Nutrient and Sediment TMDLs
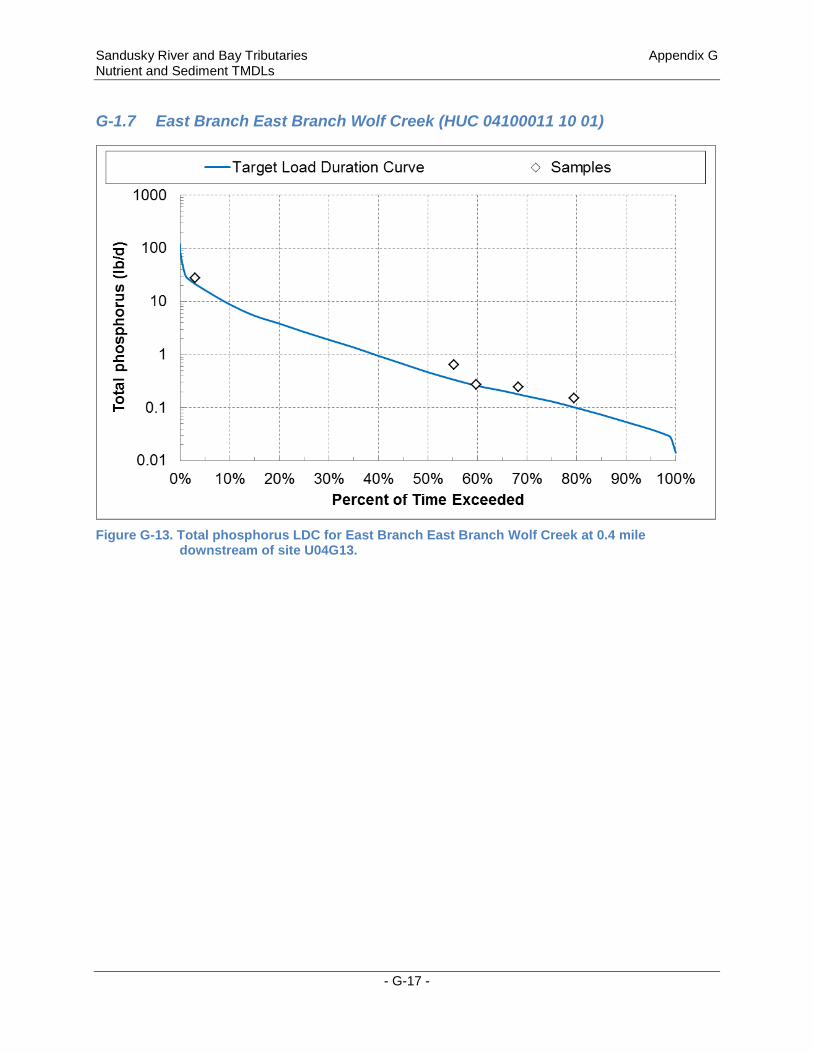
G-1.7 East Branch East Branch Wolf Creek (HUC 04100011 10 01)
Figure G-13. Total phosphorus LDC for East Branch East Branch Wolf Creek at 0.4 mile
downstream of site U04G13.
- G-17 -
Sandusky River and Bay Tributaries Appendix G Nutrient and Sediment TMDLs
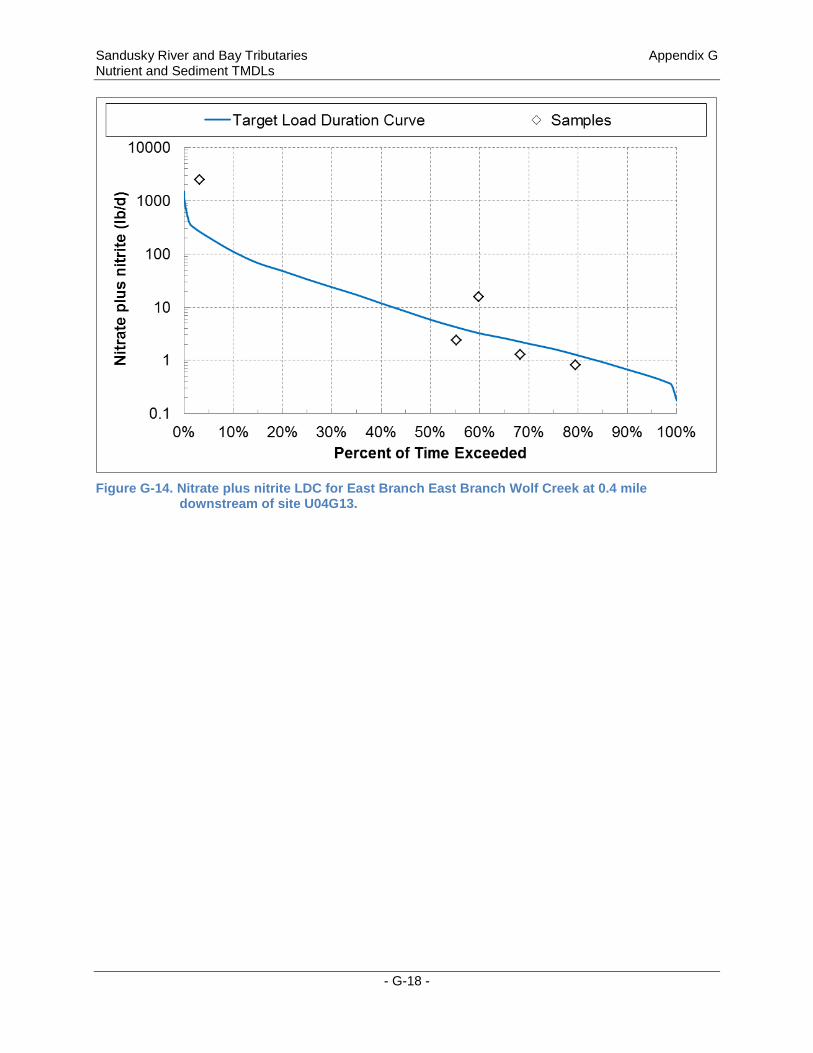
Figure G-14. Nitrate plus nitrite LDC for East Branch East Branch Wolf Creek at 0.4 mile
downstream of site U04G13.
- G-18 -
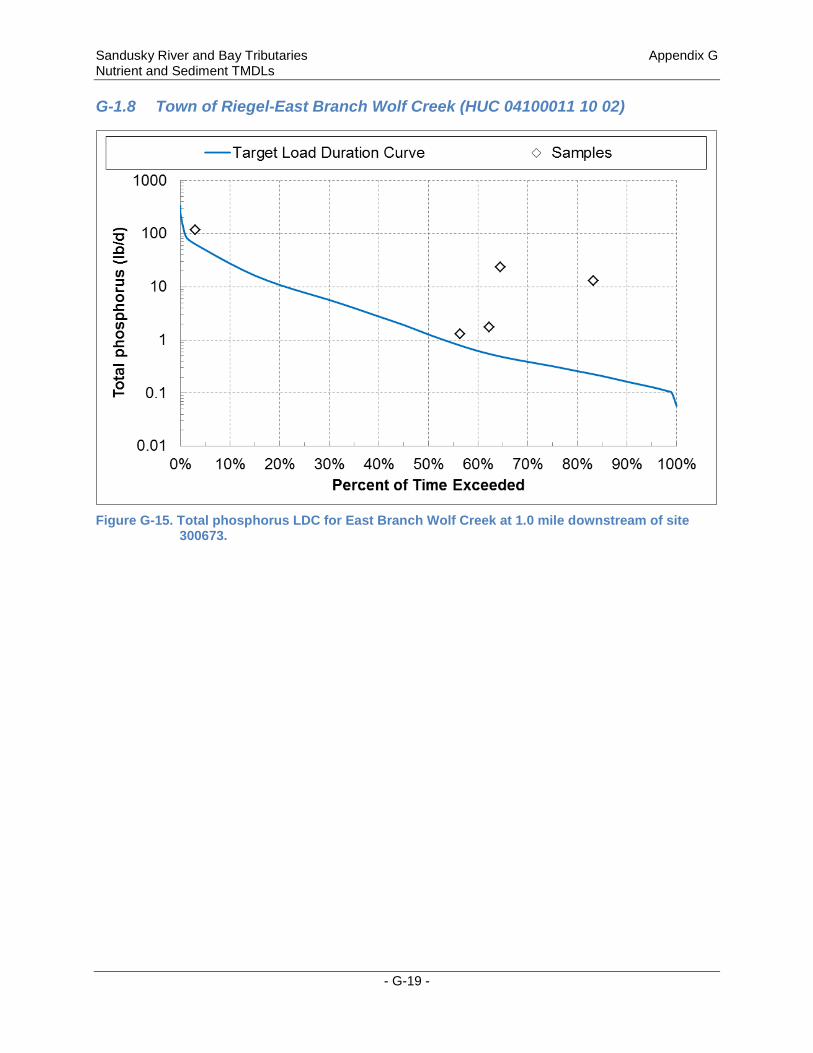
Sandusky River and Bay Tributaries Appendix G Nutrient and Sediment TMDLs G-1.8 Town of Riegel-East Branch Wolf Creek (HUC 04100011 10 02)
Figure G-15. Total phosphorus LDC for East Branch Wolf Creek at 1.0 mile downstream of site
300673.
- G-19 -
Sandusky River and Bay Tributaries Appendix G Nutrient and Sediment TMDLs
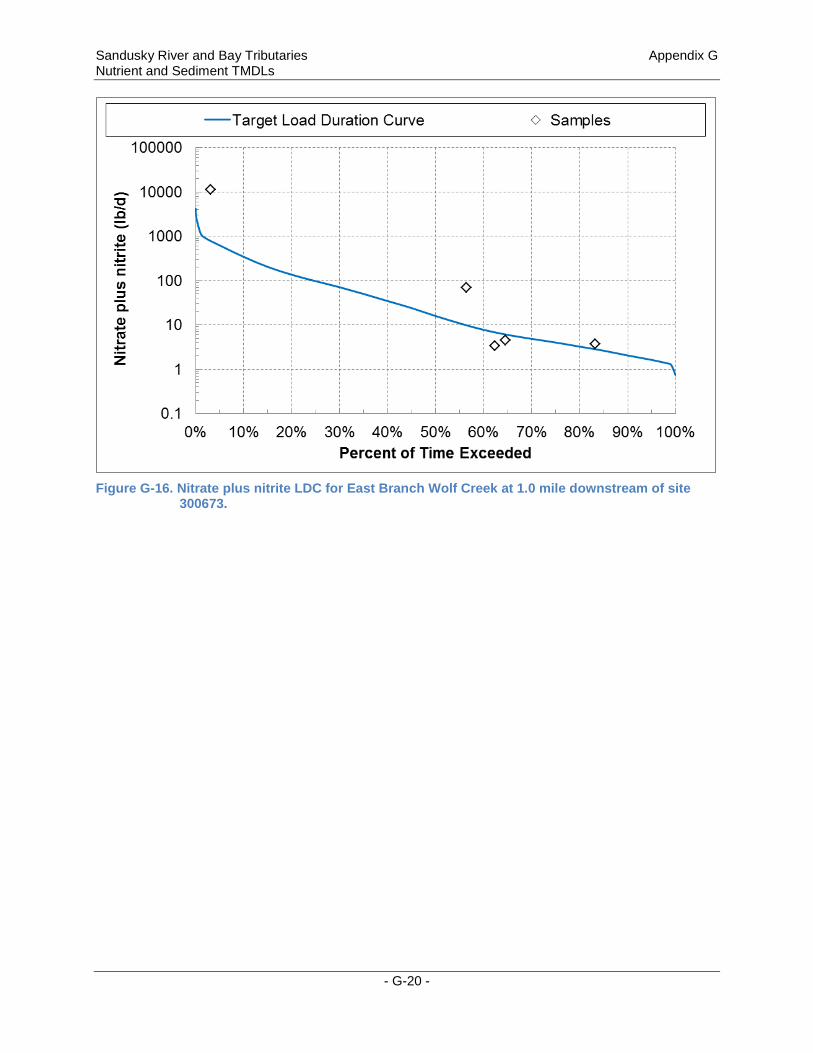
Figure G-16. Nitrate plus nitrite LDC for East Branch Wolf Creek at 1.0 mile downstream of site
300673.
- G-20 -
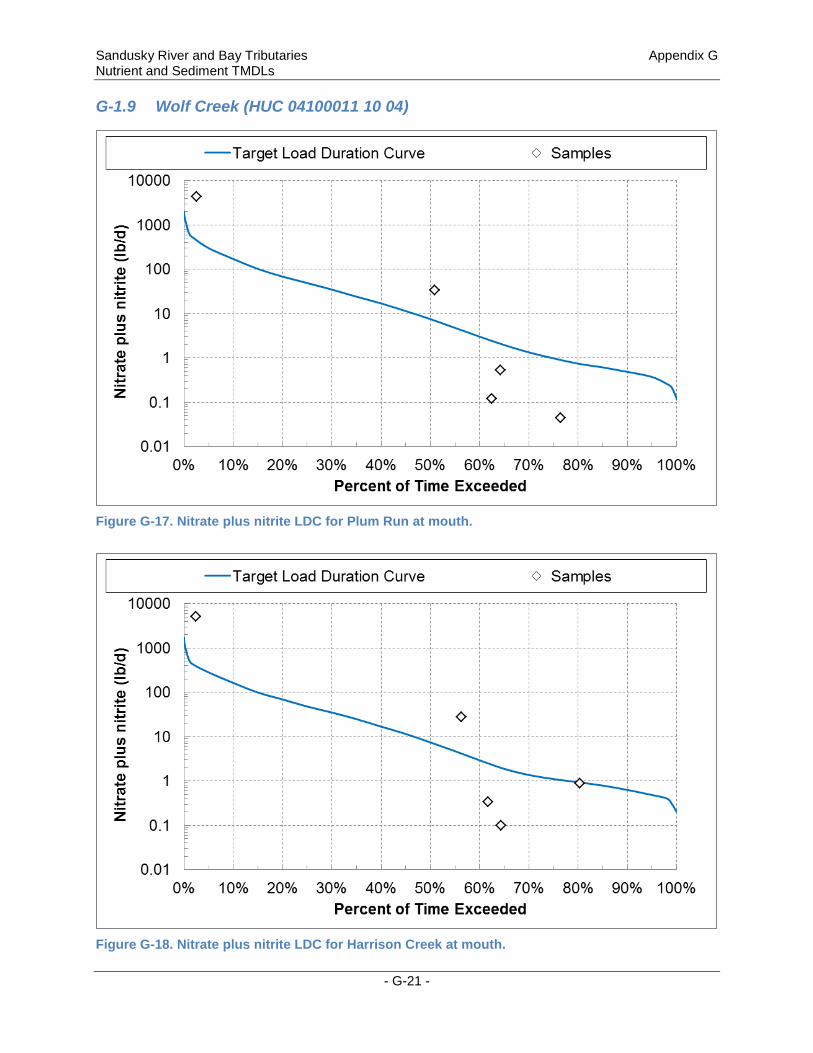
Sandusky River and Bay Tributaries Appendix G Nutrient and Sediment TMDLs G-1.9 Wolf Creek (HUC 04100011 10 04)
Figure G-17. Nitrate plus nitrite LDC for Plum Run at mouth.
Figure G-18. Nitrate plus nitrite LDC for Harrison Creek at mouth.
- G-21 -
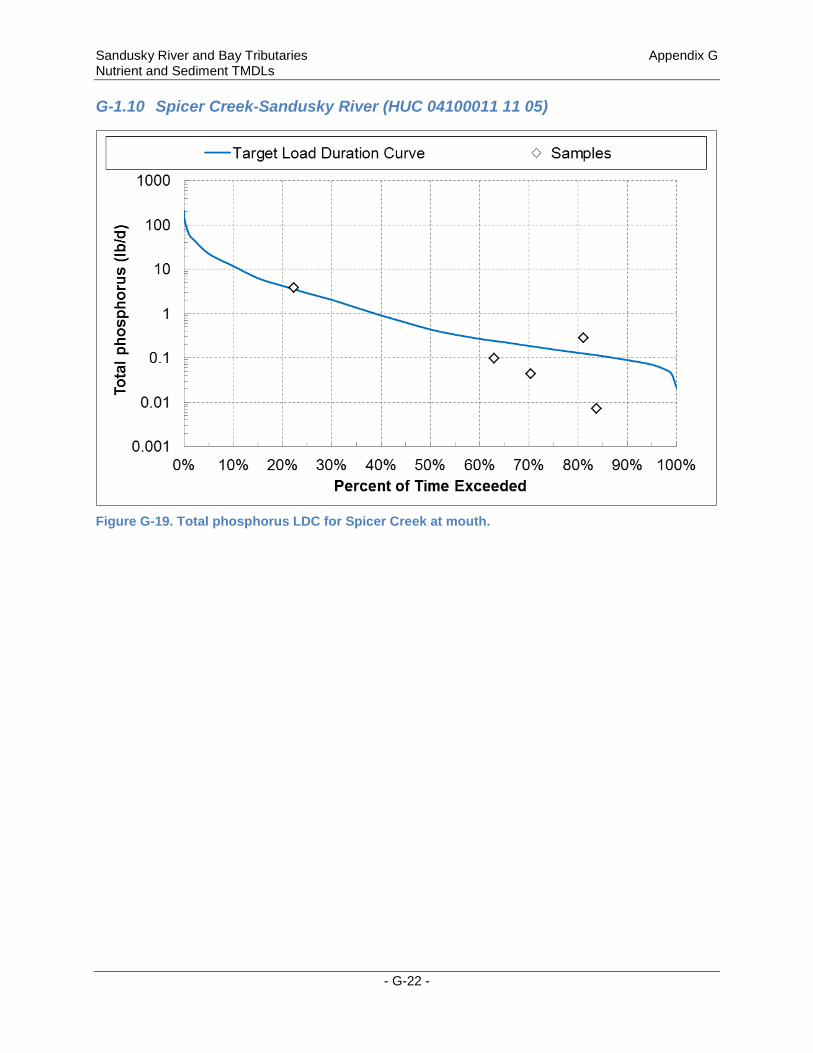
Sandusky River and Bay Tributaries Appendix G Nutrient and Sediment TMDLs G-1.10 Spicer Creek-Sandusky River (HUC 04100011 11 05)
Figure G-19. Total phosphorus LDC for Spicer Creek at mouth.
- G-22 -
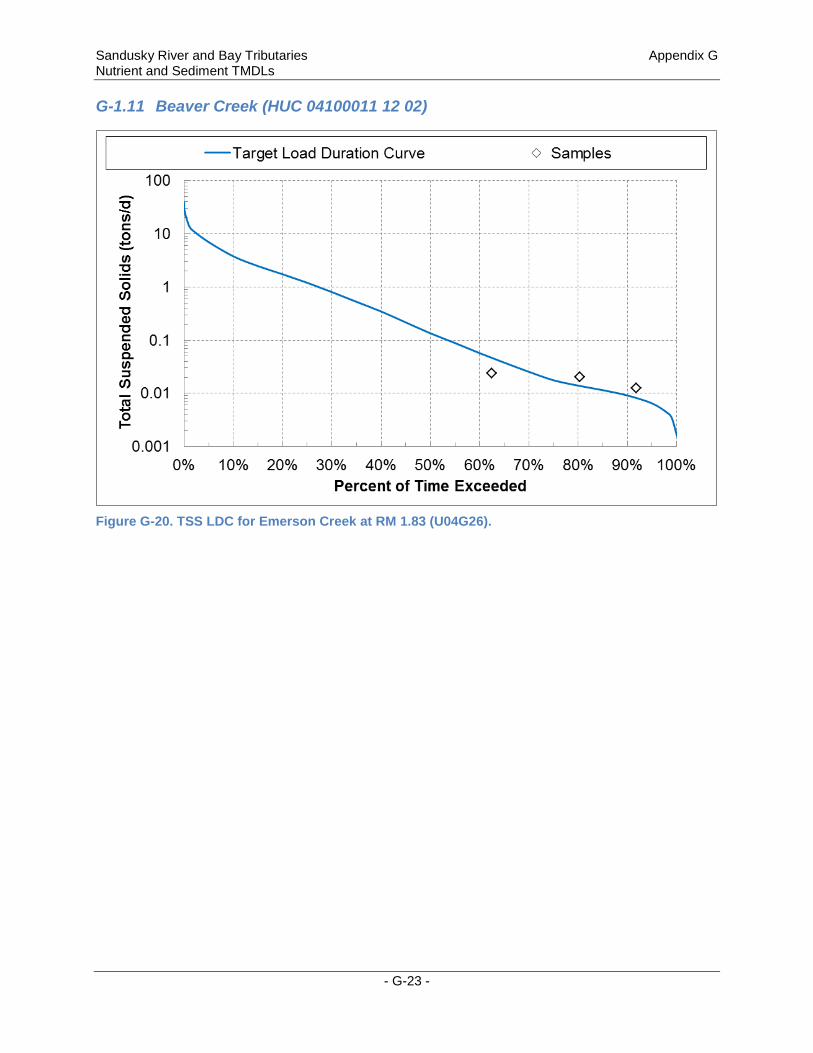
Sandusky River and Bay Tributaries Appendix G Nutrient and Sediment TMDLs G-1.11 Beaver Creek (HUC 04100011 12 02)
Figure G-20. TSS LDC for Emerson Creek at RM 1.83 (U04G26).
- G-23 -
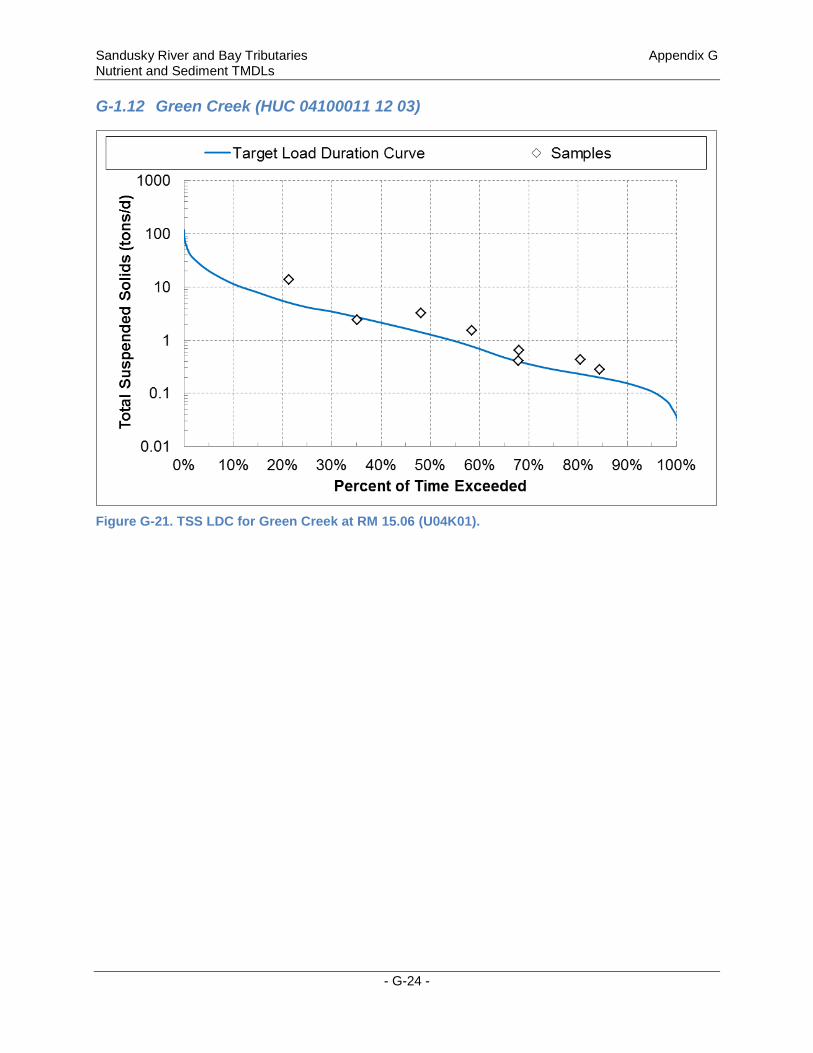
Sandusky River and Bay Tributaries Appendix G Nutrient and Sediment TMDLs G-1.12 Green Creek (HUC 04100011 12 03)
Figure G-21. TSS LDC for Green Creek at RM 15.06 (U04K01).
- G-24 -
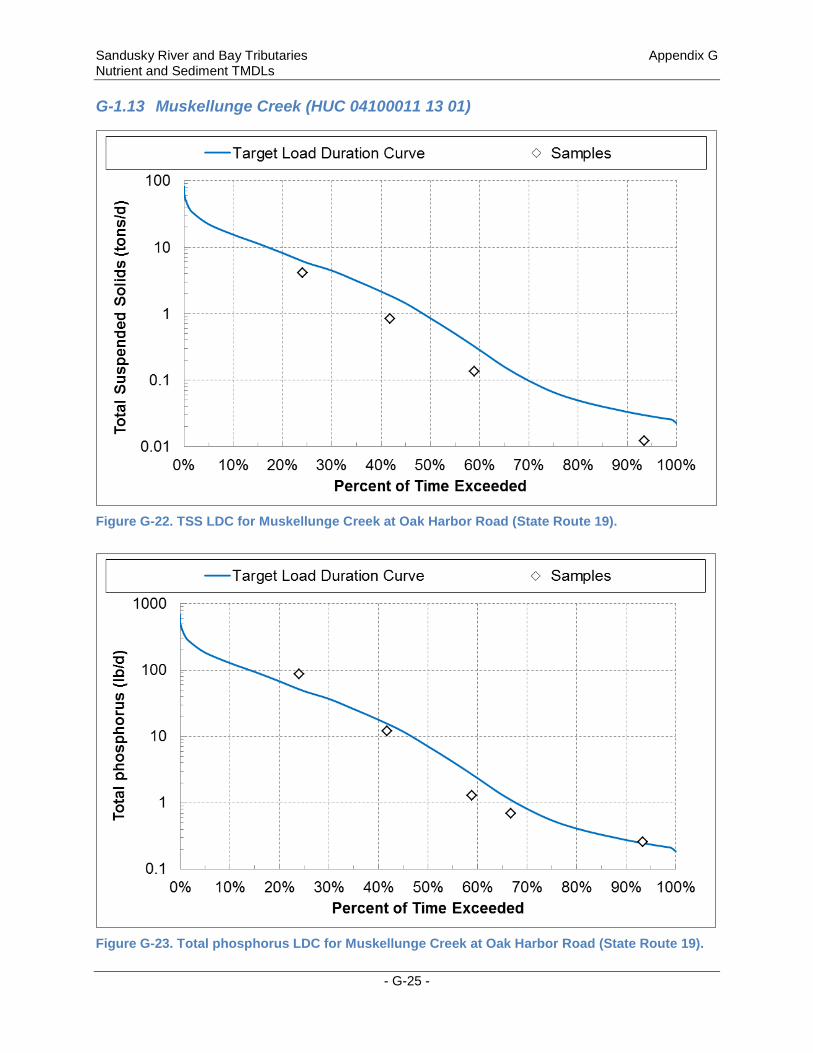
Sandusky River and Bay Tributaries Appendix G Nutrient and Sediment TMDLs G-1.13 Muskellunge Creek (HUC 04100011 13 01)
Figure G-22. TSS LDC for Muskellunge Creek at Oak Harbor Road (State Route 19).
Figure G-23. Total phosphorus LDC for Muskellunge Creek at Oak Harbor Road (State Route 19).
- G-25 -
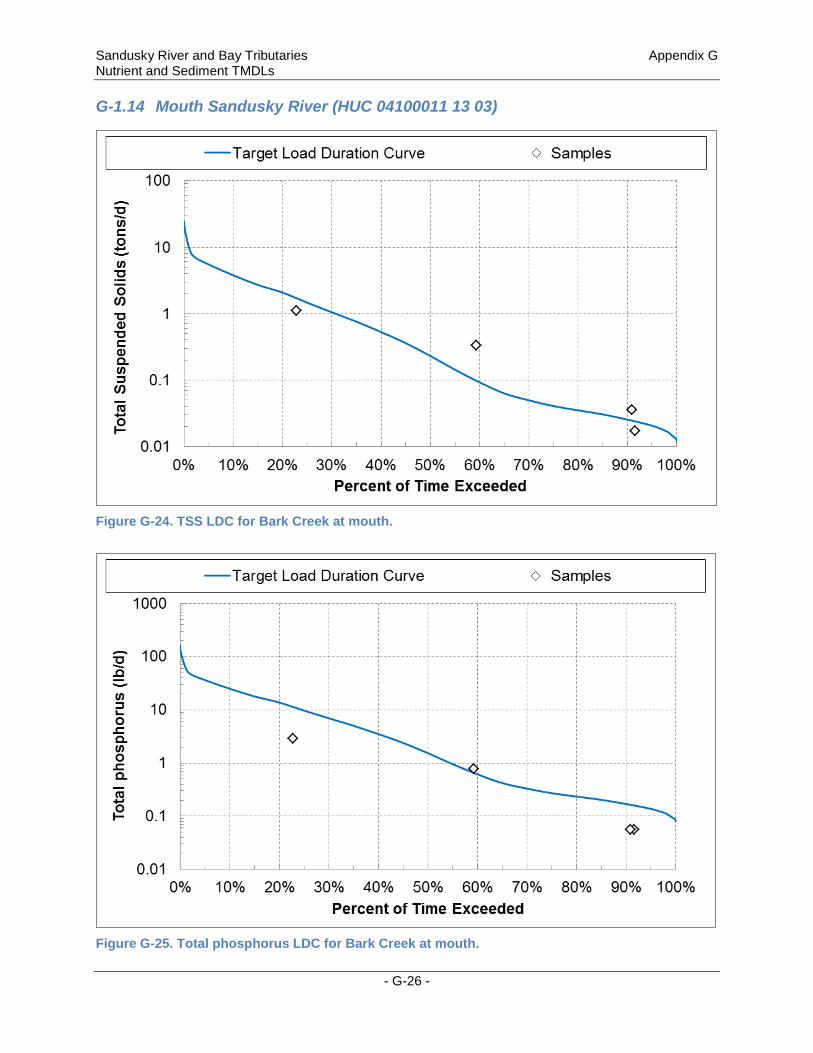
Sandusky River and Bay Tributaries Appendix G Nutrient and Sediment TMDLs G-1.14 Mouth Sandusky River (HUC 04100011 13 03)
Figure G-24. TSS LDC for Bark Creek at mouth.
Figure G-25. Total phosphorus LDC for Bark Creek at mouth.
- G-26 -
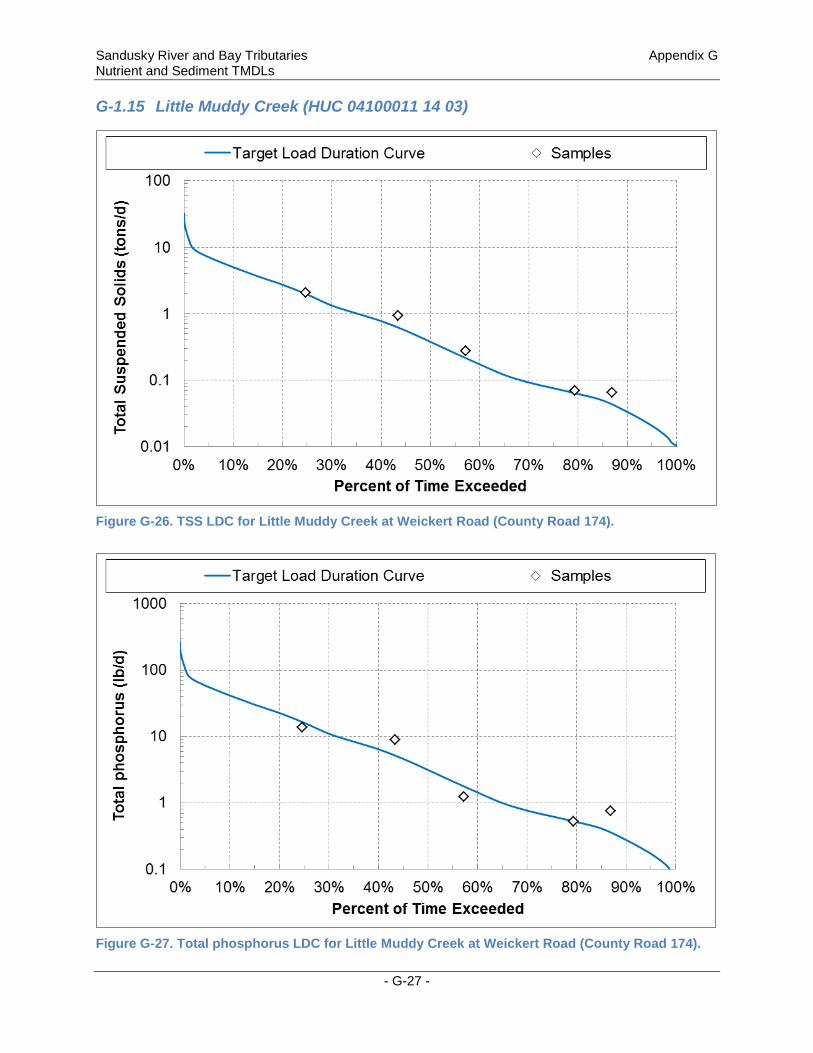
Sandusky River and Bay Tributaries Appendix G Nutrient and Sediment TMDLs G-1.15 Little Muddy Creek (HUC 04100011 14 03)
Figure G-26. TSS LDC for Little Muddy Creek at Weickert Road (County Road 174).
Figure G-27. Total phosphorus LDC for Little Muddy Creek at Weickert Road (County Road 174).
- G-27 -
Sandusky River and Bay Tributaries Appendix G Nutrient and Sediment TMDLs
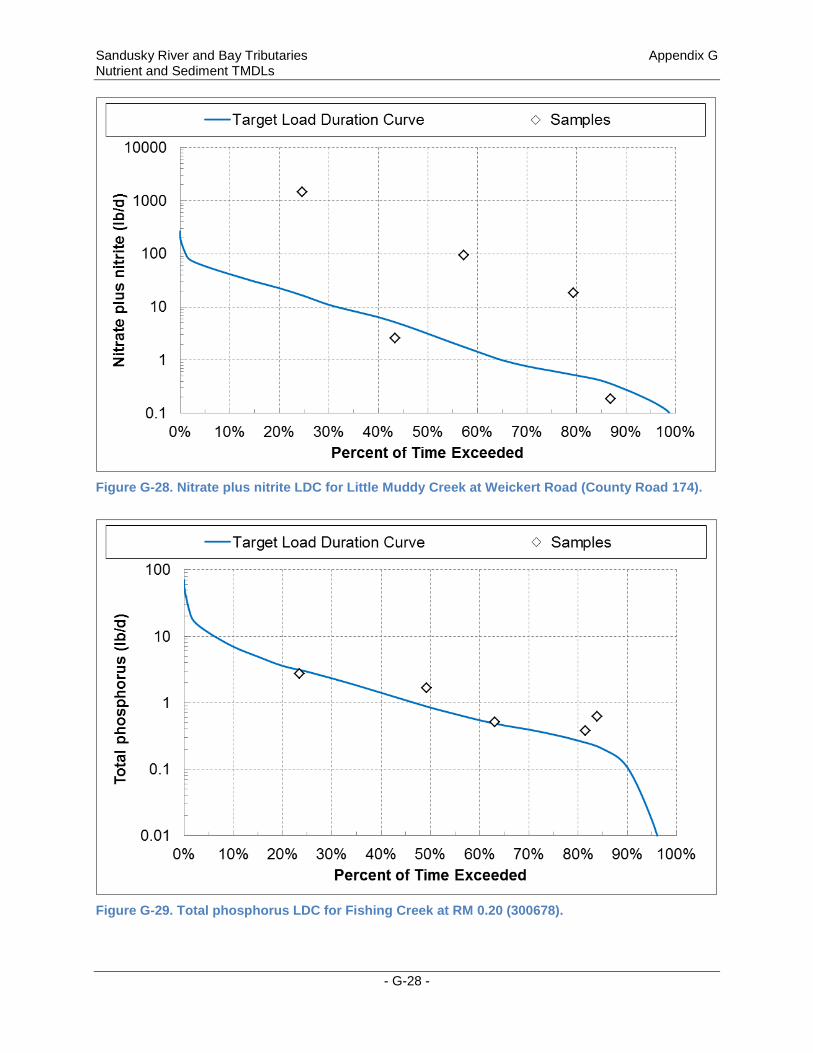
Figure G-28. Nitrate plus nitrite LDC for Little Muddy Creek at Weickert Road (County Road 174).
Figure G-29. Total phosphorus LDC for Fishing Creek at RM 0.20 (300678).
- G-28 -
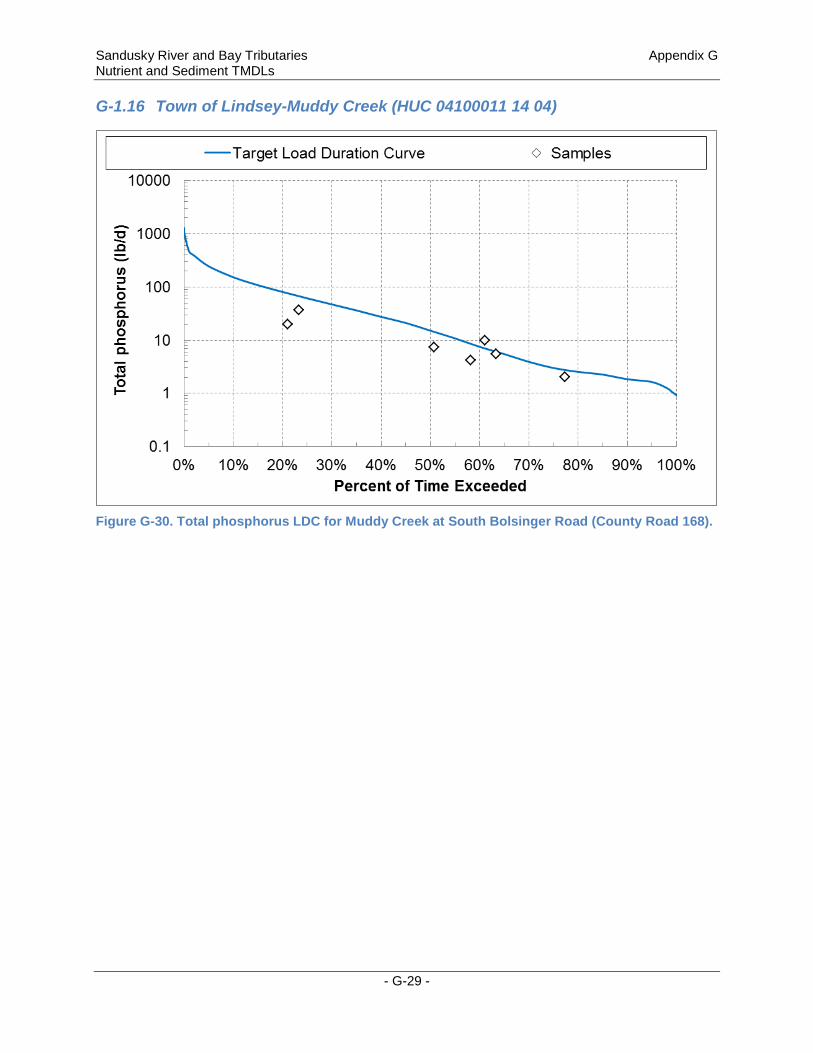
Sandusky River and Bay Tributaries Appendix G Nutrient and Sediment TMDLs G-1.16 Town of Lindsey-Muddy Creek (HUC 04100011 14 04)
Figure G-30. Total phosphorus LDC for Muddy Creek at South Bolsinger Road (County Road 168).
- G-29 -
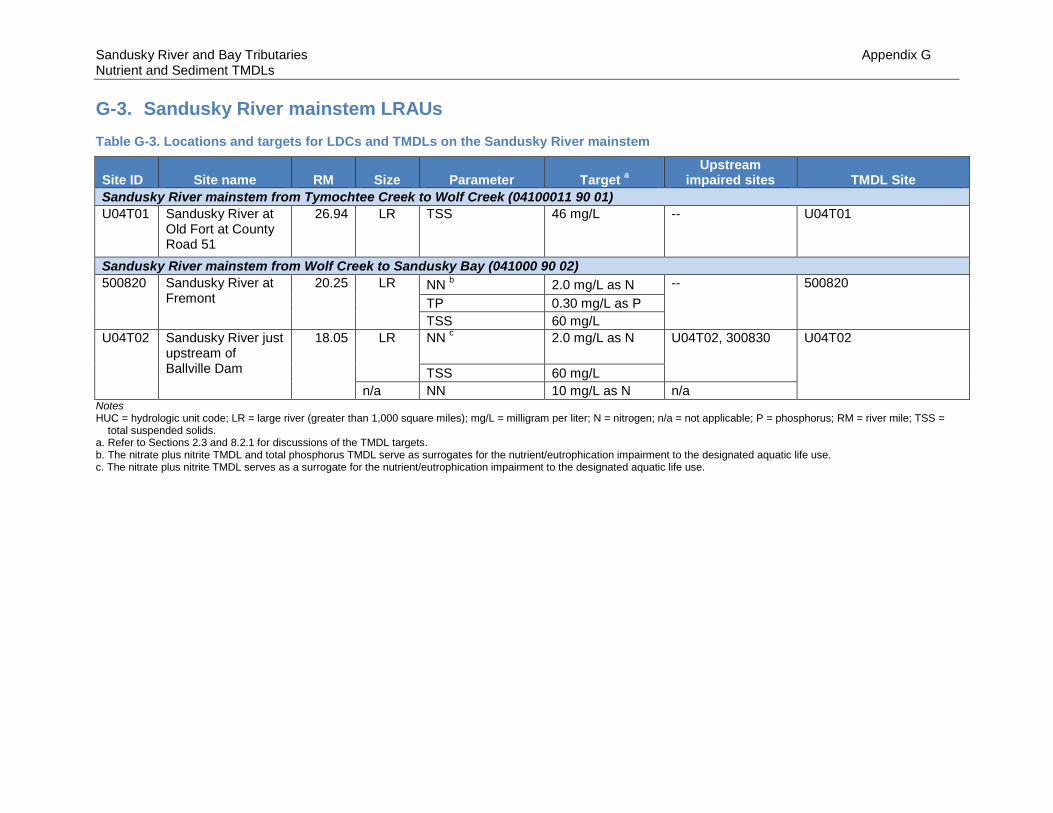
Sandusky River and Bay Tributaries Appendix G Nutrient and Sediment TMDLs G-3. Sandusky River mainstem LRAUs Table G-3. Locations and targets for LDCs and TMDLs on the Sandusky River mainstem
Site ID Site name RM Size Parameter Target a Upstream
impaired sites TMDL Site Sandusky River mainstem from Tymochtee Creek to Wolf Creek (04100011 90 01) U04T01 Sandusky River at
Old Fort at County Road 51
26.94 LR TSS 46 mg/L -- U04T01
Sandusky River mainstem from Wolf Creek to Sandusky Bay (041000 90 02) 500820 Sandusky River at
Fremont 20.25 LR NN b 2.0 mg/L as N -- 500820
TP 0.30 mg/L as P TSS 60 mg/L
U04T02 Sandusky River just upstream of Ballville Dam
18.05 LR NN c 2.0 mg/L as N U04T02, 300830 U04T02
TSS 60 mg/L n/a NN 10 mg/L as N n/a
Notes HUC = hydrologic unit code; LR = large river (greater than 1,000 square miles); mg/L = milligram per liter; N = nitrogen; n/a = not applicable; P = phosphorus; RM = river mile; TSS =
total suspended solids. a. Refer to Sections 2.3 and 8.2.1 for discussions of the TMDL targets. b. The nitrate plus nitrite TMDL and total phosphorus TMDL serve as surrogates for the nutrient/eutrophication impairment to the designated aquatic life use. c. The nitrate plus nitrite TMDL serves as a surrogate for the nutrient/eutrophication impairment to the designated aquatic life use.
Sandusky River and Bay Tributaries Appendix G Nutrient and Sediment TMDLs
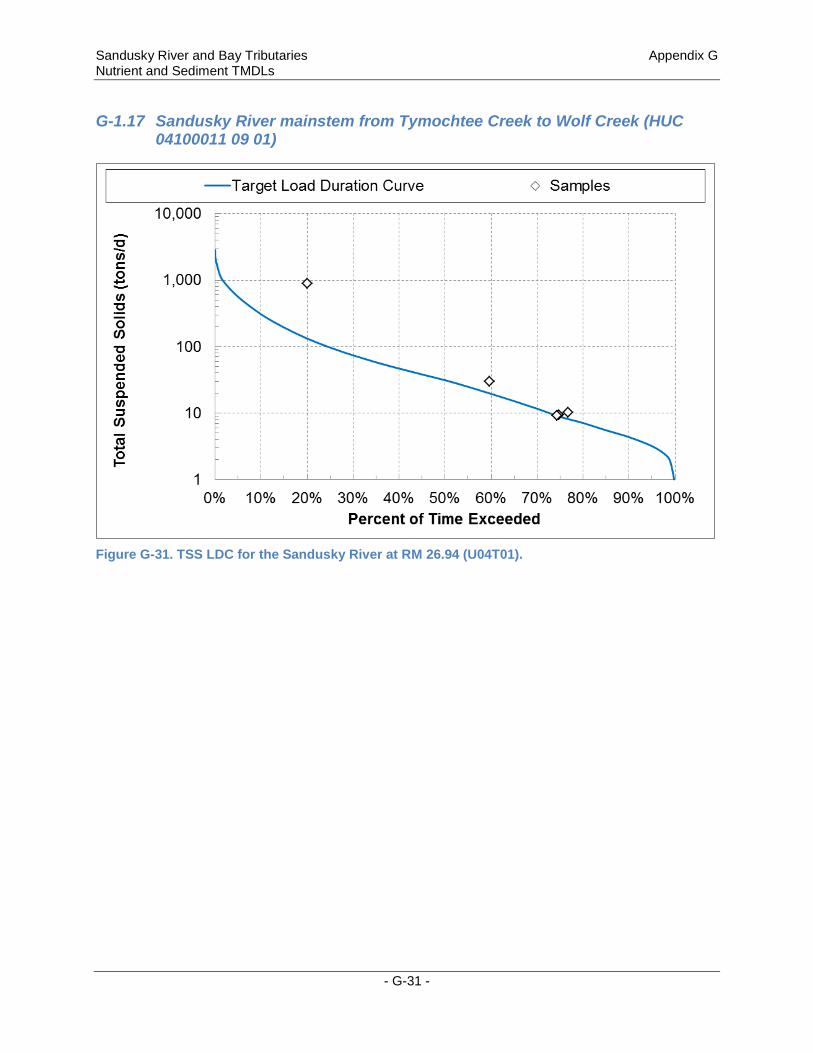
G-1.17 Sandusky River mainstem from Tymochtee Creek to Wolf Creek (HUC 04100011 09 01)
Figure G-31. TSS LDC for the Sandusky River at RM 26.94 (U04T01).
- G-31 -
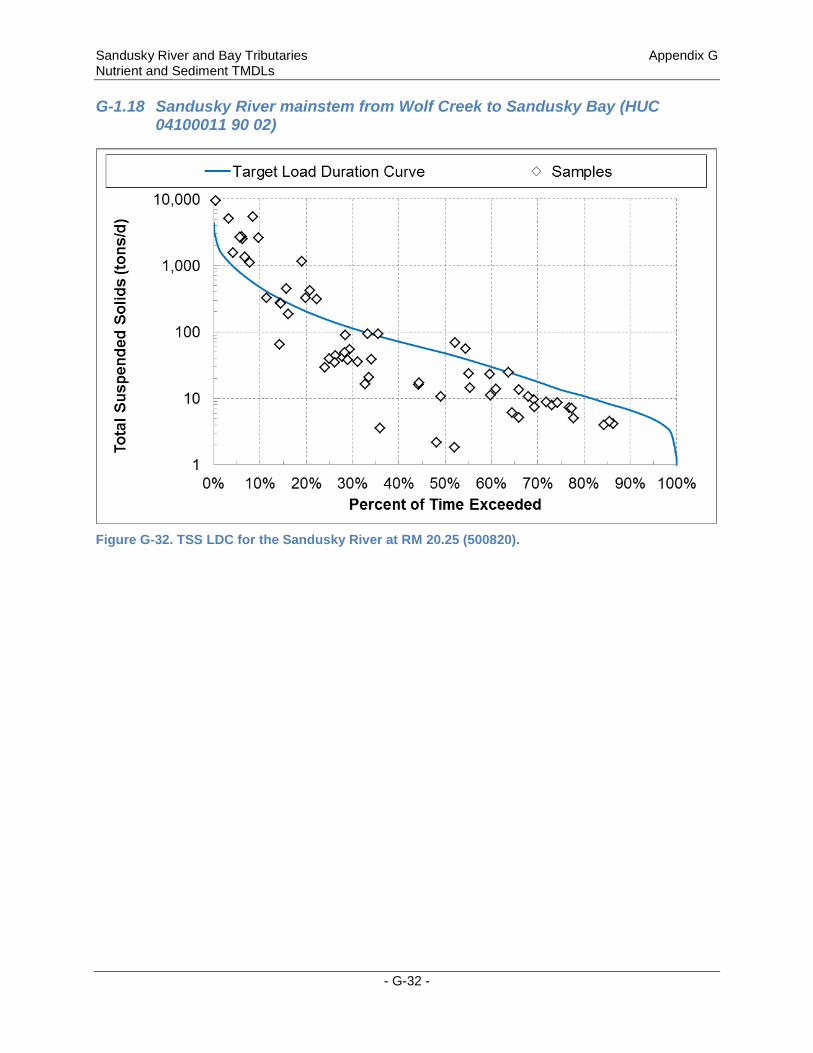
Sandusky River and Bay Tributaries Appendix G Nutrient and Sediment TMDLs G-1.18 Sandusky River mainstem from Wolf Creek to Sandusky Bay (HUC
04100011 90 02)
Figure G-32. TSS LDC for the Sandusky River at RM 20.25 (500820).
- G-32 -
Sandusky River and Bay Tributaries Appendix G Nutrient and Sediment TMDLs
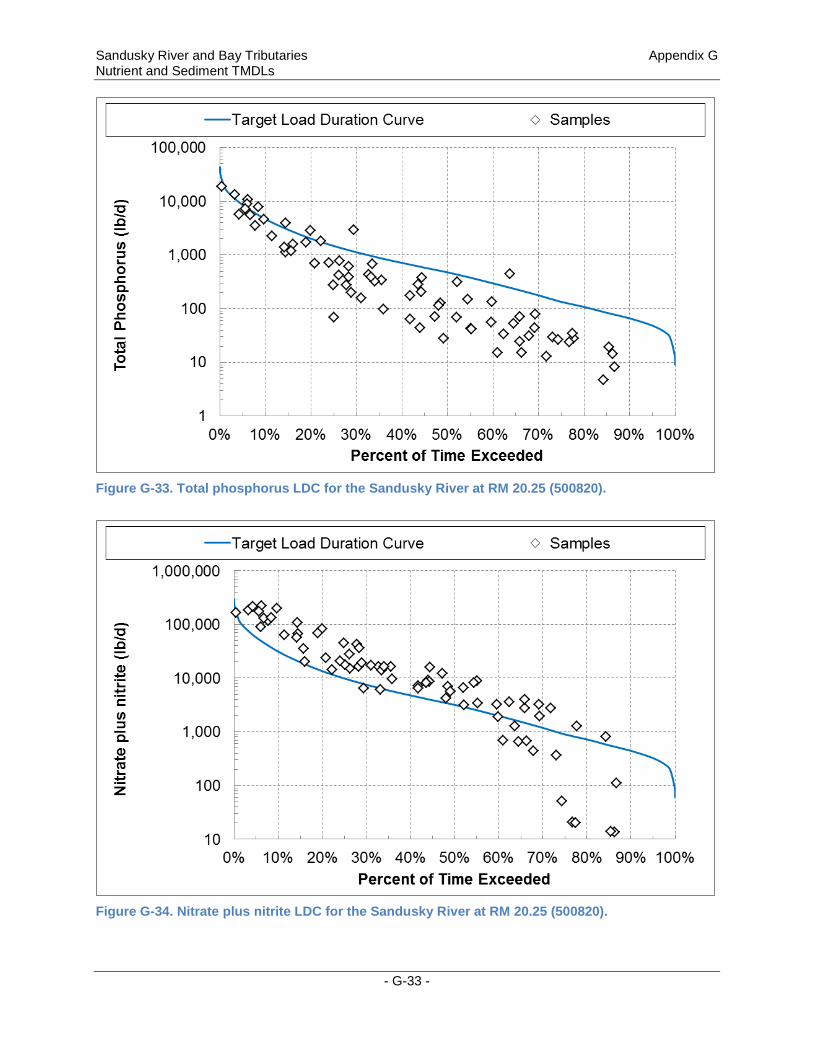
Figure G-33. Total phosphorus LDC for the Sandusky River at RM 20.25 (500820).
Figure G-34. Nitrate plus nitrite LDC for the Sandusky River at RM 20.25 (500820).
- G-33 -
Sandusky River and Bay Tributaries Appendix G Nutrient and Sediment TMDLs
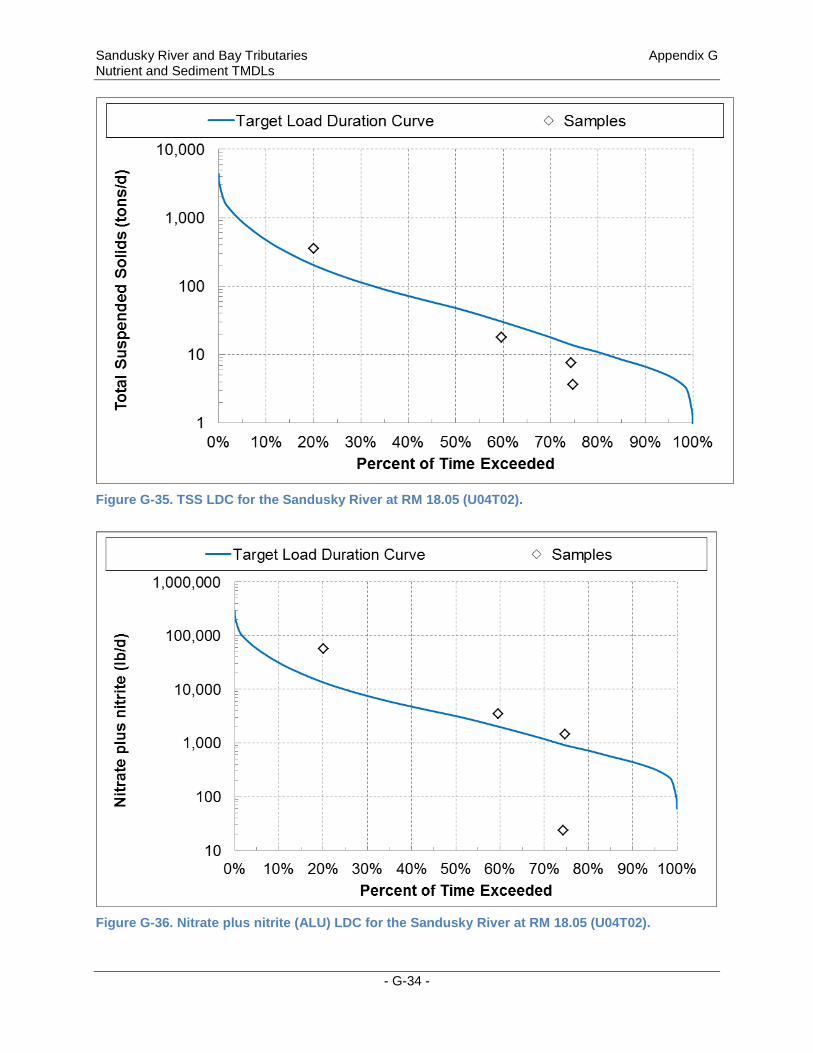
Figure G-35. TSS LDC for the Sandusky River at RM 18.05 (U04T02).
Figure G-36. Nitrate plus nitrite (ALU) LDC for the Sandusky River at RM 18.05 (U04T02).
- G-34 -
Sandusky River and Bay Tributaries Appendix G Nutrient and Sediment TMDLs
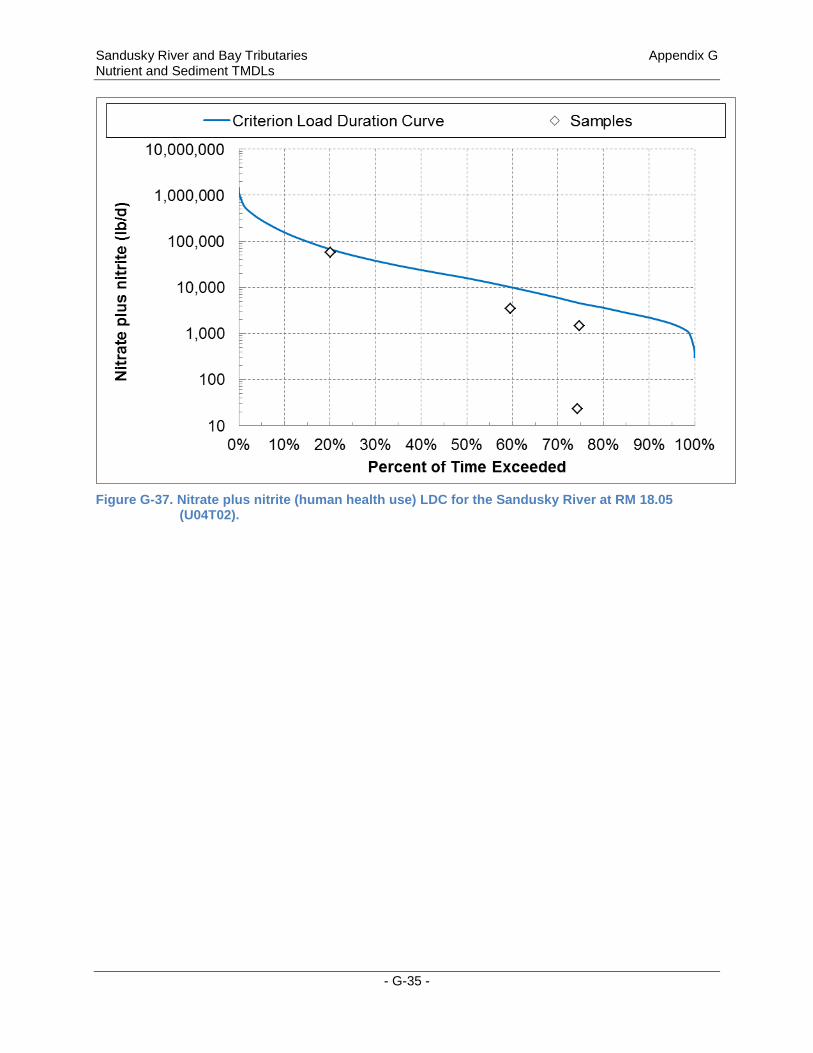
Figure G-37. Nitrate plus nitrite (human health use) LDC for the Sandusky River at RM 18.05
(U04T02).
- G-35 -