appendix g - vermontdec.vermont.gov/.../g-appendix-g-09-bridge-and-culvert-protocols.pdf ·...
TRANSCRIPT

Vermont Stream Geomorphic Assessment
Appendix G
Bridge and Culvert Assessment
Vermont Agency of Natural Resources March, 2009
Stream Geomorphic Assessment Handbooks VT Agency of Natural Resources March, 2009

Stream Geomorphic Assessment Handbooks VT Agency of Natural Resources March, 2009
Table of Contents
Introduction ....................................................................................................................................................... 1 Getting Started .................................................................................................................................................. 1 Completing the Field Form .............................................................................................................................. 3
General Header Info ........................................................................................................................................ 3 Bridge/Arch Header ........................................................................................................................................ 6 Culvert Header ................................................................................................................................................ 6 General Data .................................................................................................................................................... 7 Upstream Data ................................................................................................................................................. 8 Downstream Data .......................................................................................................................................... 10 Upstream - Downstream - In Structure Table ............................................................................................... 11 Wildlife Data ................................................................................................................................................. 13
On-line DMS B&C Database and Standard Reports................................................................................... 15 Geomorphic Compatibility Screen ................................................................................................................ 15 Structure Failure Modes Report .................................................................................................................... 16 Problem Causes Report ................................................................................................................................. 18 Culvert Aquatic Organism Passage Coarse Screen ....................................................................................... 19 Culvert Retrofit Potential Screen .................................................................................................................. 21 AOP Habitat Connectivity Potential Screen ................................................................................................. 21 Wildlife Passage Suitability Report ............................................................... Error! Bookmark not defined.
Bridge & Arch Assessment Field Form ......................................................................................................... 23 Culvert Assessment Field Form ..................................................................................................................... 25
Stream Geomorphic Assessment Handbooks VT Agency of Natural Resources March, 2009 - G1 -

Introduction The ANR Bridge and Culvert Assessment includes protocols and an on-line database for a coarse-screen assessment of stream crossing structures that can be conducted at a watershed-scale. The assessments are fairly rapid, involving only a few simple measurements, with minimal time devoted to each structure (15 to 30 minutes each). Assessment results entered into the ANR on-line bridge and culvert database can be used to “red-flag” structures that are potential barriers to fish and wildlife movement and/or flood or erosion hazards. This appendix includes methods for analyzing geomorphic and habitat-related bridge and culvert data using standard database reports. ANR has also adopted survey protocols developed by the U.S. Forest Service that are designed to further evaluate structures “red-flagged” by the coarse-screen assessment. The survey protocols verify and further define problems associated with sediment transport and/or fish and wildlife habitat, including fish passage concerns. The surveys involve more detailed observations and accurate measurement of elevations using survey equipment. Survey protocols are not included in this appendix. Please contact the DEC River Management Program or Department of Fish and Wildlife for more information on conducting surveys of stream crossing structures. ANR Bridge and Culvert Assessments provide a useful data set, especially when completed in conjunction with Phase 1 and Phase 2 Stream Geomorphic Assessments, for understanding which stream crossing structures within a watershed are:
• Subject to failure as a result of systemic channel adjustments that are occurring due to stressors unrelated to the structure;
• Subject to failure due to the disruption of fluvial geomorphic processes caused by the structure being inadequately designed and/or poorly located; and/or
• Subject to obstructing fish and wildlife movements and migrations within streams and along river corridors due to the structure being inadequately designed and/or poorly located.
Getting Started Coordination: CONTACT THE DEC RIVER MANAGEMENT PROGRAM REGIONAL SCIENTIST http://www.anr.state.vt.us/dec/waterq/rivers/htm/rv_geoassess-contact.htm to make sure that the assessment you are conducting is coordinated with previous or pending assessments of the same structures. Field equipment requirements: A tape measure, depth rod, clipboard, field map (USGS topographic map), and field form are required to complete the field assessments. Field forms are included on pages G23 and G25. A GPS unit is also recommended for determining latitude and longitude and collecting spatial data. See pages G5 and G15 for more discussion on collecting GPS data points at bridges and culverts.
Read the Protocols: Before going into the field, read the protocols on the following pages in order to understand the assessment parameters and how to complete the field form. If you have questions, contact the River Management Program regional scientists for clarifications before collecting data.
Stream Geomorphic Assessment Handbooks VT Agency of Natural Resources March, 2009 - G1 -

The following diagrams show structure components and common channel features referred to in the protocols.
Bridge / Arch Components & Features A. Length of structure B. Span (width) of structure C. Abutments D. Bridge pier E. Wingwalls F. Sediment deposit upstream of structure G. Scour hole inside and/or immediately
downstream of structure
C
A
B
C D
E E
F
G
F
Flow
Plan View
Road
Culvert Components & Features
A. Length of culvert B. Culvert diameter (width) and height C. Head wall D. Inlet E. Outlet F. Sediment deposit upstream of structure G. Pool downstream of structure H. Culvert invert (bottom lip)
F
G
C D
E
H A Cross-section View
Plan View
Road
road surface
B
H
Stream Geomorphic Assessment Handbooks VT Agency of Natural Resources March, 2009 - G2 -

Completing the Field Form There are separate field forms for culverts and bridges/arches. If you are evaluating a bridge or arch, use the appropriate form and circle the structure type at the top of the field form. The following structure type definitions apply to this protocol:
Bridge = A structure that supports a roadway over a waterbody by means of abutments and sometimes piers and does not have a constructed bottom. Arch = A structure that supports a roadway over a waterbody by means of a half pipe or open box embedded in fill and supported by footers and does not have a constructed bottom. Culvert = A structure that supports a roadway over a waterbody by means of a complete pipe or box embedded in fill that always has a constructed bottom and does not have abutments or piers. Common culvert types include circular (round), elliptical (squashed round), and box.
General Header Info The header contains several parameters that are shared with VTrans local road inventories. The data for these boxes may already be available and can be used to complete the field form header if local road inventories have been completed for the structure. Double-check the accuracy of this data when completing your assessment, especially if the local road inventory data is several years old, as structures may have been replaced or altered since the time of the inventory.
Field Map #: This is an optional field – you may choose not to use it. On the top right corner of each field form
a space is provided for you to assign a convenient tracking number for each structure in the assessment. This number is used solely for coordinating the field work component of the assessment and is not stored in the database. There are no specific rules for assigning the number. You may choose whatever is convenient for you to track the structures as you complete the assessment in the field. If local ID numbers are available (see below) you may find these to be sufficient for organizing field work and data forms.
SGA-DMS ID: This is the unique identifier (primary key) for all structures in the ANR Bridge and Culvert database. This ID is created when you enter data into the ANR Online Data Management System (DMS). The information you will need to create this ID includes:
o Owner Site: From the drop down menu select whether the structure is owned by another state, the
state of Vermont, a town or a private entity and whether the structure length is less than six feet, between six and twenty feet or greater than 20 feet.
o Highway Number: The highway number is a number between one and four digits. The source of
the highway number is the RTNO attribute field of the TransRoad_RDS layer which is available at http://www.vcgi.org/dataware/?layer=TransRoad_RDS. If the highway number listed in the RTNO field of the TransRoad_RDS layer is less than four digits (this will often be the case on town highways) pad the number with zeroes. On private or public roads that do not have aVtrans assigned Town Highway Number use 0000.
o Town: Select the town in which the structure exists from the dropdown menu.
o Transportation System: From the dropdown menu select whether the structure serves a private, town
or state transportation system (the interstate system are owned by the state). Structure Number (Struct_Num): This is the global unique identifier (primary key field) for all data exchanged via the Vermont Bridge and Culvert Data Exchange Standards, including the VOBCIT and the
Stream Geomorphic Assessment Handbooks VT Agency of Natural Resources March, 2009 - G3 -

TRANSTRUC geospatial bridge and culvert databases (Vermont Data Exchange Standard 2007). The inclusion of Struct_Num in the ANR bridge and culvert database allows for ANR bridge and culvert data to be joined with these databases to support multi-resource state and municipal-level management of stream crossings. Structures are assigned structure numbers when they are inventoried by Vtrans. The source for the Struct_Num is the Tran_Struct layer available from VCGI at http://www.vcgi.org/dataware/?layer=transtruc. If a structure is not included in the Tran_Struct layer leave this field blank. Observers Organization/Agency: Name of observer(s) collecting the data and the organizations or agencies to which the observers belong. Date: Record the date you collect the data in the field. Town: Record the town(s) in which the structure is located. Phase 1 Project: This refers to the ANR Phase 1 watershed assessment projects that have been or are being
completed. A listing of Phase 1 projects is available on the ANR data management system website. This information can be filled out at the time of data entry if not available during fieldwork.
Location: Describe the location of the structure, using nearby landmarks and road mileage distances. The
location narrative should be sufficient to help future surveyors to locate the structures in the field. Example: Bridge is located on Cross Road 5 miles south of intersection of Mountain Rd. and Cross Rd.
Latitude (N/S) and Longitude (E/W): Latitude and longitude are north/south and east/west values, respectively, recorded in decimal degrees. This information should be collected with a GPS unit. Most GPS units give you the option of viewing lat/long data in decimal degrees. The lat/long information can then be read directly from the GPS unit and recorded on the data sheet. In addition, for those structures that are not already included in the State database or a town local road inventory, it is strongly encouraged that you collect data with a GPS to capture the location of the structures in order to create a spatial data set. Work with your regional planning commission to determine appropriate GPS protocols and to process data into a spatial data layer. Additional information on basic GPS protocols is available from VCGI.
Reach VTID: Enter the VTID (state geographic reach number) assigned to the reach in which the structure is
located. VTID numbers are assigned to all reaches for which an ANR Phase 1 watershed assessment has been completed. The VTID is comprised of the 10-digit Hydrologic Unit Code (HUC) of the watershed plus a unique 4-digit numeric suffix assigned chronologically as reaches are created. Leave this field blank if a Phase 1 assessment has not been completed for the watershed in which you are conducting an ANR Bridge and Culvert Assessment.
Road Name: Record the full E911 road name, consistent with the VGIS Road Standard. E911 road names can
be obtained from the “E911 /RDS” data layer available from VCGI. The database contains drop-down menus of road names by town.
Road Type: Record the type of road on which the structure is located: Gravel = Road surface is packed gravel Paved = Road surface is paved with tar or other surface material other than dirt
Trail = A travel lane not used, or no longer used, by cars. May accommodate foot traffic or recreational motor vehicles (i.e., snow mobiles or ATVs) Railroad = Active or abandoned railroad bed
Stream Name: Name of the waterbody the structure crosses, as printed on the USGS topographic map. It is
also helpful to note the name of the receiving water in parentheses after the stream name.
Stream Geomorphic Assessment Handbooks VT Agency of Natural Resources March, 2009 - G4 -

High Flow Stage: Circle yes or no to indicate whether the stream flow is higher than average, such as occurs after rains or snowmelt. Circle yes when the flow elevation is at or above the halfway point between the bed of the channel and the top of the banks. Water may appear more turbid than usual due to recent runoff event. Documenting high flows helps with data interpretation, as the stage and turbidity of the discharge may obscure features such as sediment deposits and culvert outlet drop heights. It is highly recommended that bridge/culvert assessments be conducted during typical summer low flow conditions.
Channel Width: Record the bankfull width of the reference channel, measured across the channel at the bankfull flow elevation, which is considered to be the flood height that occurs on an annual to biannual basis (See Appendix K). You may also choose to estimate the bankfull channel width using the Vermont regional hydraulic geometry curve (HGC) developed by the ANR River Management Program – see Appendix J. At this time the curves are recommended for estimating channel width only on streams and rivers that are similar to those from which the curves were developed, including mid-to-large sized streams in unconfined, moderate to gentle gradient, alluvial settings. Where Phase 1 assessments have been completed, HGC-calculated channel widths are available for those reaches in such settings. The Vermont HGC channel width equation is:
W = 13.1(X)0.44, where X = drainage area in sq. mi.
Round the calculated value to the nearest foot.
Refer to Phase 1 Step 2.7 for more information on determining channel width using the Vermont HGC.
On small, steep streams in confined or narrow valleys, measured bankfull widths will likely be more accurate than those produced by the Vermont regional HGC. Using a tape measure, determine the width of the channel at a location away from the structure that does not show evidence of being impacted by the stream crossing structure. If banks are nearly vertical, simply measure from top-of-bank to top-of-bank. If banks are stepped or more moderately sloped (see Figure 1), use depositional features, scour lines, and, to a lesser extent, the height of woody vegetation to help determine the bankfull elevation at which to measure the reference condition channel width. See Appendix K for more information on determining bankfull elevation and width).
Structure skewed to roadway: Indicate whether the structure is skewed (or angled) in comparison to the
roadway by circling “yes” or “no” where indicated on the field form. Keep in mind when measuring the structure span/diameter that if the structure is installed at an angle under the roadway the structure opening(s) may have been cut or built at an angle, resulting in a structure opening that is larger than the span/diameter inside the structure. Be sure to measure the actual inside span/diameter of the structure perpendicular to the stream channel.
Figure 1. Bankfull elevation on a steep upland stream at which bankfull channel width measurements are taken.
Stream Geomorphic Assessment Handbooks VT Agency of Natural Resources March, 2009 - G5 -

Bridge/Arch Header
Structure Width (road width): Record the width of the bridge or arch in feet. This is the structure dimension measured across the roadway. In most cases this measurement will be the same as the road width. See component “A” in the bridge diagram on page G3.
Structure Clearance (height): Record in feet the
clearance beneath the bridge/arch by measuring the distance from the water surface (at time of survey) to the underside of the top of the structure.
Structure Span (width): Record in feet the cross-
sectional span of the bridge as measured on the road surface. For arches measure the span at the bottom of the arch curve, at or near where the arch sits on its footers (see Figure 2). Where there are multiple arches at one crossing add the structures’ width measurements together and record a total combined width.
Structure Material: Circle the type of material of
which the structure is constructed: aluminum, wrought iron, cast iron, concrete, masonry (arches) & slabs, pre-stressed concrete/post-tensioned, steel, timber, or other.
Number of bridge piers or # arches at crossing: Record the number of piers supporting the bridge or the
number of arch structures at the crossing. Piers are support structures within the span of the structure, not the abutments supporting the ends of the structure. Though there is usually only one arch per road crossing, there can also be two or more installed side-by-side.
Culvert Header Culvert Length: Using a tape measure, record the length of the culvert to the nearest foot.
Culvert Height: Using a depth rod and/or tape measure, record the height of the culvert in decimal feet to the
nearest tenth of feet. For circular culverts the height measurement will be the same as the width measurement. A depth rod is usually a better tool than a tape measure for measuring culvert height, as it can be held straight in the stream flow without being swept downstream. If multiple culverts are present record an average of their heights. Note in the comments section if one pipe is significantly larger than the other(s).
Culvert Width (diameter): Using a tape measure, record the width (or diameter) of the culvert in decimal feet to the nearest tenth of feet. Where there are multiple culverts at one crossing add the structures’ width measurements together and record a total combined width. Do not include overflow pipes in the total culvert width (see below). If a structure is installed at an angle under the roadway such that the structure opening(s) has been cut or built at an angle, resulting in a larger opening than the width (diameter) inside the structure, be sure to measure the actual inside width perpendicular to the stream channel.
Culvert Material: Circle the type of material of which the culvert is constructed: concrete, plastic corrugated,
plastic smooth, tank, steel corrugated, stone, aluminum corrugated, other, mixed.
clearance
span
Figure 2. Measuring arch span and clearance.
Stream Geomorphic Assessment Handbooks VT Agency of Natural Resources March, 2009 - G6 -

Number of culverts at crossing: Record the number of culverts installed at the road crossing. Though there is usually only one culvert per road crossing, there can also be two or more installed side-by-side. Count all culverts that are installed at or below the bankfull elevation. Do not count overflow pipes (see below) or nearby culverts carrying tributary or road drainage flows (i.e. those not installed to carry the main stream flow).
Overflow pipes: Overflow pipes are typically smaller in dimension than the main culvert(s) at a stream
crossing and are usually installed at a higher elevation. In this protocol, all culverts located above the bankfull elevation are considered overflow pipes. Do not include overflow pipes when determining the number of culverts at the crossing. Indicate the presence or absence of overflow pipes on the field form by circling “Y” or “N” in the appropriate space. Also, do not include the width(s) of overflow pipe(s) when determining total culvert width (see above).
Geomorphic and Fish Passage Data General Data Floodplain filled by roadway approaches: Circle the approximate amount of floodplain filled up to or above
the flood prone elevation by the roadway approaches on either side of the structure. The flood prone elevation is the height equal to 2 times the maximum bankfull channel depth measured above the streambed (see Phase 2, Step 2.7).
Entirely = More than ¾ of the floodplain width is occupied by approach ramps (see Figure 4) Partially = Between ¼ and ¾ of the floodplain width is occupied by approach ramps (see Figure 3) Not Significant = Less than ¼ of the floodplain width is occupied by approach ramps
Left Approach Ramp Right Approach Ramp
Culvert Cross-section area of bankfull flood Additional flood area cross-section up to the floodprone elevation
Flood prone elevation at a height = 2 X the max. bankfull channel depth Road surface
Figure 3. Valley cross-section where the left and right approach ramps partially occupy floodprone area.
A B
Figure 4. Cross-section view of culvert site where the left and right approach ramps entirely occupy the floodprone area. Solid Black Line = elevation of road surface and approaches to culvert site Dashed White Line = flood prone elevation at a height that is 2 X the maximum bankfull channel depth (height B as measured from the bed) Dotted White Line = maximum depth from the stream bed to the elevation of bankfull (height A). See Channel Width discussion.
Stream Geomorphic Assessment Handbooks VT Agency of Natural Resources March, 2009 - G7 -

Structure located at a significant break in valley slope: Circle “yes” if the structure is located on a stream
segment of relatively gentle-gradient that is within 1/3 mile downstream of a significantly steeper segment of stream. Use a topographic map to assist with this evaluation. If you do not have a topo map or the forest cover obscures your view of upstream topography, circle “unsure” on the field form. Significant changes in channel slope are usually reflective of breaks in valley slope and may result in a dramatic decrease in the stream’s sediment transport capacity. A structure may be particularly prone to failure if it is located on an alluvial fan or similar high deposition area.
Culvert slope as compared with channel slope: Circle whether the culvert slope, as compared to the channel
slope, is significantly higher, lower, or the same. This is a visual estimate intended to red flag locations where the culvert was placed at a noticeably different slope than that of the channel.
Upstream Data Is structure opening partially obstructed by: Circle all the types of material that are obstructing any part of
the structure’s opening.
Wood debris = Woody material such as logs, branches, and trees Sediment = Soil and rocks, typically transported and deposited by the stream. Note: If the entire culvert bottom is filled with sediment, this is not considered an obstruction of the structure
opening. The retention of sediment throughout the length of a culvert usually facilitates the passage of fish and wildlife through the structure and is an indication that the structure is maintaining sediment transport. Only record sediment as an obstruction if it fills some of the structure opening and results in a drop of the water flow down into the culvert.
Deformation = Crushed, bent, or broken structure covering structure opening None = No part of structure opening is covered
Steep riffle present immediately upstream of structure: Indicate yes or no whether a steep riffle spans or nearly spans the cross-section of the stream immediately upstream of the structure opening. Steep riffles are a wedge of sediment that has deposited across the stream as a result of the backwater that occurs during high water events at inadequately sized structures. Steep riffles located just upstream of the structure opening are not recorded as an obstruction of the opening and they may not appear as a mid-channel bar, however they are indicative of a depositional process that is being caused or exacerbated by the structure, similar to the process that leads to the formation of a mid-channel bar.
Figure 5. Steep riffle spanning the channel cross-section immediately upstream of the structure opening.
Stream Geomorphic Assessment Handbooks VT Agency of Natural Resources March, 2009 - G8 -

If channel avulses: Looking upstream, imagine the stream flowing up and out of the channel at the structure due to an obstruction, high flows, or both. Before eventually re-entering the channel at some point downstream, will the stream flow:
Cross Road = re-entering the channel immediately downstream of the structure. This typically occurs when the road approaches are higher in elevation than the road surface at the crossing;
Follow Road = traveling down the ditch or shoulder of the road for a distance before leaving the road vicinity and traveling overland to re-enter the stream channel.
Unsure = the topography in the vicinity of the crossing is too subtle to ascertain whether the stream will cross the roadway immediately returning to the channel or follow the road for some distance before re-entering the channel.
If the “Follow Road” option is chosen, estimate in feet the distance the stream would follow the road before reentering the stream channel.
Angle of stream flow approaching structure: Circle the type of angle that best describes the way that the
stream flow is entering the structure. Sharp bend = Severe angle of entry, 45 to 90 degree bend (see Figure 6) Mild bend = Gentle angle of entry, 5 to 45 degree bend (see Figure 6) Naturally straight = flow enters the structure straight-on with no channelization evident Channelized straight = Channel was modified to a straight planform and flow enters the structure
straight-on. Indicators of channelization include: armored stream banks, channel just upstream of straightened section is naturally sinuous, or documentation of past channel-straightening activities.
Figure 6. Mild (above) and sharp (right) angles of stream flow to bridge structures.
Stream Geomorphic Assessment Handbooks VT Agency of Natural Resources March, 2009 - G9 -
Downstream Data Water depth in culvert: At the culvert invert, measure the depth of the water in the culvert to the nearest tenth
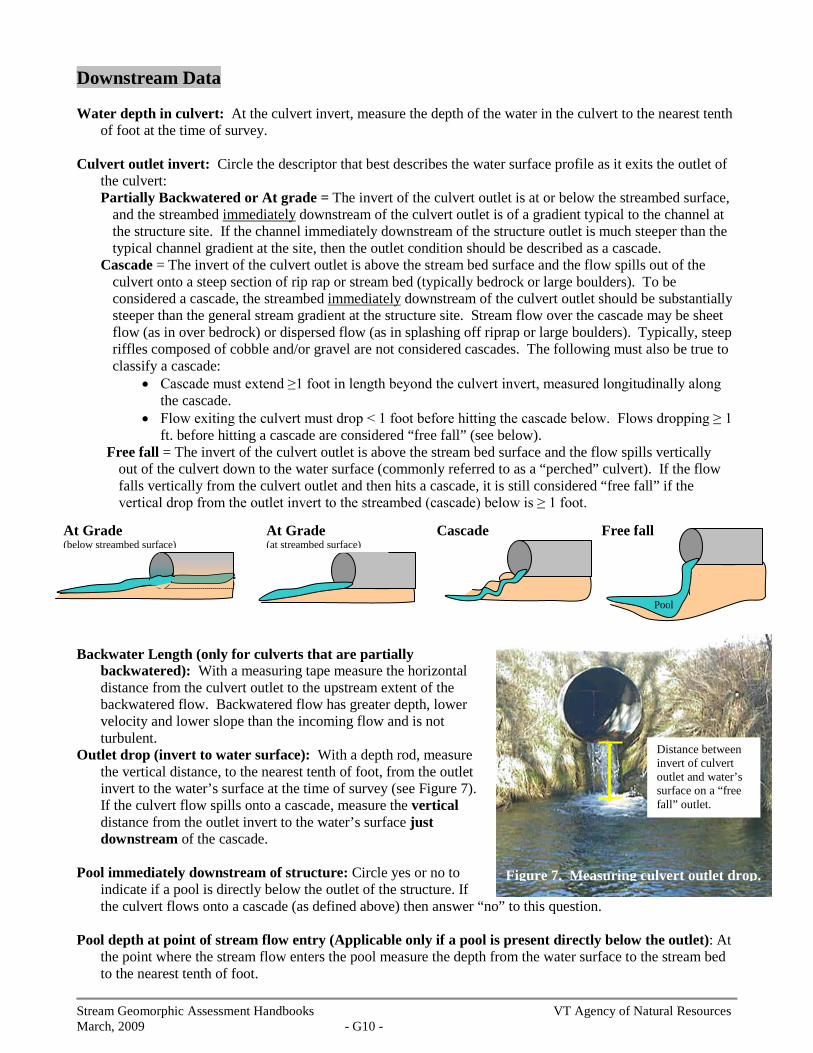
of foot at the time of survey. Culvert outlet invert: Circle the descriptor that best describes the water surface profile as it exits the outlet of
the culvert: Partially Backwatered or At grade = The invert of the culvert outlet is at or below the streambed surface,
and the streambed immediately downstream of the culvert outlet is of a gradient typical to the channel at the structure site. If the channel immediately downstream of the structure outlet is much steeper than the typical channel gradient at the site, then the outlet condition should be described as a cascade.
Cascade = The invert of the culvert outlet is above the stream bed surface and the flow spills out of the culvert onto a steep section of rip rap or stream bed (typically bedrock or large boulders). To be considered a cascade, the streambed immediately downstream of the culvert outlet should be substantially steeper than the general stream gradient at the structure site. Stream flow over the cascade may be sheet flow (as in over bedrock) or dispersed flow (as in splashing off riprap or large boulders). Typically, steep riffles composed of cobble and/or gravel are not considered cascades. The following must also be true to classify a cascade:
• Cascade must extend ≥1 foot in length beyond the culvert invert, measured longitudinally along the cascade.
• Flow exiting the culvert must drop < 1 foot before hitting the cascade below. Flows dropping ≥ 1 ft. before hitting a cascade are considered “free fall” (see below).
Free fall = The invert of the culvert outlet is above the stream bed surface and the flow spills vertically out of the culvert down to the water surface (commonly referred to as a “perched” culvert). If the flow falls vertically from the culvert outlet and then hits a cascade, it is still considered “free fall” if the vertical drop from the outlet invert to the streambed (cascade) below is ≥ 1 foot.
Backwater Length (only for culverts that are partially
backwatered): With a measuring tape measure the horizontal distance from the culvert outlet to the upstream extent of the backwatered flow. Backwatered flow has greater depth, lower velocity and lower slope than the incoming flow and is not turbulent.
Outlet drop (invert to water surface): With a depth rod, measure the vertical distance, to the nearest tenth of foot, from the outlet invert to the water’s surface at the time of survey (see Figure 7). If the culvert flow spills onto a cascade, measure the vertical distance from the outlet invert to the water’s surface just downstream of the cascade.
Pool immediately downstream of structure: Circle yes or no to
indicate if a pool is directly below the outlet of the structure. If the culvert flows onto a cascade (as defined above) then answer “no” to this question.
Pool depth at point of stream flow entry (Applicable only if a pool is present directly below the outlet): At
the point where the stream flow enters the pool measure the depth from the water surface to the stream bed to the nearest tenth of foot.
At Grade (at streambed surface)
Cascade At Grade (below streambed surface)
Free fall
Pool
Distance between invert of culvert outlet and water’s surface on a “free fall” outlet.
Figure 7. Measuring culvert outlet drop.
Stream Geomorphic Assessment Handbooks VT Agency of Natural Resources March, 2009 - G10 -

Pool maximum depth (Applicable only if a pool is present directly below the outlet): At the point of
maximum pool depth estimate the pool depth. If the estimated depth is less than four feet measure the distance from the water surface to the stream bed to the nearest tenth of foot. If the estimated depth is greater than four feet simply record it as such.
Downstream bank heights are substantially higher than upstream bank heights: Circle yes or no to indicate
whether stream bank heights downstream of the structure are greater than bank heights upstream of the structure. This is an indication that bed degradation may have occurred downstream of the structure.
Stepped Footers: Indicate yes if there is evidence that more than one set of
footers was poured (out of concrete) or constructed to support the bridge abutments or arch. Stepped footers that are poured of concrete have the appearance of a stair step (Figure 8). Footers are retrofitted in this way in an attempt to stop the failure of the structure due to streambed scour around and below the structure that occurs after initial installation of the structure.
Upstream - Downstream - In Structure Table Completing the Upstream/Downstream/In Structure table on the field form requires evaluating the channel and riparian area adjacent to the structure. In general, consider an area extending 100 feet upstream or downstream from the structure. On larger rivers, this length of channel should be viewable from the road, but on smaller streams it may require walking down into the channel. Dominant Bed Material at structure: Circle the sediment size class that covers the majority of the stream bed
area upstream of, downstream of, and within the structure. If the streambed is not visible, choose “unknown.” If larger materials are embedded with fine sediment, such as cobbles embedded with silt-sand, record the dominant bed material as cobble even if the silt-sand fraction seems to be in equal proportion to the cobble.
Millimeters
Inches Relative Size
0 None Applies to culverts where the absence of natural stream substrates within the culvert is the dominant condition
1 Bedrock
> 4096 > 160 Bigger than a Volkswagen Bug 2 Boulder
256 - 4096
10.1 - 160 Basketball to Volkswagen Bug
3 Cobble
64 – 256
2.5 - 10.1 Tennis ball to basketball 4 Gravel
2 – 64
0.08 – 2.5 Pepper corn to tennis ball
5 Silt-Sand < 2.00 < 0.08 Silt size to pepper corn
UK Unknown Applies when the stream bed is not visible due to deep or turbid water or darkness within the structure
Bedrock present in channel at structure: Indicate yes (Y) or no (N) whether there is any bedrock visible in the channel upstream or downstream of the structure. For bridge and arches also note if there is any bedrock within the structure.
Material throughout: For culverts, indicate yes (Y) or no (N) whether natural stream substrates exist over the entire length of the streambed through the culvert.
Sediment deposit types: Circle the type of sediment deposits observed upstream, downstream, and in the
structure. Depositional features are further defined in Appendix Q Glossary.
Figure 8. Stepped footers on an arch.
Stream Geomorphic Assessment Handbooks VT Agency of Natural Resources March, 2009 - G11 -
Mid-channel bar = Areas of sediment deposition (bars) built up above the streambed elevation of the nearby
area, located in the channel away from the banks and generally found in areas where the channel runs straight
Point bar = Bars that are adjacent to the bank typically occurring on the inside edge of meander bends Delta bar = Sediment deposits where a tributary enters a mainstem channel, often fan-shaped Side bar = Unvegetated sediment deposits located along the margins of the channel in locations other than the
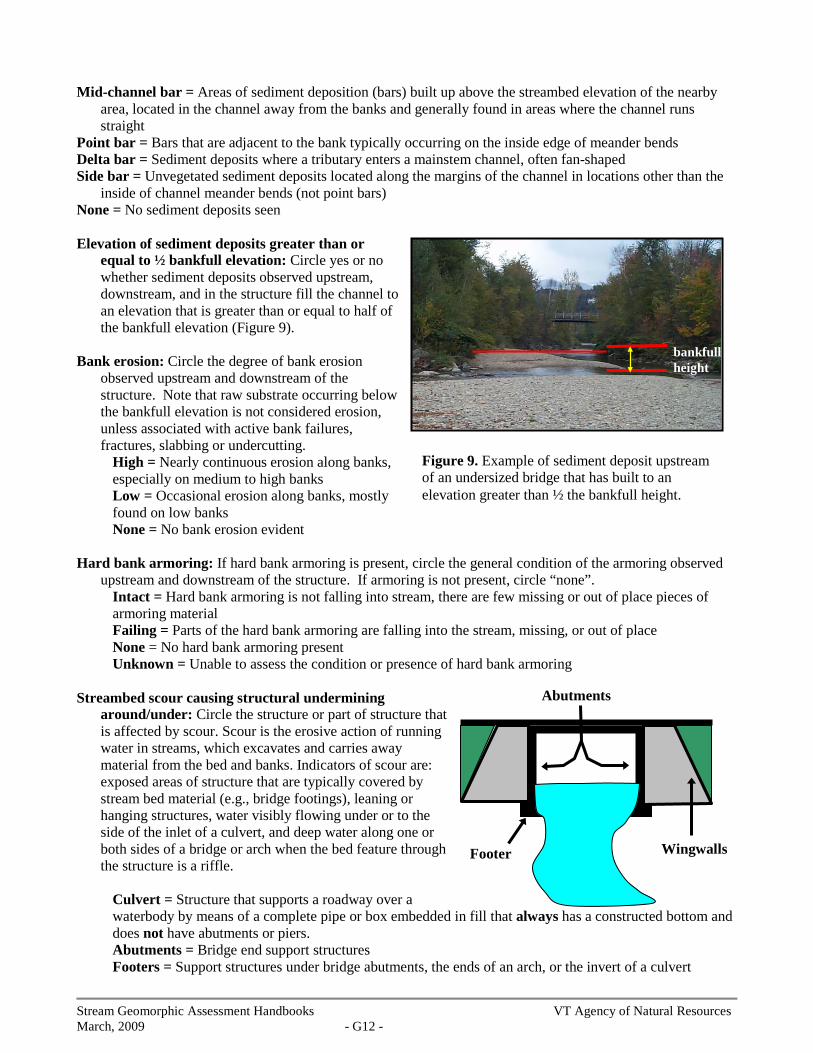
inside of channel meander bends (not point bars) None = No sediment deposits seen Elevation of sediment deposits greater than or
equal to ½ bankfull elevation: Circle yes or no whether sediment deposits observed upstream, downstream, and in the structure fill the channel to an elevation that is greater than or equal to half of the bankfull elevation (Figure 9).
Bank erosion: Circle the degree of bank erosion
observed upstream and downstream of the structure. Note that raw substrate occurring below the bankfull elevation is not considered erosion, unless associated with active bank failures, fractures, slabbing or undercutting.
High = Nearly continuous erosion along banks, especially on medium to high banks Low = Occasional erosion along banks, mostly found on low banks None = No bank erosion evident
Hard bank armoring: If hard bank armoring is present, circle the general condition of the armoring observed
upstream and downstream of the structure. If armoring is not present, circle “none”. Intact = Hard bank armoring is not falling into stream, there are few missing or out of place pieces of armoring material Failing = Parts of the hard bank armoring are falling into the stream, missing, or out of place None = No hard bank armoring present Unknown = Unable to assess the condition or presence of hard bank armoring
Streambed scour causing structural undermining
around/under: Circle the structure or part of structure that is affected by scour. Scour is the erosive action of running water in streams, which excavates and carries away material from the bed and banks. Indicators of scour are: exposed areas of structure that are typically covered by stream bed material (e.g., bridge footings), leaning or hanging structures, water visibly flowing under or to the side of the inlet of a culvert, and deep water along one or both sides of a bridge or arch when the bed feature through the structure is a riffle.
Culvert = Structure that supports a roadway over a waterbody by means of a complete pipe or box embedded in fill that always has a constructed bottom and does not have abutments or piers. Abutments = Bridge end support structures Footers = Support structures under bridge abutments, the ends of an arch, or the invert of a culvert
Abutments
Footer Wingwalls
Figure 9. Example of sediment deposit upstream of an undersized bridge that has built to an elevation greater than ½ the bankfull height.
bankfull height
Stream Geomorphic Assessment Handbooks VT Agency of Natural Resources March, 2009 - G12 -
Wing walls = Concrete, wooden, or metal walls that flare out from the side of the opening of the bridge, arch, or culvert None = No scour is seen around/under structure
Beaver dam near structure: Indicate yes or no whether a beaver dam is located within 100 feet upstream or
downstream of the structure. Distance from structure to beaver dam: Enter the estimated distance, in feet, from the structure opening to
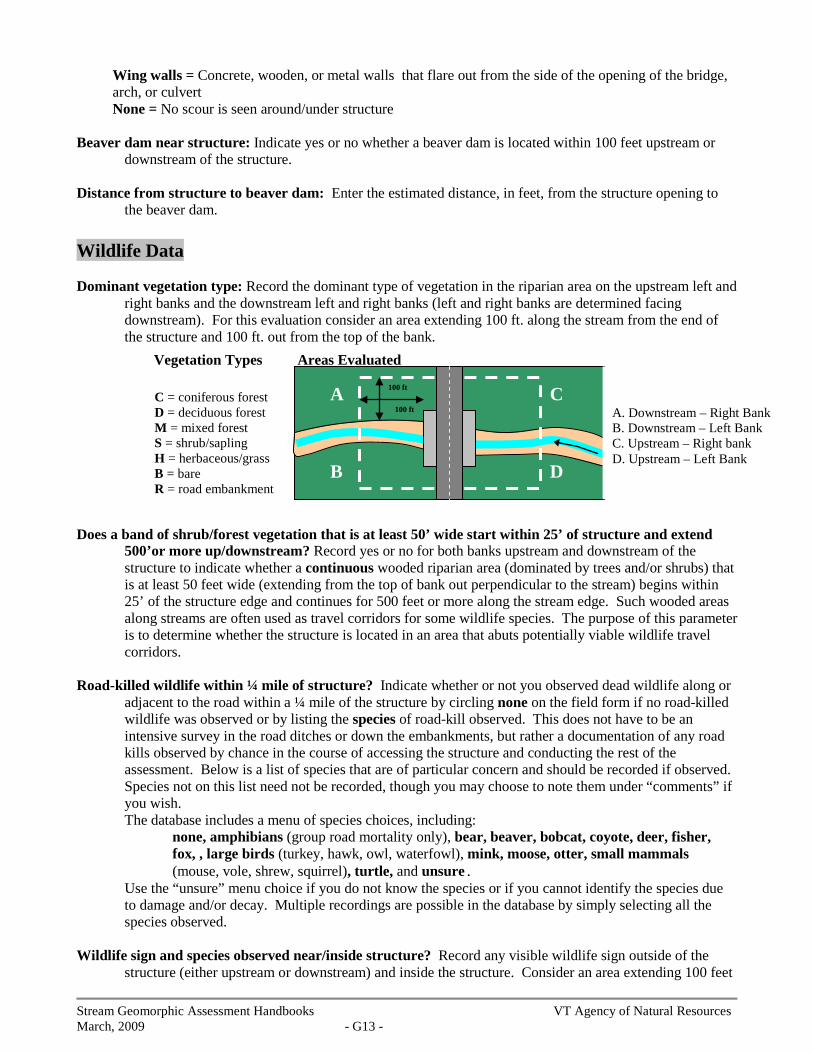
the beaver dam. Wildlife Data Dominant vegetation type: Record the dominant type of vegetation in the riparian area on the upstream left and
right banks and the downstream left and right banks (left and right banks are determined facing downstream). For this evaluation consider an area extending 100 ft. along the stream from the end of the structure and 100 ft. out from the top of the bank.
Vegetation Types Areas Evaluated
C = coniferous forest D = deciduous forest M = mixed forest S = shrub/sapling H = herbaceous/grass B = bare R = road embankment
Does a band of shrub/forest vegetation that is at least 50’ wide start within 25’ of structure and extend
500’or more up/downstream? Record yes or no for both banks upstream and downstream of the structure to indicate whether a continuous wooded riparian area (dominated by trees and/or shrubs) that is at least 50 feet wide (extending from the top of bank out perpendicular to the stream) begins within 25’ of the structure edge and continues for 500 feet or more along the stream edge. Such wooded areas along streams are often used as travel corridors for some wildlife species. The purpose of this parameter is to determine whether the structure is located in an area that abuts potentially viable wildlife travel corridors.
Road-killed wildlife within ¼ mile of structure? Indicate whether or not you observed dead wildlife along or
adjacent to the road within a ¼ mile of the structure by circling none on the field form if no road-killed wildlife was observed or by listing the species of road-kill observed. This does not have to be an intensive survey in the road ditches or down the embankments, but rather a documentation of any road kills observed by chance in the course of accessing the structure and conducting the rest of the assessment. Below is a list of species that are of particular concern and should be recorded if observed. Species not on this list need not be recorded, though you may choose to note them under “comments” if you wish. The database includes a menu of species choices, including:
none, amphibians (group road mortality only), bear, beaver, bobcat, coyote, deer, fisher, fox, , large birds (turkey, hawk, owl, waterfowl), mink, moose, otter, small mammals (mouse, vole, shrew, squirrel), turtle, and unsure.
Use the “unsure” menu choice if you do not know the species or if you cannot identify the species due to damage and/or decay. Multiple recordings are possible in the database by simply selecting all the species observed.
Wildlife sign and species observed near/inside structure? Record any visible wildlife sign outside of the
structure (either upstream or downstream) and inside the structure. Consider an area extending 100 feet
A
B
C
D
100 ft
100 ft A. Downstream – Right Bank B. Downstream – Left Bank C. Upstream – Right bank D. Upstream – Left Bank
Stream Geomorphic Assessment Handbooks VT Agency of Natural Resources March, 2009 - G13 -

upstream and downstream of the structure on both right and left banks, including the channel bed and banks. This does not have to be an exhaustive survey, but rather a documentation of any wildlife sign observed in the course of conducting the rest of the assessment. If you are experienced in identifying wildlife sign, record the species that made the sign. If you do not know the species write, “unsure”.
The DMS includes a menu of sign types, including:
none, tracks, scat, den holes, carcass (not road-killed), feeding signs, mark trees, rub/rut pits, bedding sites, hair, and sightings.
The above sign types are paired with the following list of species in the database: none, mink, deer, moose, bear, beaver, bobcat, otter, fisher, and unsure. Use the “unsure” menu choice if you do not know which species made the sign.
Multiple recordings are possible in the database by simply selecting all the species and sign types observed. The above list of species includes those that are of particular concern and should be recorded if observed. Species not on this list need not be recorded, though you may choose to note them under “comments” if you wish.
Note: If you see a carcass that is obviously road-killed, do not double count it by recording it for this parameter. Only record it in the road-kill parameter (above). Carcasses that are not obviously road-kills should be recorded here and not in the road-kill parameter.
Spatial data collected with GPS: Circle yes or no to indicate whether or not spatial data was collected with a
GPS unit to document the location of the structure. Only circle yes here if you are actually collecting data points and planning to process the data to create a spatial data layer. Do not circle yes if you are only using a GPS unit to determine latitude and longitude for the purposes of completing the field form header.
Photos: Circle yes or no to indicate whether or not photos were taken at the site. Taking photos is highly
recommended. You can use the back of the field form as a photo log. Record roll and frame number and photo perspective (ex., downstream view of inlet, upstream view of outlet) for each photo taken at the site. The following photo views are recommended:
• Upstream view of stream above structure • Downstream view of structure inlet • Upstream view of structure outlet • Downstream view of stream below structure • Evidence of wildlife use • Any features or parameters on the field form that you have questions about or are not sure
how to answer Be sure to include scale in your photos, such as a person or a depth rod, especially when photographing the structure openings.
Comments: This space provides an opportunity to note observations about the site that have not been captured by the other parameters. You may also want to qualify any of the decisions that you made in choosing from the menus offered under each parameter. If a VTrans bridge and culvert survey is not being completed at the same time, make observations about the condition of the structure if possible. Finally, if any protocol described in the handbook is unclear given the conditions at your site, make a note of this to inform the VT Agency of Natural Resources on how this protocol can serve you better.
Stream Geomorphic Assessment Handbooks VT Agency of Natural Resources March, 2009 - G14 -

On-line DMS B&C Database and Standard Reports There are several standard reports built into the database that are useful for analyzing the geomorphic compatibility and fish and wildlife passage concerns of the structures assessed. The five standard database reports are:
1. Bridge and Culvert Summary Reports – an output of all assessment data gathered at an individual
structure, presented in a format similar to the assessment field form;
2. Geomorphic Compatibility Screen– ranks the geomorphic incompatibility of each structure;
3. Failure Modes Report –lists probable failure modes and existing problems, sorted by town and road name or by stream name;
4. Failure Modes Report – Problem Causes – displays data for each structure that explains the
predicted failure modes and existing problems related to fluvial geomorphic incompatibility;
5. Culvert Aquatic Organism Passage Report – lists whether culverts definitely block, potentially block, or do not block aquatic organism passage, sorted by town and road name or by stream name. Bridges are not evaluated for aquatic organism passage because in almost all cases they do not obstruct the movement of aquatic organisms;
6. Retrofit Potential Report – lists the feasibility of retrofitting an existing structure to decrease its impact to
aquatic organism migration;
7. AOP Habitat Potential Connectivity Screen - calculates the potential full network and mainstem stream lengths reconnected with AOP improvements at a particular culvert;
8. Wildlife Passage Suitability Report – lists structures potentially suitable to facilitate terrestrial
wildlife movement under roadways, sorted by town and road name or by stream name; Ideally, these reports, when combined with VTrans culvert inventory data, will help town road managers and State Transportation Engineers to prioritize the replacement and/or maintenance of VTrans and ANR “critical” structures. (VTrans “Critical” structures are those scoring 6 or less on VTrans’ condition inventories.) These reports are also valuable to watershed planners, fish and wildlife biologists, and others working with transportation officials to plan for, budget, and process regulatory permits for structure replacements and retro-fits with the goal of avoiding future problems by enhancing the compatibility of structures with the geomorphic processes and habitat functions at stream crossings. Following is a detailed discussion of the standard database reports. Geomorphic Compatibility Screen The screening tool has been developed based on the disruption of natural sediment/debris transport, hydrology, and deviation from natural channel dimensions. For example, identification and a qualitative description of excessive upstream aggradation and downstream channel incision during an assessment are used as a measure of the presence and degree of sediment discontinuity. A structure’s deviation from the natural channel width, slope, and alignment indicates departure from natural stream conditions. The five variables (i.e., percent bankfull width, sediment and debris continuity, slope, approach angle, and bank erosion) are each scored on a scale from 0 to 5, with 5 indicating full geomorphic compatibility between the structure and the channel and 0 indicating complete incompatible due to a strong departure from a natural
Stream Geomorphic Assessment Handbooks VT Agency of Natural Resources March, 2009 - G15 -
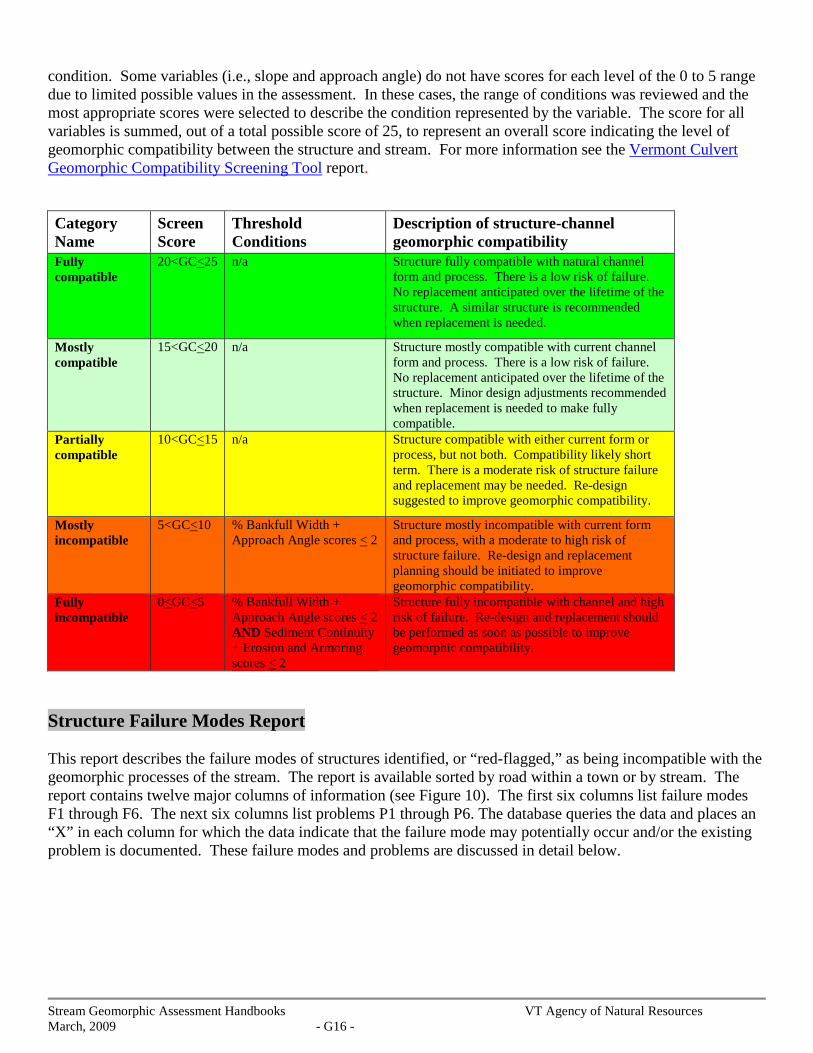
condition. Some variables (i.e., slope and approach angle) do not have scores for each level of the 0 to 5 range due to limited possible values in the assessment. In these cases, the range of conditions was reviewed and the most appropriate scores were selected to describe the condition represented by the variable. The score for all variables is summed, out of a total possible score of 25, to represent an overall score indicating the level of geomorphic compatibility between the structure and stream. For more information see the Vermont Culvert Geomorphic Compatibility Screening Tool report. Category Name
Screen Score
Threshold Conditions
Description of structure-channel geomorphic compatibility
Fully compatible
20<GC<25 n/a Structure fully compatible with natural channel form and process. There is a low risk of failure. No replacement anticipated over the lifetime of the structure. A similar structure is recommended when replacement is needed.
Mostly compatible
15<GC<20 n/a Structure mostly compatible with current channel form and process. There is a low risk of failure. No replacement anticipated over the lifetime of the structure. Minor design adjustments recommended when replacement is needed to make fully compatible.
Partially compatible
10<GC<15 n/a Structure compatible with either current form or process, but not both. Compatibility likely short term. There is a moderate risk of structure failure and replacement may be needed. Re-design suggested to improve geomorphic compatibility.
Mostly incompatible
5<GC<10 % Bankfull Width + Approach Angle scores < 2
Structure mostly incompatible with current form and process, with a moderate to high risk of structure failure. Re-design and replacement planning should be initiated to improve geomorphic compatibility.
Fully incompatible
0<GC<5 % Bankfull Width + Approach Angle scores < 2 AND Sediment Continuity + Erosion and Armoring scores < 2
Structure fully incompatible with channel and high risk of failure. Re-design and replacement should be performed as soon as possible to improve geomorphic compatibility.
Structure Failure Modes Report This report describes the failure modes of structures identified, or “red-flagged,” as being incompatible with the geomorphic processes of the stream. The report is available sorted by road within a town or by stream. The report contains twelve major columns of information (see Figure 10). The first six columns list failure modes F1 through F6. The next six columns list problems P1 through P6. The database queries the data and places an “X” in each column for which the data indicate that the failure mode may potentially occur and/or the existing problem is documented. These failure modes and problems are discussed in detail below.
Stream Geomorphic Assessment Handbooks VT Agency of Natural Resources March, 2009 - G16 -

Figure 10. Example layout of the Failure Modes Report Potential Failure due to Outflanking – is typically associated with an undersized structure with inadequate
sediment conveyance. Sediment accumulation upstream of the structure leads to outflanking during flood conditions when the enlarged stream cannot flow through the structure. The potential for failure due to outflanking also exists when the stream is a high sediment load system (as evidenced by large sediment deposits upstream of the structure inlet) and the structure is poorly located just downstream of a significant change in the valley slope.
Potential Failure due to Scour – may be caused by inadequate structure sizing as well, but may also result
from having the wrong type of structure or one that has been poorly located or aligned with the stream flow. Culverts or bridge components may fail when scour leads to substantial undermining of the structure.
Potential Failure due to ice or debris jam –may be the result of inadequate sizing and sediment discontinuity
at the structure, or due to location and/or alignment problems.
Structure related damage due to flooding of adjacent property – may be caused when the structure and the roadway approaches create enough of a dam during high flows to cause the backup of flood water and inundation-related damage to upstream adjacent property.
Stream Geomorphic Assessment Handbooks VT Agency of Natural Resources March, 2009 - G17 -

Structure related damage due to erosion of adjacent property – will be very common when structure failure is indicated due to geomorphic incompatibility. Erosion of road shoulders, stream banks, and other property may be observed both upstream and downstream of bridge and culvert structures.
Existing Problems: The database query will place an “X” in columns P1 through P6 where data indicate that existing problems may contribute to the potential failure mode(s) listed. This data is particularly useful in interpreting why the potential failure modes exist. For instance, a structure that is indicated to have a potential for failure due to outflanking may exhibit existing problem P1, “upstream sediment deposit”, (Figure 11). Documenting existing problems is useful in prioritizing structure replacements and/or repairs. For example, , an bridge that is undersized and is documented to be currently experiencing scour may be a higher priority due to potential failure caused by scour than a bridge that, while undersized, is not currently documented to have scour around/under the structure. Structure Width vs. Channel Width: The last column in the report contains a ratio of the structure span/diameter divided by the stream bankfull width (represented as percentage). When this number is less than 100%, the structure span or diameter is less than the width of the channel and, along with other observations, may indicate potential failure. If it is 75% or less the structure is significantly undersized and all three potential failure modes may occur. Problem Causes Report This report displays data for each structure that explains the predicted failure modes and existing problems related to fluvial geomorphic incompatibility. The report is available sorted by road within a town or by stream. The report contains fourteen columns of data (Figure 12) that are grouped in relation to the problem to which they pertain. For example, the problem of upstream sediment deposition may be indicated by three different data fields: structure openings obstructed with sediment, upstream sediment deposits greater than half bankfull height, and steep riffle present upstream of structure. Evaluating how many of these conditions are present at the structure gives more insight as to the potential severity of the upstream sediment deposition problem. This report can be used to help further prioritize structures in need of attention due to fluvial geomorphic incompatibility.
Figure 11. Outflanking Failure at undersized culvert where upstream sediment deposits were observed.
Stream Geomorphic Assessment Handbooks VT Agency of Natural Resources March, 2009 - G18 -
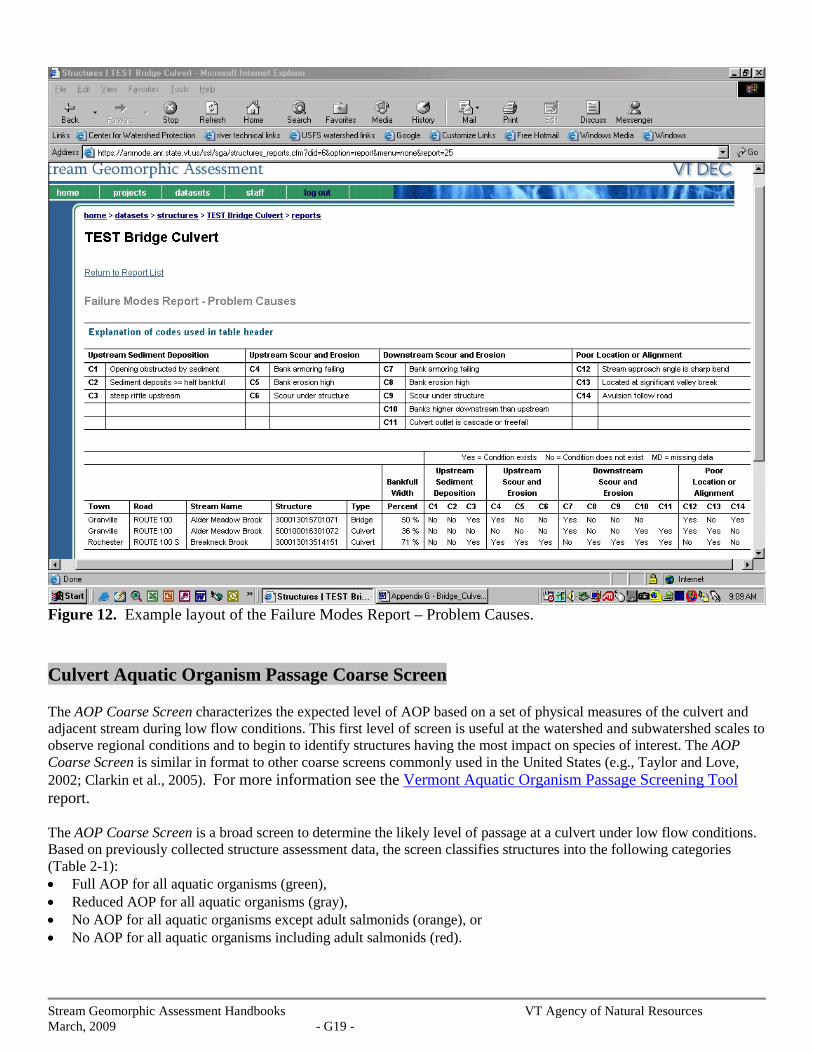
Figure 12. Example layout of the Failure Modes Report – Problem Causes. Culvert Aquatic Organism Passage Coarse Screen The AOP Coarse Screen characterizes the expected level of AOP based on a set of physical measures of the culvert and adjacent stream during low flow conditions. This first level of screen is useful at the watershed and subwatershed scales to observe regional conditions and to begin to identify structures having the most impact on species of interest. The AOP Coarse Screen is similar in format to other coarse screens commonly used in the United States (e.g., Taylor and Love, 2002; Clarkin et al., 2005). For more information see the Vermont Aquatic Organism Passage Screening Tool report. The AOP Coarse Screen is a broad screen to determine the likely level of passage at a culvert under low flow conditions. Based on previously collected structure assessment data, the screen classifies structures into the following categories (Table 2-1): • Full AOP for all aquatic organisms (green), • Reduced AOP for all aquatic organisms (gray), • No AOP for all aquatic organisms except adult salmonids (orange), or • No AOP for all aquatic organisms including adult salmonids (red).
Stream Geomorphic Assessment Handbooks VT Agency of Natural Resources March, 2009 - G19 -

Figure 13. Example layout of the Aquatic Organism Passage Report. Note that only culverts are evaluated for the potential to block aquatic organism movement, because in almost all cases bridges and arches do not block the ability of organisms to move up and down the stream channel. There may be a few rare situations where bridges or arches restrict aquatic organism passage, such as when a bridge constricts flow over a bedrock dominated streambed, resulting in impassable stream flow velocities; however, these situations are likely rare. If you do note such situations and are planning to evaluate aquatic organism passage in detail, be sure to include these structures in future surveys of red and gray structures.
Stream Geomorphic Assessment Handbooks VT Agency of Natural Resources March, 2009 - G20 -

Culvert Retrofit Potential Screen The primary constraints for AOP at a given structure are generally driven by the magnitude of the culvert’s length, outlet drop and constriction (% bankfull width). The AOP Retrofit Potential Screen estimates the potential to improve AOP at a culvert with Reduced AOP or No AOP (i.e., coarse screen category gray, orange or red). For each assessed culvert, a retrofit potential category of low (L), medium (M), or high (H) (Table 3-1A) is assigned for each of strong, moderate, and weak swimming / leaping ability groups (Table 3-1B). A high retrofit potential indicates that the culvert is more likely to be improved, while moderate and low retrofit potential indicate increasing challenges for AOP enhancements at the structure. Each structure is assigned a 3-letter retrofit potential category corresponding to the retrofit potential for the strong, moderate and weak swimming groups (i.e., strong-moderate-weak, LLL, MLL, MML, MMM, HML, HMM, HHM, HHH). For more information see the Vermont Culvert Geomorphic Compatibility Screening Tool report. AOP Habitat Connectivity Potential Screen The Connectivity Potential Report is based on a GIS-based analysis to calculate the potential full network and mainstem stream lengths reconnected with AOP improvements at culverts. The full database of culverts can be analyzed for upstream full network and mainstem distance to the next barrier or stream source. This level of information will be updated annually as the culvert database increases in size with more assessments and answer general questions about stream fragmentation. ArcMap (ESRI, 2006) and the RivEx Vector River Network Tool (Hornby, 2008) are used to find distances and results are transferred to Excel for basic calculations and data organization. The values of the screening variables can be conveniently viewed on a local catchment GIS map along with the retrofit potential category. GIS maps containing screen results are useful for locating structures along the drainage network and examining the density of blockages. For more information see the Vermont Culvert Geomorphic Compatibility Screening Tool report. Wildlife Passage Suitability Report
Stream Geomorphic Assessment Handbooks VT Agency of Natural Resources March, 2009 - G21 -

This report lists structures potentially suitable to facilitate terrestrial wildlife movement under roadways. The report can be sorted by town and road name or by stream name.
Figure 14. Example layout of the Wildlife Suitability Passage Report. The three right columns list all species for which road-kill or wildlife sign was recorded at/near the structure and potentially indicate that wildlife are using the structure for crossing, or are crossing the road in the vicinity of the structure. These columns help prioritize structures for improving wildlife movement across transportation corridors. Note, however that there is abundant additional information about wildlife habitats available; including several GIS data layers, which should be considered in such prioritization efforts. If you are evaluating wildlife movement and road crossing barriers in detail, you should contact the Vermont Fish and Wildlife Department’s district wildlife biologists for assistance.
Stream Geomorphic Assessment Handbooks VT Agency of Natural Resources March, 2009 - G22 -

Bridge & Arch Assessment Field Form- Geomorphic & Habitat Parameters Structure Type: bridge / arch Field Map # ______
GGeeoommoorrpphhiicc aanndd FFiisshh PPaassssaaggee DDaattaa
GGeenneerraall
Floodplain filled by roadway approaches: entirely partially not significant Structure located at a significant break in valley slope: yes no unsure UUppssttrreeaamm
Is structure opening partially obstructed by (circle all that apply): wood debris sediment deformation none Steep riffle present immediately upstream of structure: yes no If channel avulses, stream will: cross road follow road unsure Estimated distance avulsion would follow road: ____________ (feet) Angle of stream flow approaching structure: sharp bend mild bend naturally straight channelized straight
DDoowwnnssttrreeaamm
Pool immediately downstream of structure: yes no Maximum pool depth: (0.0 feet or >4feet) Downstream bank heights are substantially higher than upstream bank heights: yes no Stepped footers: yes no
SGAStructure ID
Struct_Num
Observer(s) / Organization(s)
Date
Town
Phase 1 Project
Location Longitude (E/W)
Reach VTID Latitude (N/S)
Road Name Road Type paved gravel trail
railroad
Stream Name High Flow Stage yes no
Channel Width curve measured (ft.)
Stru
ctur
e M
ater
ial aluminum, wrought iron, cast iron
concrete masonry (arches) & slabs prestressed concrete/post-tensioned steel timber other
Structure skewed to roadway yes no
Structure Width (road width) (ft.) Structure
Clearance (ft.)
Structure Span (ft.) # of bridge piers or # arches at crossing
Stream Geomorphic Assessment Handbooks VT Agency of Natural Resources March, 2009 - G23 -
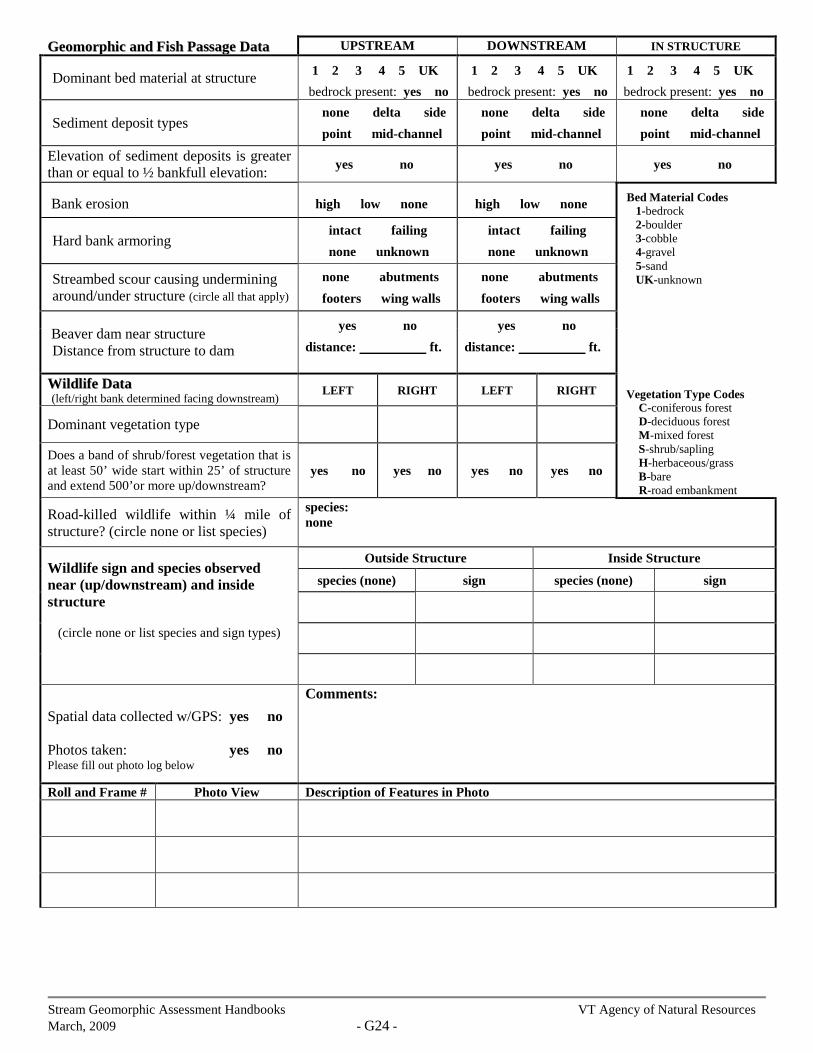
GGeeoommoorrpphhiicc aanndd FFiisshh PPaassssaaggee DDaattaa UPSTREAM DOWNSTREAM IN STRUCTURE
Dominant bed material at structure
1 2 3 4 5 UK
bedrock present: yes no
1 2 3 4 5 UK
bedrock present: yes no
1 2 3 4 5 UK
bedrock present: yes no
Sediment deposit types none delta side
point mid-channel none delta side
point mid-channel none delta side
point mid-channel Elevation of sediment deposits is greater than or equal to ½ bankfull elevation: yes no yes no yes no
Bank erosion high low none high low none Bed Material Codes 1-bedrock 2-boulder 3-cobble 4-gravel 5-sand UK-unknown
Hard bank armoring intact failing
none unknown intact failing
none unknown
Streambed scour causing undermining around/under structure (circle all that apply)
none abutments
footers wing walls none abutments
footers wing walls
Beaver dam near structure Distance from structure to dam
yes no
distance: ft.
yes no
distance: ft.
WWiillddlliiffee DDaattaa (left/right bank determined facing downstream) LEFT RIGHT LEFT RIGHT
Vegetation Type Codes C-coniferous forest D-deciduous forest M-mixed forest S-shrub/sapling H-herbaceous/grass B-bare R-road embankment
Dominant vegetation type
Does a band of shrub/forest vegetation that is at least 50’ wide start within 25’ of structure and extend 500’or more up/downstream?
yes no yes no yes no yes no
Road-killed wildlife within ¼ mile of structure? (circle none or list species)
species: none
Wildlife sign and species observed near (up/downstream) and inside structure
(circle none or list species and sign types)
Outside Structure Inside Structure
species (none) sign species (none) sign
Spatial data collected w/GPS: yes no Photos taken: yes no Please fill out photo log below
Comments:
Roll and Frame # Photo View Description of Features in Photo
Stream Geomorphic Assessment Handbooks VT Agency of Natural Resources March, 2009 - G24 -

Culvert Assessment Field Form - Geomorphic & Habitat Parameters Field Map # ______ SGA Structure ID
Struct_Num
Observer(s) / Organization(s)
Date
Town
Phase 1 Project
Location Longitude (E/W)
Reach VTID Latitude (N/S)
Road Name Road Type paved gravel trail
railroad
Stream Name High Flow Stage yes no
Channel Width curve measured (ft.)
Cul
vert
Mat
eria
l concrete plastic corrugated plastic smooth tank steel corrugated stone aluminum corrugated other mixed
Structure skewed to roadway yes no
Culvert Length (ft.) Culvert Height (ft.)
Culvert Width (ft.)
# of culverts at crossing
Overflow pipe(s) yes no
GGeeoommoorrpphhiicc aanndd FFiisshh PPaassssaaggee DDaattaa
GGeenneerraall
Floodplain filled by roadway approaches: entirely partially not significant Structure located at a significant break in valley slope: yes no unsure Culvert slope as compared with the channel slope is: higher lower same
UUppssttrreeaamm
Is structure opening partially obstructed by (circle all that apply): wood debris sediment deformation none Steep riffle present immediately upstream of structure: yes no If channel avulses, stream will: cross road follow road unsure Estimated distance avulsion would follow road: (feet) Angle of stream flow approaching structure: sharp bend mild bend naturally straight channelized straight
DDoowwnnssttrreeaamm
Water depth in culvert (at outlet): (0.0 feet) Culvert outlet invert: partially backwatered or at grade cascade free fall Backwater Length (measured from outlet): _________ (0.0 feet) Outlet drop (invert to water surface): (0.0 feet) Pool present immediately downstream of structure: yes no Pool depth at point of streamflow entry: (0.0 feet) Maximum pool depth: (0.0 feet or >4feet) Downstream bank heights are substantially higher than upstream bank heights: yes no
Stream Geomorphic Assessment Handbooks VT Agency of Natural Resources March, 2009 - G25 -

GGeeoommoorrpphhiicc aanndd FFiisshh PPaassssaaggee DDaattaa UPSTREAM DOWNSTREAM IN STRUCTURE
Dominant bed material at structure
1 2 3 4 5 UK
bedrock present: yes no
1 2 3 4 5 UK
bedrock present: yes no
0 1 2 3 4 5 UK
material throughout: yes no
Sediment deposit types none delta side
point mid-channel none delta side
point mid-channel none delta side
point mid-channel Elevation of sediment deposits is greater than or equal to ½ bankfull elevation: yes no yes no yes no
Bank erosion high low none high low none Bed Material Codes 0-none 1-bedrock 2-boulder 3-cobble 4-gravel 5-sand UK-unknown
Hard bank armoring intact failing
none unknown intact failing
none unknown
Streambed scour causing undermining around/under structure (circle all that apply)
none culvert
footer wing walls none culvert
footer wing walls
Beaver dam near structure Distance from structure to dam
yes no
distance: ft.
yes no
distance: ft.
WWiillddlliiffee DDaattaa (left/right bank determined facing downstream) LEFT RIGHT LEFT RIGHT
Vegetation Type Codes C-coniferous forest D-deciduous forest M-mixed forest S-shrub/sapling H-herbaceous/grass B-bare R-road embankment
Dominant vegetation type
Does a band of shrub/forest vegetation that is at least 50’ wide start within 25’ of structure and extend 500’or more up/downstream?
yes no yes no yes no yes no
Road-killed wildlife within ¼ mile of structure? (circle none or list species)
species: none
Wildlife sign and species observed near (up/downstream) and inside structure
(circle none or list species and sign types)
Outside Structure Inside Structure
species (none) sign species (none) sign
Spatial data collected w/GPS: yes no Photos taken: yes no Please fill out photo log below
Comments:
Roll and Frame # Photo View Description of Features in Photo
Stream Geomorphic Assessment Handbooks VT Agency of Natural Resources March, 2009 - G26 -