appendix - 2 drawings
TRANSCRIPT

APPENDIX - 2
DRAWINGS

ANN9-2: APP2/JL-1
List of Drawings: Jebel Lado Irrigation Scheme
No. Name of Drawing Sheet
1. Irrigation Plan
1-1 Scheme Layout 1
2. Pump Station
2-1 Pump Station 1
2-2 Discharge Chamber 1
3. Main Irrigation Canal (Northern Canal)
3-1 Profile of Northern Canal 1
3-2 Typical Cross Section of Northern Canal 1
3-3,3-4 Cross Section of Northern Canal (1/2) - (2/2) 2
4. Main Irrigation Canal (Southern Canal)
4-1 Profile of Southern Canal 1
4-2 Typical Cross Section of Southern Canal 1
4-3, 4-4 Cross Section of Southern Canal (1/2) - (2/2) 2
5. Secondary Canal and Drainage Canal
5-1 Typical Cross Section of Command Area 1
5-2 Typical Cross Section of Drainage Canal 1
6. Road Crossing Structure
6-1 Road Crossing 1
Total 14

Flow
1-1 Scheme Layout
APP2 J-1
AN
N9-2: A
PP2/JL-2

2-1 Pump Station
APP2 J-2
AN
N9-2: A
PP2/JL-3

2-2 Discharge Chamber
APP2 J-3
AN
N9-2: A
PP2/JL-4

3+05
23+
000
2+50
0
2+00
0
1+50
0
1+00
0
0+50
0
0+00
0
6+00
0
5+50
0
5+00
0
4+50
0
4+00
0
3+50
0
3+10
0
6+12
5
461.0
046
1.06
460.2
4
459.0
4
458.0
0
458.2
8
459.4
8
460.4
4
460.3
9
459.0
3
457.5
4
455.9
2
454.6
0
454.1
6
453.5
8
460.3
2
PRES
ENT
460.6
5746
0.647
460.5
47
460.4
47
460.3
47
460.2
47
460.1
47
460.0
47
459.9
97
459.0
46
457.4
86
455.9
26
454.5
68
454.0
18
453.5
78
461.5
0746
1.497
461.3
97
461.2
97
461.1
97
461.0
97
460.9
97
460.8
97
460.8
47
459.4
96
457.9
36
456.3
76
454.8
68
454.3
18
453.8
78
461.5
0046
1.490
461.3
90
461.2
90
461.1
90
461.0
90
460.9
90
460.8
90
460.8
40
459.4
47
457.8
87
456.3
27
454.8
48
454.2
98
453.8
58
PLAN
d=0.8
43m
d=0.4
01m
d=0.2
80m
3+05
2
5+80
0
4+10
0
3+10
0
0+00
06+
125
APP2 J-4
AN
N9-2: A
PP2/JL-5

843
200
850 1050
401
200
450 65
0
28015
030
0450
3-2 Typical Cross Section of Northern Canal
APP2 J-5
AN
N9-2: A
PP2/JL-6

3-3 Cross Section of Northern Canal (1/2)
APP2 J-6
AN
N9-2: A
PP2/JL-7

3-4 Cross Section of Northern Canal (2/2)
APP2 J-7
AN
N9-2: A
PP2/JL-8

3+05
246
1.00
PRES
ENT
460.5
5246
1.500
PLAN
3+50
0
4+00
0
4+50
0
5+00
0
5+50
0
6+00
0
6+50
0
6+95
20+
000
0+50
0
1+00
0
1+50
0
2+00
0
2+50
0
3+00
03+
100
460.2
6
459.8
7
461.2
9
462.0
1
461.1
0
462.8
6
462.2
0
460.0
5
460.0
2
459.4
7
458.7
3
458.0
1
456.5
9
453.8
645
3.58
459.9
7
d=0.9
48m
d=0.5
31m
d=0.3
47m
3+05
2
1+00
0
6+95
20+
000
460.4
62
460.3
62
460.2
62
460.1
62
459.9
62
459.8
62
459.7
72
459.6
72
459.5
72
458.7
37
457.9
02
456.7
34
454.2
3445
3.734
460.0
62
461.6
52
461.5
62
461.4
62
461.3
62
461.2
62
461.1
62
461.0
62
460.9
62
460.8
72
460.7
72
460.6
72
459.4
87
458.6
52
457.3
34
454.8
3445
4.334
460.3
22
461.4
10
461.3
10
461.2
10
461.1
10
461.0
10
460.9
10
460.7
20
460.6
20
460.5
20
459.2
68
458.4
33
454.5
8145
4.081
460.8
10
460.1
03
457.0
812+
400
APP2 J-8
AN
N9-2: A
PP2/JL-9

948
200
950 1150
531
200
550 75
0
250
350 60
0
4-2 Typical Cross Section of Southern Canal
APP2 J-9
AN
N9-2: A
PP2/JL-10

4-3 Cross Section of Southern Canal (1/2)
APP2 J-10
AN
N9-2: A
PP2/JL-11

4-4 Cross Section of Southern Canal (2/2)
APP2 J-11
AN
N9-2: A
PP2/JL-12

TYPE-A
500
200
20030
0
20030
0
200
450
TYPE-B
500
200
20030
0
20030
0
TYPE-C30
020
0
20030
0
20030
0
5-1 Typical Cross Section of Command Area
APP2 J-12
AN
N9-2: A
PP2/JL-13

SD-1 (Q=3.78m3/s)30
0
300
1250
1233
SD-2 (Q=2.83m3/s)
300
300
1100
1074
SD-3 (Q=2.16m3/s)
300
300
1000
931
SD-4 (Q=1.44m3/s)
300
300
800
786
SD-5 (Q=0.72m3/s)
300
300
600
585
5-2 Typical Cross Section of Drainage Canal
APP2 J-13
AN
N9-2: A
PP2/JL-14

Ø40
060
0
d=27
0 450
Ø30
060
0
d=17
4 300
Ø60
090
0
300
6-1 Road Crossing
APP2 J-14
AN
N9-2: A
PP2/JL-15

APPENDIX - 3
PROJECT INVESTMENT COST

RSS, MEDIWR, Water Sector, Irrigation Development Master Plan (IDMP)
ANN9-2: APP3/JL-1
3.1 Project Investment Cost
Project Cost million US$
No. Work Description Unit QuantityPrice
(1000 US$)Total
(1000 US$) 1. Works
1-1. Pump Station LS. 1 1,999 1,999 1-2. Pipeline LS. 1 3,437 3,437 1-3. Main Irrigation Canal LS. 1 7,908 7,908 1-4. Facilities in Command Area LS. 1 7,162 7,162
Sub-total 20,506
Direct Construction Cost (A) Indirect Construction Cost (B = A * 45%)
C = A + B
Adminiostration (D = C * 4%) Consultant Fee (E = C * 5%)
Physical Contingency (F = C * 5%)
Grand Total Cost (F = C + D + E)
(*1000 US$)
FC. (60%) 20,400 LC. (40%) 13,600
(*1000 US$)
ha 34 million US$ / 1330ha = 25,600 (US$)
1,487 1,487
33,897 34,000
Jebel Lado Irrigation Scheme
20,506 9,228
29,734
34
1,189

Annex 9-2 - Appendix 3: Project Investment Cost_Jebel Lado
ANN9-2: APP3/JL-2
3.2 Pump Station & Pipeline Works
Pump Statoin & Pipeline Works million US$
No. Work Description Unit QuantityUnit Price
(US$)Total(US$)
1. Pump Station Work1-1. Pump Building1-1-1. Common Excavation m3 451 10.0 4,509 1-1-2. Leveling Concrete m3 11 350.0 3,784 1-1-3. Backfill m3 28 11.0 313 1-1-4. Building m2 210 2,800.0 588,000
Sub total 596,606 1-2. Pump Facilities1-2-1. Pump Facilities (Pump, Engne & Auxiliary equipment) nos 2 420,000.0 840,000 1-2-2. Pipe(SP, φ700) m 50 500.0 25,115 1-2-3. Control Panel nos 1 86,500.0 86,500 1-2-4. Overhead Crane(5ton) nos 1 77,900.0 77,900 1-2-5. Butterfly valve(φ700) nos 2 33,000.0 66,000 1-2-6. Check valve(φ700) nos 2 64,000.0 128,000 1-2-7. Flexible tube(φ700) nos 4 8,100.0 32,400 1-2-8. Steel pile(φ600, L=15m) nos 28 3,600.0 100,800
Sub total 1,356,715 1-3. Slope protection1-3-1. Masonry m3 265 140.0 37,044 1-3-2. Support Concrete (18N) m3 13 350.0 4,582 1-3-3. Leveling Concrete m3 1 350.0 350 1-3-4. Gravel m3 1 50.0 72 1-3-5. Temporary Works (River Close) 10% of above sum L.S 1 4,200.0 4,200
Sub total 46,248 2. Pipeline Work2-1. Pipeline2-1-1. Common Excavation m3 13,623 10.0 136,228 2-1-2. Sand(under) m3 1,352 24.0 32,457 2-1-3. Sand(around) m3 4,903 24.0 117,669 2-1-4. Backfill m3 4,882 11.0 53,700 2-1-5. Pipe(SP, φ1,200) m 2,199 1,400.0 3,078,600
Sub total 3,418,654 2-2. Discharge Chamber2-2-1. Common Excavation m3 375 10.0 3,751 2-2-2. Leveling Concrete m3 1 300.0 384 2-2-3. Gravel m3 4 50.0 192 2-2-4. Backfill m3 243 11.0 2,676 2-2-5. Reinforced Concrete m3 25 440.0 11,057
Sub total 18,060
Direct cost Sub-total 5,436,283
Pump Station 1,999,569 Pipeline 3,436,714
Jebel Lado Irrigation Scheme5.4

RSS, MEDIW
R, Water Sector, Irrigation Developm
ent Master Plan (IDM
P)
AN
N9-2: A
PP3/JL-3

Annex 9-2 - Appendix 3: Project Investment Cost_Jebel Lado
AN
N9-2: A
PP3/JL-4

RSS, MEDIW
R, Water Sector, Irrigation Developm
ent Master Plan (IDM
P)
AN
N9-2: A
PP3/JL-5

Annex 9-2 - Appendix 3: Project Investment Cost_Jebel Lado
AN
N9-2: A
PP3/JL-6

RSS, MEDIWR, Water Sector, Irrigation Development Master Plan (IDMP)
ANN9-2: APP3/JL-7
3.3 Main Irrigation Canal Works
Main Irrigation Canal Works million US$
No. Work Description Unit QuantityUnit Price
(US$)Total(US$)
1. TYPE N11-1. Preparatory Work1-1-1. Site Clearing (Cutting & Clearing of Grass, Bushes) ha 4.5 11,900.0 53,550
*Average width of excavation x Canal length Sub total 53,550 1-2. Earth Work1-2-1. Excavation of Surface Soil (200mm Depth) m3 8,694 8.0 69,554 1-2-2. Excavation for Common Soil m3 577 10.0 5,774 1-2-3. Spreading (Bulldozer) m3 75,196 13.0 977,545 1-2-4. Embankment with Compaction m3 75,196 14.0 1,052,741 1-2-5. Soil (Banking Material) m3 74,618 7.6 567,100 1-2-6. Hauling by Dump Truck (Banking Material) m3 74,618 9.0 671,566 1-2-7. Aggregate, Crushed, 2-4cm (Gravel Pavement) m3 819 50.0 40,965 1-2-8. Spreading of Aggregate (Bulldozer) m3 819 13.0 10,651
Sub total 3,395,896 1-3. Canal Work (Main Canal)1-3-1. Class 18 Concrete (include Form Work) m3 1,182 350.0 413,700
Sub total 413,700 1-4. Canal Structure (Main Canal)1-4-1. Turnout (Slide Gate, B=0.3m, H=0.3m) unit 1 220.0 220
Sub total 220 Total 3,863,366
2. TYPE N22-1. Preparatory Work2-1-1. Site Clearing (Cutting & Clearing of Grass, Bushes) ha 1.3 11,900.0 15,470
*Average width of excavation x Canal length Sub total 15,470 2-2. Earth Work2-2-1. Excavation of Surface Soil (200mm Depth) m3 2,225 8.0 17,800 2-2-2. Excavation for Common Soil m3 908 10.0 9,080 2-2-3. Spreading (Bulldozer) m3 6,969 13.0 90,596 2-2-4. Embankment with Compaction m3 6,969 14.0 97,565 2-2-5. Soil (Banking Material) m3 6,061 7.6 46,063 2-2-6. Hauling by Dump Truck (Banking Material) m3 6,061 9.0 54,548 2-2-7. Aggregate, Crushed, 2-4cm (Gravel Pavement) m3 425 50.0 21,250 2-2-8. Spreading of Aggregate (Bulldozer) m3 425 13.0 5,525
Sub total 342,427 2-3. Canal Work (Main Canal)2-3-1. Class 18 Concrete (include Form Work) m3 340 350.0 119,000
Sub total 119,000 2-4. Canal Structure (Main Canal)2-4-1. Turnout (Slide Gate, B=0.3m, H=0.3m) unit 5 220.00 1,100
Sub total 1,100 Total 477,997
North Canal
Jebel Lado Irrigation Scheme
7.9

Annex 9-2 - Appendix 3: Project Investment Cost_Jebel Lado
ANN9-2: APP3/JL-8
3. TYPE N33-1. Preparatory Work3-1-1. Site Clearing (Cutting & Clearing of Grass, Bushes) ha 0.7 11,900.0 8,330
*Average width of excavation x Canal length Sub total 8,330 3-2. Earth Work3-2-1. Excavation of Surface Soil (200mm Depth) m3 1,617 8.0 12,932 3-2-2. Excavation for Common Soil m3 61 10.0 605 3-2-3. Spreading (Bulldozer) m3 4,832 13.0 62,817 3-2-4. Embankment with Compaction m3 4,832 14.0 67,649 3-2-5. Soil (Banking Material) m3 4,772 7.6 36,264 3-2-6. Hauling by Dump Truck (Banking Material) m3 4,772 9.0 42,944 3-2-7. Aggregate, Crushed, 2-4cm (Gravel Pavement) m3 331 50.0 16,550 3-2-8. Spreading of Aggregate (Bulldozer) m3 331 13.0 4,303
Sub total 244,064 3-3. Canal Work (Main Canal)3-3-1. Class 18 Concrete (include Form Work) m3 172 350.0 60,200
Sub total 60,200 3-4. Canal Structure (Main Canal)3-4-1. Turnout (Slide Gate, B=0.3m, H=0.3m) unit 3 220.0 660
Sub total 660 Total 313,254
4. TYPE S14-1. Preparatory Work4-1-1. Site Clearing (Cutting & Clearing of Grass, Bushes) ha 5.6 11,900.0 66,640
*Average width of excavation x Canal length Sub total 66,640 4-2. Earth Work4-2-1. Excavation of Surface Soil (200mm Depth) m3 6,578 8.0 52,621 4-2-2. Excavation for Common Soil m3 24,274 10.0 242,741 4-2-3. Spreading (Bulldozer) m3 37,578 13.0 488,517 4-2-4. Embankment with Compaction m3 37,578 14.0 526,095 4-2-5. Soil (Banking Material) m3 13,304 7.6 101,111 4-2-6. Hauling by Dump Truck (Banking Material) m3 13,304 9.0 119,737 4-2-7. Aggregate, Crushed, 2-4cm (Gravel Pavement) m3 1,225 50.0 61,250 4-2-8. Spreading of Aggregate (Bulldozer) m3 1,225 13.0 15,925
Sub total 1,607,997 4-3. Canal Work (Main Canal)4-3-1. Class 18 Concrete (include Form Work) m3 1,911 350.0 668,850
Sub total 668,850 4-4. Canal Structure (Main Canal)4-4-1. Turnout (Slide Gate, B=0.3m, H=0.3m) unit 2 220.0 440
Sub total 440 Total 2,343,927
5. TYPE S25-1. Preparatory Work5-1-1. Site Clearing (Cutting & Clearing of Grass, Bushes) ha 1.3 11,900.0 15,470
*Average width of excavation x Canal length Sub total 15,470
South Canal

RSS, MEDIWR, Water Sector, Irrigation Development Master Plan (IDMP)
ANN9-2: APP3/JL-9
5-2. Earth Work
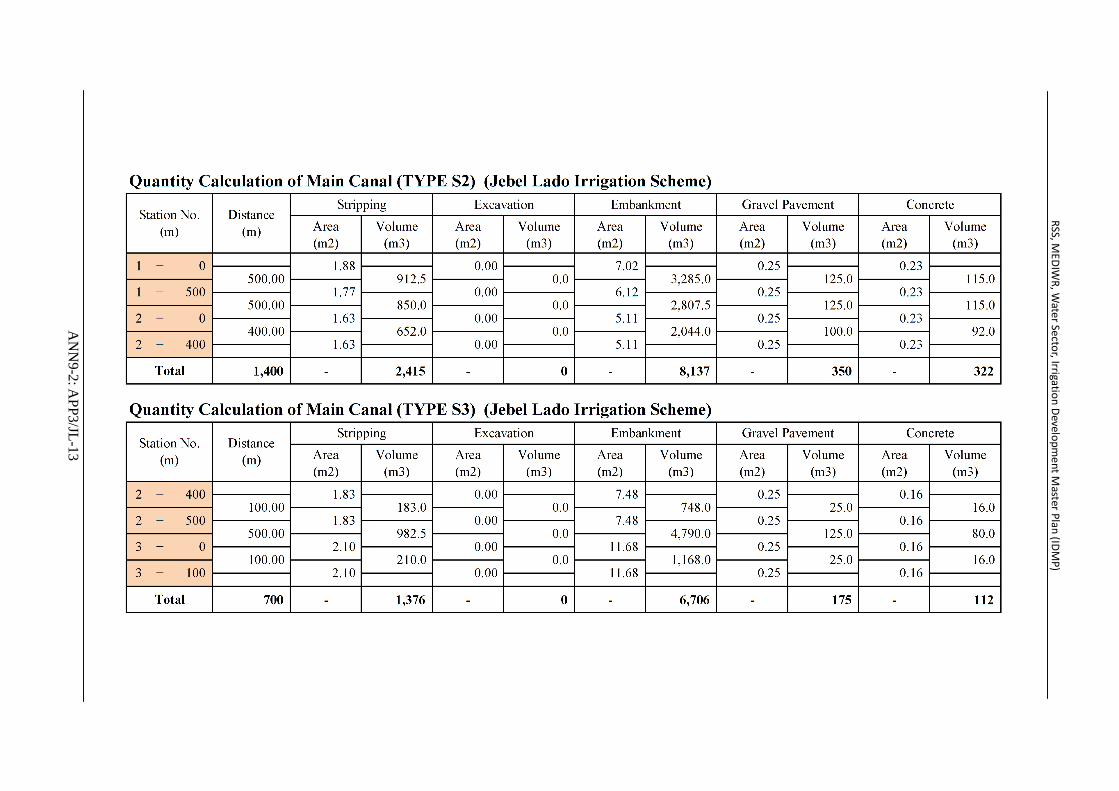
5-2-1. Excavation of Surface Soil (200mm Depth) m3 2,415 8.0 19,316 5-2-2. Excavation for Common Soil m3 0 10.0 0 5-2-3. Spreading (Bulldozer) m3 8,137 13.0 105,775 5-2-4. Embankment with Compaction m3 8,137 14.0 113,911 5-2-5. Soil (Banking Material) m3 8,137 7.6 61,837 5-2-6. Hauling by Dump Truck (Banking Material) m3 8,137 9.0 73,229 5-2-7. Aggregate, Crushed, 2-4cm (Gravel Pavement) m3 350 50.0 17,500 5-2-8. Spreading of Aggregate (Bulldozer) m3 350 13.0 4,550
Sub total 396,118 5-3. Canal Work (Main Canal)5-3-1. Class 18 Concrete (include Form Work) m3 322 350.00 112,700
Sub total 112,700 5-4. Canal Structure (Main Canal)5-4-1. Turnout (Slide Gate, B=0.3m, H=0.3m) unit 5 220.00 1,100
Sub total 1,100 Total 525,388
6. TYPE S36-1. Preparatory Work6-1-1. Site Clearing (Cutting & Clearing of Grass, Bushes) ha 0.7 10,833.30 7,583
*Average width of excavation x Canal length Sub total 7,583 6-2. Earth Work6-2-1. Excavation of Surface Soil (200mm Depth) m3 1,376 7.40 10,179 6-2-2. Excavation for Common Soil m3 0 10.60 0 6-2-3. Spreading (Bulldozer) m3 6,706 13.0 87,178 6-2-4. Embankment with Compaction m3 6,706 18.50 124,061 6-2-5. Soil (Banking Material) m3 6,706 7.60 50,966 6-2-6. Hauling by Dump Truck (Banking Material) m3 6,706 8.00 53,648 6-2-7. Aggregate, Crushed, 2-4cm (Gravel Pavement) m3 175 50.00 8,750 6-2-8. Spreading of Aggregate (Bulldozer) m3 175 9.30 1,628
Sub total 336,410 6-3. Canal Work (Main Canal)
6-3-1. Class 18 Concrete (include Form Work) m3 112 350.0 39,200 Sub total 39,200
6-4. Canal Structure (Main Canal)
5-4-1. Turnout (Slide Gate, B=0.3m, H=0.3m) unit 2 220.0 440 Sub total 440
Total 383,633
Direct Construction Cost (A) (US$)
Irrigation Facility: Main Canal:North: (1) Canal Length (Pump Station to Command Area) = 3,052 m (2) Canal Length (Command Area) = 3,348 mSouth: (1) Canal Length (Dam Site to Command Area) = 3,900 m (2) Canal Length (Command Area) = 3,100 m
Total 13,400 m
7,907,565

Annex 9-2 - Appendix 3: Project Investment Cost_Jebel Lado
AN
N9-2: A
PP3/JL-10

RSS, MEDIW
R, Water Sector, Irrigation Developm
ent Master Plan (IDM
P)
AN
N9-2: A
PP3/JL-11

Annex 9-2 - Appendix 3: Project Investment Cost_Jebel Lado
AN
N9-2: A
PP3/JL-12
RSS, MEDIW
R, Water Sector, Irrigation Developm
ent Master Plan (IDM
P)
AN
N9-2: A
PP3/JL-13

Annex 9-2 - Appendix 3: Project Investment Cost_Jebel Lado
ANN9-2: APP3/JL-14
3.4 On-Farm Irrigation Facilities
Facilities in Farmlamds million US$
No. Work Description Unit QuantityUnit Price
(US$)Total(US$)
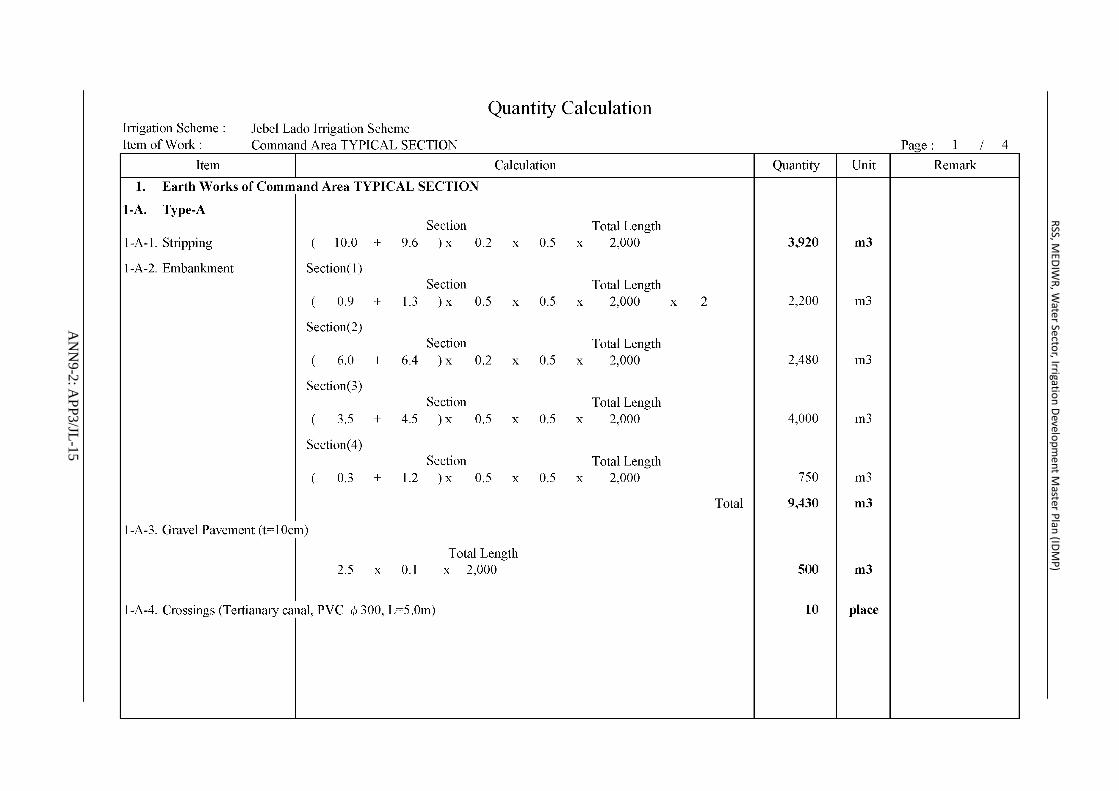
Earth Works1. Earth Works of Command Area TYPICAL SECTION1-1. Stripping m3 140,448 8.0 1,123,584 1-2. Spreading (Bulldozer) m3 99,100 13.0 1,288,300 1-3. Embankment (Canal, Road, etc.) m3 198,170 14.0 2,774,380 1-4. Aggregate, Crushed, 2-4cm (Gravel Pavement) m3 9,975 50.0 498,750 1-5. Spreading of Aggregate (Bulldozer) m3 9,975 13.0 129,675 1-6. Crossings (Tertianary canal, PVC φ300, L=5.0m) place 173 200.0 34,600 1-7. Crossings (Secondary canal, PVC φ400, L=5.0m) place 80 300.0 24,000 1-8. Crossings (Drainage, PVCφ600, Masonry) place 80 3780.0 302,400 1-9. Excavation (Drainage Canal) m3 79,800 10.0 798,000 1-10. Embankment (Drainage Canal) m3 13,433 14.0 188,062
Sub-Total 7,161,751
Direct Construction Cost (A) (US$)
A=1,330 ha (5,385)(US$)
7,161,751
Jebel Lado Irrigation Scheme7.2
RSS, MEDIW
R, Water Sector, Irrigation Developm
ent Master Plan (IDM
P)
AN
N9-2: A
PP3/JL-15

Annex 9-2 - Appendix 3: Project Investment Cost_Jebel Lado
AN
N9-2: A
PP3/JL-16

RSS, MEDIW
R, Water Sector, Irrigation Developm
ent Master Plan (IDM
P)
AN
N9-2: A
PP3/JL-17

Annex 9-2 - Appendix 3: Project Investment Cost_Jebel Lado
AN
N9-2: A
PP3/JL-18

RSS, MEDIW
R, Water Sector, Irrigation Developm
ent Master Plan (IDM
P)
AN
N9-2: A
PP3/JL-19

Annex 9-2 - Appendix 3: Project Investment Cost_Jebel Lado
AN
N9-2: A
PP3/JL-20

APPENDIX - 4
OPERATION AND MAINTENANCE PLAN COST

RSS, MEDIWR, Water Sector, Irrigation Development Master Plan (IDMP)
ANN9-2: APP4/JL-1
4.1 Unit Cost of Personnel Expenses (SSP/month)
Department Staff ing and Specialization Grade
Basic Pay(SSP perMonth)
AveragePay (SSP
per Month)
Accom.Allo. (SSP
perMonth)
Cost ofLiving Allo.(SSP perMonth)
Respon.Allo.
Represen.Allo. (SSPper Month)
JobSpecif ic(SSP perMonth)
Gross Pay(SSP perMonth)
PensionContri.(5%ofGross)
Income Tax:10% of
(Gross-300-Pension)
Net Pay
Manager (Irrigation/Dam Eng.) 3 1,625/2,000
1,813 1,800 75 88 88 810 4,674 234 414 4,026
Deputy Manager (ElectromechanicalEng.)
4 1525/1714 1620 1200 75 75 75 730 3,775 189 329 3258
Senior Accountant 7 1188/1388 1,288 630 63 650 2,631 132 220 2280
Assistant Accountant 9 925/1125 1,025 630 50 450 2,155 108 175 1873
Cooperative/Marketing Off icer 8 1075/1200 1,138 630 50 580 2,398 120 198 2080
Asst. Cooperative/Marketing Off icer 9 925/1125 1,025 630 50 450 2,155 108 175 1873
Tariff Collector (Book-keeper) 12 375/440 408 450 38 400 1,296 65 93 1138Messenger/Guard/Driver 13 313/378 346 450 38 390 1,224 61 86 1077Senior Irri./Dam Eng. (Dam/Pump) 7 1188/1388 1,288 630 63 650 2,631 132 220 2280
Electro-mechanical Eng. 8 1075/1200 1,138 630 50 580 2,398 120 198 2080
Planning and Bugeting Off icer 8 1075/1200 1,138 630 50 580 2,398 120 198 2080
Asst. Irrigation/Dam Eng. 9 925/1125 1,025 630 50 450 2,155 108 175 1873Asst. Planning and Bugeting Off icer 9 925/1125 1,025 630 50 450 2,155 108 175 1873
Irrigation Technician 10 825/950 888 450 38 440 1,816 91 142 1582Pump operator 11 500/565 533 450 38 410 1,431 72 106 1254Irrigation Water Control GateOperator
11 500/565 533 450 38 410 1,431 72 106 1254
Facilities' Guards 11 500/565 533 450 38 410 1,431 72 106 1254Senior Agronomist 7 1188/1388 1,288 630 63 650 2,631 132 220 2280Agronomist 8 1075/1200 1,138 630 50 580 2,398 120 198 2080Agricultural Engineer 8 1075/1200 1,138 630 50 580 2,398 120 198 2080Asst. Agricultural Engineer 9 925/1125 1,025 630 50 450 2,155 108 175 1873Extension Worker 10 825/950 888 450 38 440 1,816 91 142 1582Tractor Operator 11 500/565 533 450 38 410 1,431 72 106 1254Asst. Tractor Operator 13 313/378 346 450 38 390 1,224 61 86 1077Rice mill operator 10 825/950 888 450 38 440 1,816 91 142 1582Asst. Rice mill operator 11 500/565 533 450 38 410 1,431 72 106 1254
Total per month 24,540 16,140 1,257 163 163 13,190 55,453 2,773 4,488 48,192Total per year 294,474 193,680 15,084 1,956 1,956 158,280 665,430 33,272 53,856 578,303
1. Managementstaff
2. Irrigation/DamOperations andMaintenance
3. Farm LevelOperations
4. ProcessingOperations

Annex 9-2 - Appendix 4: Operation and Maintenance Plan Cost_Jebel Lado
ANN9-2: APP4/JL-2
4.2 Annual Personnel Expenses (SSP/year)
Prposed Number ofStaff
Salary Budget(Gross in SSP)
Manager (Irrigation/Dam Eng.) 3 1 4,674Deputy Manager (ElectromechanicalEng.)
4 1 3,775
Senior Accountant 7 1 2,631Cooperative/Marketing Off icer 8 1 2,155Assistant Accountant 9 1 2,398Asst. Cooperative/Marketing Officer 9 1 2,155Tarif f Collector 12 2 1,296Messenger/Guard/Driver 13 6 1,224Senior Irri./Dam Eng, (Dam/Pump) 7 1 2,631Electromechanical Eng. 8 1 2,398Planning and Bugeting Officer 8 1 2,398Asst. Irrigation/Dam Eng. 9 1 2,155Asst. Planning and Bugeting Officer 9 1 2,155Irrigation Technician 10 2 1,816Pump operator 11 2 1,431Irrigation Water Control GateOperator
11 2 1,431
Facilities' Guards 11 4 1,431Senior Agronomist 7 1 2,631Agronomist 8 1 2,398Agricultural Engineer 8 1 2,398Asst. Agricultural Engineer 9 1 2,155Extension Worker 10 2 1,816Tractor Operator 11 1 1,431Asst. Tractor Operator 13 1 1,224Rice mill operator 10 0 0Asst. Rice mill operator 11 0 0
Total per month 37 52,206Total per year 626,472Note: W = Wau, JL = Jebel Lado and RE = Rejaf East
Department Required Staff and Specialization Grade
Management staff
Irrigation/DamOperations andMaintenance
Farm LevelOperations
ProcessingOperations
Jebel Lado Irrigation Scheme

RSS, MEDIWR, Water Sector, Irrigation Development Master Plan (IDMP)
ANN9-2: APP4/JL-3
4.3 Equipment and Machinery Investment Cost
Number
Cost(SSP/year)
Equipment/MachineriesMotor Grader 220HP (John Deere) 2,141,480 15 128,500 1 128,500Backhoe Loader 422F (Caterpillar) 953,304 15 57,200 1 57,200Wheel Loaders 938H (Caterpillar) 2,030,952 15 121,900 1 121,900Dump Truck 6×4 18CUM (Caterpillar) 863,500 15 51,800 1 51,800Motor Bike 10,000 10 900 4 3,600Tractor /d 75HP, 4WD (John Deere) 203,786 10 18,300 7 128,100Attachment (plough) 3-disc (John Deere) 27,632 10 2,500 7 17,500Attachment (harrow) 20-disc manually operated (John
Deere)43,175 10 3,900 7 27,300
Attachment (levellers) 3,600 10 300 7 2,100Attachment (sprayer) 400ml, 8M (John Deere) 46,974 10 4,200 7 29,400Attachment (fertilizer distributor) 13,816 10 1,200 7 8,400Attachment (trailer) 5 tonne (John Deere) 58,718 10 5,300 7 37,100Combine Harvester 81,000 10 7,300 5 36,500Working machines (Workshop)Pick-pu T rack Single Cabine (4DW) 20,900 10 1,900 2 3,800Portable Generator 240V Capacity 112,545 8 12,700 2 25,400Nattery Charger 72V Chapacity 500 8 100 2 200
Generator Perkins Type 1500RPM 150 kVA (380-54\\415V) 357,441 8 40,200 1 40,200
Lathe Machine Universal High Precision 54,600 8 6,100 1 6,100Power Saw 6,400 5 1,200 1 1,200Welding Machine Arc 2,700 5 500 2 1,000Welding Machine Acetylene Gas Welding 1,800 5 300 2 600Power Drill Portable Heavy Duty Hand Drill 500 5 100 1 100Rice MillRice Mill 2.0t/hr 409,500 15 24,600Grain Threshing Machine Vicon Type 1 tonne/hr 7,300 15 400Drying Machine 36,400 15 2,200Warehouse 41,000 15 2,500Total 76 728,000Note: a/ Price quotations are obtained from Lonagro South Sudan Ltd. (Jhon Deere), Ezentus (Catepillar), and Aweil Irrigation Rehabilitation Project. b/ Depreciation schedule is quoted from water supply project in Sounth Asia. c/ 10% of residual value is taken into account in estimation of depreciation cost.
Cost Item Grade/SpecUnit Cost
(SSP/unit) /a
Jebel Lado IrrigationDepreciationSchedule /b
DepreciationCost /c

Annex 9-2 - Appendix 4: Operation and Maintenance Plan Cost_Jebel Lado
ANN9-2: APP4/JL-4
4.4 Equipment and Machinery O&M Cost
NumberCost
(SSP/year)Equipment/MachineriesMotor Grader 150-160HP 2,141,480 21,410 1 21,410Backhoe Loader 90HP 953,304 9,530 1 9,530Wheel Loaders 80HP 2,030,952 20,310 1 20,310Dump T ruck 160HP 863,500 8,640 1 8,640Motor Bike 10,000 100 4 400Tractor /d 75HP, 4WD 203,786 2,040 7 14,280Attachment (plough) 3-disc 27,632 280 7 1,960Attachment (harrow) 20-disc manually operated 43,175 430 7 3,010Attachment (levellers) 3,600 40 7 280Attachment (sprayer) 400ml, 8M 46,974 470 7 3,290Attachment (fertilizer distributor) 13,816 140 7 980Attachment (trailer) 5 tonne 58,718 590 7 4,130Combine Harvester 81,000 810 5 4,050Working machines (Workshop)Pick-pu Track Single Cabine (4DW) 20,900 210 2 420Portable Generator 240V Capacity 112,545 1,130 2 2,260Battery Charger 72V Chapacity 500 10 2 20
Generator Perkins Type 1500RPM 150 kVA(380-54\\415V) 357,441 3,570 1 3,570
Lathe Machine Universal High Precision 54,600 550 1 550Power Saw 6,400 60 1 60Welding Machine Arc 2,700 30 2 60Welding Machine Acetylene Gas Welding 1,800 20 2 40Power Drill Portable Heavy Duty Hand Drill 500 10 1 10Rice MillRice Mill 1.0-2.0t/hr 409,500 4,100Grain Threshing Machine Vicon Type 1 tonne/hr 7,300 70Drying Machine 36,400 360Warehouse 41,000 410Total 76 99,260Note: a/ Price quotations are obtained from Lonagro South Sudan Ltd. (Jhon Deere), Ezentus (Catepillar), and Aweil Irrigation Rehabilitation Project. b/ Depreciation schedule is quoted from water supply project in Sounth Asia. c/ 10% of residual value is taken into account in estimation of depreciation cost.
Jebel Lado Irrigation SchemeCost Item Grade/Spec
Unit Cost(SSP/unit) /a
O&M Cost(1% of Unit Cost)

RSS, MEDIWR, Water Sector, Irrigation Development Master Plan (IDMP)
ANN9-2: APP4/JL-5
4.5 Water Tariff Estimation
Detail SSPA. Project Cost (SSP) USD 31,000,000 90,785,714B. Depreciation Cost (SSP/year) 9,848,533
Project Facility 1,433,328 4,197,604Equipment and Machinary 728,000
C. Annual O&M Cost (SSP/year)Personnel Expenses 626,472Pump Operation USD 1,402,189 4,106,411Equipment and Machinary (1% of Procurement Cost) 99,260Maintenance Cost (0.1% of Project Cost) 90,786Sub-total (Annual Operation Cost) 4,922,929
D. Irrigable Area (ha) 1,330Annual O&M Cost per Irrigable Area (SSP/ha) 3,701Minimum Area for Feeding Family (ha/HH/year) /a 0.42Number of Lot for Distribution (1lot = 1feddan = 0.42ha) 3,167
E. Water Consumption (m3/season) Total 29,790,115Crop 1 Maize 12,326,585Crop 2 Vegetables 15,687,302Crop 3 Banana 1,776,228
F. Water Tariff EstimationArea-based Pricing (SSP/lot, or SSP/feddan) SSP 1,560 fdVolumetric Pricing 1 (SSP/m3) Total SSP 0.17 m3Crop 1 Maize SSP 0.40 m3Crop 2 Vegetables SSP 0.31 m3Crop 3 Banana SSP 2.77 m3Volumetric Pricing 2 (SSP/season/feddan)Crop 1 3,000 ac SSP 700 fdCrop 2 3,000 ac SSP 900 fdCrop 3 160 ac SSP 1,800 fdVolumetric Pricing 2 (SSP/season/ha)Crop 1 1,260 ha SSP 1,600 haCrop 2 1,260 ha SSP 2,100 haCrop 3 67 ha SSP 4,400 haMember's Fee (SSP/lot) /b SSP 548 /haMember's Fee (In Kind = Labor Work in days) /c 14 days/year
Note: a/ Necessary area for feeding family members (7person/HH) by planting maize is estimated at 0.21ha. Planned yield of maize is 3t/ha.b/ Members' fee is estimated by dividing number of lot into depreciation cost of equipment and machinary. c/ In kind is equivalent to labor cost of SSP40/ha.
Jebel Lado Irrigation Scheme

Annex 9-2 - Appendix 4: Operation and Maintenance Plan Cost_Jebel Lado
ANN9-2: APP4/JL-6
4.6 Affordability to Pay (ATP)
Term CropsNet Income /a
(SSP/ha)
CroppedArea(ha)
Total Net Income(SSP/ha)
AffordabilityRate (%)
ATP(SSP/ha)
Estimated ISF(SSP/ha)
ISF Adjustd(SSP/ha)
Maize 5,222 1,260 6,579,720 3% 160 1,667 160Vegetable 89,235 1,260 112,436,100 3% 2,680 2,143 2,143Banana 35,117 67 2,352,839 3% 1,050 4,286 1,050Weighted Average 46,915 2,587 121,368,659 3% 1,410 1,560 1,410Maize 5,222 900 4,699,800 5% 260 1,667 260Vegetable 89,235 1,626 145,096,110 5% 4,460 2,143 2,143Banana 35,117 67 2,352,839 5% 1,760 4,286 1,760Weighted Average 58,677 2,593 152,148,749 5% 2,930 1,560 1,560Maize 5,222 500 2,611,000 5% 260 1,667 260Vegetable 89,235 2,026 180,790,110 5% 4,460 2,143 2,143Banana 35,117 67 2,352,839 5% 1,760 4,286 1,760Weighted Average 71,637 2,593 185,753,949 5% 3,580 1,560 1,560
Note: a/ "Net income" is not cosidered in family labor cost.
Short-term
Mid-term
Long-term

RSS, MEDIWR, Water Sector, Irrigation Development Master Plan (IDMP)
ANN9-2: APP4/JL-7
4.7 Cash Flow Analysis
1st Year 2nd Year 3rd Year 4th Year 5th Year 6th Year 7th Year 8th Year 9th Year 10th Year 11th Year 12th Year 13th Year 14th Year 15th Year 16th Year 17th Year 18th Year 19th Year 20th YearRevenue
Member Fee /a 728,410 728,410 728,410 728,410 728,410 728,410 728,410 728,410 728,410 728,410 728,410 728,410 728,410 728,410 728,410 728,410 728,410 728,410 728,410 728,410Irrigation Service Fee /b 3,634,119 3,634,119 3,634,119 3,634,119 3,634,119 7,593,786 7,593,786 7,593,786 7,593,786 7,593,786 9,260,714 9,260,714 9,260,714 9,260,714 9,260,714 9,260,714 9,260,714 9,260,714 9,260,714 9,260,714
ISF Collection Rate 60% 60% 60% 60% 60% 70% 70% 70% 70% 70% 80% 80% 80% 80% 80% 80% 80% 80% 80% 80%Amount of ISF Collected 2,180,471 2,180,471 2,180,471 2,180,471 2,180,471 5,315,650 5,315,650 5,315,650 5,315,650 5,315,650 7,408,571 7,408,571 7,408,571 7,408,571 7,408,571 7,408,571 7,408,571 7,408,571 7,408,571 7,408,571
Tractor Service Fee /c 252,600 261,037 269,755 278,765 288,076 297,698 307,641 317,916 328,535 339,508 350,847 362,565 374,675 387,189 400,121 413,485 427,296 441,568 456,316 471,557Sub-total 3,161,481 3,169,918 3,178,637 3,187,647 3,196,957 6,341,758 6,351,701 6,361,976 6,372,595 6,383,568 8,487,829 8,499,547 8,511,657 8,524,171 8,537,103 8,550,467 8,564,277 8,578,549 8,593,297 8,608,538
ExpemditureAnnual O&M Cost (SSP/year)
Personnel Expenses 785,000 798,110 811,438 824,989 838,766 852,774 867,015 881,494 896,215 911,182 926,399 941,869 957,599 973,591 989,850 1,006,380 1,023,187 1,040,274 1,057,646 1,075,309Pump Operation 4,106,411 4,243,565 4,385,300 4,531,769 4,683,131 4,839,547 5,001,188 5,168,228 5,340,847 5,519,231 5,703,573 5,894,072 6,090,934 6,294,372 6,504,604 6,721,857 6,946,367 7,178,376 7,418,134 7,665,900Equipment and Machinary (1% of Procurement Cost) 99,260 102,575 106,001 109,542 113,200 116,981 120,889 124,926 129,099 133,411 137,867 142,471 147,230 152,147 157,229 162,480 167,907 173,515 179,311 185,300Maintenance Cost (0.1% of Project Cost) 90,786 92,302 93,843 95,410 97,004 98,624 100,271 101,945 103,648 105,379 107,139 108,928 110,747 112,596 114,477 116,388 118,332 120,308 122,317 124,360Sub-total 5,081,457 5,236,552 5,396,583 5,561,711 5,732,101 5,907,926 6,089,362 6,276,593 6,469,808 6,669,202 6,874,977 7,087,341 7,306,510 7,532,706 7,766,159 8,007,106 8,255,793 8,512,474 8,777,409 9,050,869
Depreciation Cost (SSP/year)Project Facility 4,197,604 4,267,704 4,338,975 4,411,436 4,485,107 4,560,008 4,636,160 4,713,584 4,792,301 4,872,333 4,953,700 5,036,427 5,120,536 5,206,049 5,292,990 5,381,382 5,471,252 5,562,621 5,655,517 5,749,964Equipment and Machinary 728,000 740,158 752,518 765,085 777,862 790,853 804,060 817,488 831,140 845,020 859,131 873,479 888,066 902,897 917,975 933,305 948,891 964,738 980,849 997,229Sub-total 4,925,604 5,007,862 5,091,493 5,176,521 5,262,969 5,350,861 5,440,220 5,531,072 5,623,441 5,717,352 5,812,832 5,909,906 6,008,602 6,108,945 6,210,965 6,314,688 6,420,143 6,527,359 6,636,366 6,747,194
Annual O&M + Depreciation (Equipment) 5,809,457 5,976,710 6,149,101 6,326,796 6,509,963 6,698,778 6,893,422 7,094,081 7,300,948 7,514,222 7,734,108 7,960,820 8,194,576 8,435,603 8,684,134 8,940,412 9,204,685 9,477,212 9,758,258 10,048,098Annual O&M + Depreciation (T otal) 10,007,061 10,244,414 10,488,076 10,738,232 10,995,070 11,258,787 11,529,582 11,807,665 12,093,249 12,386,554 12,687,809 12,997,247 13,315,111 13,641,651 13,977,124 14,321,794 14,675,937 15,039,833 15,413,775 15,798,062
Balance /dTarget 1: Annual O&M Cost -1,919,976 -2,066,634 -2,217,946 -2,374,064 -2,535,144 433,832 262,339 85,383 -97,214 -285,634 1,612,852 1,412,206 1,205,147 991,465 770,944 543,360 308,484 66,075 -184,111 -442,330
Subsidy (SSP/year) 1,919,976 2,066,634 2,217,946 2,374,064 2,535,144 - - - 97,214 285,634 - - - - - - - - 184,111 442,330 Subsidy (%) 38% 39% 41% 43% 44% 0% 0% 0% 2% 4% 0% 0% 0% 0% 0% 0% 0% 0% 2% 5%
Target 2: Annual O&M Cost + Deprecoation (Equipment) -2,647,976 -2,806,791 -2,970,464 -3,139,149 -3,313,006 -357,021 -541,721 -732,105 -928,353 -1,130,654 753,720 538,727 317,081 88,568 -147,031 -389,945 -640,408 -898,663 -1,164,960 -1,439,560Subsidy (SSP/year) 2,647,976 2,806,791 2,970,464 3,139,149 3,313,006 357,021 541,721 732,105 928,353 1,130,654 - - - - 147,031 389,945 640,408 898,663 1,164,960 1,439,560 Subsidy (%) 46% 47% 48% 50% 51% 5% 8% 10% 13% 15% 0% 0% 0% 0% 2% 4% 7% 9% 12% 14%
Target 3: Annual O&M Cost + Deprecoation (T otal) -6,845,580 -7,074,496 -7,309,439 -7,550,585 -7,798,113 -4,917,029 -5,177,881 -5,445,689 -5,720,654 -6,002,987 -4,199,980 -4,497,700 -4,803,455 -5,117,480 -5,440,021 -5,771,327 -6,111,659 -6,461,284 -6,820,478 -7,189,524Subsidy (SSP/year) 6,845,580 7,074,496 7,309,439 7,550,585 7,798,113 4,917,029 5,177,881 5,445,689 5,720,654 6,002,987 4,199,980 4,497,700 4,803,455 5,117,480 5,440,021 5,771,327 6,111,659 6,461,284 6,820,478 7,189,524 Subsidy (%) 68% 69% 70% 70% 71% 44% 45% 46% 47% 48% 33% 35% 36% 38% 39% 40% 42% 43% 44% 46%
Note: a/ Member fee (fixed charge per year) is estimated by dividing procurment cost of equipment by number of lot (=1feddan). In Wau, milling facility is excluded from the procurment cost.b/ Irrigation service fee (ISF) is estimated by dividing total water consumption volume by each crops' water consumption volume in a season.c/ Unit price of tractor service fee is SSP200/feddan, quoted from Socio-economic Survey conducted by IDMP-TT in 2015.d/ Balance is estimated to cover annual O&M cost by revenue of the scheme.
Short-term Mid-term Long-term
01,000,0002,000,0003,000,0004,000,0005,000,0006,000,0007,000,0008,000,0009,000,000
10,000,000
1st
2nd
3rd
4th
5th
6th
7th
8th
9th
10th
11th
12th
13th
14th
15th
16th
17th
18th
19th
20th
Balance of Revenue and Expenditure【Jebel Lado】(Target 1: Cost recovery of annual O&M cost)
Rev
enue
and
Exp
endi
ture
(SS
P/y
ear)
Year
Annual Revenue
Annual Expenditure (O&M Cost)
Short-term Mid-term Long-term
01,000,0002,000,0003,000,0004,000,0005,000,0006,000,0007,000,0008,000,0009,000,000
10,000,00011,000,000
1st
2nd
3rd
4th
5th
6th
7th
8th
9th
10th
11th
12th
13th
14th
15th
16th
17th
18th
19th
20th
Balance of Revenue and Expenditure【Jebel Lado】(Target 2: Cost recovery of O&M + Equipment)
Rev
enue
and
Exp
endi
ture
(SS
P/y
ear)
Year
01,000,0002,000,0003,000,0004,000,0005,000,0006,000,0007,000,0008,000,0009,000,000
10,000,00011,000,00012,000,00013,000,00014,000,00015,000,00016,000,00017,000,000
1st
2nd
3rd
4th
5th
6th
7th
8th
9th
10th
11th
12th
13th
14th
15th
16th
17th
18th
19th
20th
Balance of Revenue and Expenditure【Jebel Lado】(Target 3: Cost recovery of O&M + total depreciation)
Rev
enue
and
Exp
endi
ture
(SS
P/y
ear)
Year
Short-term Mid-term Long-term Short-term Mid-term Long-term
Annual Revenue
Annual Revenue
Annual Expenditure (O&M Cost + Depreciation (Equipment))
Annual Expenditure (O&M Cost + Total Depereciation)Surplus
Deficit DeficitDeficit
Surplus

APPENDIX - 5
ENVIRONMENTAL AND SOCIAL
CONSIDERATIONS

RSS, MEDIWR, Water Sector, Irrigation Development Master Plan (IDMP)
ANN9-2: APP5/JL-1
Evaluation Sheet for Alternatives Project Title: Irrigation Development in Jebel Lado
Evaluation Method
Evaluation method Evaluation criteria: 5: Exceptionally suitable, 4: Suitable, 3: Negligible/ Neutral 2: Not suggestible, 1: Suggest avoiding Evaluation items
“Pollution” includes: “Air Pollution ”, “Water Pollution ”, “Waste”, “Soil/Sediment Contamination”, “Noise and Vibration”, “Odour”, “Global Warming”
“Biodiversity” includes: “Protected Areas” “Ecosystem” “Nature, disasters” includes: “Hydrology”, “Topography and Geology ”, “Subsidence / Erosion”,
, “Landscape” “Land occupies resettlement” includes: “Resettlement”. “Land Use” “Social conflict” includes: “Vulnerable Groups”, “Water Use / Rights” “Living condition” includes: “Living and Livelihood ”, “Local Economy ”, “Historical / Cultural
Heritage” “Social Infrastructure / Services ”, “Infectious Diseases”
“Economy, development ” means: contribution to economic improvement in the RSS “Consistency” means: consistency / harmonization with the RSS policies
Project Summary
Alternative A Alternative B Zero option
Project Summary Pump irrigation
Dam irrigation without pump station No project

Annex 9-2 - Appendix 5: Environmental and Social Considerations_Jebel Lado
ANN9-2: APP5/JL-2
Evaluation Valuation Items Alternative A Alternative B Zero option
Natural Environment
Average of a), b), c) ------- (1) 2.7 2.3 3.0 a) Pollution 3 3 3 b) Ecosystem 2 1 3 c) Nature, disasters 3 3 3 Reason
Due to existence of dam and long distance canal, significant obstruction to wildlife habitats, feeding / watering activities may rise.
Social Environment
Average of a), b), c) ------- (2) 2.7 2.0 3.0 a) Land occupies, resettlement 3 1 3 b) Social conflict 2 2 3 c) Living condition 3 3 3 Reason Large scale land occupation may accelerate
possibility of resettlement.
Economy, development
Average of a), b), c) ------- (3) 4.0 4.0 2.5 a) Economy, development 4 4 2 b) Consistency 4 4 3 Reason
Results
Alternative A Alternative B Zero option
Total score (1) + (2) + (3) 9.4 8.3 8.5 Ranking 1 3 2 Overall
Both alternatives are expected to contribute to improvement of agricultural production. However alternative B is not suggestible due to significant impacts likely caused by large scale of land occupation by dam site.

RSS, MEDIWR, Water Sector, Irrigation Development Master Plan (IDMP)
ANN9-2: APP5/JL-3
Preliminary Scoping Check Sheet Project Title: Irrigation Development in Jebel Lado
Project Activity: Pre-construction Land preparation
Environmental Items
Duration a)
Extent b)
Intensity c)
Cumulative d)
Reversible e)
Total Score (T) a)+b)+c)+d)+e)
/ Rank
Short: 1 Medium: 2 Long: 3
Limited: 1 Medium: 2 Wide: 3
Small/Negligible: 1 Medium: 2 Big: 3
Non-Cumulative: 1 Cumulative: 3
Reversible: 1 Irreversible: 3
Indication: no: no impact, +: positive -: negative Rough indication for ranking: The score is rough value. Your judgement based on your
experiences / knowledge will be reflected to the ranking.
-15 -12 -11 -7 -6 +6 +7 +11 +12 +15 -A -B or -C D or ±C +B or +C +A
Pollu
tion
Air Pollution -1 -1 -1 -1 -1 -5/D
Water Pollution no no no no no D
Waste -1 -2 -1 -1 -1 -6/-C
Soil/Sediment Contamination
no no no no no D
Noise and Vibration -1 -1 -1 -1 -1 -5/-C
Odour no no no no no D
Nat
ural
Env
ironm
ent
Protected Areas no no no no no D
Ecosystem -1 -1 -1 -1 -1 -5/-C
Hydrology -1 -1 -1 -1 -1 -5/-C
Topography and Geology
no no no no no D
Subsidence / Erosion no no no no no D
Global Warming no no no no no D
Landscape no no no no no D
Soci
al E
nviro
nmen
t
Resettlement -3 -1 -1 -1 -3 -9/-C
Living and Livelihood
-2 -1 -1 -1 -1 -6/-C
Local Economy no no no no no D
Historical / Cultural Heritage
no no no no no D
Land Use -1 -1 -1 -1 -3 -7/-C
Vulnerable Groups no no no no no D
Local Conflict -1 -1 -1 -1 -1 -5/-C
Water Use / Right no no no no no D
Social Infrastructure / Services
-1 -1 -1 -1 -1 -5/-C
Infectious Diseases no no no no no D Remark

Annex 9-2 - Appendix 5: Environmental and Social Considerations_Jebel Lado
ANN9-2: APP5/JL-4
Preliminary Scoping Check Sheet Project Title: Irrigation Development in Jebel Lado
Project Activity: Construction Construction of pump station
Environmental Items
Duration a)
Extent b)
Intensity c)
Cumulative d)
Reversible e)
Total Score (T) a)+b)+c)+d)+e)
/ Rank
Short: 1 Medium: 2 Long: 3
Limited: 1 Medium: 2 Wide: 3
Small/Negligible: 1 Medium: 2 Big: 3
Non-Cumulative: 1 Cumulative: 3
Reversible: 1 Irreversible: 3
Indication: no: no impact, +: positive -: negative Rough indication for ranking: The score is rough value. Your judgement based on your
experiences / knowledge will be reflected to the ranking.
-15 -12 -11 -7 -6 +6 +7 +11 +12 +15 -A -B or -C D or ±C +B or +C +A
Pollu
tion
Air Pollution -1 -1 -1 -1 -1 -5/-C
Water Pollution -1 -1 -1 -1 -1 -5/-C
Waste -1 -1 -1 -1 -1 -5/-C
Soil/Sediment Contamination
no no no no no D
Noise and Vibration -1 -1 -1 -1 -1 -5/-C
Odour no no no no no D
Nat
ural
Env
ironm
ent
Protected Areas no no no no no D
Ecosystem -1 -1 -1 -1 -1 -5/-C
Hydrology -1 -1 -1 -1 -1 -5/-C
Topography and Geology
no no no no no D
Subsidence / Erosion no no no no no D
Global Warming no no no no no D
Landscape no no no no no D
Soci
al E
nviro
nmen
t
Resettlement no no no no no D
Living and Livelihood
no no no no no D
Local Economy +1 +1 +1 +1 +1 +5/+C
Historical / Cultural Heritage
no no no no no D
Land Use no no no no no D
Vulnerable Groups no no no no no D
Local Conflict no no no no no D
Water Use / Right -1 -1 -1 -1 -1 -5/-C
Social Infrastructure / Services
-1 -1 -1 -1 -1 -5/-C
Infectious Diseases no no no no no D
Remark

RSS, MEDIWR, Water Sector, Irrigation Development Master Plan (IDMP)
ANN9-2: APP5/JL-5
Preliminary Scoping Check Sheet Project Title: Irrigation Development in Jebel Lado
Project Activity: Construction Installation of canal and pipe line
Environmental Items
Duration a)
Extent b)
Intensity c)
Cumulative d)
Reversible e)
Total Score (T) a)+b)+c)+d)+e)
/ Rank
Short: 1 Medium: 2 Long: 3
Limited: 1 Medium: 2 Wide: 3
Small/Negligible: 1 Medium: 2 Big: 3
Non-Cumulative: 1 Cumulative: 3
Reversible: 1 Irreversible: 3
Indication: no: no impact, +: positive -: negative Rough indication for ranking: The score is rough value. Your judgement based on your
experiences / knowledge will be reflected to the ranking.
-15 -12 -11 -7 -6 +6 +7 +11 +12 +15 -A -B or -C D or ±C +B or +C +A
Pollu
tion
Air Pollution -1 -1 -1 -1 -1 -5/-C
Water Pollution -1 -1 -1 -1 -1 -5/-C
Waste -1 -1 -1 -1 -1 -5/-C
Soil/Sediment Contamination
no no no no no D
Noise and Vibration -1 -1 -1 -1 -1 -5/-C
Odour no no no no no D
Nat
ural
Env
ironm
ent
Protected Areas no no no no no D
Ecosystem -1 -1 -2 -1 -1 -6/-C
Hydrology -1 -1 -1 -1 -1 -5/-C
Topography and Geology
no no no no no D
Subsidence / Erosion no no no no no D
Global Warming no no no no no D
Landscape no no no no no D
Soci
al E
nviro
nmen
t
Resettlement -1 -1 -1 -1 -1 -5/-C
Living and Livelihood
-1 -1 -1 -1 -1 -5/-C
Local Economy +1 +1 +2 +1 +1 +6/+C
Historical / Cultural Heritage
no no no no no D
Land Use no no no no no D
Vulnerable Groups no no no no no D
Local Conflict -2 -1 -2 -1 -1 -7/-C
Water Use / Right no no no no no D
Social Infrastructure / Services
-1 -1 -1 -1 -1 -5/-C
Infectious Diseases no no no no no D
Remark

Annex 9-2 - Appendix 5: Environmental and Social Considerations_Jebel Lado
ANN9-2: APP5/JL-6
Preliminary Scoping Check Sheet Project Title: Irrigation Development in Jebel Lado
Project Activity: Construction Land clearance and leveling in command area
Environmental Items
Duration a)
Extent b)
Intensity c)
Cumulative d)
Reversible e)
Total Score (T) a)+b)+c)+d)+e)
/ Rank
Short: 1 Medium: 2 Long: 3
Limited: 1 Medium: 2 Wide: 3
Small/Negligible: 1 Medium: 2 Big: 3
Non-Cumulative: 1 Cumulative: 3
Reversible: 1 Irreversible: 3
Indication: no: no impact, +: positive -: negative Rough indication for ranking: The score is rough value. Your judgement based on your
experiences / knowledge will be reflected to the ranking.
-15 -12 -11 -7 -6 +6 +7 +11 +12 +15 -A -B or -C D or ±C +B or +C +A
Pollu
tion
Air Pollution -1 -1 -1 -1 -1 -5/D
Water Pollution -1 -1 -2 -1 -1 -6/-C
Waste -1 -1 -2 -1 -1 -6/-C
Soil/Sediment Contamination
-1 -1 -1 -1 -1 -5/-C
Noise and Vibration -1 -1 -1 -1 -1 -5/D
Odour no no no no no D
Nat
ural
Env
ironm
ent
Protected Areas no no no no no D
Ecosystem -3 -1 -2 -1 -3 -10/-B
Hydrology -1 -1 -1 -1 -1 -5/-C
Topography and Geology
no no no no no D
Subsidence / Erosion -2 -1 -1 -1 -1 -6/-C
Global Warming no no no no no D
Landscape no no no no no D
Soci
al E
nviro
nmen
t
Resettlement -2 -1 -1 -1 -1 -6/-C
Living and Livelihood
+1 +1 +1 +1 +1 +5/+C
Local Economy +2 +1 +1 +1 +1 +6/+B
Historical / Cultural Heritage
no no no no no D
Land Use -1 -1 -1 -1 -3 -7/-C
Vulnerable Groups no no no no no D
Local Conflict -2 -1 -2 -1 -1 -7/-B
Water Use / Right -1 -1 -2 -1 -1 -6/-C
Social Infrastructure / Services
-1 -1 -1 -1 -1 -5/-C
Infectious Diseases no no no no no D
Remark The proposed command area seems to be low production in bare land, however possible resettlement or relocation of facilities may occur. In addition, wildlife may also affected.

RSS, MEDIWR, Water Sector, Irrigation Development Master Plan (IDMP)
ANN9-2: APP5/JL-7
Preliminary Scoping Check Sheet Project Title: Irrigation Development in Jebel Lado
Project Activity: Operation and Maintenance Operation of pump
Environmental Items
Duration a)
Extent b)
Intensity c)
Cumulative d)
Reversible e)
Total Score (T)
a)+b)+c)+d)+e) /
Rank
Short: 1 Medium: 2 Long: 3
Limited: 1 Medium: 2 Wide: 3
Small/Negligible: 1 Medium: 2 Big: 3
Non-Cumulative: 1 Cumulative: 3
Reversible: 1 Irreversible: 3
Indication: no: no impact, +: positive -: negative Rough indication for ranking: The score is rough value. Your judgement based on your
experiences / knowledge will be reflected to the ranking. -15 -12 -11 -7 -6 +6 +7 +11 +12 +15
-A -B or -C D or ±C +B or +C +A
Pollu
tion
Air Pollution -1 -1 -2 -1 -1 -6/-C
Water Pollution -1 -1 -2 -1 -1 -5/-C
Waste no no no no no D
Soil/Sediment Contamination
no no no no no D
Noise and Vibration -1 -1 -2 -1 -1 -6/-C
Odour no no no no no D
Nat
ural
Env
ironm
ent
Protected Areas no no no no no D
Ecosystem no no no no no D
Hydrology no no no no no D
Topography and Geology
no no no no no D
Subsidence / Erosion no no no no no D
Global Warming -1 -1 -1 -1 -1 -5/-C
Landscape no no no no no D
Soci
al E
nviro
nmen
t
Resettlement no no no no no D
Living and Livelihood
no no no no no D
Local Economy no no no no no D
Historical / Cultural Heritage
no no no no no D
Land Use no no no no no D
Vulnerable Groups no no no no no D
Local Conflict no no no no no D
Water Use / Right -1 -1 -1 -1 -1 -5/-C
Social Infrastructure / Services
no no no no no D
Infectious Diseases no no no no no D
Remark

Annex 9-2 - Appendix 5: Environmental and Social Considerations_Jebel Lado
ANN9-2: APP5/JL-8
Preliminary Scoping Check Sheet Project Title: Irrigation Development in Jebel Lado
Project Activity: Operation and Maintenance Farming
Environmental Items
Duration a)
Extent b)
Intensity c)
Cumulative d)
Reversible e)
Total Score (T) a)+b)+c)+d)+e)
/ Rank
Short: 1 Medium: 2 Long: 3
Limited: 1 Medium: 2 Wide: 3
Small/Negligible: 1 Medium: 2 Big: 3
Non-Cumulative: 1 Cumulative: 3
Reversible: 1 Irreversible: 3
Indication: no: no impact, +: positive -: negative Rough indication for ranking: The score is rough value. Your judgement based on your
experiences / knowledge will be reflected to the ranking.
-15 -12 -11 -7 -6 +6 +7 +11 +12 +15 -A -B or -C D or ±C +B or +C +A
Pollu
tion
Air Pollution no no no no no D
Water Pollution -2 -2 -2 -1 -1 -8/-B
Waste -1 -1 -1 -1 -1 -5/-C
Soil/Sediment Contamination
-1 -1 -1 -1 -1 -5/-C
Noise and Vibration no no no no no D
Odour no no no no no D
Nat
ural
Env
ironm
ent
Protected Areas no no no no no D
Ecosystem +2 +1 +1 +1 +3 +8/+C
Hydrology no no no no no D
Topography and Geology
no no no no no D
Subsidence / Erosion no no no no no D
Global Warming no no no no no D
Landscape no no no no no D
Soci
al E
nviro
nmen
t
Resettlement no no no no no D
Living and Livelihood
+3 +1 +2 +1 +3 +10/+B
Local Economy +3 +2 +3 +3 +3 +14/+A
Historical / Cultural Heritage
no no no no no D
Land Use -3 -2 -1 -1 -1 -8/-B
Vulnerable Groups -1 -1 -1 -1 -1 -5/-C
Local Conflict -2 -1 -2 -3 -1 -9/-B
Water Use / Right -1 -1 -1 -1 -1 -5/-C
Social Infrastructure / Services
no no no no no D
Infectious Diseases -1 -1 -1 -1 -1 -5/-C
Remark Agricultural production can contribute to economic improvement. Water / soil pollution may occur if pesticide / fertilize is not properly used.

RSS, MEDIWR, Water Sector, Irrigation Development Master Plan (IDMP)
ANN9-2: APP5/JL-9
Scoping Matrix Project Title: Irrigation Development in Jebel Lado
Environmental Parameters Pre-constructio
n
Construction Operation & Maintenance
Land
pre
para
tion
Cons
truct
ion
of p
ump
statio
n
Insta
llatio
n of
can
als a
nd p
ipe
Land
cle
aran
ce a
nd le
velli
ng,
in c
omm
and
area
Ope
ratio
n of
pum
p
Farm
ing
Overa
ll
Remark positive: +, negative: - A: Significant impact is expected, B: Moderate impact is expected, C: Level of impact unknown, D: No / negligible impact is expected
Pollu
tion
Air Pollution D -C -C D -C D -C Water Pollution D -C -C -C -C -B -C Waste -C -C -C -C D -C -C Soil/Sediment Contamination D D D -C D -C -C Noise and Vibration -C -C -C D -C D -C Odour D D D D D D D
Nat
ural
Env
ironm
ent Protected Areas D D D D D D D
Ecosystem -C -C -C -B D +C -B Hydrology -C -C -C -C D D -C Topography and Geology D D D D D D D Subsidence / Erosion D D D -C D D -C

Annex 9-2 - Appendix 5: Environmental and Social Considerations_Jebel Lado
ANN9-2: APP5/JL-10
Environmental Parameters Pre-constructio
n
Construction Operation & Maintenance
Land
pre
para
tion
Con
struc
tion
of p
ump
stat
ion
Inst
alla
tion
of c
anal
s and
pip
e
Land
cle
aran
ce a
nd le
velli
ng,
in c
omm
and
area
Ope
ratio
n of
pum
p
Farm
ing
Overa
ll
Remark positive: +, negative: - A: Significant impact is expected, B: Moderate impact is expected, C: Level of impact unknown, D: No / negligible impact is expected Global Warming D D D D -C D D
Landscape D D D D D D D

RSS, MEDIWR, Water Sector, Irrigation Development Master Plan (IDMP)
ANN9-2: APP5/JL-11
Scoping Matrix Environmental Parameters Pre-constructi
on
Construction Operation & Maintenance
Land
pre
para
tion
Con
struc
tion
of p
ump
stat
ion
Inst
alla
tion
of c
anal
s and
pip
e
Land
cle
aran
ce a
nd le
velli
ng, i
n co
mm
and
area
Ope
ratio
n of
pum
p
Farm
ing
Over
all
Remark positive: +, negative: - A: Significant impact is expected, B: Moderate impact is expected, C: Level of impact unknown, D: No / negligible impact is expected
Soci
al E
nviro
nmen
t
Resettlement -C D -C -C D D -C Living and Livelihood -C D -C +C D +B +B
Local Economy D +C +C +B D +A +A Historical / Cultural Heritage D D D D D D D Land Use -C D D -C D -B -B Vulnerable Groups D D D D D -C D Local Conflict -C D -C -B D -B -B
Water Use / Right D -C D -C -C -C -C
Social Infrastructure / Services -C -C -C -C D D -C
Infectious Diseases D D D D D -C D
Annex 9-2 - Appendix 5: Environmental and Social Considerations_Jebel Lado
ANN9-2: APP5/JL-12
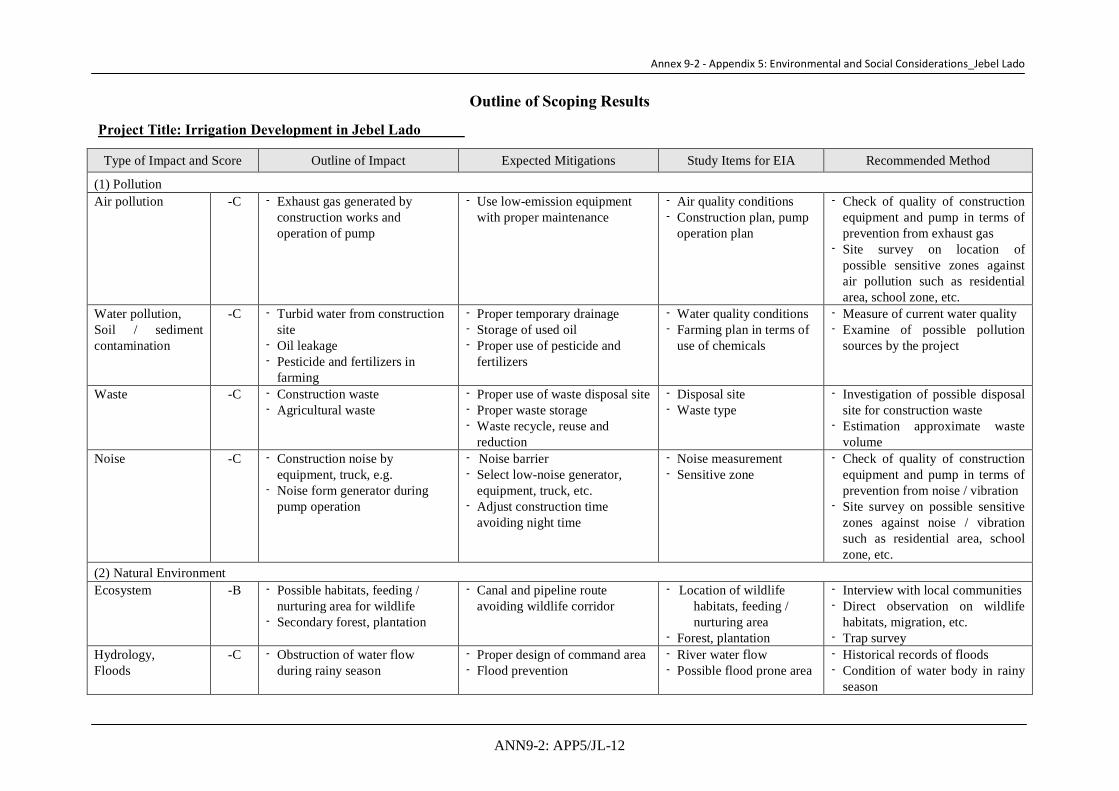
Outline of Scoping Results
Project Title: Irrigation Development in Jebel Lado
Type of Impact and Score Outline of Impact Expected Mitigations Study Items for EIA Recommended Method
(1) Pollution Air pollution -C - Exhaust gas generated by
construction works and operation of pump
- Use low-emission equipment with proper maintenance
- Air quality conditions - Construction plan, pump
operation plan
- Check of quality of construction equipment and pump in terms of prevention from exhaust gas
- Site survey on location of possible sensitive zones against air pollution such as residential area, school zone, etc.
Water pollution, Soil / sediment contamination
-C - Turbid water from construction site
- Oil leakage - Pesticide and fertilizers in
farming
- Proper temporary drainage - Storage of used oil - Proper use of pesticide and
fertilizers
- Water quality conditions - Farming plan in terms of
use of chemicals
- Measure of current water quality - Examine of possible pollution
sources by the project
Waste -C - Construction waste - Agricultural waste
- Proper use of waste disposal site - Proper waste storage - Waste recycle, reuse and
reduction
- Disposal site - Waste type
- Investigation of possible disposal site for construction waste
- Estimation approximate waste volume
Noise -C - Construction noise by equipment, truck, e.g.
- Noise form generator during pump operation
- Noise barrier - Select low-noise generator,
equipment, truck, etc. - Adjust construction time
avoiding night time
- Noise measurement - Sensitive zone
- Check of quality of construction equipment and pump in terms of prevention from noise / vibration
- Site survey on possible sensitive zones against noise / vibration such as residential area, school zone, etc.
(2) Natural Environment Ecosystem -B - Possible habitats, feeding /
nurturing area for wildlife - Secondary forest, plantation
- Canal and pipeline route avoiding wildlife corridor
- Location of wildlife habitats, feeding / nurturing area
- Forest, plantation
- Interview with local communities - Direct observation on wildlife
habitats, migration, etc. - Trap survey
Hydrology, Floods
-C - Obstruction of water flow during rainy season
- Proper design of command area - Flood prevention
- River water flow - Possible flood prone area
- Historical records of floods - Condition of water body in rainy
season

RSS, MEDIWR, Water Sector, Irrigation Development Master Plan (IDMP)
ANN9-2: APP5/JL-13
Type of Impact and Score Outline of Impact Expected Mitigations Study Items for EIA Recommended Method
(3) Social Environment Resettlement -C - Land occupation
- Proposed command area is mostly bare land with low production.
- Agreement on resettlement with proper compensation plan
- Land use - Public consultation - Resettlement plan
- Survey on land use, land status, land ownership, etc.
- Estimation of land and asset price - Public consultation for consensus
building Living and livelihood
+B - Land occupation - Job / business opportunity be
construction works, farming
- Public announcement, consensus building
- Priority recruitment to local community
- Community and local job profile
- Public consultation
- Investigation of community living condition and livelihood
- Interview with communities
Local economy +A - Job / business opportunity be construction works, farming
- Priority procurement from local - Proper farming plan to increase
agricultural production
- Business profile in local - Expected agricultural
production by the project
- Investigation of local economic profile
- Investigation of future plans, developments, investments
Land use -B - Land occupancy - Obstruction of existing business - Proposed command area is
mostly bare land with low production.
- Consensus building - Encourage alternative
improvement
- Existing and future land use plan
- Public consultation
- Survey on land use, land status, land ownership
- Investigation of land use plan - Public consultation
Local Conflict -B - Gap of benefits among communities
- Consensus building - Income recovery plan - Proper compensation
- Public consultation - Compensation plan
- Investigation of job profile, income level and sources
- Public consultation Water use / right -C - Increasing of water irrigated - Consensus building
- Proper rules on fair water use - Public consultation - Legal status on water use
/ right
- Investigation of water use / right - Public consultation
Social Infrastructure / Services
-C - Scattered grave yards in the project site
- Proper design avoiding those facilities, relocation if possible and necessary
- Land use - Mapping
- Site survey on location of social infrastructures
- Interview with local communities, etc.

THE REPUBLIC OF SOUTH SUDAN
MINISTRY OF ELECTRICITY, DAMS, IRRIGATION & WATER RESOURCES
WATER SECTOR
IRRIGATION DEVELOPMENT MASTER PLAN
(FI NA L RE PORT )
ANNEX 9: IMPLEMENTATION PLANS FOR PRIORITY PROJECTS
9-3: Pre-Feasibility Study of Rejaf East Irrigation Scheme
NOVEMBER 2015
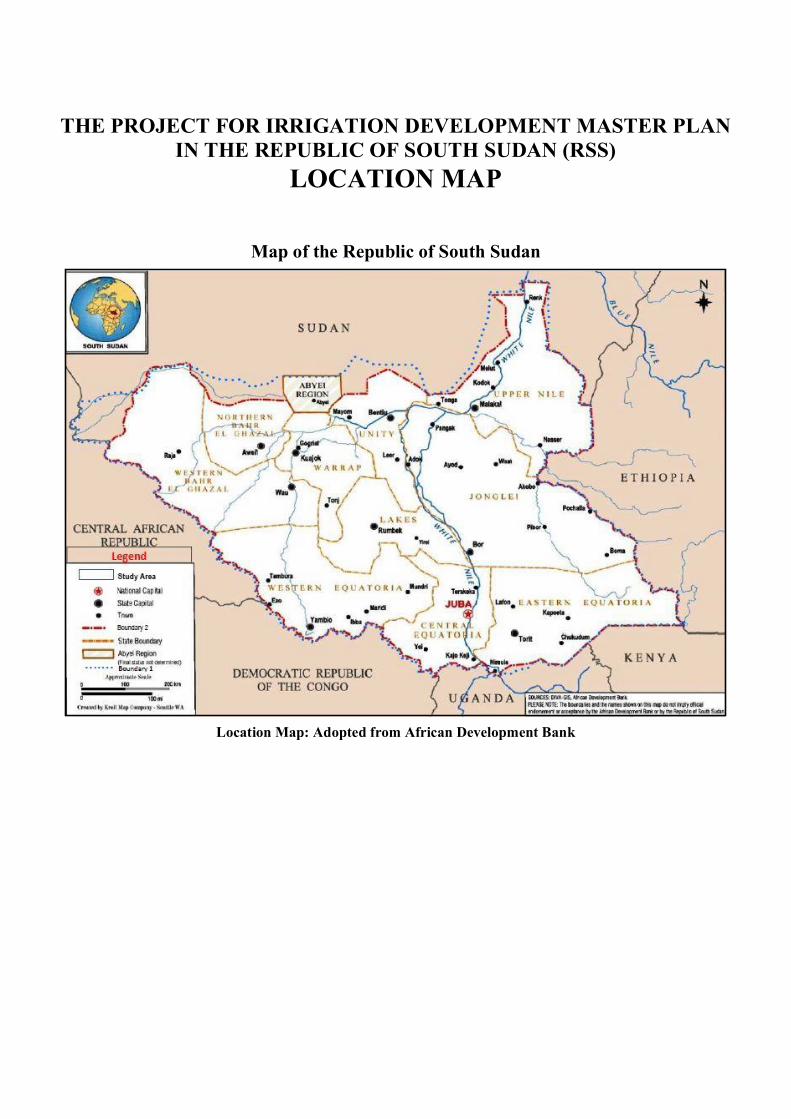
Map of the Republic of South Sudan
Location Map: Adopted from African Development Bank
THE PROJECT FOR IRRIGATION DEVELOPMENT MASTER PLAN IN THE REPUBLIC OF SOUTH SUDAN (RSS)
LOCATION MAP

RSS, MEDIWR, Water Sector, Irrigation Development Master Plan (IDMP)
TABLE OF CONTENTS PART 1 PRESENT SITUATION OF THE PROJECT AREA
CHAPTER 1 SITE PROFILE ......................................................................................ANN9-3: RE-1 1.1 Location ............................................................................................................ ANN9-3: RE-1 1.2 Beneficiary Area and Communities .................................................................. ANN9-3: RE-1 1.3 Basic Community Profile ................................................................................. ANN9-3: RE-1
CHAPTER 2 NATURAL CONDITIONS ....................................................................ANN9-3: RE-2 2.1 Topographic Survey .......................................................................................... ANN9-3: RE-2 2.2 Geological Survey ............................................................................................ ANN9-3: RE-3 2.3 Hydrology ......................................................................................................... ANN9-3: RE-4 2.4 Soil Investigation .............................................................................................. ANN9-3: RE-4
CHAPTER 3 AGRICULTURE AND SOCIO-ECONOMIC .....................................ANN9-3: RE-7 3.1 Methods of Agriculture and Socio-economic Survey ....................................... ANN9-3: RE-7 3.2 Socio-Economic Indicators ............................................................................... ANN9-3: RE-8 3.3 Farm Land and Cropping Pattern ................................................................... ANN9-3: RE-13 3.4 Farming Practices ........................................................................................... ANN9-3: RE-15 3.5 Productivity .................................................................................................... ANN9-3: RE-17 3.6 Selling of Produces ......................................................................................... ANN9-3: RE-20
CHAPTER 4 DEVELOPMENT CONSTRAINTS AND POTENTIALS ...............ANN9-3: RE-22 PART 2 IRRIGATION SCHEME DEVELOPMENT PLAN
CHAPTER 5 INSTITUTIONAL SET-UP OF THE IRRIGATION SCHEME ......ANN9-3: RE-24 5.1 Demarcation of Stakeholders’ Roles ............................................................... ANN9-3: RE-24 5.2 Category of Irrigation Scheme........................................................................ ANN9-3: RE-27 5.3 Division of Roles within the Irrigation Schemes ............................................ ANN9-3: RE-27 5.4 Private Sector Involvement............................................................................. ANN9-3: RE-27
CHAPTER 6 AGRICULTURAL PLANING .............................................................ANN9-3: RE-29 6.1 Basic Concept of Agricultural Planning for Priority Projects ......................... ANN9-3: RE-29 6.2 Agricultural Planning (Cropping Pattern) ...................................................... ANN9-3: RE-29
CHAPTER 7 IRRIGATION AND DRAINAGE PLAN ...........................................ANN9-3: RE-31 7.1 Parameters Affecting Crop Water Requirement .............................................. ANN9-3: RE-31
7.1.1 Climate and Weather Parameters ....................................................... ANN9-3: RE-31 7.1.2 Cropping Pattern Plan in the Farmlands ............................................ ANN9-3: RE-34 7.1.3 Crop Coefficient Factor ..................................................................... ANN9-3: RE-35
7.2 Estimation of Crop Water Requirement .......................................................... ANN9-3: RE-35 7.2.1 Reference Evapo-transpiration (ETo) ................................................ ANN9-3: RE-35 7.2.2 Crop Coefficient (Kc) ........................................................................ ANN9-3: RE-36 7.2.3 Crop Evapo-transpiration under standard conditions (ETc) .............. ANN9-3: RE-38
7.3 Estimation of Irrigation Water Requirements ................................................. ANN9-3: RE-38 7.3.1 Calculation of Consumptive Irrigation Requirements (CIR) ............. ANN9-3: RE-38 7.3.2 Calculation of Net Irrigation Requirements (NIR) ............................ ANN9-3: RE-39 7.3.3 Calculation of Field Irrigation Requirements (FIR) .......................... ANN9-3: RE-39

Annex 9-3: Pre-Feasibility Study of Rejaf East Irrigation Scheme
7.3.4 Calculation of Gross Irrigation Requirements (GIR) ......................... ANN9-3: RE-39 7.3.5 Calculation of Irrigation Water Requirements ................................... ANN9-3: RE-40 7.3.6 Calculation of Scheme/Farm Water Requirements ............................ ANN9-3: RE-41
CHAPTER 8 FACILITY PLAN AND DESIGN........................................................ANN9-3: RE-44 8.1 General............................................................................................................ ANN9-3: RE-44
8.1.1 Outline of Main Facilities .................................................................. ANN9-3: RE-44 8.1.2 Command Area .................................................................................. ANN9-3: RE-44
8.2 Pump Station ................................................................................................... ANN9-3: RE-46 8.2.1 Location and River Water Level ........................................................ ANN9-3: RE-46 8.2.2 Pump Facilities .................................................................................. ANN9-3: RE-46 8.2.3 Pump Building ................................................................................... ANN9-3: RE-47 8.2.4 Riverbank Protection ......................................................................... ANN9-3: RE-49 8.2.5 Storage for Pump Station No.1-H ...................................................... ANN9-3: RE-49 8.2.6 Pipeline .............................................................................................. ANN9-3: RE-50
8.3 Main Canal ..................................................................................................... ANN9-3: RE-51 8.3.1 Location ............................................................................................. ANN9-3: RE-51 8.3.2 Examination Method of Canal Capacity ............................................ ANN9-3: RE-51
8.4 Irrigation and Drainage System in Farmlands ................................................ ANN9-3: RE-52 8.4.1 Outline of Command Area ................................................................. ANN9-3: RE-52 8.4.2 Design Discharge of Canal and Drainage .......................................... ANN9-3: RE-53 8.4.3 Examination Method of Canal Capacity ............................................ ANN9-3: RE-54 8.4.4 Relative Structures ............................................................................. ANN9-3: RE-55 8.4.5 Recommendation ............................................................................... ANN9-3: RE-55
CHAPTER 9 OPERATION AND MAINTENANCE PLAN ...................................ANN9-3: RE-56 9.1 Establishment of Scheme Management Office ............................................... ANN9-3: RE-56 9.2 Operation Plan ................................................................................................ ANN9-3: RE-57 9.3 Maintenance Plan ........................................................................................... ANN9-3: RE-59 9.4 Financial Management of Irrigation Scheme.................................................. ANN9-3: RE-61
CHAPTER 10 COST ESTIMATE ..............................................................................ANN9-3: RE-68 10.1 Conditions for Cost Estimate .......................................................................... ANN9-3: RE-68 10.2 Project Cost..................................................................................................... ANN9-3: RE-68
CHAPTER 11 IMPLEMENTATION PLAN .............................................................ANN9-3: RE-69 11.1 Conditions of Construction ............................................................................. ANN9-3: RE-69 11.2 Implementation Schedule ............................................................................... ANN9-3: RE-69
CHAPTER 12 ENVIRONMENTAL AND SOCIAL CONSIDERATIONS ............ANN9-3: RE-70 12.1 Purposes .......................................................................................................... ANN9-3: RE-70 12.2 Methods .......................................................................................................... ANN9-3: RE-70 12.3 Evaluation of Alternatives .............................................................................. ANN9-3: RE-70 12.4 Current Environmental and Social Aspects .................................................... ANN9-3: RE-72 12.5 Evaluation of the Impact ................................................................................. ANN9-3: RE-74 12.6 Conclusions and Recommendations ............................................................... ANN9-3: RE-76
CHAPTER 13 PROJECT EVALUATION ................................................................ANN9-3: RE-79 13.1 Outline of the Project Area ............................................................................. ANN9-3: RE-79 13.2 Farming Plan................................................................................................... ANN9-3: RE-79

RSS, MEDIWR, Water Sector, Irrigation Development Master Plan (IDMP)
13.3 Basic Assumptions for Economic Analysis .................................................... ANN9-3: RE-79 13.4 Project Cost..................................................................................................... ANN9-3: RE-81 13.5 Project Benefits ............................................................................................... ANN9-3: RE-82 13.6 Project Evaluation ........................................................................................... ANN9-3: RE-83
CHAPTER 14 CONCLUSION AND RECOMMENDATIONS ............................. ANN9-3: RE-84
APPENDIX-1 FACILITY PLAN AND DESIGN APPENDIX-2 DRAWINGS APPENDIX-3 PROJECT INVESTMENT COST
3.1 Project Investment Cost .............................................................................. ANN9-3: APP3/RE-1 3.2 Pumping Station & Pipeline Works ............................................................ ANN9-3: APP3/RE-2 3.2 (1) Pump No.1 Station and Pipeline Works ................................................ ANN9-3: APP3/RE-3 3.2 (2) Pump No.1-H Station and Pipeline Works ............................................ ANN9-3: APP3/RE-7 3.2 (3) Pump No.2 Station and Pipeline Works .............................................. ANN9-3: APP3/RE-13 3.2 (4) Pump No.3 Station and Pipeline Works .............................................. ANN9-3: APP3/RE-18 3.3 Main Irrigation Canal Works .................................................................... ANN9-3: APP3/RE-23
APPENDIX-4 OPERATION AND MAINTENANCE PLAN COST 4.1 Unit Cost of Personnel Expenses (SSP/month) .......................................... ANN9-3: APP4/RE-1 4.2 Annual Personnel Expenses (SSP/year) ...................................................... ANN9-3: APP4/RE-2 4.3 Equipment and Machinery Investment Cost ............................................... ANN9-3: APP4/RE-3 4.4 Equipment and Machinery O&M Cost ....................................................... ANN9-3: APP4/RE-4 4.5 Water Tariff Estimation ............................................................................... ANN9-3: APP4/RE-5 4.6 Affordability to Pay (ATP) .......................................................................... ANN9-3: APP4/RE-6 4.7 Cash Flow Analysis ..................................................................................... ANN9-3: APP4/RE-7
APPENDIX-5 ENVIRONMENTAL AND SOCIAL CONSIDERATION

Annex 9-3: Pre-Feasibility Study of Rejaf East Irrigation Scheme
TABLES AND FIGURES Table 2.4.1 Chemical Analysis Results ........................................................................ ANN9-3: RE-6 Table 3.1.1 Interviewees’ Information ......................................................................... ANN9-3: RE-7 Table 3.2.1 Average Household Members ................................................................... ANN9-3: RE-8 Table 3.2.2 Net Cash/Inputted Income from Farming ................................................. ANN9-3: RE-8 Table 3.2.3 Average Household Income from Non-farming ........................................ ANN9-3: RE-9 Table 3.2.4 Average Household Expenditure ............................................................... ANN9-3: RE-9 Table 3.2.5 Gender Rates of Selling Cereals (%) ....................................................... ANN9-3: RE-10 Table 3.2.6 Gender Rates of Selling Vegetables (%) ................................................. ANN9-3: RE-10 Table 3.2.7 Gender Rates of Selling Livestock(%) .................................................... ANN9-3: RE-11 Table 3.2.8 Managing Income of Cereals (%) ........................................................... ANN9-3: RE-11 Table 3.2.9 Managing Income of Vegetables (%) ...................................................... ANN9-3: RE-11 Table 3.2.10 Managing Income of Livestock (%) ........................................................ ANN9-3: RE-11 Table 3.2.11 Managing Income of Non-farming (%) ................................................... ANN9-3: RE-11 Table 3.2.12 Gender Rates of Water Taking (%) .......................................................... ANN9-3: RE-11 Table 3.2.13 Gender Rates of Collecting Firewood (%) .............................................. ANN9-3: RE-11 Table 3.2.14 Basic Data on Water Taking .................................................................... ANN9-3: RE-11 Table 3.2.15 Basic Data on Collecting Firewood ......................................................... ANN9-3: RE-11 Table 3.2.16 Land Tenure and Registration ................................................................. ANN9-3: RE-12 Table 3.2.17 Land Control Situation ............................................................................ ANN9-3: RE-12 Table 3.3.1 Average of Farm Land Area .................................................................... ANN9-3: RE-13 Table 3.4.1 Sources of Agricultural Inputs Procurement (no. of Answers) ................ ANN9-3: RE-15 Table 3.4.2 Problems in Obtaining Farm Inputs (no. of Answers) ............................. ANN9-3: RE-16 Table 3.4.3 Inventory of Owned Farm Machinery/Tools ........................................... ANN9-3: RE-16 Table 3.4.4 Average Number of Livestock with the Owners ..................................... ANN9-3: RE-17 Table 3.4.5 Average Number of Livestock in the Samples ........................................ ANN9-3: RE-17 Table 3.5.1 Crop Yields .............................................................................................. ANN9-3: RE-18 Table 3.5.2 Important Causes of Pre-harvest Damage or Loss (no. of Answers) ...... ANN9-3: RE-18 Table 3.5.3 Crop Produces Use .................................................................................. ANN9-3: RE-19 Table 3.5.4 Net Cash Income, Gross Cash Income and Production Cost per ha ....... ANN9-3: RE-19 Table 3.5.5 Net Income Estimate ............................................................................... ANN9-3: RE-20 Table 3.6.1 Mode of Transport ................................................................................... ANN9-3: RE-20 Table 3.6.2 Problems in Marketing of Produces ........................................................ ANN9-3: RE-21 Table 4.1.1 Problems in Farming ............................................................................... ANN9-3: RE-22 Table 4.1.2 Items Needed to be Improved ................................................................. ANN9-3: RE-22 Table 5.1.1 Key Directorate of MEDIWR in National Irrigation Development Programme ............... ................................................................................................................. ANN9-3: RE-24 Table 5.1.2 Stakeholders Involved in National Irrigation Development Programme ANN9-3: RE-24 Table 5.2.1 Categorization of the Irrigation Scheme ................................................. ANN9-3: RE-27 Table 5.3.1 Roles and Responsibilities of Programmes/Projects Implementation ..... ANN9-3: RE-27 Table 5.4.1 Range of Institutional Arrangements for PIM ......................................... ANN9-3: RE-28 Table 6.2.1 Requested Crops ...................................................................................... ANN9-3: RE-30 Table 7.1.1 Meteorological Stations for Necessary Climate Data ............................. ANN9-3: RE-31 Table 7.1.2 Mean Monthly Rainfall at Juba ............................................................... ANN9-3: RE-32 Table 7.1.3 Monthly Mean Max and Min Temperature at Juba ................................. ANN9-3: RE-32

RSS, MEDIWR, Water Sector, Irrigation Development Master Plan (IDMP)
Table 7.1.4 Average Sunshine Hours Estimated by FAO Irrigation and Drainage Paper No.24 .......... ................................................................................................................. ANN9-3: RE-33 Table 7.1.5 Monthly Mean Relative Humidity at Juba .............................................. ANN9-3: RE-33 Table 7.1.6 Monthly Mean Wind Speed at Juba ........................................................ ANN9-3: RE-34 Table 7.1.7 Summary of the Climate Data at Juba ..................................................... ANN9-3: RE-34 Table 7.1.8 Cropping Plan .......................................................................................... ANN9-3: RE-34 Table 7.2.1 Water Requirement Estimation Methods by FAO ................................... ANN9-3: RE-35 Table 7.2.1 Evapo-transpiration (ETo) in Jebel Lado and Rejaf East Estimated by Penman-Monteith ................................................................................................................. ANN9-3: RE-36 Table 7.2.3 Crop Coefficient by Each Crop ............................................................... ANN9-3: RE-36 Table 7.3.1 Irrigation Efficiencies for Jebel Lado and Rejaf East.............................. ANN9-3: RE-41 Table 7.3.2 Rejaf East Scheme Irrigation Water Requirements ................................. ANN9-3: RE-42 Table 7.2.5 Calculation of Irrigation Water Requirement per Month for Rejaf East Scheme ............... ................................................................................................................. ANN9-3: RE-43 Table 8.2.1 Water Level of Bahr el Jebel at Pump Station Location .......................... ANN9-3: RE-46 Table 8.2.2 Water Requirement .................................................................................. ANN9-3: RE-47 Table 8.2.3 Total Head of Pump ................................................................................. ANN9-3: RE-47 Table 8.2.4 Diesel Engine Output .............................................................................. ANN9-3: RE-47 Table 8.2.5 Pipeline Dimension ................................................................................. ANN9-3: RE-50 Table 8.3.1 Main Canal .............................................................................................. ANN9-3: RE-51 Table 8.3.2 Calculation of Main Canal Section ......................................................... ANN9-3: RE-52 Table 8.4.1 Example of Maximum Furrow Length of Different Soil ........................ ANN9-3: RE-53 Table 8.4.2 Calculation of Irrigation Canal Section and Farm Ditch ......................... ANN9-3: RE-54 Table 9.1.1 Management Structure of Rejaf East Irrigation Scheme ......................... ANN9-3: RE-56 Table 9.1.2 Ideal Equipment and Machineries at Scheme Management Office ........ ANN9-3: RE-57 Table 9.1.3 Ideal Demarcations among Stakeholders ................................................ ANN9-3: RE-57 Table 9.2.1 Typical Water Distribution Method in Open Canal Scheme ................... ANN9-3: RE-58 Table 9.2.2 Typical Operation Activities and Responsible Organizations ................. ANN9-3: RE-59 Table 9.3.1 Typical Maintenance Activities of Irrigation Facilities ........................... ANN9-3: RE-60 Table 9.3.2 Typical Maintenance Activities and Responsible Organizations............. ANN9-3: RE-61 Table 9.4.1 Annual O&M Cost .................................................................................. ANN9-3: RE-61 Table 9.4.2 Annual O&M Cost .................................................................................. ANN9-3: RE-62 Table 9.4.3 Proposed ISF and Members’ Fee ............................................................. ANN9-3: RE-64 Table 10.1.1 Conditions for Estimate ........................................................................... ANN9-3: RE-68 Table 10.2.1 Project Cost ............................................................................................. ANN9-3: RE-68 Table 11.2.1 Implementation Schedule ........................................................................ ANN9-3: RE-69 Table 12.2.1 Summary of Preliminary Survey Methods .............................................. ANN9-3: RE-70 Table 12.3.1 Evaluation Methods (Evaluation Items) .................................................. ANN9-3: RE-71 Table 12.3.2 Summary of Scoring and Ranking .......................................................... ANN9-3: RE-71 Table 12.5.1 Results of Scoping ................................................................................... ANN9-3: RE-75 Table 12.6.1 Recommended Survey Methods for Further Study ................................. ANN9-3: RE-77 Table 13.3.1 Financial and Economic Price of Agricultural Produces/Inputs .............. ANN9-3: RE-80 Table 13.4.1 Summary of Project Cost (Financial Price) ............................................. ANN9-3: RE-81 Table 13.4.2 Estimation of Project Cost at Economic Price ........................................ ANN9-3: RE-81 Table 13.5.1 Summary of Net Incremental Benefit at Financial Price ......................... ANN9-3: RE-82 Table 13.5.2 Summary of Economic Incremental Benefits ......................................... ANN9-3: RE-82

Annex 9-3: Pre-Feasibility Study of Rejaf East Irrigation Scheme
Figure 1.1.1 Location of Project Area ........................................................................... ANN9-3: RE-1 Figure 2.1.1 Overview of Survey Area .......................................................................... ANN9-3: RE-3 Figure 2.2.1 Locations of Boreholes in the Survey Area ............................................... ANN9-3: RE-4 Figure 2.4.1 Soil Survey Points ..................................................................................... ANN9-3: RE-5 Figure 2.4.2 Soil Profile in Command Area .................................................................. ANN9-3: RE-5 Figure 2.4.3 Land Scape in Command Area .................................................................. ANN9-3: RE-5 Figure 3.3.1 Cropping Pattern ..................................................................................... ANN9-3: RE-14 Figure 3.3.2 Land Use Ratio in 3 Priority Project Sites .............................................. ANN9-3: RE-15 Figure 6.2.1 Planned Cropping Pattern ........................................................................ ANN9-3: RE-30 Figure 7.1.1 Meteorological Stations in South Sudan ................................................. ANN9-3: RE-31 Figure 7.1.2 Mean Monthly Rainfall at Juba ............................................................... ANN9-3: RE-32 Figure 7.1.3 Mean Monthly Max and Min Temperature at Juba ................................. ANN9-3: RE-32 Figure 7.1.4 Mean Monthly Relative Humidity at Juba .............................................. ANN9-3: RE-33 Figure 7.1.5 Mean Monthly Wind Speed at Juba ........................................................ ANN9-3: RE-34 Figure 7.2.1 Crop Coefficient Curve ........................................................................... ANN9-3: RE-36 Figure 7.2.2 Crop Coefficient ...................................................................................... ANN9-3: RE-37 Figure 7.2.3 Dependable Rainfall at Juba .................................................................... ANN9-3: RE-38 Figure 7.2.4 Effective Rainfall at Juba ........................................................................ ANN9-3: RE-39 Figure 8.1.1 Location Map .......................................................................................... ANN9-3: RE-45 Figure 8.2.1 River Cross Section at Pump Station No.1 .............................................. ANN9-3: RE-46 Figure 8.2.2 Plan and Section of Pump Station Building ............................................ ANN9-3: RE-48 Figure 8.2.3 Plan and Section of Pump Station Building (Profile) .............................. ANN9-3: RE-49 Figure 8.2.4 Storage ..................................................................................................... ANN9-3: RE-49 Figure 8.2.5 Typical Section of Pipeline No.1 ............................................................. ANN9-3: RE-50 Figure 8.2.6 Discharge Chamber (reference) ............................................................... ANN9-3: RE-51 Figure 8.3.1 Typical Cross section of Main Canal ...................................................... ANN9-3: RE-52 Figure 8.4.1 Layout of Irrigation and Drainage Facilities in Command Area ............. ANN9-3: RE-53 Figure 8.4.2 Typical Cross Section of Irrigation and Drainage Facilities in Command Area ................ ................................................................................................................. ANN9-3: RE-54 Figure 8.4.3 Typical Cross Section of Road Crossing in Command Area ................... ANN9-3: RE-55 Figure 9.4.1 Balance of Revenue and Expenditure ..................................................... ANN9-3: RE-66 Figure 11.1.1 Monthly Rain fall (Juba Station) ............................................................. ANN9-3: RE-69 Figure 12.4.1 Overview of Possible Impacts ................................................................. ANN9-3: RE-72 Figure 12.4.2 Location of Designated Areas of Wildlife Conservation ......................... ANN9-3: RE-73 Figure 12.4.2 Tracks of Seasonal Stream ...................................................................... ANN9-3: RE-73 Figure 12.4.4 Facilities in the Project Site ..................................................................... ANN9-3: RE-74

RSS, MEDIWR, Water Sector, Irrigation Development Master Plan (IDMP)
ANN9-3: RE-1
PART 1 PRESENT SITUATION OF THE PROJECT AREA
CHAPTER 1 SITE PROFILE
1.1 Location
Rejaf East Irrigation Scheme is located adjacent per-urban area of Juba city, where high demand of food supply due to its large population. Hence, there is a large potential to generate cash income by producing cash crops including vegetables. Especially, production of leafy vegetables, which are not imported from foreign countries because of its perishability, is likely to make a good profit. In addition, low humidity in dry season can lead to reduction of risk caused by fungi or disease.
Source: IDMP TT (Soil survey 2015)
Figure 1.1.1 Location of Project Area
1.2 Beneficial Area and Communities
There are three (3) communities residing in the project area namely Guduge, Migiri and Mogoro. The land is tenured under the communities, while certain areas have been invested by private sectors for farmlands, housing site, etc. Due to close location from Juba city, land potential is high, so that land holding could be complicated.
1.3 Basic Community Profile
(1) Basic information about the communities
Dominant livelihood of those communities is farming and fishery, but also certain people work in Juba city for side businesses. According to the communities, they were caught in battles under the past civil war. Therefore many grave yards are scattered in the project site.
(2) Basic agricultural status
High demand of food supply is expected due to its large population. Hence, there is a large potential to generate cash income by producing cash crops. There some farmers who have been already engage in cultivating crops by irrigation using portable pumps.
Some farmers are practicing irrigated agriculture using small pump along the Bahr el Jebel and they are cultivating banana and vegetables, which are mainly for selling. It seems they have potential to cultivate cash crops in dry season.

Annex 9-3: Pre-Feasibility Study of Rejaf East Irrigation Scheme
ANN9-3: RE-2
CHAPTER 2 NATURAL CONDITIONS
2.1 Topographic Survey
(1) Scope of works
For topographic survey, the following equipment was used:
- Total station Sokkia set 510; - Global positioning system (GPS) receiver (Sokkia GRX1 , Trimble 5800); - Level and - AutoCAD system (Autocad civil 3d ).
Survey structure contains:
1) Pipeline:
- Establishment of temporary benchmark (TBM) - Longitudinal profile survey: in drawing profile use the Auto cad civil 3d and layout in (A3) paper (plan & profile in one sheet Scale: V=1/100, H=1/1,000) - Cross-sectional Survey: any 100 m, width of section 200m, 15sections (scale: V=1/100, H=1/100) - Plane Survey: area (1500*3300 m2) create contour map by scale 1:4000
2) Canal route survey:
- Establishment of temporary benchmark (TBM) - Longitudinal profile survey: in drawing profile use the Auto cad civil 3d and layout in (A3) paper (plan & profile in one sheet Scale: V=1/100, H=1/1,000) - Cross-sectional Survey: any 200m, width of section 200m, 15sections (scale: V=1/100, H=1/100) - Plane Survey: 4 area (200*200 m2) create contour map by scale 1:4000
3) Command area survey:
- Establishment of temporary benchmark (TBM) - Longitudinal profile survey: in drawing profile use the Auto cad civil 3d and layout in (A3) paper (plan & profile in one sheet Scale: V=1/100, H=1/1,000) - Cross-sectional Survey: any 100m, width of section 200m, 15sections (scale: V=1/100, H=1/100) - Plane Survey: area (6500*2000 m2) create contour map by scale 1:4000
4) Pumping station survey:
- Establishment of temporary benchmark (TBM) - Cross-sectional Survey: any 500m, width of section 500m, 15sections (scale: V=1/100, H=1/100 ) - Plane Survey: area (500*300 m2) create contour map by scale 1:4000
The survey area is described as below:

RSS, MEDIWR, Water Sector, Irrigation Development Master Plan (IDMP)
ANN9-3: RE-3
Figure 2.1.1 Overview of Survey Area
(2) Topographical profile
Command area is located from right bank of Bahr el Jebel toward the hillside of 2km distance. The terrain between riverside and Rejaf Road is flat, and many small irrigation farms are scattered along the river. The terrain of hillside is undulate, and many bushes, trees and grasses dominate in the site. Pump station site has some big trees. In the pipe line and canal line, the conditions are almost same as the command area.
2.2 Geological Survey
(1) Scope of works
1) Borehole drilling
The borehole drilling works at the proposed three pump stations constituted a total of 45mts and detailed as:
- PB-01: 10m X 1 borehole (at the pumping station No. 1 in the Mugoro Community) - PB-02: 10m X 1 borehole (at the pumping station No. 2 in the Migiri Community) - PB-03: 10m X 1 borehole (at the pumping station No. 3 in the Guduge Community) - CB-01 & CB-02: 5m X 2 boreholes (on the North & South Main canal alignment) - RB=01: 5m X 1 borehole (on the pipe line alignment at the crossing of the Rejaf-Eat
Town road)
2) Standard penetration test (SPT)
A total of 45 STP tests are designed to be run in this project activity and the details are presented as:
- At three Pump Stations: 10 tests X 3 boreholes (at 1 mt interval in 10mt – borehole at the three pumping stations)
- On The North & South Main Canal Alignments: 5 tests X 2 boreholes (at 1mt interval in 5m – borehole on the canal alignment)

Annex 9-3: Pre-Feasibility Study of Rejaf East Irrigation Scheme
ANN9-3: RE-4
- At the Pipe Line Alignment: 5 tests X 1borehole (at 1m interval in 5m- borehole on the pipeline alignment across Rejaf-East Town road)
3) Laboratory test
As per to the technical specification provided by the Consultant, the Nine Samples to be taken to the Laboratory are detailed as:
- 2 samples from 10m-borehole × 3 pumping stations, - 2 samples from 5m-borehole on the canal alignment, and - 1 samples from 5m-borehole on the pipeline alignment across Rejaf-East Town road
Locations of boreholes are shown in Figure 2.2.1.
(2) Geological profile
The pump site area is covered by thick (3m-8m) soils (ML, CL, SM, SC, SP), the River deposit along the river bank and the base rock is Gneiss. The command area is covered by relatively thin (2m- 3m) soil (SW). There are outcrops of sound bed rock in the command area. The rock underlying the thin soil layer is moderately weathered Gneiss and is found out slightly weathered and well jointed Granite.
2.3 Hydrology
Annual rainfall is about 1000mm. Bahr el Jebel has plenty of water for irrigation water.
2.4. Soil Investigation
(1) Methodology
Generally, there are two (2) ways to select survey points in certain area. The first way is just to choose points to cover the area equally, for instance by covering square mesh with certain distance and selecting the crossing as survey points. This way is applied in case no specific geological or topographic information is available. On the other hand, the second way is to select survey points according to the existing information regarding soil type distribution in the area, which is applicable only in case there’s available information got on the ground. In case of Rejaf East, the second way was applied because it is recognized soil condition changes from the river bank (western part of the command area) to eastern part where main road connecting to Juba. In addition, there is existing residential area and farmland in the command area, for instance, the area around church located in southern part of the command area is intensively populated. Hence, it was necessary to avoid choosing points in such area.
Figure 2.4.1 shows the points at which actual survey was carried out and 9 points were examined after all.
Source: IDMP TT
Figure 2.2.1 Locations of Boreholes in the Survey Area

RSS, MEDIWR, Water Sector, Irrigation Development Master Plan (IDMP)
ANN9-3: RE-5
(2) Result of field observation (soil conditions)
In the command area, there is heavy vegetation like Jebel Lado, it covered with trees and bushes. Soil in the command area has deep dark brown colour ant its texture mainly ranges from Sandy Loam to Loam. Relatively much amount of gravels was observed on the section from the top to 1m depth. In some part of the command area, large stones being out on the surface were observed. Soil is not compacted on the whole, and it was very soft from top up to at least 60 to 70 cm. Around No.7 near from the river (See Figure 2.4.1) is like damp area, where oxidized mottles were observed on the section.
1) Result of chemical analysis and consideration (soil chemistry)
Table 2.4.1 shows the result of chemical analysis. Humus ratio was as high as 2.7 % and at some points it was more or nearly equal to 4%. CEC was 13.9 me/100g on average. Compared to desirable value (generally it is said more than 20 me/100g is ideal), it is relatively low and it can be improved more by land management.
Nutrient contents vary widely place to place. For instance, at No.3 to 5 (the middle part of the command area, see Figure 2.4.1) Calcium and Magnesium contents tend to be low. Apart from the amount of contents, unbalanced base ratio would have to be moderated as same as other two (2) sites.
Soil pH is almost within suitable range, but only soil at No.5 was alkaline. Detailed distribution of soil pH is not available, but pH control may have to be treated at some parts of the command area at the stage of actual farming operation.
Figure 2.4.1 Soil Survey Points * Blue points are for 50 cm depth cross section survey, and red ones are for 1 m depth. * Distance of mesh covered over the command area is 1 km.
Figure 2.4.3 Land Scape in Command Area
Figure 2.4.2 Soil Profile in Command Area

Annex 9-3: Pre-Feasibility Study of Rejaf East Irrigation Scheme
ANN9-3: RE-6
Table 2.4.1 Chemical Analysis Results Average Minimum value Maximum value Humus ratio (%) 2.7 1 4.7 CEC (me/100g) *1 *2 13.9 7.6 21 NO3-N (mg/100g) 1.1 0.3 2.7 Fe2O3 (ppm) 11.4 0 30 P2O5 (mg/100g) 20.6 0 50 K2O (mg/100g) 81.9 1 168 CaO (mg/100g) 248.1 61 514 MgO (mg/100g) 43.0 5 131 Mn (mg/100g) 2.1 0 5 pH 6.8 6 8.9 EC *3 0.0 0 0.06 Total N (%) *2 0.2 0.09 0.36 CN ratio*2 6.7 5.8 7.6 Base ratio CaO/MgO *2 8.4 1.1 20.3 MgO/K2O *2 18.1 0.1 136.3 CaO/K2O *2 100.1 1.4 699.2
Source: IDMP TT (Soil survey 2015) *1 CEC is an abbreviation of Caption Exchange Capacity *2 Estimated value. *3 EC is an abbreviation of Electric conductivity.

RSS, MEDIWR, Water Sector, Irrigation Development Master Plan (IDMP)
ANN9-3: RE-7
CHAPTER 3 AGRICULTURE AND SOCIO-ECONOMIC
3.1 Methods of Agriculture and Socio-Economic Survey
Agriculture and Socio-Economic Survey was conducted by interview with a questionnaire in the project area. The related three (3) communities were targeted; namely Guduge, Migiri, and Mogoro, which are located north, central, and south part of the command area respectively. All of communities are under Tokiman boma, Rejaf payam, Juba County. The survey aimed to take necessary data for making the farming plan and evaluating the priority projects from the viewpoints of socio-economic and marketing. The contents of the questionnaire consisted of 14 items, centralizing the related questions to the situation of farming and household.
The enumerators in pairs were going to hold two interviews a day, target interviewees counted 26 households. It is necessary to previously explain the survey method to the interviewees since the questions include private points, such as household income, expenditure, etc. Grasping the current situation of the target communities is indispensable for the planning of the priority projects. Hence, a preliminary workshop was held before the survey. Days of workshop and number of interviewees are given as below:
Days of Workshops : Middle of June, 2015 Number of interviewees : 26 persons (Breakdown is shown in the table below)
Table 3.1.1 Interviewees’ Information Community Male Female Total
Gwuduge 4 5 9 Mogiri 6 2 8 Mugoro 8 1 9
Total 18 8 26 Source: IDMP TT (Socio-economic survey, 2015)
The contents of the questionnaire are divided into the 14 items; 1) Background of household, 2) Land holding and land tenure, 3) Inventory of farm machinery and hiring cost of farming power, 4) Crop production and farming practices, 5) Income from other crops in home garden, livestock and other products, 6) Wages/ salary, leasing, business and other income, 7) Living expenses, 8) Present farming situation, 9) Selling of agriculture products, 10) Existing farmers' group and farmers’ organization, 11) Irrigation service charge / activity of WUA or WG, 12) Loan, 13) Agricultural services / agricultural activities, and 14) Gender/ roles and responsibilities.
In terms of the social sector, questions, such as land tenure, gender issues/roles, drinking water, cooking fuel, etc., were set in the questionnaire, referring Handbook on Community Engagement, April 2012, South Sudan Law Society. Though there is enough development potential of the land use, some issues, such as dealing of community land, land utilizing division of tribes, etc., have to be treated carefully.
From the viewpoints of making the planting plan, the enumerators asked the interviewees about their views for future crops based on the existing planting model. In addition to the question, the enumerators also asked their intention of the crop selection in order to grasp the needs of an irrigation project and reflect to the farming plan. Also, as for the introduction of fertilizer, concerned questions were made based on the results of the sales conditions survey in Juba to make the agriculture input plan for the priority projects in accordance with the actual conditions.

Annex 9-3: Pre-Feasibility Study of Rejaf East Irrigation Scheme
ANN9-3: RE-8
3.2 Socio-Economic Indicators
(1) Household members
Table 3.2.1 shows the average household members with the number of children under14 years old in Rejaf East. The total average number of family members is 6.4 persons/ household.
Table 3.2.1 Average Household Members Community Adults equal/above 14 Children under 14 Total
Male Female Sub Total Male Female Sub Total Gwuduge 2.4 2.3 4.8 0.6 0.2 0.8 5.6 Migiri 2.8 2.1 4.9 1.1 1.3 2.4 7.3 Mogoro 1.9 2.5 4.4 0.6 1.6 2.3 6.6
Total 2.4 2.3 4.7 0.8 1.0 1.8 6.4 Source: IDMP TT (Socio-economic survey, 2015)
Interviewees’ education experiences were also asked in the questionnaire. In Rejaf East, half of the interviewees who answered to this question graduated only from primary school and another half has secondary school educational experience or higher grade.
Interviewees and their families are sometimes engaged in another work, such as employee/Government staffs.
(2) Income from farming and others
Table 3.2.2 shows the estimated net cash income and net income per annum from farming in Rejaf East. The annual net cash income from farming is about four (4) thousand SSP and annual net income is about eight (8) thousand SSP, respectively. About half of net income is consumed within household. Major components of net income are those from Maize, Okra and Jew’s mallow followed by Sorghum and Cassava. On the other hand, Major components of net cash income are those from Jew’s mallow, Okra, followed by Maize and Eggplant.
Table 3.2.2 Net Cash/Inputted Income from Farming Area
(ha/HH) Yield (t/ha)
Production (kg/HH)
ratio for sale
Farm gate price
(SSP/kg)
Production cost
(SSP/ha)
Net cash income (SSP/HH)
Net income (SSP/HH)
(a) (b) (c)=(a)*(b) (d) (e) (f) (g) =(c)*(d)*(e)-(a)*(f)
(h) =(c)*(e)-(a)*(f)
Maize 0.73 0.7 486.8 48.1% 3.7 125 775 1,710 Sorghum 0.24 0.9 209.9 - (4.2) 98 -23 858 Cassava 0.12 1.6 187.6 1.0% 5 441 -44 885 Common bean 0.04 0.3 14.6 - (4.6) 16 -1 67 G nut 0.23 0.8 181.3 - (3.9) 154 -36 672 Sesame 0.01 0.5 3.2 - (4.8) 0 - 15 Vegetables Okra 0.12 1.1 131.3 92.5% 9.1 1,005 985 1,074 Tomato 0.02 3.6 75.0 98.1% 4.3 571 304 311 Egg plant 0.03 1.8 55.1 92.7% 14.5 580 722 780 Pumpkin 0.01 0.8 4.0 92.0% 10 159 36 39 Jew's mallow 0.12 2.2 263.8 96.0% 4.5 690 1,057 1,105 Amaranthus 0.05 3.2 157.2 98.8% 0 621 -31 -31 Sukuma wiki 0.01 0.9 10.8 34.4% 5 926 7 42 Cowpea 0.05 0.7 35.7 100.0% 3.6 175 120 120 Onion 0.01 2.9 24.0 100.0% 2 7,190 -12 -12 Green pepper 0.02 0.8 16.5 75.0% 13.8 1,011 150 206 Total 4,009 7,841
Source: IDMP TT (Socio-economic survey, 2015) Note: Farm-gate price in ( ) is the average of other sites due to lack of data in this site

RSS, MEDIWR, Water Sector, Irrigation Development Master Plan (IDMP)
ANN9-3: RE-9
Next table shows annual average household income from other than farming in each area. We can find that the salary income from other occupation, such as government official, company employee, driver, etc. in Rejaf East is much bigger than other areas. Figures in receipt of gifts and remittance from relatives and others were estimated, based on the monthly income. There is only one case of lease income of farm land in Rejaf East.
Table 3.2.3 Average Household Income from Non-faming (SSP/year)
Areas Salary of other
occupations Wages as casual
worker Gifts and
remittance Lease of farm land Total
Wau 317 162 462 - 940 Jebel Lado 706 - - - 706 Rejaf East 3,005 - 462 38 3,505 Total 1,299 53 320 13 1,685
Source: IDMP TT (Socio-economic survey, 2015)
(3) Living expenses
Next table shows average household expenditure in a year. The annual total outlay is about 17 thousand SSP. Outlay for foods is about nine thousand SSP, which occupies 52 % of the total expenditure. Purchase of meat and eggs is SSP 20 hundred, which is the biggest item and occupies 11 % of the total expenditure. The following big items are outlay for education, SSP 19 hundred (11%), outlay for medical care, SSP 16 hundred (9%), and purchase of clothing, SSP 15 hundred (9%).
Table 3.2.4 Average Household Expenditure Foods (SSP/HH) (%) Other than foods (SSP/HH) (%) Maize 1,274 7.3 Tobacco and Cigarettes 539 3.1 Sorghum 642 3.7 Soap, Shampoo 729 4.2 Cassava 145 0.8 Electricity charges - - Common Beans 330 1.9 Firewood, cooking fuel and LP-gas 450 2.6 Ground nut 379 2.2 Lighting fuel 170 1.0 Sesame 62 0.4 Household furnishing and equipment - - Other tubers and Roots 119 0.7 Repair and maintenance of house - - Fish 524 3.0 Clothing 1,537 8.8 Meat and Eggs 1,959 11.2 Medical care 1,614 9.2 Vegetables 209 1.2 Education 1,938 11.1 Flour 346 2.0 Recreation 18 0.1 Bread 430 2.5 Ceremonial Occasions 292 1.7 Tea and Coffee 491 2.8 Transportation and communication 1,059 6.1 Milk and Yogurt 90 0.5 Remittance to relatives 41 0.2 Liquor and Soft drinks - 0.0 Land and house rent - - Cooking oil 1,239 7.1 Taxes - - Sugar and Salt 784 4.5 Loan repayment - - Spice and other foods 54 0.3 Sub total 8,388 48.0 Sub total 9,077 52.0 Grand total 17,466 100.0
Source: IDMP TT (Socio-economic survey, 2015)
(4) Loans
Question regarding loan was made in the questionnaire and 15 interviewees answered to the question. Four (4) of them borrow money, and one (1) borrowed from Equity bank and three (3) from their relatives. One (1) borrowed from 350-700 SSP, two (2) borrowed from 700-1400 SSP and one borrowed more than 3500 SSP from Equity bank with 20 %/month of interest rate and three (3) years repayment period.
Their purposes of borrowing money were 1) To hire agricultural labor, 2) Agricultural machines such as water pump and 3) House construction.

Annex 9-3: Pre-Feasibility Study of Rejaf East Irrigation Scheme
ANN9-3: RE-10
On the other hand, majority of the interviewees are not borrowing money. The most major reason of not borrowing money was lack of opportunity / place to borrow money, followed by “Not necessary”, “Unable to refund” and “Unable to provide with collateral”.
(5) Farmers’ groups/organizations
There were four (4) interviewees who was a member of an existing farmers’ group (FG) or farmers’ organization (FO) in 20 interviewees answered to concerned questions. A common objective of the four-FG/FO is organizing social activities for the village. Two of them are also organized for cooperative shipping of products, and one of them is also organized for cooperative purchasing of farm inputs such as fertilizers, agro-chemical, etc.
Three members of the FG/FO are not satisfied about the present activities though one member is fairly satisfied about them. The three members answered about problems of their FG/FO as follows.
- No fund to manage FG/FO. - Farmers have no interest to organization’s activities. - No leader. - FG/FO is managed only on the leader’s ideas and opinion of members is not considered. - Leader has no sense of responsibility to the members.
There was no interviewee who was a member of an existing water group or water users association.
(6) Roles of males, females and children
Next table shows gender rates of selling cereals in each area. We can find that the ratio of female only is higher and the ratio of male only is lower than those of the total. The reason is considered that selling amount of cereals in Rejaf East is smaller than the total average so that the sales do not require male power so much. The ratio of “With Children” means that children participate in the sales in 13 % of the total households which answered concerned questions in Rejaf East.
Table 3.2.5 Gender Rates of Selling Cereals (%)
Area Male Female Both With only only M&F Children
Wau 42 19 38 12 Jebel Lado 13 65 22 9 Rejaf East 19 50 31 13
Total 26 43 31 11 Source: IDMP TT (Socio-economic survey, 2015)
Next table shows gender rates of selling vegetables. The ratio of female only is higher than that of male only. The reason is considered that selling vegetables does not require male power so much.
Table 3.2.6 Gender Rates of Selling Vegetables (%)
Area Male Female Both With only only M&F Children
Wau 36 48 16 8 Jebel Lado 9 78 13 9 Rejaf East 25 56 19 6
Total 23 61 16 8 Source: IDMP TT (Socio-economic survey, 2015)
Next table shows gender rates of selling livestock. We can find that almost all sales of livestock are conducted by men. The reasons are considered that selling livestock requires male power and that provide comparatively big money.

RSS, MEDIWR, Water Sector, Irrigation Development Master Plan (IDMP)
ANN9-3: RE-11
Table 3.2.7 Gender Rates of Selling Livestock(%)
Area Male Female Both With only only M&F Children
Wau 92 0 8 0 Jebel Lado 100 0 0 0 Rejaf East 88 0 13 19
Total 94 0 6 5 Source: IDMP TT (Socio-economic survey, 2015)
To grasp the situation of money management in households, gender rates of managing incomes are arranged in tables below. We can find that ratios of male only are higher than those of female only; especially, most income management of livestock is conducted by men. Item whose ratio of female only is comparatively high is vegetable.
Table 3.2.8 Managing Income of Cereals (%) Table 3.2.9 Managing Income of Vegetables(%)
Area Male Female Both
Area Male Female Both
only only M&F only only M&F Wau 46 8 46 Wau 42 25 33 Jebel Lado 78 13 9 Jebel Lado 70 13 17 Rejaf East 44 25 31 Rejaf East 38 31 31
Total 57 14 29 Total 51 22 27 Source: IDMP TT (Socio-economic survey, 2015) Source: IDMP TT (Socio-economic survey, 2015)
Table 3.2.10 Managing Income of Livestock (%) Table 3.2.11 Managing Income of Non-farming (%)
Area Male Female Both
Area Male Female Both
only only M&F only only M&F Wau 71 4 25 Wau 42 23 35 Jebel Lado 100 0 0 Jebel Lado 22 17 61 Rejaf East 53 0 47 Rejaf East 38 25 38
Total 76 2 22 Total 34 22 45 Source: IDMP TT (Socio-economic survey, 2015) Source: IDMP TT (Socio-economic survey, 2015)
On the other hand, almost all works of water taking and collecting firewood are conducted by women as showing tables below.
Table 3.2.12 Gender Rates of Water Taking (%) Table 3.2.13 Gender Rates of Collecting Firewood (%)
Area Male Female Both With
Area Male Female Both With
only only M&F Children only only M&F Children Wau 4 92 4 35 Wau 4 96 0 44 Jebel Lado 0 96 4 57 Jebel Lado 0 100 0 59 Rejaf East 7 93 0 33 Rejaf East 6 94 0 31
Total 3 94 3 42 Total 3 97 0 46 Source: IDMP TT (Socio-economic survey, 2015) Source: IDMP TT (Socio-economic survey, 2015)
Next tables show average distances from houses to water source / collecting point of firewood, and necessary times per day/week for the works.
Table 3.2.14 Basic Data on Water Taking Table 3.2.15 Basic Data on Collecting Firewood
Area Distance Times Hours Hours
Area Distance Times Hours Hours
(meter) per day
per time
per day
(meter) per week
per time
per week
Wau 830 3.1 0.7 2.1 Wau 660 3.4 2.2 7.6 Jebel Lado 447 3.3 0.4 1.4 Jebel Lado 820 2.1 1.5 3.3 Rejaf East 266 2.9 0.4 1.2 Rejaf East 920 2.5 1.4 3.4 Total 556 3.1 0.5 1.7 Total 780 2.7 1.7 4.7
Source: IDMP TT (Socio-economic survey, 2015) Source: IDMP TT (Socio-economic survey, 2015)

Annex 9-3: Pre-Feasibility Study of Rejaf East Irrigation Scheme
ANN9-3: RE-12
(7) Land lease/borrow
There was one interviewee who leased 1 feddan of irrigated field and there were two interviewees who borrowed average 2 feddan of irrigated field in the case of Rejaf East. The lease and borrow average monthly charge are 83 SSP/fed and 146 SSP/fed respectively. The reason of the borrowing irrigated field is to sell the production. Additional interview related land ownership was conducted.
Table 3.2.16 shows land tenure type of interviewee’s cultivating land and with/without land registration. In case of Rejaf East, all of the interviewee’s agricultural lands belong to the community and not registered.
Table 3.2.16 Land Tenure and Registration Land tenure type of cultivating land Community Private Others
9 - - Registration of agricultural land Registered Not Registered partial
- 9 - Source: IDMP TT (Socio-economic survey, 2015)
Table 3.2.17 shows land control access situation of communal and private land. Regarding selling rights both of communal and private lands, all of the interviewees who answered to the question recognize that they cannot make any decision of selling their land without permission from traditional/public attorney. Regarding selling communal land, the interviewees just have to obtain permission from traditional attorney and family head. On one hand, in case the interviewees sell their private land, they have to get permission from both of Traditional attorney and County land authorities. It indicates that land control authorities customarily are exercised by both of traditional and county authorities at county level.
Regarding change of land use type and change of crop to cultivate are totally up to the interviewees, namely to those who are actual land users.
Table 3.2.17 Land Control Situation For land’s tenure as “Community” Y N Traditional
attorney Public total
Others Land
commission County land authorities
Payam land councils
i) "if you want to sell land, can you decide yourself?" - 9 4 - - - - 4*1 ii) "if you want to change land use type, can you decide yourself?" 9 - - - - - - - iii) "if you want to change the currently cultivating crop, can you decide yourself?" 9 - - - - - - - For land’s tenure as “Private” Y N Traditional
attorney Public total
Others Land
commission County land authorities
Payam land councils
i) "if you want to sell land, can you decide yourself?" - 4 4 4 - 4 - - ii) "if you want to change land use type, can you decide yourself?" 4 - - - - - - - iii) "if you want to change the currently cultivating crop, can you decide yourself?" 4 - - - - - - -
Source: IDMP TT (Socio-economic survey, 2015) Note*1: “Others” specification was family head or family member.

RSS, MEDIWR, Water Sector, Irrigation Development Master Plan (IDMP)
ANN9-3: RE-13
All of the interviewees who answered the question answered that their cultivating land is hereditary land. Those successors are generally interviewees ‘son and one (1) interviewee answered his/her daughter is the one who inherit land. This means their land can be inherited to normally son and sometimes to brother even though those lands owner is community.
In addition, following questions are asked in the questionnaire;
1) If irrigation network is passing through your private land, how do you coordinate with the surrounding land belonging to other people for its smooth operation?
2) If the planned irrigation canal is passing through your land, will you accept to let it pass through?
Interviewees generally gave positive response to the above questions. To first one above, following answer was given by the interviewee; “I will coordinate it smoothly”.
(8) Effect caused by the conflict
The answers to the question of problems that caused by the conflict occurred in December 2013 are summarized into two points below. The second point mentions that even in Rejaf East, which is located next to Juba town, the market of agricultural produce is shrinking after the crisis.
- No problem - No market for products
3.3 Farm Land and Cropping Pattern
(1) Farm land area
Table 3.3.1 shows the total farm land holding area with its breakdowns; 1) irrigated, 2) non-irrigated and 3) homestead. Nearly half of the farmland is irrigated land on average in Rejaf East. One third of total farmland is non-irrigated and the rest is homestead. The average irrigated area and its land share are larger than other two (2) sites. In addition, land share of home stead and its area is larger than other two (2) sites and consequently non-irrigated land in Rejaf East is the smallest among three (3) sites.
Table 3.3.1 Average of Farm Land Area (fed/HH) Total area
Irrigated Non-irrigated Homestead Jebel Lado 4.3 0.6 (14.0%) 3.1 (72.0%) 0.6 (14.0%) Wau Rice Scheme 6.7 0.2 (3.0%) 5.6 (83.6%) 0.9 (13.4%) Rejaf East 5.5 2.7 (49.1%) 1.6 (29.1%) 1.2 (21.8%)
Source: IDMP TT (Socio-economic survey, 2015)
(2) Cropping pattern
Figure 3.3.1 shows the cropping pattern in Rejaf East, which is estimated based on the socio-economic survey results and Figure 3.2.2 shows summarized land use ratio of crops in three (3) priority project sites. The overall cropping intensity is 79.4 %, lowest among the three (3) sites. The most largely cultivated crop is Maize, 31.4 % of total farmland, followed by Sorghum, 10.3 % and Ground nut, 10.0%. The land use ratio of vegetables is as high as 20.4 %, which is the highest as land use ratio of vegetable among the three (3) sites. Among the vegetables cultivated in the site, Okra and Jew’s mallow are popular among the farmers.
In Rejaf East, vegetables are grown throughout a year, actually, cultivation periods of popular vegetables like Okra, Jew’s mallow, Tomato and Egg plant vary depend on the individuals. In addition,

Annex 9-3: Pre-Feasibility Study of Rejaf East Irrigation Scheme
ANN9-3: RE-14
some of the farmers seem to cultivate same vegetable repeatedly through the year. While Maize, Sorghum, Ground nut and sesame are grown mainly in dry season as same as other two (2) sites, there is a farmer who cultivate maize in dry season
Source: IDMP TT (Socio-economic survey, 2015) *1: Parenthesized numbers show the breakdown of the above percentage. *2: Parenthesized numbers shows the breakdown of the above number *3: Cultivation period of vegetables shown in the figure above, is the average period of each crops’ samples.
Figure 3.3.1 Cropping Pattern
L LS
WS
WH
F FH
18
W W H Cropping in dry season L L S (1)
Sorghum 10.3%L L
SW
SW H H
12
LS
L
WS
W
H H
Common bean 1.8%L
SW
LS
W5
Ground nut 10.0%
LS
WH
LS
WH
13
Sesame 0.3%
L LS
WS
HW
H6
20.4%
Okra (5.2%) 15
Tomato (0.9%) 3
Egg plant (1.3%) 5
Pumpkin (0.2%) 1
Jew's mallow (5.2%) 19
Amaranthus (2.1%) 8
Sukuma siki (0.5%) 2
Cowpea (2.1%) 3
Onion (0.4%) 1
Green pepper (0.9%) 4
Others (1.5%) 8
Vegetables/Cashcrops
31.4%
5.2%
1.7months/season
4.0months/season
7.0months/season
5.3months/season
6.0months/season
3.0months/season
3.0months/season
1.1months/season
9.0months/season
4.1months/season
Cassava 10
Dec Rainy season
Crop name
Maize
Land*1
use %No. of*2
Answers
Jun Jul Aug Sep Oct NovMonth Jan Feb Mar April May

RSS, MEDIWR, Water Sector, Irrigation Development Master Plan (IDMP)
ANN9-3: RE-15
Source: IDMP TT (Socio-economic survey, 2015) Figure 3.3.2 Land Use Ratio in 3 Priority Project Sites
3.4 Farming Practices
(1) Agricultural inputs procurement
Table 3.4.1 shows the sources of agricultural inputs procurement. Information regarding agro-chemicals, fertilizer and fuel for tractor is few due to their limited use among the interviewees, however, there surely are some farmers applying agro-chemicals especially for vegetables and also a few is using it for maize.
The major way to obtain cereal seed is to make it by themselves as same as other two (2) sites and the other ways are to get it from NGO, town shop, trader, and other farmers. There is no farmer among the interviewee who obtains any kind of seeds from the government. Regarding other seeds, popular source of obtaining is town/village shops, traders, other farmers and also the farmers are making it by themselves.
Table 3.4.1 Sources of Agricultural Inputs Procurement (no. of Answers) Agro-che
micals Fertilizer Seed
(Cereal) Seed
(Bean) Seed
(vegetables) Fuel for tractor
Government - - - - - -- NGO - - 4 - - - Town shop - - 3 3 6 - Village shop - - - - 1 - Trader - - 3 - 5 - Other farmers - - 3 3 4 - Farmers’ Organization - - - - - - Others - - - - - - Made by themselves - - 8 4 5 -
Total - - 21 10 21 - Source: IDMP TT (Socio-economic survey, 2015) * The questionnaire allowed multiple answers to the interviewee.
Table 3.4.2 shows the problems in obtaining farm inputs recognized by the interviewee. Problem in obtaining agro-chemicals and fertilizer is that those goods are not available when those are in need. Unaffordability of agro-chemicals and fertilizer due to the lack of finance or those high prices is not mentioned in the survey.
Regarding seeds, both of availability and affordability are cited as issues in obtaining. Particularly, many farmers feel high price of vegetable seeds is the problem for them.
31.4%
9.4%
28.7%
10.3%
20.9%
28.2%
5.2%
0.4%
1.9%
1.8%
3.0%
4.5%
10.0%
28.4%
12.4%
0.3%
10.9%
2.6%
20.4%
6.7%
16.6%
0.0% 20.0% 40.0% 60.0% 80.0% 100.0%
RejafEast
Wau
Jebellado
Maize
Sorghum
Cassava
Millet
CommonbeanG nut
Sesame
Vegetables/cash crops
Total95.0%
Total79.7%
Total79.4%

Annex 9-3: Pre-Feasibility Study of Rejaf East Irrigation Scheme
ANN9-3: RE-16
Table 3.4.2 Problems in Obtaining Farm Inputs (no. of Answers) Agro-che
micals Fertilizer Seed
(Cereal) Seed
(Bean) Seed
(vegetables) Fuel for tractor
Non availability - - 2 - 1 - Not available when needed 4 4 - - 4 - Available in small quantities only - - 4 - - - Expensive - - 2 3 7 - Transport problems - - 1 - 1 - Lack of finance - - 4 - 1 - Low quality - - 4 - - -
Total 4 4 17 3 14 - Source: IDMP TT (Socio-economic survey, 2015) * The questionnaire allowed multiple answers to the interviewee
(2) Agro chemicals use
There are not many farmers using agro-chemicals such as fertilizers or pesticide, however, the number of answer regarding use of agrochemicals are observed much more than other two (2) sites. Among the interviewee, one (1) farmer described chemical fertilizer use for maize In addition, there are some farmers applying agro-chemicals for vegetables, such as Okra, Jew’s mallow and green pepper. The cost of agro-chemicals for one (1) feddan ranges from about 150 to 800 SSP /feddan. As same as other two (2) sites, availability is the most noticeable issue in obtaining agro-chemicals in Rejaf East, according to the answers shown in Table 3.
(3) Labour
As same as other two (2) sites, necessary labour for farming operation is supplied mainly from family, but sometimes farmers work as group. In other word, they help each other without any physical payment. Required working days for major farming operation was surveyed in the socio-economic survey. Declared working days vary widely and tend to be longer than that is considered as normal, because farmers repeatedly practice same operation such as land preparation or seeding with trial and error. Farmers often failed to start or continue cultivation due to deficit of rainfall or unexpected delay of rainy season.
(4) Farm machinery/tools
Table 3.4.3 shows the inventory of farm machinery and tools the farmers own. As same as other two (2) sites, manual hand tools are popular among the interviewees, however, the number of farmers who own water pump is larger than other two (2) sites. In Rejaf East, there are farmers practicing irrigated farming along the river passing through the west side of the command area and they are using water pumps.
Regarding tractor, there is no interviewee who own tractor. However, some farmers hired tractor from the government and community. Those who received tractor rental service from the community are from Migiri and Mogoro communities. Both of the rental fees of the government and community range from 200 to 400 SSP / feddan. They plowed one (1) to four (4) feddan of their farmland with a tractor a day.
Table 3.4.3 Inventory of Owned Farm Machinery/Tools No. of HHs owning machineries
(no.) Average no. of machinery
(no./HH ) Gwuduge Migiri Mogoro Total Total
4-wheel tractor - - - - - Hand tractor - - - - - Hand sprayer - 2 2 4 1.5

RSS, MEDIWR, Water Sector, Irrigation Development Master Plan (IDMP)
ANN9-3: RE-17
No. of HHs owning machineries (no.)
Average no. of machinery (no./HH )
Gwuduge Migiri Mogoro Total Total Engine sprayer - - - - - Weeder - - - - - Seeder - - - - - Hoe 9 7 8 24 3.3 Shovel 2 2 6 10 1.2 Manual thresher - 1 2 3 2.3 Engine thresher - - - - - Oxen-drawn plow - - - - - Water pump(Oil) 1 5 1 7 1.3 Water pump (Electric) - - - - - Milling machine - - - - - Agro well - - - - - Mobile phone 7 6 7 20 1.3 Spade - - - - - Ax 2 - 4 6 1.8 Panga 2 - 4 6 2.8 Moloda 3 - 2 5 1.6 Gudum - - - - - Knife 4 - 3 7 2.9 Source: IDMP TT (Socio-economic survey, 2015)
(5) Livestock raising
Average numbers of livestock in the owners and average numbers of livestock in the total of samples are shown in the tables below. Cow and goats in Rejaf East are much less than those in Wau, so that we can clearly find weight of crop cultivation in Rejaf East is higher than that of Wau. In addition to those animals shown in the tables, a interviewee has 15 pigeons as livestock.
Table 3.4.4 Average Number of Livestock with the Owners Area Cow Bull/Ox Sheep Goats Pigs Chicken Ducks
Wau 14.9 3.5 8.9 13.2 - 12.3 - Jebel Lado 3.0 - 6.4 8.8 - 14.0 2.0 Rejaf East 2.0 - 11.3 5.9 1.0 8.4 10.0 3 areas 12.7 3.5 8.7 10.3 1.0 12.4 6.0 Source: IDMP TT (Socio-economic survey, 2015)
Table 3.4.5 Average Number of Livestock in the Samples Area Cow Bull/Ox Sheep Goats Pigs Chicken Ducks
Wau 8.0 1.1 5.2 9.2 - 8.0 - Jebel Lado 0.3 - 1.4 3.4 - 11.0 0.1 Rejaf East 0.1 - 1.3 2.0 0.0 2.3 0.4 3 areas 2.9 0.4 2.7 4.9 0.0 6.9 0.2 Source: IDMP TT (Socio-economic survey, 2015)
3.5 Productivity
(1) Crop yields
Table 3.5.1 shows average crop yield in Rejaf East. Yields in Rejaf East range from nearly equal to the average yields of three (3) sites to relatively lower than those averages, except some crops such as Tomato and Onion. Even though the farmers in Rejaf East seem to be relatively keen to utilize modern farming ways such as agro-chemical application, water pump irrigation and tractor use compared to the farmers in other two (2) sites, the productivities of crops are not so high.

Annex 9-3: Pre-Feasibility Study of Rejaf East Irrigation Scheme
ANN9-3: RE-18
Table 3.5.1 Crop Yields Crop Average
Yield (t/ha)
Minimum Yield (t/ha)
Maximum Yield (t/ha)
No. of sample
(Average yield of 3 sites) (t/ha)
Maize 0.7 0.1 1.9 17 0.7 Sorghum 0.9 0.4 1.8 7 1.2 Cassava 1.6 0.4 3.6 6 1.6 Common bean 0.3 0.2 0.5 3 0.6 Ground nut 0.8 0.4 1.6 9 1.5 Sesame 0.5 0.5 0.5 1 0.6 Vegetables Okra 1.1 0.2 5.6 14 1.8 Tomato 3.6 3.3 3.8 3 2.8 Egg plant 1.8 0.2 4.8 5 1.8 Pumpkin 0.8 0.8 0.8 1 0.8 Jew's mallow 2.2 0.4 4.4 19 3.1 Amaranthus 3.2 1.0 6.0 8 3.2 Cowpea 0.7 0.5 0.9 3 0.8 Onion 2.9 2.9 2.9 1 2.5 Green pepper 0.8 0.2 2.2 4 0.8
Source: IDMP TT (Socio-economic survey, 2015)
Table 3.5.2 shows the important causes of pre-harvest damage or loss in cereal and other crops cultivation which was mentioned by the farmers in Rejaf East. Damages and losses caused by animals, pest and disease are raised as dominant problems, while water shortage is recognized by fewer farmers.
Table 3.5.2 Important Causes of Pre-harvest Damage or Loss (no. of Answers) Cereal Other crop
Domestic animals 10 10 Birds 10 10 Other wild animals 10 10 Pest 10 9 Disease 10 6 Too much rain 7 5 Too little rain 9 5 Shortage of irrigation water 4 4 Others
Total 70 59 Source: IDMP TT (Socio-economic survey, 2015) *1 :The questionnaire allowed multiple answers to the interviewee *2 “Others” were not specified.
(2) Produces use
Table 3.5.3 shows crop product use in Rejaf East. Like other two (2) sites, Maize, Sorghum, Cassava, Common bean, Ground nut and sesame are principally consumed in household. Among the above crops, nearly half of Maize produce is sold at market. Comparing the other two (2) sites, the percentage of vegetables sold at market is high, for instance, those of Okra and Jew’s mallow, which are popular in the site, are more than 90 %. The farmers cultivate vegetables mostly for selling. Agro chemical use are practiced for vegetables more than for cereals, namely they “invest” more in vegetable cultivation, which implies vegetable cultivation is substantial mean of cash generation for the farmers in Rejaf East.

RSS, MEDIWR, Water Sector, Irrigation Development Master Plan (IDMP)
ANN9-3: RE-19
Table 3.5.3 Crop Produces Use Househ
old use
Sold to market
No. of sampl
es Self-co
nsumption
Stock for
seed
Loan payment
Land tenant
fee
Post-harvest
losses
Others
Maize 51.9% 42.2% 4.8% 2.7% - - 2.2% 48.1% 17 Sorghum 100.0% 72.2% 14.0% - - - 13.8% - 7 Cassava 99.0% 93.2% - - - 0.3% 5.5% 1.0% 6 Common bean 100.0% 70.0% 17.5% - - - 12.5% - 3 G nut 100.0% 69.1% 22.7% - - - 8.2% - 9 Sesame 100.0% 100.0% - - - - - - 1 Vegetables Okra 7.5% 92.5% 15 Tomato 1.9% 98.1% 3 Egg plant 12.2% 92.7% 3 Pumpkin 8.0% 92.0% 1 Jew's mallow 4.2% 96.0% 18 Amaranthus 1.3% 98.8% 8 Sukuma wiki 65.6% 34.4% 2 Cowpea 0.0% 100.0% 3 Onion 0.0% 100.0% 1 Green pepper 25.0% 75.0% 4 Source: IDMP TT (Socio-economic survey, 2015)
(3) Profitability
Table 3.5.4 shows net / gross cash income and production cost per ha in Rejaf East. Gross income values of crops are generally low compared to the average of three (3) sites due to low yield. Regarding the crops whose self-consumption rate is high, such as Sorghum, Cassava, Common bean and Ground nut results in negative net cash income. Regarding vegetables, even though most of all vegetable are sold, those net cash income values are low as a whole except some vegetables such as Tomato, whose yield is fair. Apart from low yield, high production cost of vegetable in Rejaf East leads to low profitability of vegetables.
Table 3.5.4 Net Cash Income, Gross Cash Income and Production Cost per ha Net cash income
(SSP/ha) Gross cash income (SSP/ha)
Production cost (SSP/ha)
No of samples
Rejaf East (Average of 3 sites)
Rejaf East (Average of 3 sites)
Rejaf East
(Average of 3 sites)
Maize 232 (791) 357 (917) 125 (125) 17 Sorghum -98 (959) 0 (1,058) 98 (99) 7 Cassava -203 (1,537) 238 (1,958) 441 (420) 6 Common bean -16 (1,064) 0 (1,139) 16 (75) 3 G nut -154 (1,713) 0 (1,955) 154 (242) 9 Sesame - (643) - (735) 0 (92) 1 Vegetables Okra 5,895 (10,058) 6,899 (10,661) 1,005 (603) 14 Tomato 14,000 (10,335) 14,571 (10,949) 571 (614) 3 Egg plant 9,253 (7,949) 9,833 (8,552) 580 (602) 5 Pumpkin 7,143 (7,143) 7,302 (7,302) 159 (159) 1 Jew's mallow 6,435 (9,557) 7,125 (10,112) 690 (555) 19 Amaranthus 6,577 (7,110) 7,198 (7,696) 621 (586) 8 Sukuma wiki 4,312 (4,312) 5,238 (5,238) 926 (926) 1 Cowpea 2,365 (1,838) 2,540 (2,000) 175 (162) 3 Onion -1,476 (2,508) 5,714 (5,079) 7,190 (2,571) 1 Green pepper 7,918 (7,918) 8,929 (8,929) 1,011 (1,011) 4
Source: IDMP TT (Socio-economic survey, 2015) *1 Each unit values of net cash income, gross cash income and production cost were calculated respectively excluding invalid/unavailable values, hence net cash income value is not equivalent to the reminder after deducting unit production cost from unit gross income.

Annex 9-3: Pre-Feasibility Study of Rejaf East Irrigation Scheme
ANN9-3: RE-20
*2 Breakdown of vegetable production cost are Seed, fertilizer and agro-chemical obtains. *3 No. of samples are only that of Rejaf East.
In addition to net cash income, the results of net income calculated are listed in the following table:
Table 3.5.5 Net Income Estimate Crop Yield Farm-gate
Price Gross Income Production
Cost Net Income
(t/ha) SSP/kg SSP/ha SSP/ha SSP/ha Maize 0.7 3.7 2,590 125 2,465 Sorghum 0.9 (4.2) 3,780 98 3,682 Cassava 1.6 5 8,000 441 7,559 Common bean 0.3 (4.6) 1,380 16 1,364 Groundnut 0.8 (3.9) 3,120 154 2,966 Sesame 0.5 (4.8) 2,400 0 2,400 Vegetables
Okra 1.1 9.1 10,010 1005 9,005 Tomato 3.6 4.3 15,480 571 14,909 Egg plant 1.8 14.5 26,100 580 25,520 Jew's mallow 2.2 4.5 9,900 690 9,210 Amaranthus 3.2 2.6 8,320 621 7,699 Cowpea 0.7 3.6 2,520 175 2,345 Green
pepper 0.8 13.8 11,040 1011 10,029
pumpkin 0.8 10 8,000 159 7,841 (Source: IDMP-TT, Socio-economy Survey, 2015) Note: Farm-gate price in ( ) is the average of other sites due to lack of data in this site
3.6 Selling of Produces
Table 3.6.1 shows the mode of transport the farmers use for selling their produce in Rejaf East. The most popular mode of transport in Rejaf East is Motorbike followed by bicycle and on foot. The farmers are selling their produce at the markets; Juba, Konyokonyo and other local markets, where are located averagely five (5) to six (6) km away from the communities.
Table 3.6.1 Mode of Transport Mode of transport No. of answers
Public bus 1 Tractor - Private car - Motorbike 18 Bicycle 4 On foot 4 No need -
Total 27 Source: IDMP TT (Socio-economic survey, 2015) * The questionnaire allowed multiple answers to the interviewee
Table 3.6.2 shows the problems in marketing of produce mentioned by the farmers in Rejaf East. The farmers particularly feel difficulty with low market prices, like the farmers in Jebel Lado. The second major problem is high cost of transportation.

RSS, MEDIWR, Water Sector, Irrigation Development Master Plan (IDMP)
ANN9-3: RE-21
Table 3.6.2 Problems in Marketing of Produces Problems in marketing of produce No. of answers
Low selling prices 17 Lack of transportation facilities 9 High cost of transportation 15 Lack of storage facilities 9 Quality problems of products 8 Lack of packing material 10
Total 68 Source: IDMP TT (Socio-economic survey, 2015) * The questionnaire allowed multiple answers to the interviewee

Annex 9-3: Pre-Feasibility Study of Rejaf East Irrigation Scheme
ANN9-3: RE-22
CHAPTER 4 DEVELOPMENT CONSTRAINTS AND POTENTIALS
Table 4.1.1 shows the problems in farming in Rejaf East. For the farmers in the site, damage by pests and disease are considered as crucial problem followed by water shortage and damage by wild animal. These problems seem to be prevailing generally on the ground.
Table 4.1.1 Problems in Farming Problems in farming No. of answers
Water shortage 20 Drought damage 13 Low yield of crops 12 Drainage problems 12 Damage by pests and diseases 24 Weed damage 15 Damage by wild animal 18 Difficulty in hiring animal/mechanical power 6 Labour shortage 8 Difficulty in obtaining seeds 5 Difficulty in purchasing agro-chemicals 12 Difficulty in purchasing fertilizer 10 Lack of farm roads 14 Damage by domestic animal 15 Shortage of selling opportunity 10 Lack of storage facilities 10 Problems related to loans 5 Others 11
Total 220 Source: IDMP TT (Socio-economic survey, 2015) * The questionnaire allowed multiple answers to the interviewee
Table 4.1.2 shows the items needed to be improved in farming. Corresponding to the result shown in Table 4.1.1, Prevention from pest and disease is the most common item and prevention from wild / domestic animals and weed damage is also raised by many farmers. In addition, they feel mechanization and improved seeds /farm road are important factor to practice farming in better way.
Table 4.1.2 Items Needed to be Improved Items needed to be improved No. of answers
To acquire irrigation water 13 To improve irrigation facilities 9 To drain out excess water 5 To prevent pests and diseases 23 To prevent damage by animal 22 To prevent weed damage 22 To improve supplying system of farm inputs 11 To improve farm road 22 To improve transportation of products 15 To introduce improved seed/plant varieties 20 To improve farming practices 19 To introduce mechanized farming 20 To strengthen agricultural extension services 12 To improve and expand agricultural credit 6 To construct drying yard 7 To construct processing facilities 10 To construct storage facilities 14 Others 10 Total 260
Source: IDMP TT (Socio-economic survey, 2015) * The questionnaire allowed multiple answers to the interviewee

RSS, MEDIWR, Water Sector, Irrigation Development Master Plan (IDMP)
ANN9-3: RE-23
Summarized findings/features in the present agricultural situation in Rejaf East
Cropping intensity was the highest (95%) among 3 sites, furthermore, land use share for vegetable growing was the highest, which was one fifth of the total.
Relatively more farmers are familiar to mechanized farming having an experience in hiring tractors or water pump. Some community organizations supply tractor rental service apart from that from the government.
There are farmers having an experience in irrigated farming along the river and their irrigated farmland share/area is the highest among 3 sites.
Yield is generally lower than other 2 sites. In addition, production cost tends to be higher resulting low profitability. A part of cause of high production cost seems to be that farmers cost much on agro-chemicals.