annual report - saam
TRANSCRIPT
Annual Report
CORPORATE IDENTIFICATION
SOCIEDAD MATRIZ SAAM S.A. (SM SAAM) is an open stock company established as a result of the division of Compañía Sud Americana de Vapores S.A. (CSAV) agreed at the Extraordinary Shareholders’ Meeting held on October 5, 2011, set forth in public deed dated October 14 of the same year, granted before the Valparaiso Notary Office of Mr. Luis Enrique Fischer Yavar. An abstract of said public deed was recorded on page 63,113 Nº 46,346 of the Santiago Register of Commerce of 2011 of the Santiago Real Estate Registrar’s Office and was published in the Official Gazette on October 25, 2011.
According to the terms agreed at the aforementioned Extraordinary Shareholders’ Meeting, the conclusion of CSAV’s division and consequent establishment of SM SAAM, was subject to fulfillment of the following conditions precedent: (i) subscription and payment of at least US$ 1.1 billion of CSAV’s capital increase agreed to by the Board; and (ii) consent provided by third parties which, due to contractual obligations with CSAV or its subsidiary, Sudamericana, Agencias Aéreas y Marítimas S.A., had to give their consent to the agreed division.
Subsequently, once verified compliance with the aforement ioned cond i t ions precedent, CSAV’s division and consequent establishment of SM SAAM was formalized and set forth in public deed on February 15, 2012, granted before the Santiago Notary Office of Mr. Eduardo Diez Morello and annotated on the margin of SM SAAM’s record of incorporation.
Sociedad Matriz SAAM S.A.R.U.T. 76.196.718-5Hendaya 60, 8th Floor, Las Condes, SantiagoOpen Stock Corporation SVS Registrat ion Number (Secur i t ies authority): 1091Ticket: SMSAAM
Corporate object The acquisition, purchase, sale and disposal of corporate stocks, shares or other rights in companies, bonds, debentures, commercial papers and other securities; to manage, transfer, use, collect their proceeds and profit from their sale and disposal.
Service to Shareholders DCV Registros S.A.Huérfanos 770, 22nd Floor, Santiago, ChileTelephone: (56-2) 2393-9003E-mail: [email protected]
Investor Relations Contact: Paula Raventos E-mail: [email protected]: Hendaya 60, 9th Floor, Las CondesTelephone: (56-2) 2731-8215Fax: (56-2) 2731-8250E-mail: [email protected]: www.smsaam.com
Stock Exchanges Bolsa de Comercio de Santiago Bolsa de Comercio de Valparaíso Bolsa Electrónica de Chile
External Auditors KPMG Auditores Consultores Ltda.
CONTENTSLetter from the Chairman 2
Profile of SAAM 4
History 8
Results 10
Port Terminals 13
Tugboats 29
Logistics 39
Risk Factors 48
Investments 49
Board of Directors 50
Administration and Personnel 54
Shareholders and Dividends 58
Subsidiaries and Affiliates 60
Summarized Comments and Proposals fromShareholders and Directors’ Committee 88
Significant or Material Information 89
Financial Statements 90
LETTER FROMTHE CHAIRMANIt is very gratifying to finish the year with a positive balance, considering that our company devoted its best efforts to provide services to a sector showing a relatively low rhythm of growth and in a relevant segment of clients that had been facing a hard situation for years. This is the case of SM SAAM, a company in the line of business of providing services such as port terminals, tugboats, and logistics, which, in 2014, achieved a good performance despite the moderate expansion of regional foreign trade and the extended adjustment period that the world shipping industry had to surmount. During this exercise, we were able to maintain an agile and stable cruising speed and, furthermore, to take important steps to face from a better position the challenges that lie ahead.
Companies are the individuals who form them and, because of this, I would like to highlight among the main milestones of the period, how we strengthened our team and reorganized our corporate structure for a more efficient reaction to all challenges. The creation of Management posts for Infrastructure and Real Estate, Shared Services and Corporate Affairs, together with management renovations in the areas of Logistics, Controller and Systems and Communications, or the creation of the areas of Operational Efficiency and Projects in the Port Terminals Division, evidence this process.
At the end of this new year, we may state that we continue being the major port operator in South America, the fourth global operator in the tugboats market and one of the services companies for Foreign Trade with the greatest regional scope, with over ten thousand workers, distributed along 13 countries in America. In spite of the moderate rhythm of growth of the region, we were able to increase our sales above US$775 million, 7% more than in 2013, and reach an EBITDA of US$185 million, 12.1% greater than in the previous exercise. Albeit our earnings decreased by 17% (totaling US$61 million), it should be noted that the variation is explained by non-recurring effects that, comparatively, favored the 2013 earnings.
However, the greatest milestone in terms of growth took place in July, with the onset of our alliance with SMIT (a Royal Boskalis subsidiary), commencing the joint operation of our tugboat services in the markets of Brazil, Mexico, Panama and Canada. This operation gave birth to SAAM SMIT Towage Brasil and SAAM SMIT Towage México, joint ventures whose aggregate revenues were over US$250 million, with a fleet of 100 tugboats, distributed in more than 30 Port Terminals, including three of the five most significant ports in America: Santos in Brazil and Colon, Balboa in Panama, Altamira and Veracruz in Mexico. Among other benefits, this operation allowed
us to capture the first synergies from the merger of operations of both companies in Brazil and to consolidate us as the second operator in such a significant market.
This alliance confirmed the soundness of our decision in adopting a growth strategy for this business segment by expanding hand in hand with globally leading companies, as in this case. In addition to the economic synergies, there are many more that we expect to generate from this joint venture that, in addition to uniting leaderships in complementary markets, makes available to both parties the best practices and operating experiences of two companies that for years have been in positions of leadership in their respective areas of influence. I would also like to highlight the progress achieved in our investment plan, which is linked to the strategic plan defined for the coming years. In 2014, we totalized US$122 million for new cranes, machinery, facilities and the extension of four of our port terminals (Iquique, Antofagasta, San Antonio, San Vicente and Guayaquil), to renovate our fleet of tugboats and to add new infrastructure for logistics. This set of initiatives will allow us to increase the efficiency of our service to the increasingly larger ships that are reaching American coasts, and to offer a comprehensive service to our import and export clients. Analyzing our performance by business areas, we may conclude that in the Port Terminals Division we closed the year with very good results, particularly if we consider that it was even possible to revert the impacts resulting from the port workers’ strike lasting over 20 days in January in Chile’s port terminals, achieving sales of US$234 million and an EBITDA of US$63 million, generating a growth of 5%, both with respect to 2013.
STI consolidated its leadership, scoring two milestones for the industry: receiving Gustav Maersk, the largest ship to have ever docked in a Chilean port, and, for the third consecutive year, being the only domestic terminal to exceed the mark of over one million TEUs transferred in one year. In TPG –our terminal in Ecuador- and SVTI-in southern Chile- we entered into new service contracts for over 62,000 box / year. ITI became a mainstay for the Tarapacá Region loads, following the April earthquake that destroyed the state-owned port. Lastly, we closed the year with the extension of the concession of Antofagasta Terminal Internacional, in Chile’s mining capital city, until 2033.
In the Tugboats Division, in addition to the aforementioned alliance with Royal Boskalis, worthy of notice were the good performance
2
2014 Annual Report
of operations in Panama and Mexico, the renewal of important contracts in Honduras (Puerto Cortes) and Brazil, as well as the renovation process of our vessels, aimed at maintaining our competitive advantages and fulfilling the standards demanded by our customers. This business area achieved a growth of 20%, with sales of US$284 million, constituting 47% of the EBITDA generated by SM SAAM.
In the Logistics Division, part of our efforts were aimed at maximizing the efficiency of our services to shipping companies, in order to compensate the lower income resulting from the pressure exerted by the actors of this stricken sector on our prices and margins. However, the highest stake has been placed in the search for new and larger customers for contract logistics our new value proposal that incorporates maritime, land and air services with greater value added throughout the whole logistics chain required by importers and exporters.
The area is currently in the midst of a transition, process which despite not having been enough to stop the drop in sales and EBITDA of 4% and 9% respectively, is showing signs of going in the right direction and starting to overcome its traditional dependence on the shipping industry. Evidence of the latter is what happened in Logístics Chile, market where the initiatives of the services with greater value added in contract logistics have taken place, and an increase in sales and EBITDA was recorded in 2014.
We aim at further strengthening our leadership through the excellence of our services and by developing a policy of social responsibility with an emphasis on sustainable operations in each of our divisions, a special commitment to the environment, our workers and their safety, as well as the communities in which we are immersed.
Our future strategy is to continue growing, consolidating our leadership in the three business segments, and looking for new opportunities in the region; delivering to our customers efficiency, productivity and constant innovation, under the seal of operational excellence that has characterized SM SAAM during more than 50 years of history.
I want to thank the whole team that makes up this great company who, with professionalism and commitment, contributed to give a turn for the better to a complex year after a hard beginning.
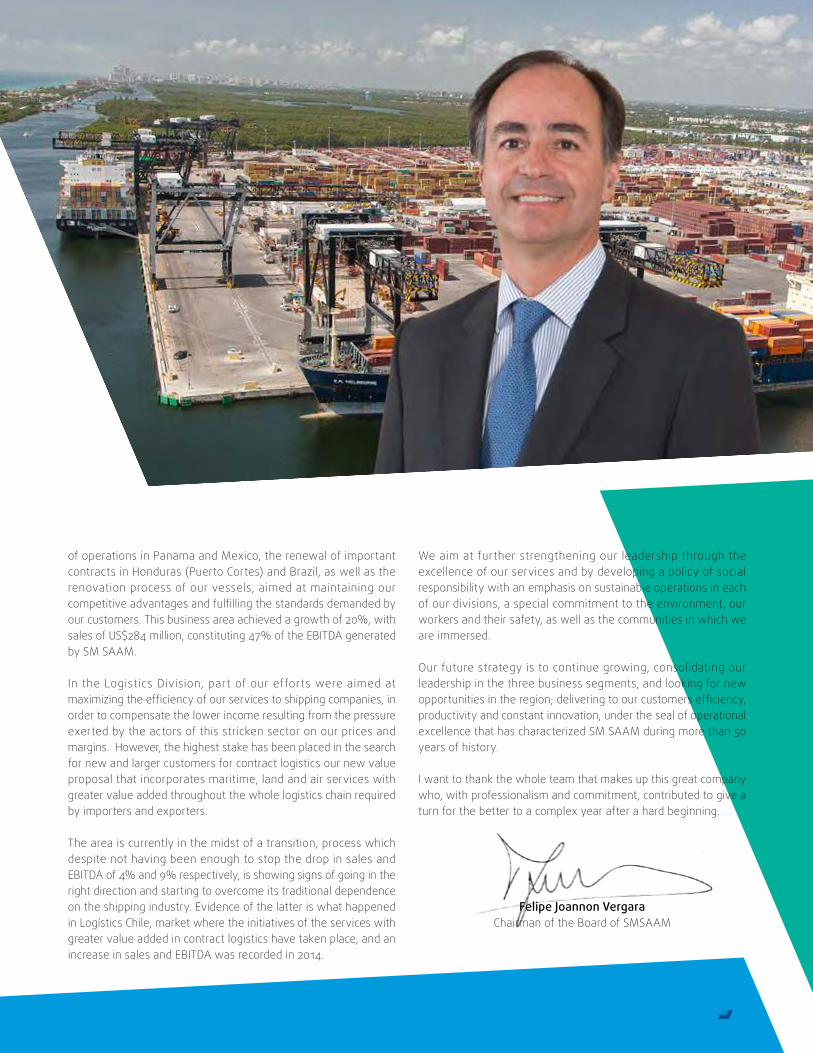
Felipe Joannon Vergara Chairman of the Board of SMSAAM
3
BUSINESS AREAS
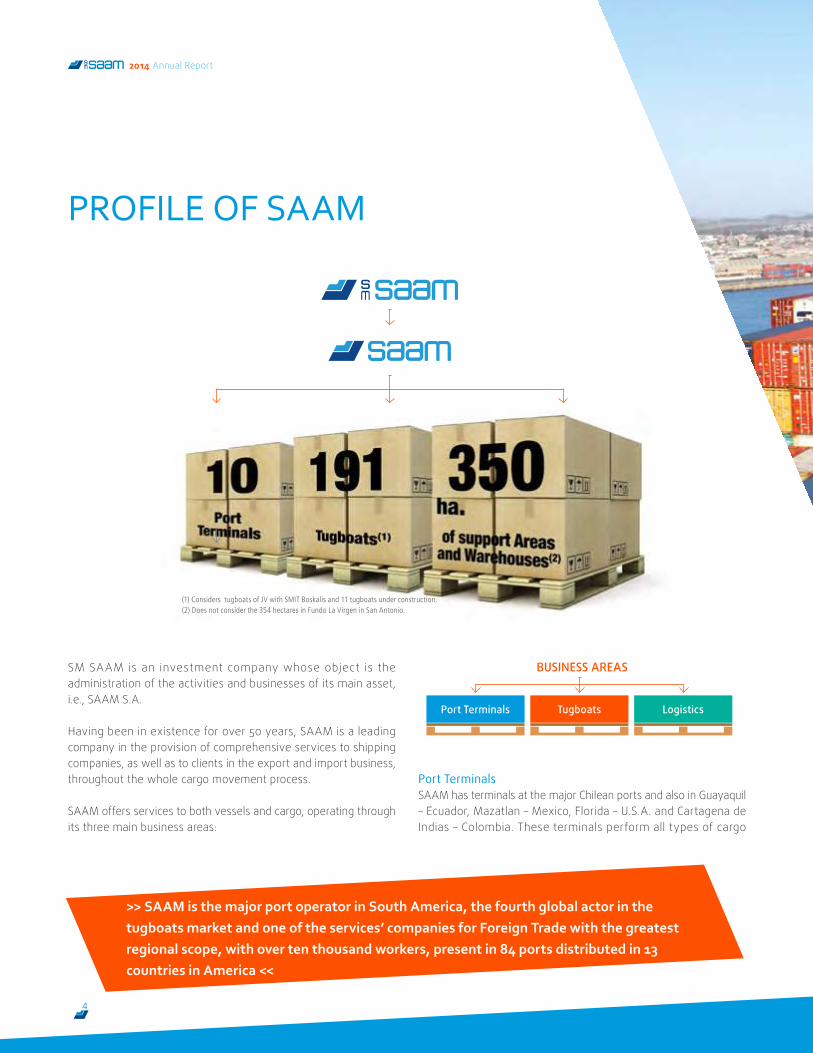
Port TerminalsSAAM has terminals at the major Chilean ports and also in Guayaquil – Ecuador, Mazatlan – Mexico, Florida – U.S.A. and Cartagena de Indias – Colombia. These terminals perform all types of cargo
SM SAAM is an investment company whose object is the administration of the activities and businesses of its main asset, i.e., SAAM S.A.
Having been in existence for over 50 years, SAAM is a leading company in the provision of comprehensive services to shipping companies, as well as to clients in the export and import business, throughout the whole cargo movement process. SAAM offers services to both vessels and cargo, operating through its three main business areas:
PROFILE OF SAAM
>> SAAM is the major port operator in South America, the fourth global actor in the tugboats market and one of the services’ companies for Foreign Trade with the greatest regional scope, with over ten thousand workers, present in 84 ports distributed in 13 countries in America <<
(1) Considers tugboats of JV with SMIT Boskalis and 11 tugboats under construction.(2) Does not consider the 354 hectares in Fundo La Virgen in San Antonio.
LogisticsPort Terminals Tugboats
4
2014 Annual Report
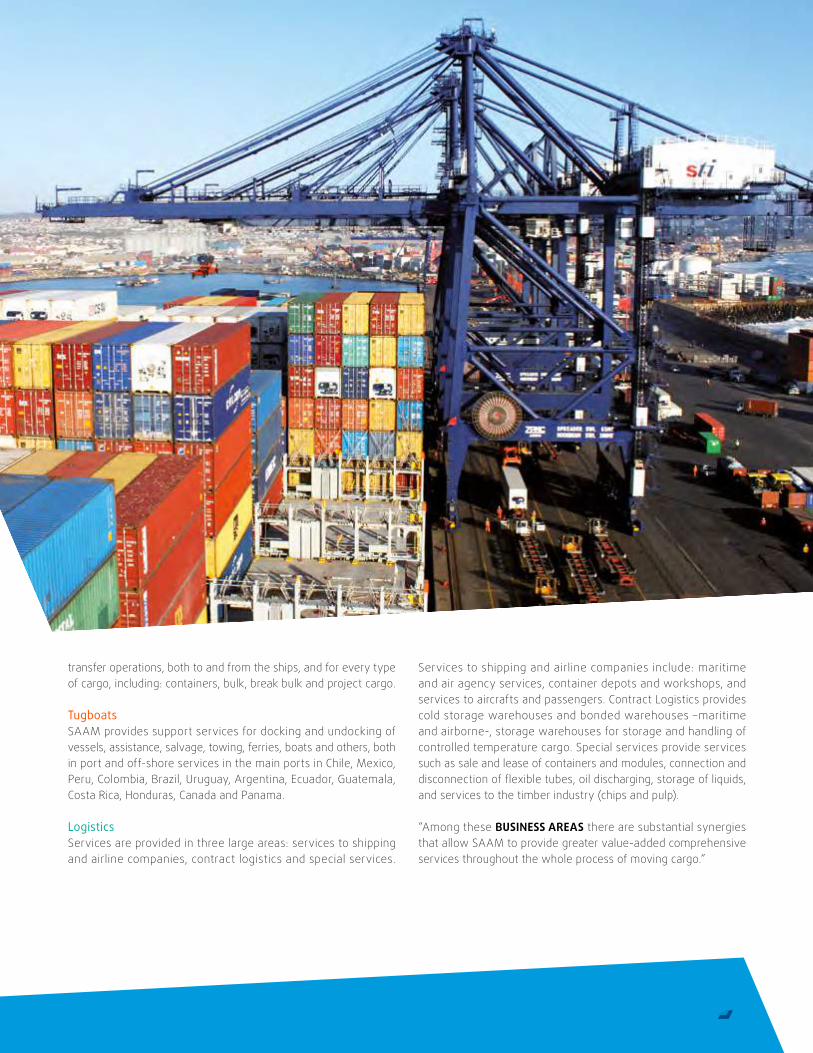
transfer operations, both to and from the ships, and for every type of cargo, including: containers, bulk, break bulk and project cargo.
TugboatsSAAM provides support services for docking and undocking of vessels, assistance, salvage, towing, ferries, boats and others, both in port and off-shore services in the main ports in Chile, Mexico, Peru, Colombia, Brazil, Uruguay, Argentina, Ecuador, Guatemala, Costa Rica, Honduras, Canada and Panama.
LogisticsServices are provided in three large areas: services to shipping and airline companies, contract logistics and special services.
Services to shipping and airline companies include: maritime and air agency services, container depots and workshops, and services to aircrafts and passengers. Contract Logistics provides cold storage warehouses and bonded warehouses –maritime and airborne-, storage warehouses for storage and handling of controlled temperature cargo. Special services provide services such as sale and lease of containers and modules, connection and disconnection of flexible tubes, oil discharging, storage of liquids, and services to the timber industry (chips and pulp).
“Among these BUSINESS AREAS there are substantial synergies that allow SAAM to provide greater value-added comprehensive services throughout the whole process of moving cargo.”
5
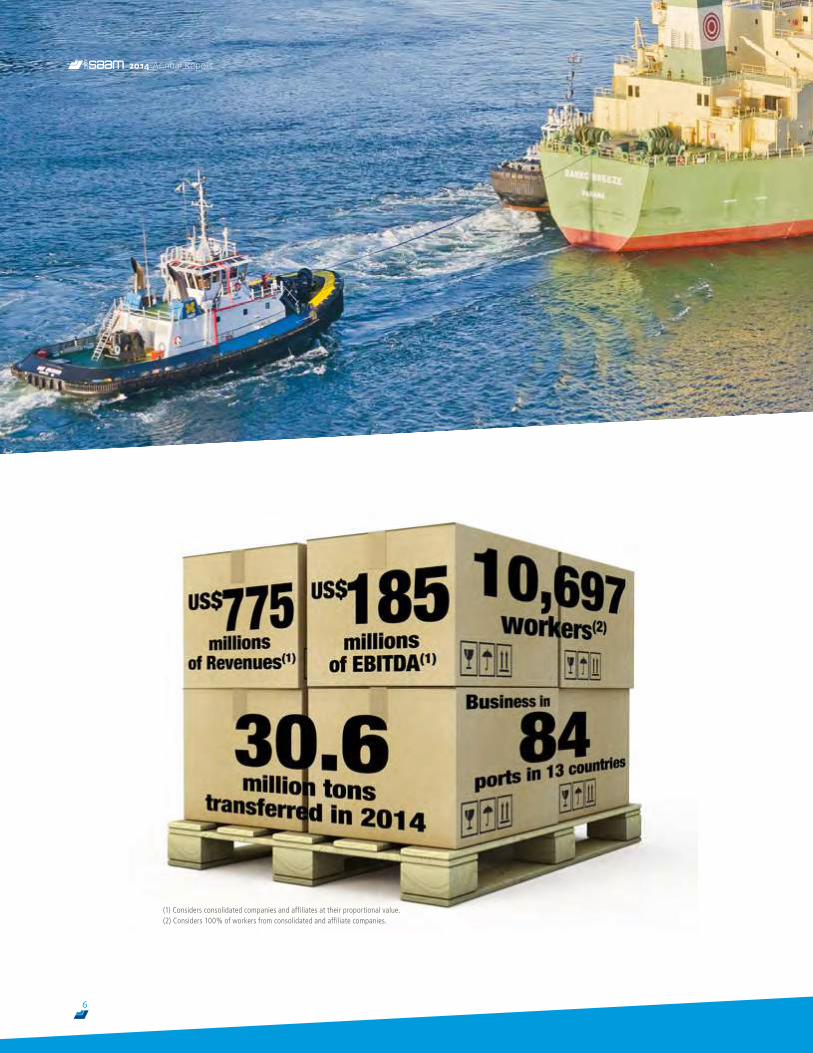
(1) Considers consolidated companies and affiliates at their proportional value.(2) Considers 100% of workers from consolidated and affiliate companies.
6
2014 Annual Report
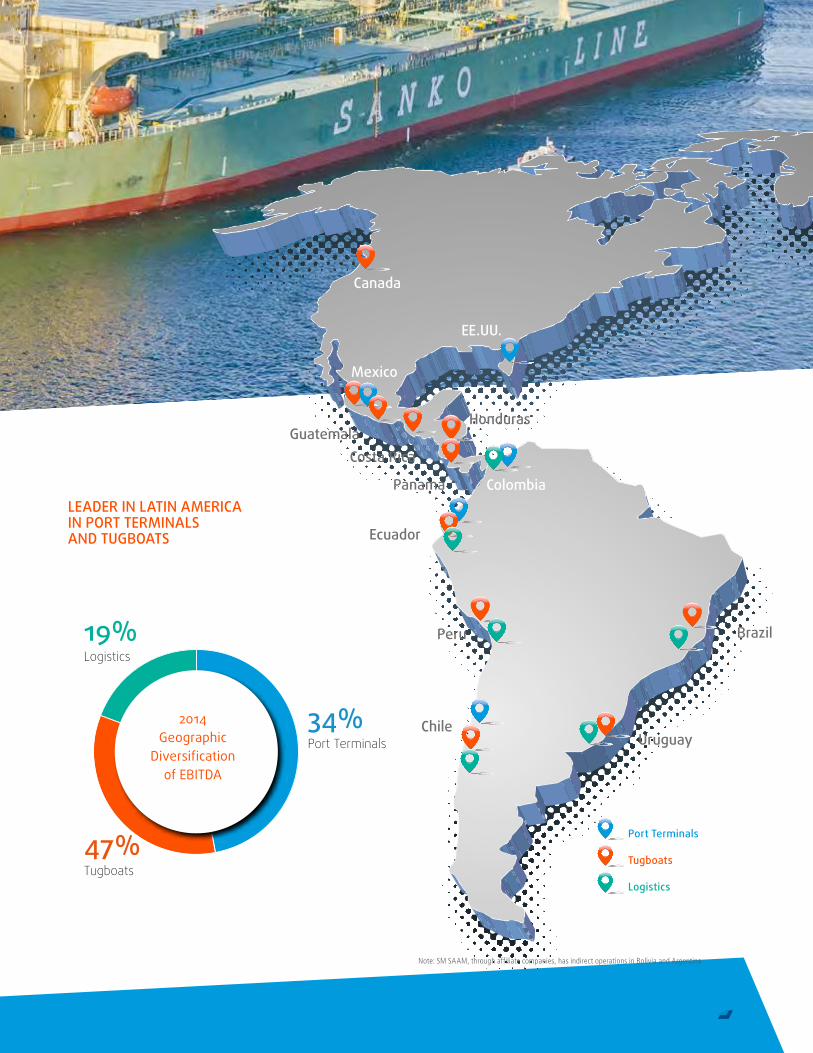
Canada
EE.UU.
Mexico
GuatemalaCosta Rica
Panama
Honduras
Chile
Brazil
Uruguay
Peru
Ecuador
Colombia
Port Terminals
Tugboats
Logistics
47%
Logistics
Port Terminals
Tugboats
34%
19%
2014Geographic
Diversification of EBITDA
LEADER IN LATIN AMERICA IN PORT TERMINALS AND TUGBOATS
Note: SM SAAM, through affiliate companies, has indirect operations in Bolivia and Argentina
7
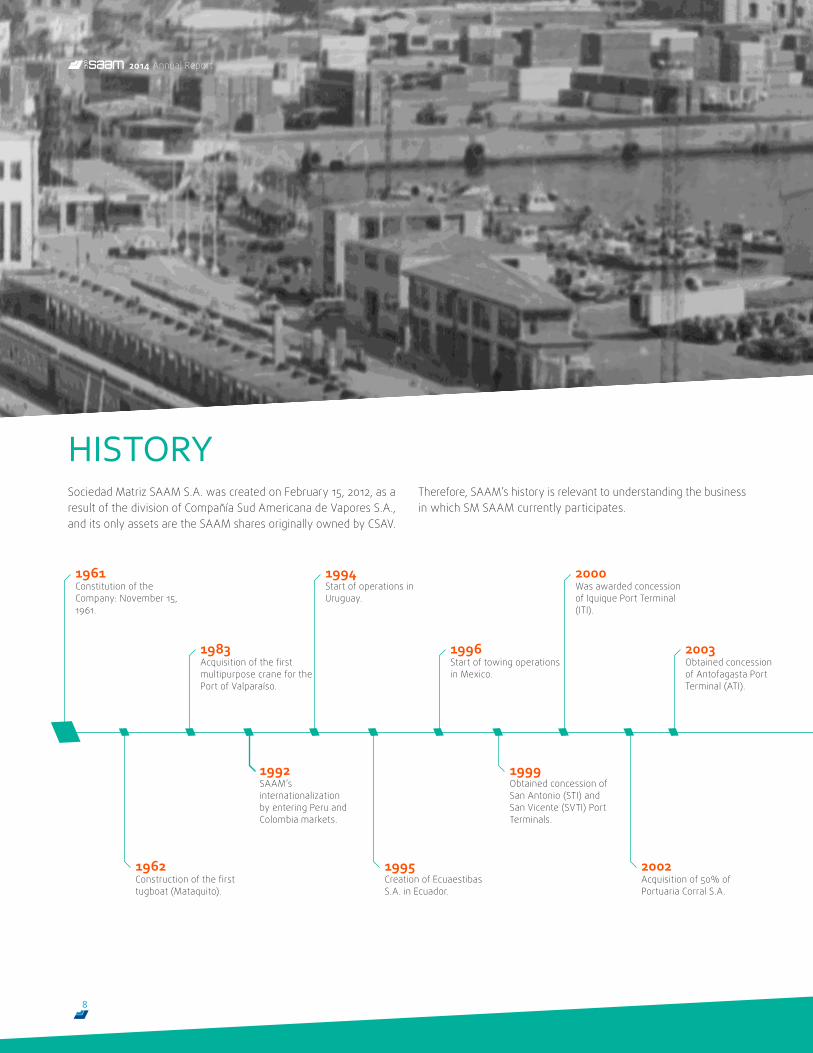
1961 Constitution of the Company: November 15, 1961.
1962 Construction of the first tugboat (Mataquito).
1983 Acquisition of the first multipurpose crane for the Port of Valparaíso.
1994 Start of operations in Uruguay.
1995 Creation of Ecuaestibas S.A. in Ecuador.
1996 Start of towing operations in Mexico.
1999 Obtained concession of San Antonio (STI) and San Vicente (SVTI) Port Terminals.
2000 Was awarded concession of Iquique Port Terminal (ITI).
2002 Acquisition of 50% of Portuaria Corral S.A.
2003 Obtained concession of Antofagasta Port Terminal (ATI).
1992 SAAM’s internationalization by entering Peru and Colombia markets.
Sociedad Matriz SAAM S.A. was created on February 15, 2012, as a result of the division of Compañía Sud Americana de Vapores S.A., and its only assets are the SAAM shares originally owned by CSAV.
Therefore, SAAM’s history is relevant to understanding the business in which SM SAAM currently participates.
HISTORY
8
2014 Annual Report
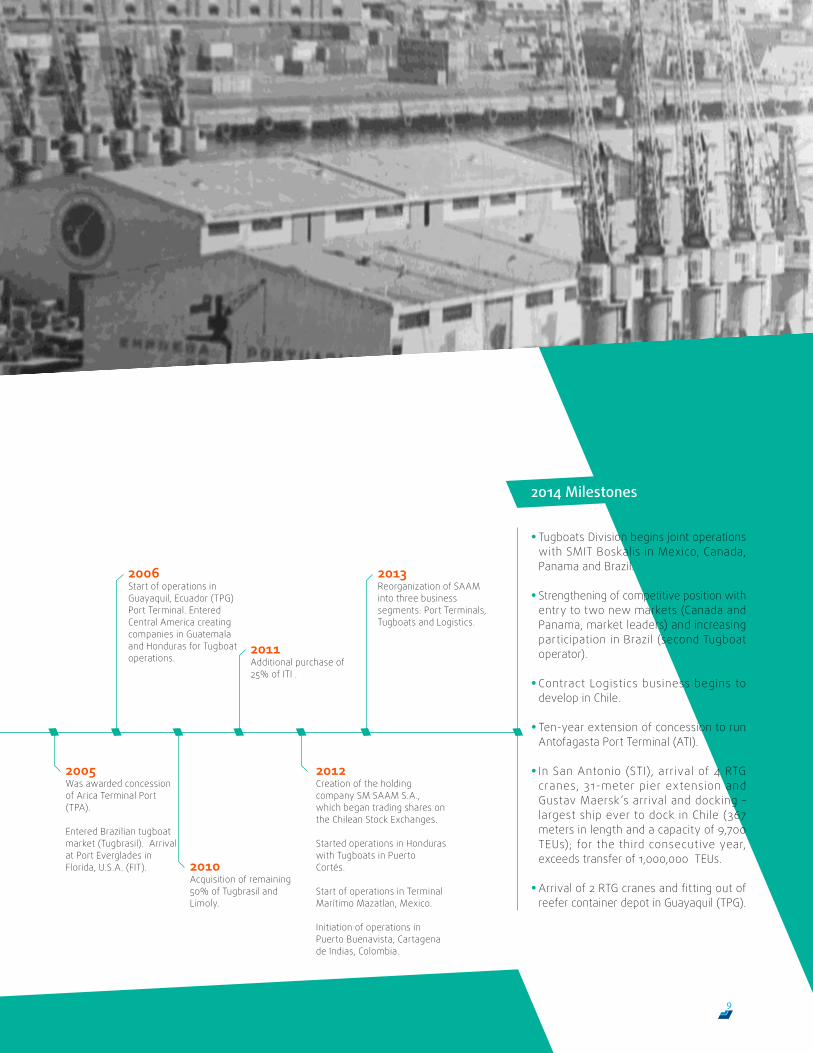
2013 Reorganization of SAAM into three business segments: Port Terminals, Tugboats and Logistics.
2005 Was awarded concession of Arica Terminal Port (TPA).
Entered Brazilian tugboat market (Tugbrasil). Arrival at Port Everglades in Florida, U.S.A. (FIT).
2006 Start of operations in Guayaquil, Ecuador (TPG) Port Terminal. Entered Central America creating companies in Guatemala and Honduras for Tugboat operations.
2011 Additional purchase of 25% of ITI .
2012 Creation of the holding company SM SAAM S.A., which began trading shares on the Chilean Stock Exchanges.
Started operations in Honduras with Tugboats in Puerto Cortés. Start of operations in Terminal Marítimo Mazatlan, Mexico.
Initiation of operations in Puerto Buenavista, Cartagena de Indias, Colombia.
2010 Acquisition of remaining 50% of Tugbrasil and Limoly.
2014 Milestones
• Tugboats Division begins joint operations with SMIT Boskalis in Mexico, Canada, Panama and Brazil.
• Strengthening of competitive position with entry to two new markets (Canada and Panama, market leaders) and increasing participation in Brazil (second Tugboat operator).
• Contract Logistics business begins to develop in Chile.
• Ten-year extension of concession to run Antofagasta Port Terminal (ATI).
• In San Antonio (STI), arrival of 4 RTG cranes, 31-meter pier extension and Gustav Maersk’s arrival and docking – largest ship ever to dock in Chile (367 meters in length and a capacity of 9,700 TEUs); for the third consecutive year, exceeds transfer of 1,000,000 TEUs.
• Arrival of 2 RTG cranes and fitting out of reefer container depot in Guayaquil (TPG).
9
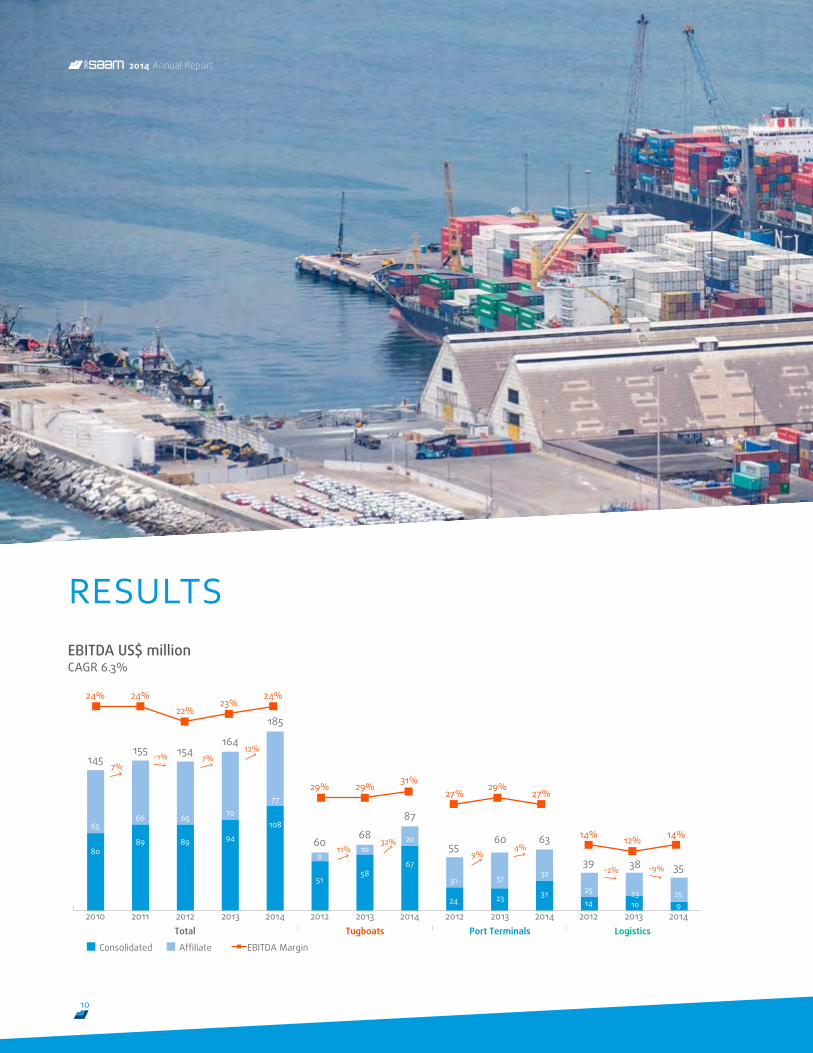
RESULTSEBITDA US$ million CAGR 6.3%
2010 2011 2012Total
Consolidated
Tugboats Port Terminals Logistics 2013 2014 2012 2013 2014 2012 2013 2014 2012 2013 2014
Affiliate EBITDA Margin
63
145155 154
164
185
6068
87
5560
39 38 3532
6566 65 70
77
910
20
31 3725 23 2531
8089 89 94
108
5158
67
24 23 14 10 9
12%
32%11% 9%
4%
-2% -9%
7%7%
-1%
24%
29% 29%31%
27%29%
27%
14% 12% 14%
24%23%
24%22%
10
2014 Annual Report
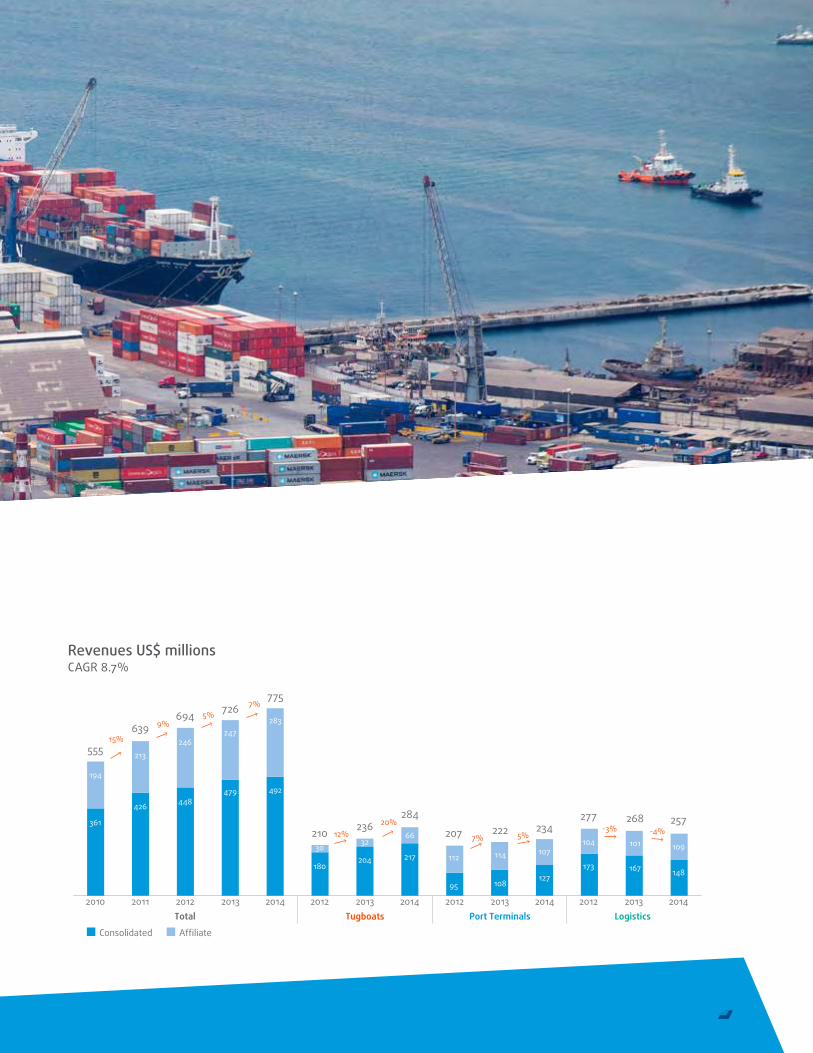
Revenues US$ millionsCAGR 8.7%
15%
9%5%
7%
12%20%
7% 5%-3% -4%
2010 2011 2012Total
Consolidated
Tugboats Port Terminals Logistics 2013 2014 2012 2013 2014 2012 2013 2014 2012 2013 2014
Affiliate
234
555
639694 726
775
210 236284
207 222277 268 257
107
194
213246
247283
3032
66
112 114104 101 109
127
361
426 448479 492
180204 217
95 108
173 167 148
11
2014 Annual Report
Port Terminals
Efficiency
Leader in Latin America.Present in 10 Ports.
14
2014 Annual Report
PORT TERMINALS
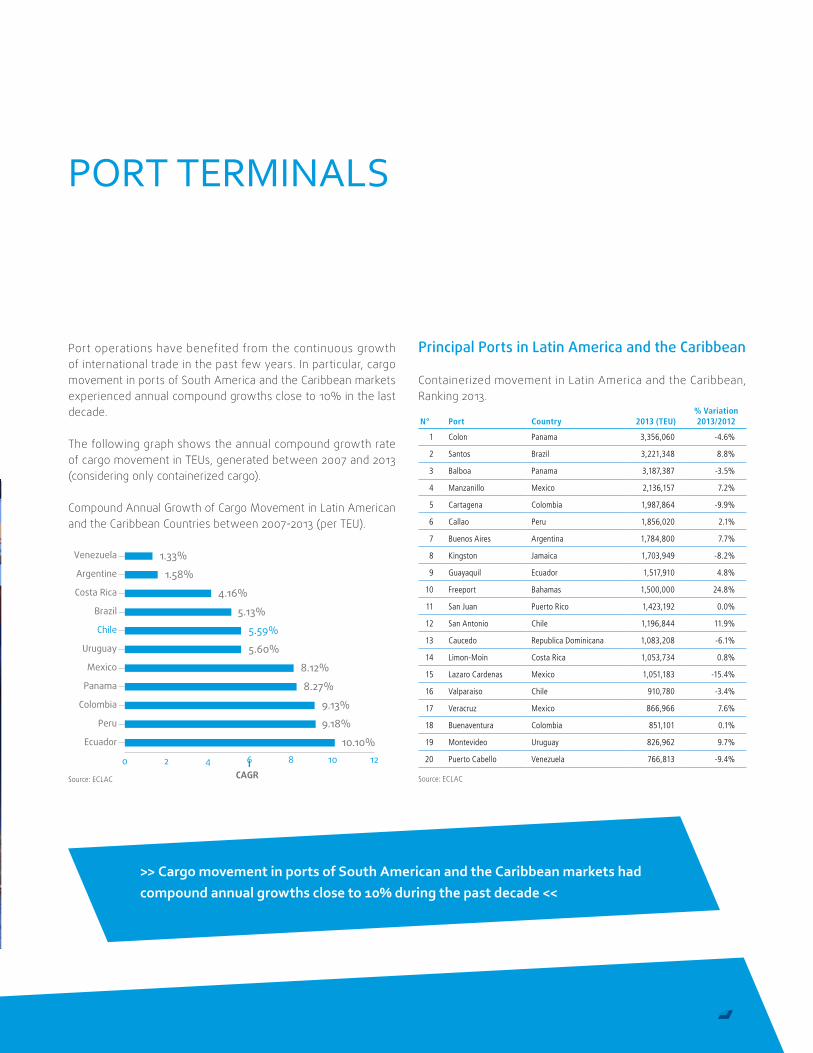
Port operations have benefited from the continuous growth of international trade in the past few years. In particular, cargo movement in ports of South America and the Caribbean markets experienced annual compound growths close to 10% in the last decade.
The following graph shows the annual compound growth rate of cargo movement in TEUs, generated between 2007 and 2013 (considering only containerized cargo).
Compound Annual Growth of Cargo Movement in Latin American and the Caribbean Countries between 2007-2013 (per TEU).
0 2 4 6 8 10 12CAGR
Venezuela
Argentine
Costa Rica
Brazil
Chile
Uruguay
Mexico
Panama
Colombia
Peru
Ecuador
1.33%
1.58%
4.16%
5.13%
5.59%
5.60%
8.12%
8.27%
9.13%
9.18%
10.10%
Source: ECLAC
Principal Ports in Latin America and the Caribbean
Containerized movement in Latin America and the Caribbean, Ranking 2013.
N° Port Country 2013 (TEU)% Variation2013/2012
1 Colon Panama 3,356,060 -4.6%
2 Santos Brazil 3,221,348 8.8%
3 Balboa Panama 3,187,387 -3.5%
4 Manzanillo Mexico 2,136,157 7.2%
5 Cartagena Colombia 1,987,864 -9.9%
6 Callao Peru 1,856,020 2.1%
7 Buenos Aires Argentina 1,784,800 7.7%
8 Kingston Jamaica 1,703,949 -8.2%
9 Guayaquil Ecuador 1,517,910 4.8%
10 Freeport Bahamas 1,500,000 24.8%
11 San Juan Puerto Rico 1,423,192 0.0%
12 San Antonio Chile 1,196,844 11.9%
13 Caucedo Republica Dominicana 1,083,208 -6.1%
14 Limon-Moin Costa Rica 1,053,734 0.8%
15 Lazaro Cardenas Mexico 1,051,183 -15.4%
16 Valparaiso Chile 910,780 -3.4%
17 Veracruz Mexico 866,966 7.6%
18 Buenaventura Colombia 851,101 0.1%
19 Montevideo Uruguay 826,962 9.7%
20 Puerto Cabello Venezuela 766,813 -9.4%
Source: ECLAC
>> Cargo movement in ports of South American and the Caribbean markets had compound annual growths close to 10% during the past decade <<
15
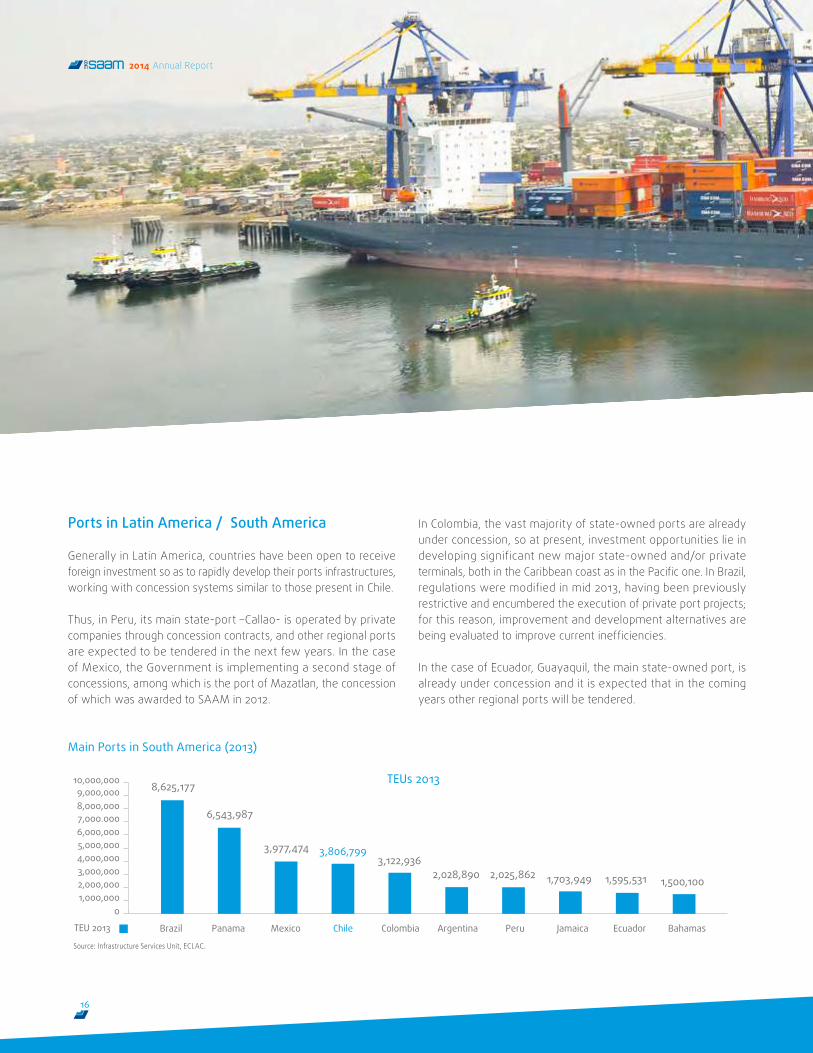
Ports in Latin America / South America
Generally in Latin America, countries have been open to receive foreign investment so as to rapidly develop their ports infrastructures, working with concession systems similar to those present in Chile.
Thus, in Peru, its main state-port –Callao- is operated by private companies through concession contracts, and other regional ports are expected to be tendered in the next few years. In the case of Mexico, the Government is implementing a second stage of concessions, among which is the port of Mazatlan, the concession of which was awarded to SAAM in 2012.
In Colombia, the vast majority of state-owned ports are already under concession, so at present, investment opportunities lie in developing significant new major state-owned and/or private terminals, both in the Caribbean coast as in the Pacific one. In Brazil, regulations were modified in mid 2013, having been previously restrictive and encumbered the execution of private port projects; for this reason, improvement and development alternatives are being evaluated to improve current inefficiencies.
In the case of Ecuador, Guayaquil, the main state-owned port, is already under concession and it is expected that in the coming years other regional ports will be tendered.
Main Ports in South America (2013)
Brazil
8,625,177
Panama
6,543,987
Mexico
3,977,474
Chile
3,806,799
Colombia
3,122,936
Argentina
2,028,890
Peru
2,025,862
Jamaica
1,703,949
Ecuador
1,595,531
Bahamas
1,500,100
0
2,000,000
4,000,000
6,000,000
8,000,000
10,000,0009,000,000
7,000.000
5,000,000
3,000,000
1,000,000
TEU 2013
TEUs 2013
Source: Infrastructure Services Unit, ECLAC.
16
2014 Annual Report
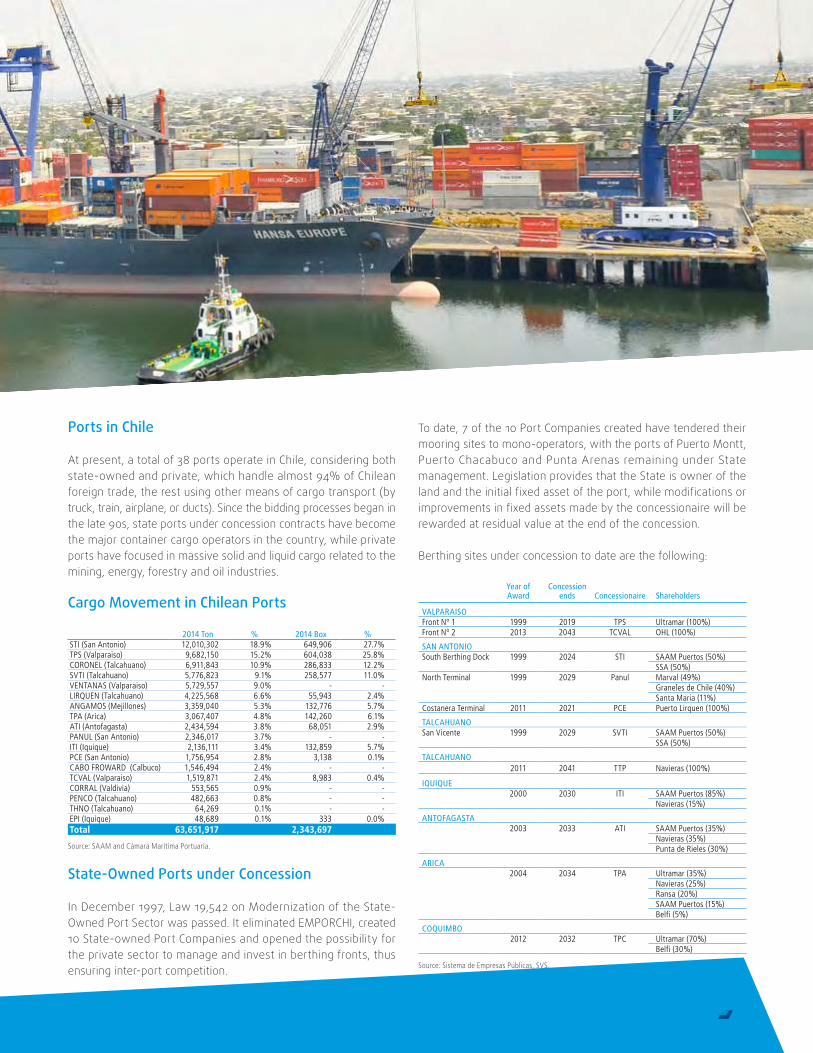
Ports in Chile
At present, a total of 38 ports operate in Chile, considering both state-owned and private, which handle almost 94% of Chilean foreign trade, the rest using other means of cargo transport (by truck, train, airplane, or ducts). Since the bidding processes began in the late 90s, state ports under concession contracts have become the major container cargo operators in the country, while private ports have focused in massive solid and liquid cargo related to the mining, energy, forestry and oil industries.
Cargo Movement in Chilean Ports
2014 Ton % 2014 Box %STI (San Antonio) 12,010,302 18.9% 649,906 27.7%TPS (Valparaiso) 9,682,150 15.2% 604,038 25.8%CORONEL (Talcahuano) 6,911,843 10.9% 286,833 12.2%SVTI (Talcahuano) 5,776,823 9.1% 258,577 11.0%VENTANAS (Valparaiso) 5,729,557 9.0% - -LIRQUEN (Talcahuano) 4,225,568 6.6% 55,943 2.4%ANGAMOS (Mejillones) 3,359,040 5.3% 132,776 5.7%TPA (Arica) 3,067,407 4.8% 142,260 6.1%ATI (Antofagasta) 2,434,594 3.8% 68,051 2.9%PANUL (San Antonio) 2,346,017 3.7% - -ITI (Iquique) 2,136,111 3.4% 132,859 5.7%PCE (San Antonio) 1,756,954 2.8% 3,138 0.1%CABO FROWARD (Calbuco) 1,546,494 2.4% - -TCVAL (Valparaiso) 1,519,871 2.4% 8,983 0.4%CORRAL (Valdivia) 553,565 0.9% - -PENCO (Talcahuano) 482,663 0.8% - -THNO (Talcahuano) 64,269 0.1% - -EPI (Iquique) 48,689 0.1% 333 0.0%Total 63,651,917 2,343,697
Source: SAAM and Cámara Marítima Portuaria.
State-Owned Ports under Concession
In December 1997, Law 19,542 on Modernization of the State-Owned Port Sector was passed. It eliminated EMPORCHI, created 10 State-owned Port Companies and opened the possibility for the private sector to manage and invest in berthing fronts, thus ensuring inter-port competition.
To date, 7 of the 10 Port Companies created have tendered their mooring sites to mono-operators, with the ports of Puerto Montt, Puerto Chacabuco and Punta Arenas remaining under State management. Legislation provides that the State is owner of the land and the initial fixed asset of the port, while modifications or improvements in fixed assets made by the concessionaire will be rewarded at residual value at the end of the concession.
Berthing sites under concession to date are the following:
Year of Award
Concession ends Concessionaire Shareholders
VALPARAISO Front Nº 1 1999 2019 TPS Ultramar (100%)Front Nº 2 2013 2043 TCVAL OHL (100%)
SAN ANTONIOSouth Berthing Dock 1999 2024 STI SAAM Puertos (50%)
SSA (50%)North Terminal 1999 2029 Panul Marval (49%)
Graneles de Chile (40%)Santa Maria (11%)
Costanera Terminal 2011 2021 PCE Puerto Lirquen (100%)
TALCAHUANOSan Vicente 1999 2029 SVTI SAAM Puertos (50%)
SSA (50%)
TALCAHUANO2011 2041 TTP Navieras (100%)
IQUIQUE2000 2030 ITI SAAM Puertos (85%)
Navieras (15%)
ANTOFAGASTA2003 2033 ATI SAAM Puertos (35%)
Navieras (35%)Punta de Rieles (30%)
ARICA2004 2034 TPA Ultramar (35%)
Navieras (25%)Ransa (20%)SAAM Puertos (15%)Belfi (5%)
COQUIMBO2012 2032 TPC Ultramar (70%)
Belfi (30%)
Source: Sistema de Empresas Públicas, SVS.
17
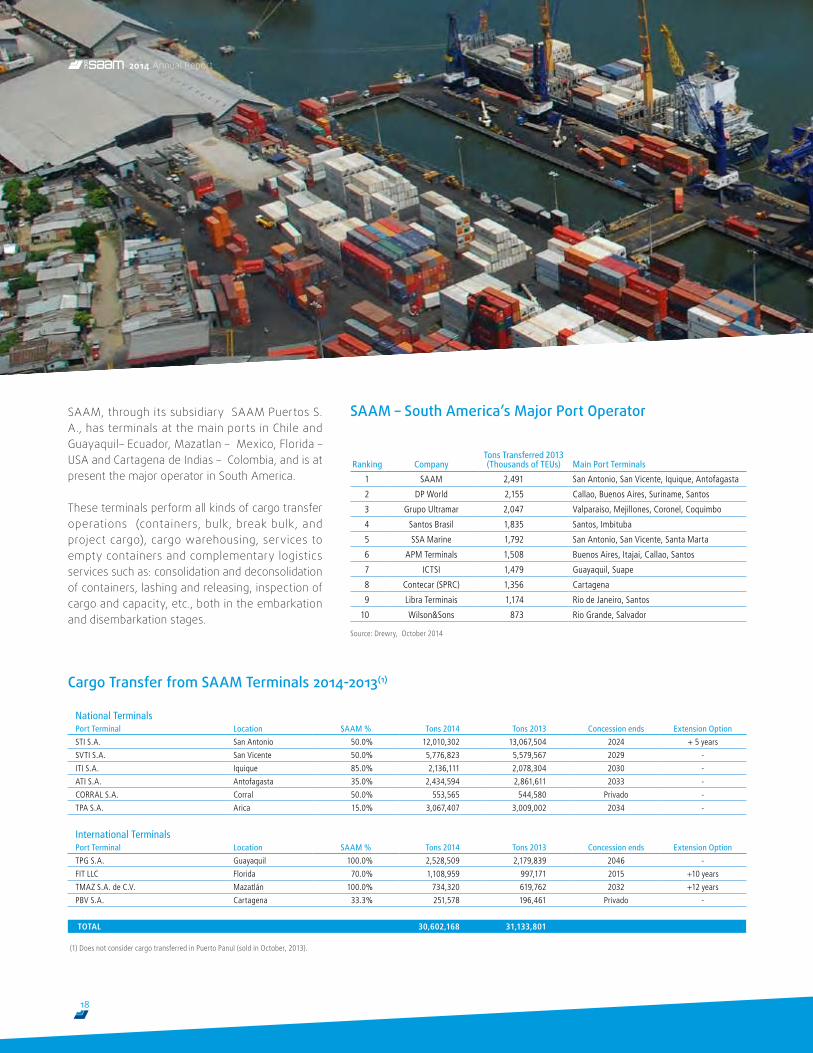
SAAM, through its subsidiary SAAM Puertos S. A., has terminals at the main ports in Chile and Guayaquil– Ecuador, Mazatlan – Mexico, Florida – USA and Cartagena de Indias – Colombia, and is at present the major operator in South America.
These terminals perform all kinds of cargo transfer operations (containers, bulk, break bulk, and project cargo), cargo warehousing, services to empty containers and complementary logistics services such as: consolidation and deconsolidation of containers, lashing and releasing, inspection of cargo and capacity, etc., both in the embarkation and disembarkation stages.
Cargo Transfer from SAAM Terminals 2014-2013(1)
National TerminalsPort Terminal Location SAAM % Tons 2014 Tons 2013 Concession ends Extension Option
STI S.A. San Antonio 50.0% 12,010,302 13,067,504 2024 + 5 years
SVTI S.A. San Vicente 50.0% 5,776,823 5,579,567 2029 -
ITI S.A. Iquique 85.0% 2,136,111 2,078,304 2030 -
ATI S.A. Antofagasta 35.0% 2,434,594 2,861,611 2033 -
CORRAL S.A. Corral 50.0% 553,565 544,580 Privado -
TPA S.A. Arica 15.0% 3,067,407 3,009,002 2034 -
International TerminalsPort Terminal Location SAAM % Tons 2014 Tons 2013 Concession ends Extension Option
TPG S.A. Guayaquil 100.0% 2,528,509 2,179,839 2046 -
FIT LLC Florida 70.0% 1,108,959 997,171 2015 +10 years
TMAZ S.A. de C.V. Mazatlán 100.0% 734,320 619,762 2032 +12 years
PBV S.A. Cartagena 33.3% 251,578 196,461 Privado -
TOTAL 30,602,168 31,133,801
(1) Does not consider cargo transferred in Puerto Panul (sold in October, 2013).
SAAM – South America’s Major Port Operator
Ranking CompanyTons Transferred 2013 (Thousands of TEUs) Main Port Terminals
1 SAAM 2,491 San Antonio, San Vicente, Iquique, Antofagasta
2 DP World 2,155 Callao, Buenos Aires, Suriname, Santos
3 Grupo Ultramar 2,047 Valparaiso, Mejillones, Coronel, Coquimbo
4 Santos Brasil 1,835 Santos, Imbituba
5 SSA Marine 1,792 San Antonio, San Vicente, Santa Marta
6 APM Terminals 1,508 Buenos Aires, Itajai, Callao, Santos
7 ICTSI 1,479 Guayaquil, Suape
8 Contecar (SPRC) 1,356 Cartagena
9 Libra Terminais 1,174 Rio de Janeiro, Santos
10 Wilson&Sons 873 Rio Grande, Salvador
Source: Drewry, October 2014
18
2014 Annual Report
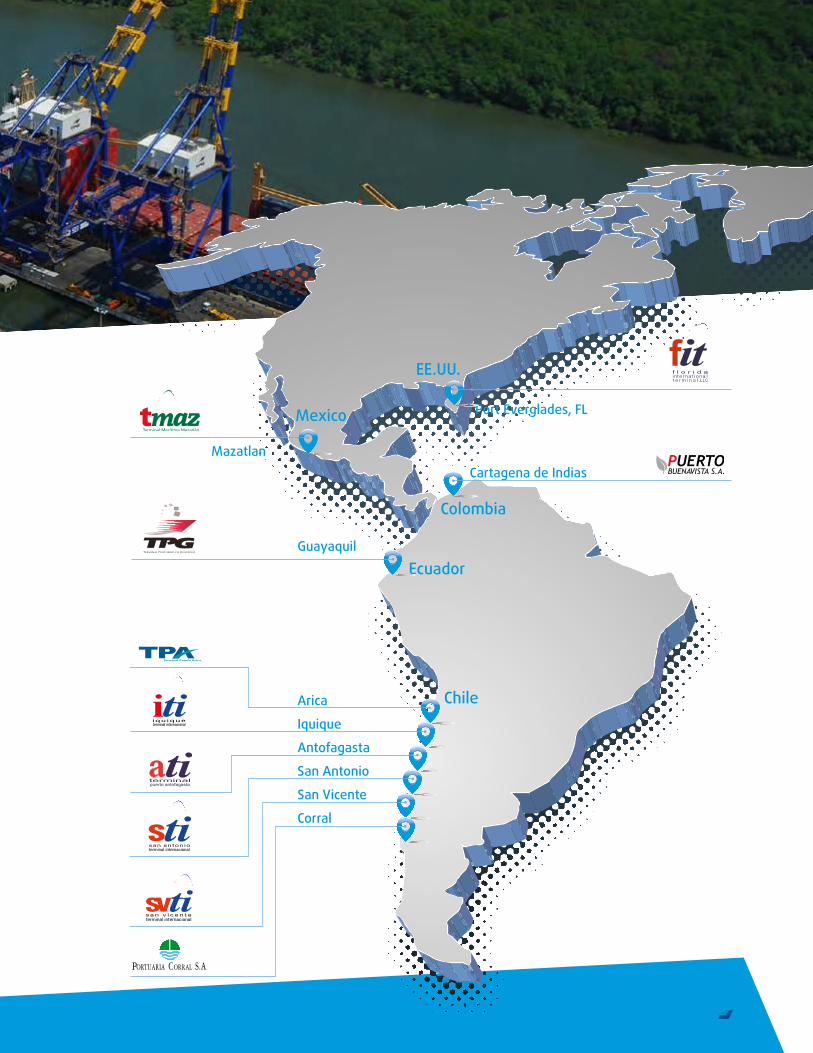
EE.UU.
Mexico
Mazatlan
ChileArica
Iquique
Antofagasta
San Antonio
San Vicente
Corral
EcuadorGuayaquil
Colombia
Cartagena de Indias
Port Everglades, FL
19
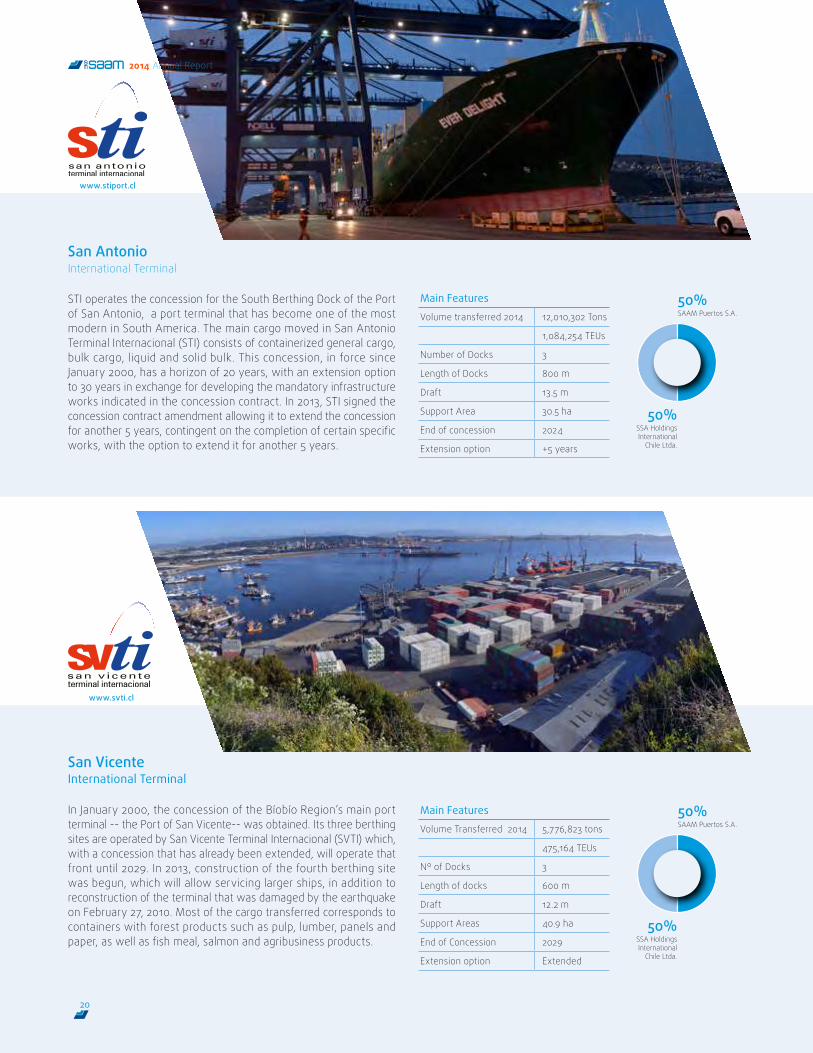
San Antonio International Terminal
STI operates the concession for the South Berthing Dock of the Port of San Antonio, a port terminal that has become one of the most modern in South America. The main cargo moved in San Antonio Terminal Internacional (STI) consists of containerized general cargo, bulk cargo, liquid and solid bulk. This concession, in force since January 2000, has a horizon of 20 years, with an extension option to 30 years in exchange for developing the mandatory infrastructure works indicated in the concession contract. In 2013, STI signed the concession contract amendment allowing it to extend the concession for another 5 years, contingent on the completion of certain specific works, with the option to extend it for another 5 years.
San Vicente International Terminal
In January 2000, the concession of the Bíobío Region’s main port terminal -- the Port of San Vicente-- was obtained. Its three berthing sites are operated by San Vicente Terminal Internacional (SVTI) which, with a concession that has already been extended, will operate that front until 2029. In 2013, construction of the fourth berthing site was begun, which will allow servicing larger ships, in addition to reconstruction of the terminal that was damaged by the earthquake on February 27, 2010. Most of the cargo transferred corresponds to containers with forest products such as pulp, lumber, panels and paper, as well as fish meal, salmon and agribusiness products.
SAAM Puertos S.A.50%
SSA Holdings International
Chile Ltda.
50%
www.stiport.cl
www.svti.cl
Main Features
Volume transferred 2014 12,010,302 Tons
1,084,254 TEUs
Number of Docks 3
Length of Docks 800 m
Draft 13.5 m
Support Area 30.5 ha
End of concession 2024
Extension option +5 years
Main Features
Volume Transferred 2014 5,776,823 tons
475,164 TEUs
Nº of Docks 3
Length of docks 600 m
Draft 12.2 m
Support Areas 40.9 ha
End of Concession 2029
Extension option Extended
SAAM Puertos S.A.50%
SSA Holdings International
Chile Ltda.
50%
20
2014 Annual Report
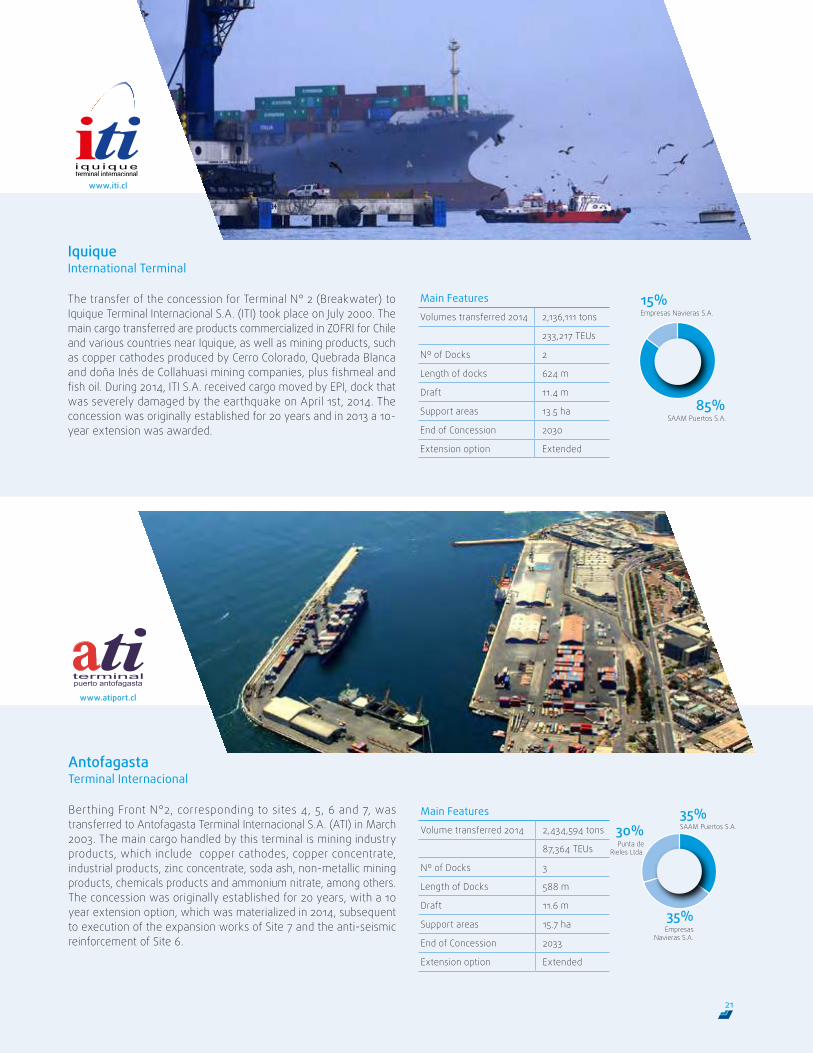
Iquique International Terminal
The transfer of the concession for Terminal N° 2 (Breakwater) to Iquique Terminal Internacional S.A. (ITI) took place on July 2000. The main cargo transferred are products commercialized in ZOFRI for Chile and various countries near Iquique, as well as mining products, such as copper cathodes produced by Cerro Colorado, Quebrada Blanca and doña Inés de Collahuasi mining companies, plus fishmeal and fish oil. During 2014, ITI S.A. received cargo moved by EPI, dock that was severely damaged by the earthquake on April 1st, 2014. The concession was originally established for 20 years and in 2013 a 10-year extension was awarded.
www.atiport.cl
www.iti.cl
Main Features
Volumes transferred 2014 2,136,111 tons
233,217 TEUs
Nº of Docks 2
Length of docks 624 m
Draft 11.4 m
Support areas 13.5 ha
End of Concession 2030
Extension option Extended
SAAM Puertos S.A.35%
Empresas Navieras S.A.
35%
Punta de Rieles Ltda.
30%
Antofagasta Terminal Internacional
Berthing Front N°2, corresponding to sites 4, 5, 6 and 7, was transferred to Antofagasta Terminal Internacional S.A. (ATI) in March 2003. The main cargo handled by this terminal is mining industry products, which include copper cathodes, copper concentrate, industrial products, zinc concentrate, soda ash, non-metallic mining products, chemicals products and ammonium nitrate, among others. The concession was originally established for 20 years, with a 10 year extension option, which was materialized in 2014, subsequent to execution of the expansion works of Site 7 and the anti-seismic reinforcement of Site 6.
Main Features
Volume transferred 2014 2,434,594 tons
87,364 TEUs
Nº of Docks 3
Length of Docks 588 m
Draft 11.6 m
Support areas 15.7 ha
End of Concession 2033
Extension option Extended
Empresas Navieras S.A.15%
SAAM Puertos S.A.85%
21
SAAM Puertos S.A.50%
Inv. Portuarias Ltda.50%
www.portuariacorral.cl
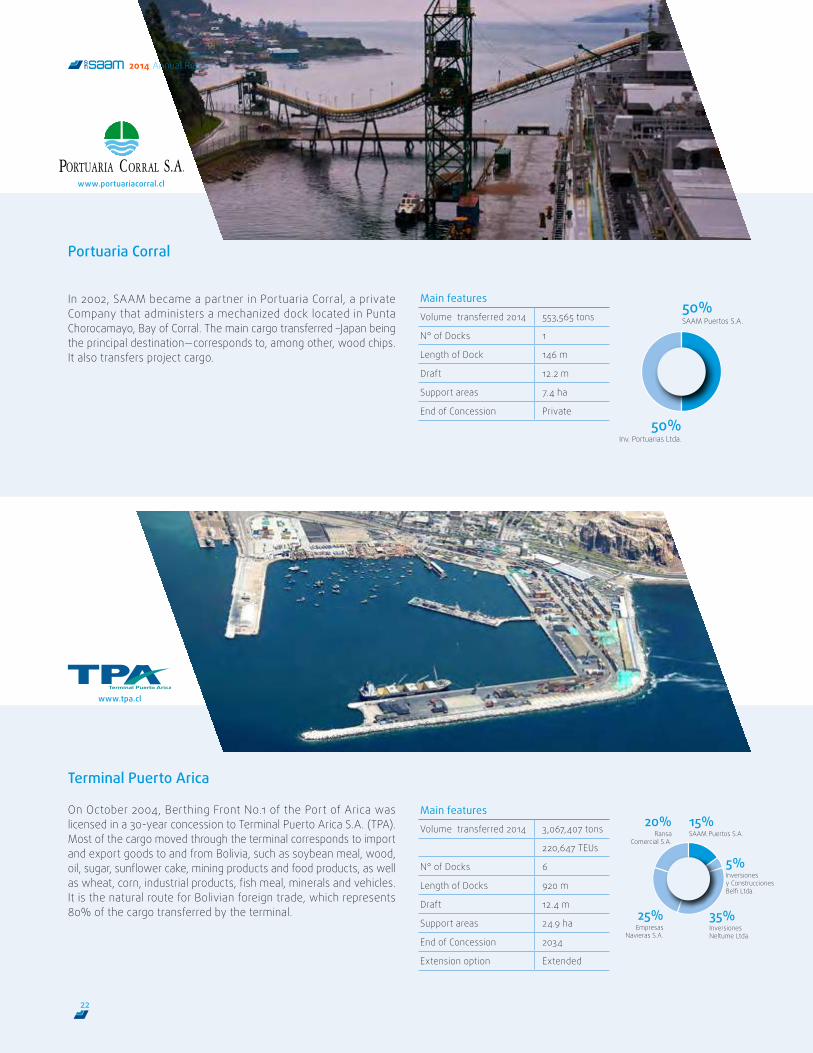
Terminal Puerto Arica
On October 2004, Berthing Front No.1 of the Port of Arica was licensed in a 30-year concession to Terminal Puerto Arica S.A. (TPA). Most of the cargo moved through the terminal corresponds to import and export goods to and from Bolivia, such as soybean meal, wood, oil, sugar, sunflower cake, mining products and food products, as well as wheat, corn, industrial products, fish meal, minerals and vehicles. It is the natural route for Bolivian foreign trade, which represents 80% of the cargo transferred by the terminal.
Main features
Volume transferred 2014 3,067,407 tons
220,647 TEUs
N° of Docks 6
Length of Docks 920 m
Draft 12.4 m
Support areas 24.9 ha
End of Concession 2034
Extension option Extended
Portuaria Corral
In 2002, SAAM became a partner in Portuaria Corral, a private Company that administers a mechanized dock located in Punta Chorocamayo, Bay of Corral. The main cargo transferred –Japan being the principal destination—corresponds to, among other, wood chips. It also transfers project cargo.
Main features
Volume transferred 2014 553,565 tons
N° of Docks 1
Length of Dock 146 m
Draft 12.2 m
Support areas 7.4 ha
End of Concession Private
SAAM Puertos S.A.15%
Empresas Navieras S.A.
25%
Ransa Comercial S.A.
20%
Inversionesy ConstruccionesBelfi Ltda.
5%
InversionesNeltume Ltda.
35%
www.tpa.cl
22
2014 Annual Report
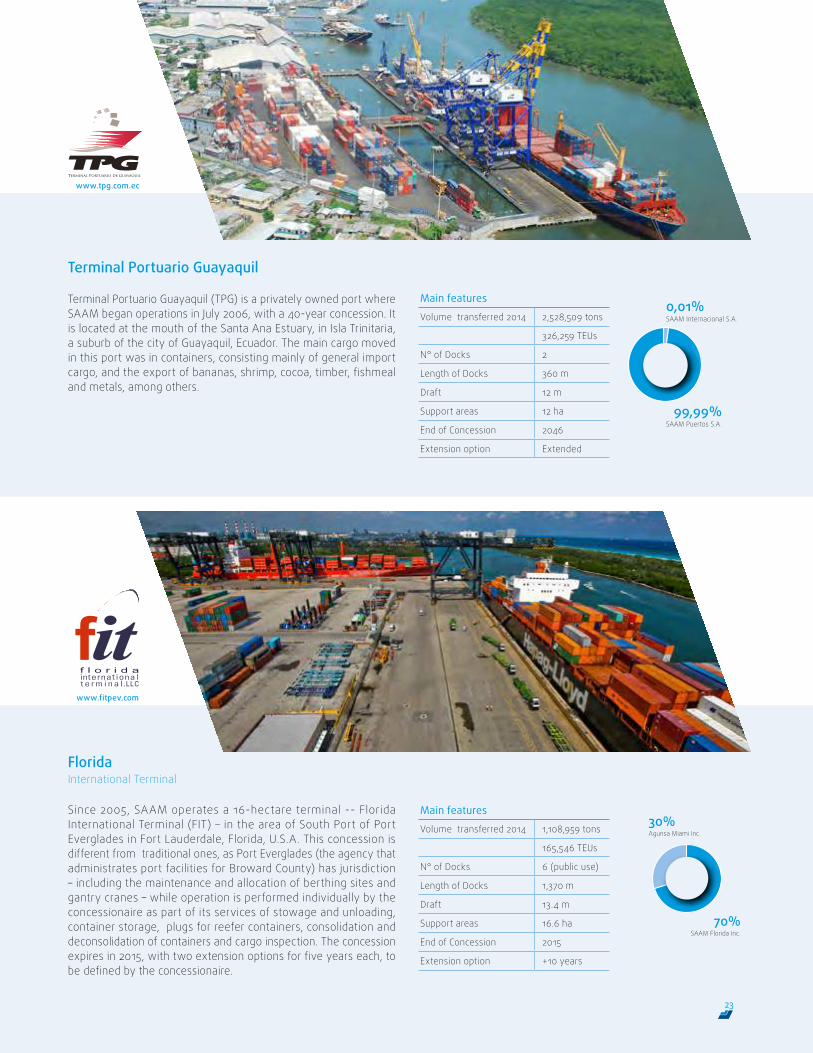
Terminal Portuario Guayaquil
Terminal Portuario Guayaquil (TPG) is a privately owned port where SAAM began operations in July 2006, with a 40-year concession. It is located at the mouth of the Santa Ana Estuary, in Isla Trinitaria, a suburb of the city of Guayaquil, Ecuador. The main cargo moved in this port was in containers, consisting mainly of general import cargo, and the export of bananas, shrimp, cocoa, timber, fishmeal and metals, among others.
Florida International Terminal
Since 2005, SAAM operates a 16-hectare terminal -- Florida International Terminal (FIT) – in the area of South Port of Port Everglades in Fort Lauderdale, Florida, U.S.A. This concession is different from traditional ones, as Port Everglades (the agency that administrates port facilities for Broward County) has jurisdiction – including the maintenance and allocation of berthing sites and gantry cranes – while operation is performed individually by the concessionaire as part of its services of stowage and unloading, container storage, plugs for reefer containers, consolidation and deconsolidation of containers and cargo inspection. The concession expires in 2015, with two extension options for five years each, to be defined by the concessionaire.
www.tpg.com.ec
www.fitpev.com
Main features
Volume transferred 2014 2,528,509 tons
326,259 TEUs
N° of Docks 2
Length of Docks 360 m
Draft 12 m
Support areas 12 ha
End of Concession 2046
Extension option Extended
Main features
Volume transferred 2014 1,108,959 tons
165,546 TEUs
N° of Docks 6 (public use)
Length of Docks 1,370 m
Draft 13.4 m
Support areas 16.6 ha
End of Concession 2015
Extension option +10 years
SAAM Internacional S.A.0,01%
SAAM Puertos S.A.99,99%
Agunsa Miami Inc.30%
SAAM Florida Inc.70%
23
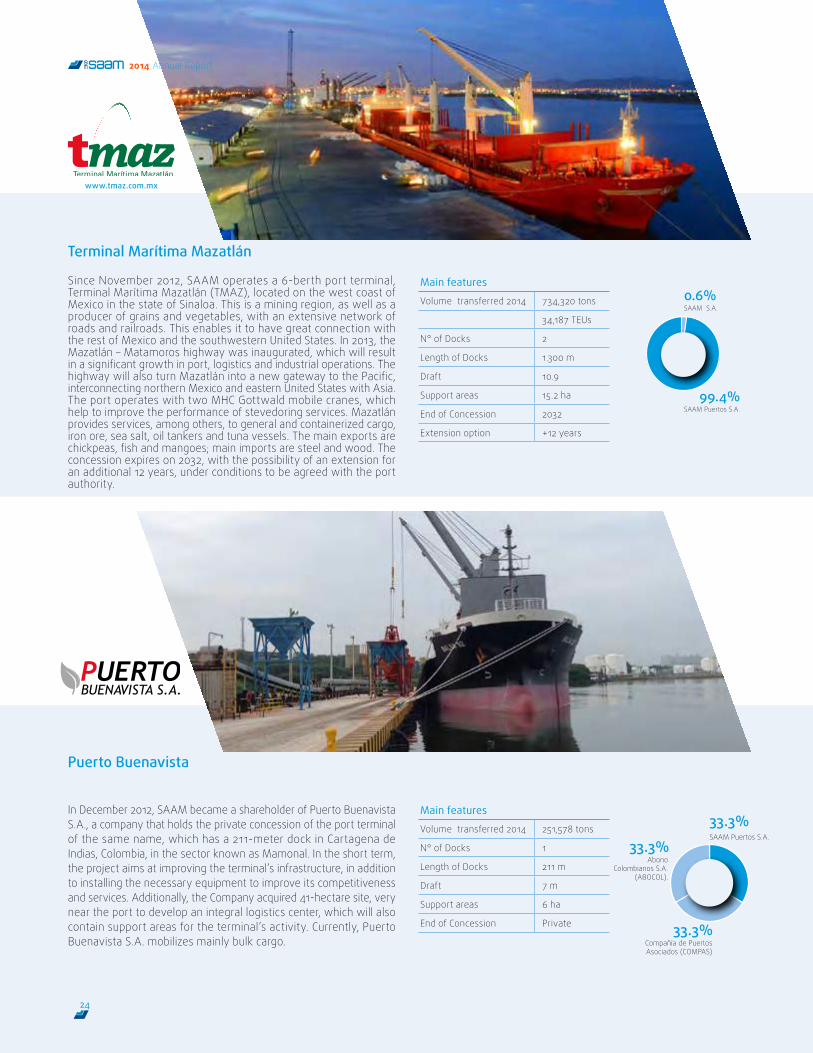
Terminal Marítima Mazatlán
Since November 2012, SAAM operates a 6-berth port terminal, Terminal Marítima Mazatlán (TMAZ), located on the west coast of Mexico in the state of Sinaloa. This is a mining region, as well as a producer of grains and vegetables, with an extensive network of roads and railroads. This enables it to have great connection with the rest of Mexico and the southwestern United States. In 2013, the Mazatlán – Matamoros highway was inaugurated, which will result in a significant growth in port, logistics and industrial operations. The highway will also turn Mazatlán into a new gateway to the Pacific, interconnecting northern Mexico and eastern United States with Asia. The port operates with two MHC Gottwald mobile cranes, which help to improve the performance of stevedoring services. Mazatlán provides services, among others, to general and containerized cargo, iron ore, sea salt, oil tankers and tuna vessels. The main exports are chickpeas, fish and mangoes; main imports are steel and wood. The concession expires on 2032, with the possibility of an extension for an additional 12 years, under conditions to be agreed with the port authority.
Puerto Buenavista
In December 2012, SAAM became a shareholder of Puerto Buenavista S.A., a company that holds the private concession of the port terminal of the same name, which has a 211-meter dock in Cartagena de Indias, Colombia, in the sector known as Mamonal. In the short term, the project aims at improving the terminal’s infrastructure, in addition to installing the necessary equipment to improve its competitiveness and services. Additionally, the Company acquired 41-hectare site, very near the port to develop an integral logistics center, which will also contain support areas for the terminal’s activity. Currently, Puerto Buenavista S.A. mobilizes mainly bulk cargo.
www.tmaz.com.mx
Main features
Volume transferred 2014 734,320 tons
34,187 TEUs
N° of Docks 2
Length of Docks 1.300 m
Draft 10.9
Support areas 15.2 ha
End of Concession 2032
Extension option +12 years
Main features
Volume transferred 2014 251,578 tons
N° of Docks 1
Length of Docks 211 m
Draft 7 m
Support areas 6 ha
End of Concession Private
SAAM S.A.0.6%
SAAM Puertos S.A.99.4%
SAAM Puertos S.A.
33.3%
Compañía de Puertos Asociados (COMPAS)
33.3%
Abono Colombianos S.A.
(ABOCOL).
33.3%
24
2014 Annual Report
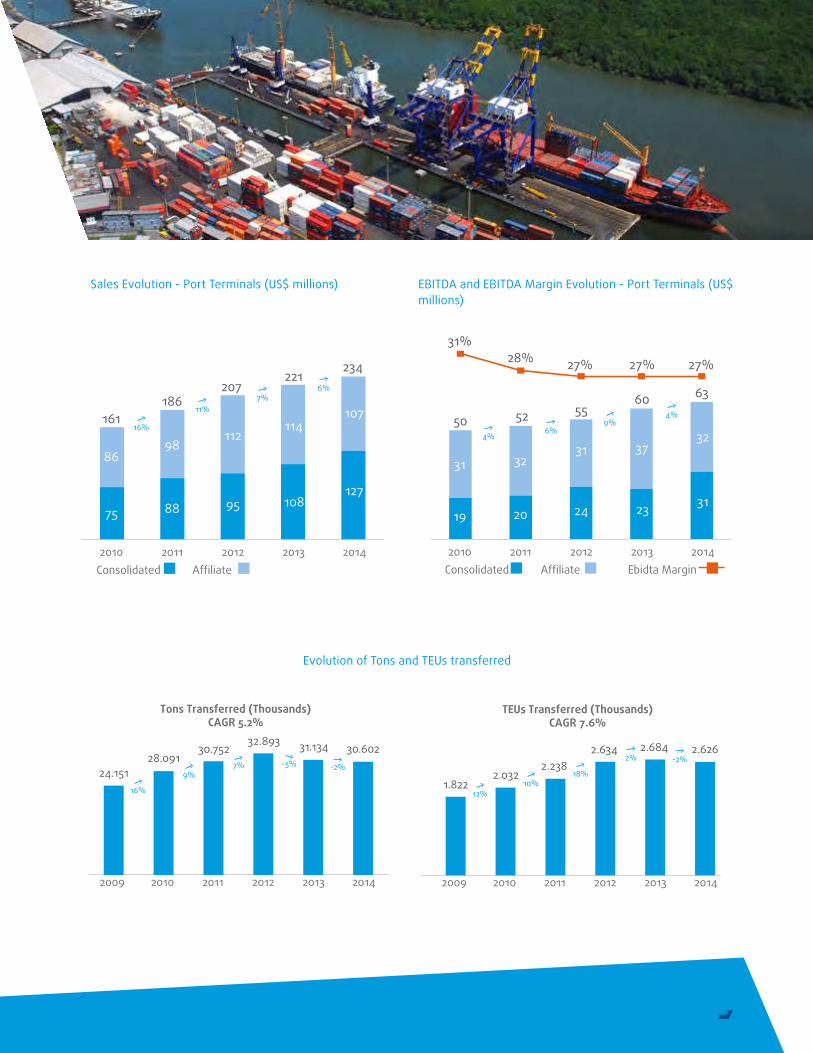
Sales Evolution - Port Terminals (US$ millions) EBITDA and EBITDA Margin Evolution - Port Terminals (US$ millions)
Evolution of Tons and TEUs transferred
75
86
161186
207221
234
98112
114107
88 95 108127
2010 2011 2012 2013 2014Consolidated Affiliate
16%
11%7%
6%
24.15116%
9%7% -5% -2%
28.09130.752
32.893 31.134 30.602
Tons Transferred (Thousands)CAGR 5.2%
2009 2010 2011 2012 2013 2014
1.82212%
10%18%
2% -2%
2.0322.238
2.634 2.684 2.626
TEUs Transferred (Thousands)CAGR 7.6%
2009 2010 2011 2012 2013 2014
24.15116%
9%7% -5% -2%
28.09130.752
32.893 31.134 30.602
Tons Transferred (Thousands)CAGR 5.2%
2009 2010 2011 2012 2013 2014
1.82212%
10%18%
2% -2%
2.0322.238
2.634 2.684 2.626
TEUs Transferred (Thousands)CAGR 7.6%
2009 2010 2011 2012 2013 2014
19
31
31%28% 27% 27% 27%
3231 37
32
20 24 23 31
2010 2011 2012 2013 2014Consolidated Affiliate Ebidta Margin
6360555250
4%6%
9%4%
25
Regulation
Terminals that have been tendered are regulated by their respective concession contracts, and in the case of Chile, by Law Nº 19.542 that modernizes the state-owned port sector and ensures free competition, contemplating restrictions that limit horizontal and vertical integration of the concessionaire.
Horizontal integration establishes that an operator controlling more than 15% of the ownership of a berthing site, will not be able to hold a share of over 15% of another mooring site in the same region. This restriction aims at developing competitiveness between terminals belonging to companies located in the same region of the country. To this purpose, it is required that concessionaires serving the same hinterland must not have one and the same controlling group.
As regards vertical integration the restriction establishes that the set of relevant users of port services may not hold over 40% of the capital of a company who is the concessionaire of a terminal. The term Relevant User should be understood as any company participating in the shipping, importing, exporting or cargo transport business, and who holds over 15% of the maritime cargo tonnage in the respective region, or more than 25% in the terminal under concession. This restriction is aimed at preventing a relevant user of a terminal, to use his control over the infrastructure to block competitors in the shipping market.
Competition in Chile
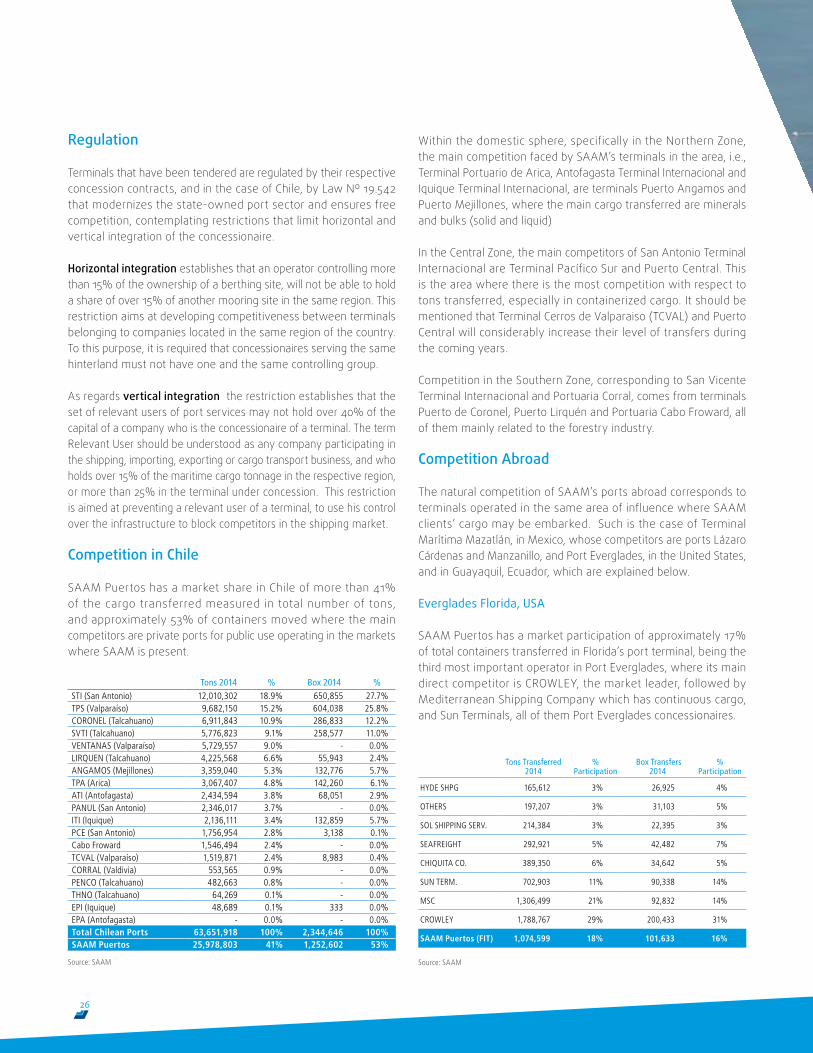
SAAM Puertos has a market share in Chile of more than 41% of the cargo transferred measured in total number of tons, and approximately 53% of containers moved where the main competitors are private ports for public use operating in the markets where SAAM is present.
Tons 2014 % Box 2014 %STI (San Antonio) 12,010,302 18.9% 650,855 27.7%TPS (Valparaíso) 9,682,150 15.2% 604,038 25.8%CORONEL (Talcahuano) 6,911,843 10.9% 286,833 12.2%SVTI (Talcahuano) 5,776,823 9.1% 258,577 11.0%VENTANAS (Valparaíso) 5,729,557 9.0% - 0.0%LIRQUEN (Talcahuano) 4,225,568 6.6% 55,943 2.4%ANGAMOS (Mejillones) 3,359,040 5.3% 132,776 5.7%TPA (Arica) 3,067,407 4.8% 142,260 6.1%ATI (Antofagasta) 2,434,594 3.8% 68,051 2.9%PANUL (San Antonio) 2,346,017 3.7% - 0.0%ITI (Iquique) 2,136,111 3.4% 132,859 5.7%PCE (San Antonio) 1,756,954 2.8% 3,138 0.1%Cabo Froward 1,546,494 2.4% - 0.0%TCVAL (Valparaíso) 1,519,871 2.4% 8,983 0.4%CORRAL (Valdivia) 553,565 0.9% - 0.0%PENCO (Talcahuano) 482,663 0.8% - 0.0%THNO (Talcahuano) 64,269 0.1% - 0.0%EPI (Iquique) 48,689 0.1% 333 0.0%EPA (Antofagasta) - 0.0% - 0.0%Total Chilean Ports 63,651,918 100% 2,344,646 100%SAAM Puertos 25,978,803 41% 1,252,602 53%
Source: SAAM
Within the domestic sphere, specifically in the Northern Zone, the main competition faced by SAAM’s terminals in the area, i.e., Terminal Portuario de Arica, Antofagasta Terminal Internacional and Iquique Terminal Internacional, are terminals Puerto Angamos and Puerto Mejillones, where the main cargo transferred are minerals and bulks (solid and liquid)
In the Central Zone, the main competitors of San Antonio Terminal Internacional are Terminal Pacífico Sur and Puerto Central. This is the area where there is the most competition with respect to tons transferred, especially in containerized cargo. It should be mentioned that Terminal Cerros de Valparaiso (TCVAL) and Puerto Central will considerably increase their level of transfers during the coming years.
Competition in the Southern Zone, corresponding to San Vicente Terminal Internacional and Portuaria Corral, comes from terminals Puerto de Coronel, Puerto Lirquén and Portuaria Cabo Froward, all of them mainly related to the forestry industry.
Competition Abroad
The natural competition of SAAM’s ports abroad corresponds to terminals operated in the same area of influence where SAAM clients’ cargo may be embarked. Such is the case of Terminal Marítima Mazatlán, in Mexico, whose competitors are ports Lázaro Cárdenas and Manzanillo, and Port Everglades, in the United States, and in Guayaquil, Ecuador, which are explained below.
Everglades Florida, USA
SAAM Puertos has a market participation of approximately 17% of total containers transferred in Florida’s port terminal, being the third most important operator in Port Everglades, where its main direct competitor is CROWLEY, the market leader, followed by Mediterranean Shipping Company which has continuous cargo, and Sun Terminals, all of them Port Everglades concessionaires.
Tons Transferred 2014
% Participation
Box Transfers 2014
% Participation
HYDE SHPG 165,612 3% 26,925 4%
OTHERS 197,207 3% 31,103 5%
SOL SHIPPING SERV. 214,384 3% 22,395 3%
SEAFREIGHT 292,921 5% 42,482 7%
CHIQUITA CO. 389,350 6% 34,642 5%
SUN TERM. 702,903 11% 90,338 14%
MSC 1,306,499 21% 92,832 14%
CROWLEY 1,788,767 29% 200,433 31%
SAAM Puertos (FIT) 1,074,599 18% 101,633 16%
Source: SAAM
26
2014 Annual Report
Properties and Facilities
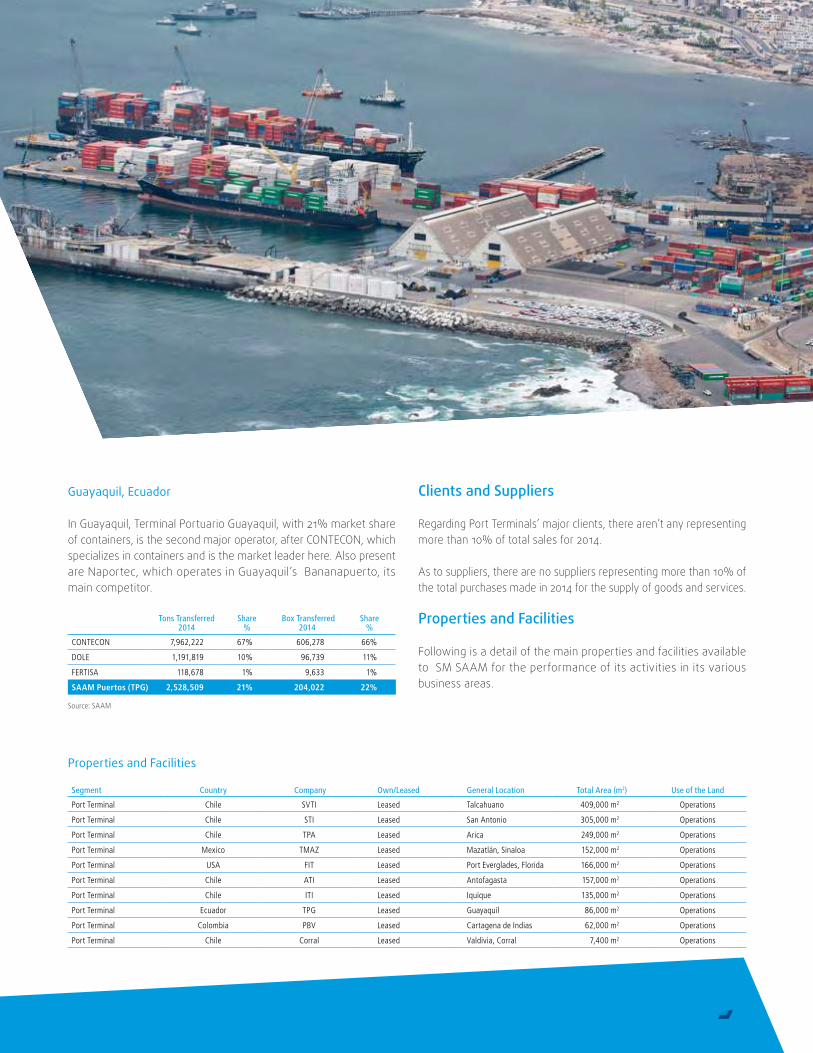
Segment Country Company Own/Leased General Location Total Area (m2) Use of the Land
Port Terminal Chile SVTI Leased Talcahuano 409,000 m2 Operations
Port Terminal Chile STI Leased San Antonio 305,000 m2 Operations
Port Terminal Chile TPA Leased Arica 249,000 m2 Operations
Port Terminal Mexico TMAZ Leased Mazatlán, Sinaloa 152,000 m2 Operations
Port Terminal USA FIT Leased Port Everglades, Florida 166,000 m2 Operations
Port Terminal Chile ATI Leased Antofagasta 157,000 m2 Operations
Port Terminal Chile ITI Leased Iquique 135,000 m2 Operations
Port Terminal Ecuador TPG Leased Guayaquil 86,000 m2 Operations
Port Terminal Colombia PBV Leased Cartagena de Indias 62,000 m2 Operations
Port Terminal Chile Corral Leased Valdivia, Corral 7,400 m2 Operations
Guayaquil, Ecuador
In Guayaquil, Terminal Portuario Guayaquil, with 21% market share of containers, is the second major operator, after CONTECON, which specializes in containers and is the market leader here. Also present are Naportec, which operates in Guayaquil’s Bananapuerto, its main competitor.
Tons Transferred 2014
Share%
Box Transferred 2014
Share%
CONTECON 7,962,222 67% 606,278 66%
DOLE 1,191,819 10% 96,739 11%
FERTISA 118,678 1% 9,633 1%
SAAM Puertos (TPG) 2,528,509 21% 204,022 22%
Source: SAAM
Clients and Suppliers
Regarding Port Terminals’ major clients, there aren’t any representing more than 10% of total sales for 2014.
As to suppliers, there are no suppliers representing more than 10% of the total purchases made in 2014 for the supply of goods and services.
Properties and Facilities
Following is a detail of the main properties and facilities available to SM SAAM for the performance of its activities in its various business areas.
27
2014 Annual Report
Tugboats
Leadership
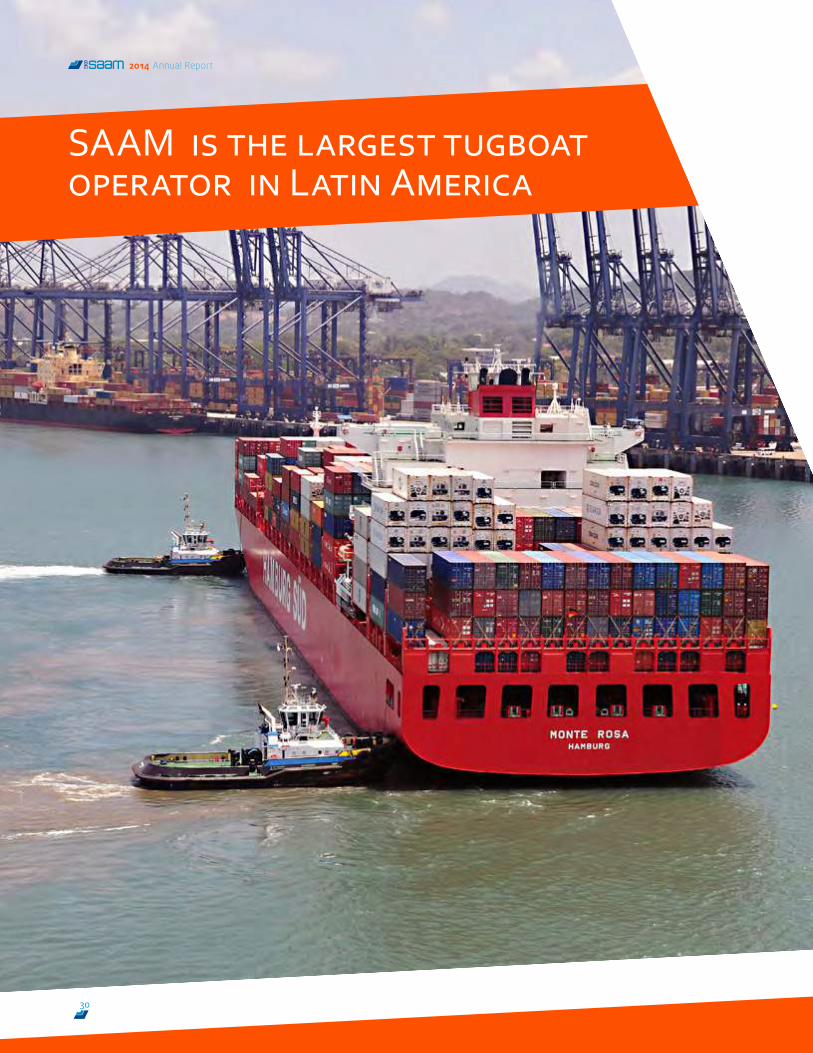
SAAM is the largest tugboat operator in Latin America
30
2014 Annual Report
Tugboats are vessels whose main function is to assist very large ships in their proximity and transit maneuvers in port, and docking and undocking of ships, using powerful and flexible propulsion systems. In addition to providing docking and undocking services, these vessels are usually equipped with tools to assist in firefighting, rescuing and cleaning of spills, among other situations, and they are also used in emergencies at ports and offshore.
The tugboats business is mostly influenced by: (i) world maritime trade volume (ii) number of vessels in operation (iii) the number of maneuvers or operations carried out (iv) the size of the ships assisted (v) the tugboat’s technology
The recent trend to increase the size of container-transporting ships has impacted the growth of the number of tugboat operations. However, the fact of assisting larger ships has compelled tugboat operators to increase their investments in more powerful and more maneuverable tugboats, which has, in turn, risen the unit value of each operation. Thus, the industry has maintained its growth in revenues with a new operation profile.
>> SAAM is the largest tugboat operator in Latin America, with 191 units, including 11 under construction in the principal ports in Canada, Mexico, Guatemala, Honduras, Costa Rica, Panama, Ecuador, Peru, Brazil, Uruguay and Chile <<
At a world level, the tugboats market is currently undergoing a consolidation stage as a consequence of technological evolution and the increased size of ships. Conventional propulsion tugboats are quickly being replaced / modified by new azimuth tugboats with screw propellers that can spin round up to 360°, thus leaving the former rather limited. Increased investment has given rise to a series of mergers and associations, creating entry barriers to smaller operators.
In Chile, tugboat operations must only use tugboats with the Chilean flag, and an essential requirement to obtain this flag is meeting with the special nationality demands contained in Article 11 of the Ley de Navegación (Navigation Law). Abroad, port tugboat markets must comply with the regulations set by each country. Generally, it is regulated as a coastal trade activity, within the rules of each country. Likewise, there are countries where the main bays are operated by the port authorities and they are the ones that have the right to exploit the service, directly or through concessions. However, there are countries with greater freedom, where the activity is regulated only with respect to their technical safety standards, just as any other economic activity.
TUGBOATS
31
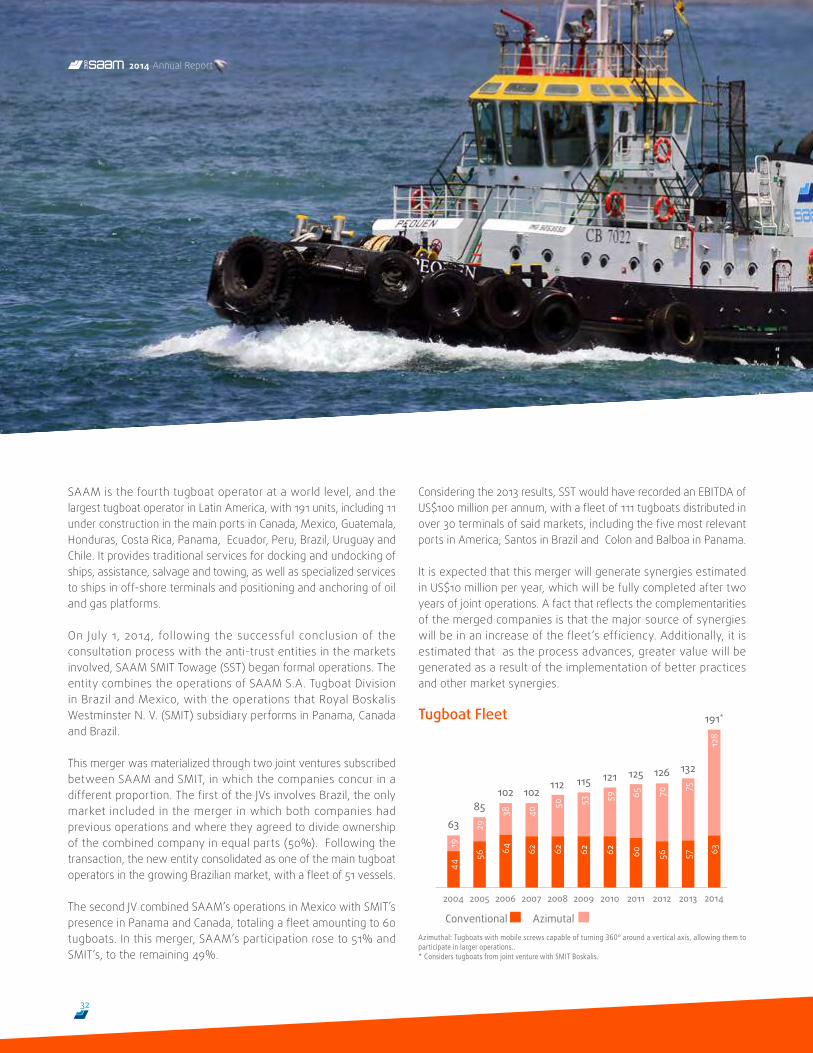
SAAM is the fourth tugboat operator at a world level, and the largest tugboat operator in Latin America, with 191 units, including 11 under construction in the main ports in Canada, Mexico, Guatemala, Honduras, Costa Rica, Panama, Ecuador, Peru, Brazil, Uruguay and Chile. It provides traditional services for docking and undocking of ships, assistance, salvage and towing, as well as specialized services to ships in off-shore terminals and positioning and anchoring of oil and gas platforms.
On July 1, 2014, following the successful conclusion of the consultation process with the anti-trust entities in the markets involved, SAAM SMIT Towage (SST) began formal operations. The entity combines the operations of SAAM S.A. Tugboat Division in Brazil and Mexico, with the operations that Royal Boskalis Westminster N. V. (SMIT) subsidiary performs in Panama, Canada and Brazil.
This merger was materialized through two joint ventures subscribed between SAAM and SMIT, in which the companies concur in a different proportion. The first of the JVs involves Brazil, the only market included in the merger in which both companies had previous operations and where they agreed to divide ownership of the combined company in equal parts (50%). Following the transaction, the new entity consolidated as one of the main tugboat operators in the growing Brazilian market, with a fleet of 51 vessels.
The second JV combined SAAM’s operations in Mexico with SMIT’s presence in Panama and Canada, totaling a fleet amounting to 60 tugboats. In this merger, SAAM’s participation rose to 51% and SMIT’s, to the remaining 49%.
Considering the 2013 results, SST would have recorded an EBITDA of US$100 million per annum, with a fleet of 111 tugboats distributed in over 30 terminals of said markets, including the five most relevant ports in America; Santos in Brazil and Colon and Balboa in Panama.
It is expected that this merger will generate synergies estimated in US$10 million per year, which will be fully completed after two years of joint operations. A fact that reflects the complementarities of the merged companies is that the major source of synergies will be in an increase of the fleet’s efficiency. Additionally, it is estimated that as the process advances, greater value will be generated as a result of the implementation of better practices and other market synergies.
Tugboat Fleet
44
56 64 62 62 62 62 60 56 57 63
19
29
38 40
50 53 59 65 70 75
128
6385
102 102112 115 121 125 126 132
191*
2010200920082007200620052004 2011 2012 2013 2014
Conventional AzimutalAzimuthal: Tugboats with mobile screws capable of turning 360º around a vertical axis, allowing them to participate in larger operations..* Considers tugboats from joint venture with SMIT Boskalis.
32
2014 Annual Report
Lázaro Cárdenas
Prince Rupert
VancouverNew Westminster
Fort Lauderdale
Squamish
KitimatStewart
Puerto Quetzal
Punta MoralesPuntarenas
Puerto Caldera
Ciudad del Carmen
Puerto CortésChiriqui Grande
Bahía Las MinasColón
BalboaMelonesTaboguilla
Fortaleza
Vitoria
Angra do Reis
Santana
Santarem Itaquí
Recife
Salvador de Bahía
São Francisco do Sul
Río de Janeiro
Itaguai
Santos
Sauipe
Montevideo
San Sebastián
Río Grande Paranaguá
Itajaí
EsmeraldaManta
BayóvarSalaverry
PiscoMatarani
Ilo
Fray Bentos
Paysandú
Nueva Palmira
UshuaiaPunta Arenas
Puerto Chacabuco
Puerto Montt
Puerto CorralCoronel
San VicenteTalcahuano
Lirquén
San Antonio Valparaíso
Quintero
Coquimbo ChañaralHuasco
MejillonesAntofagastaIquique
Arica
Puerto BolivarGuayaquil
TalaraPaita
ChimboteHuarmey
Callao
Santa María
Altamira
TuxpanVeracruz
Tampico
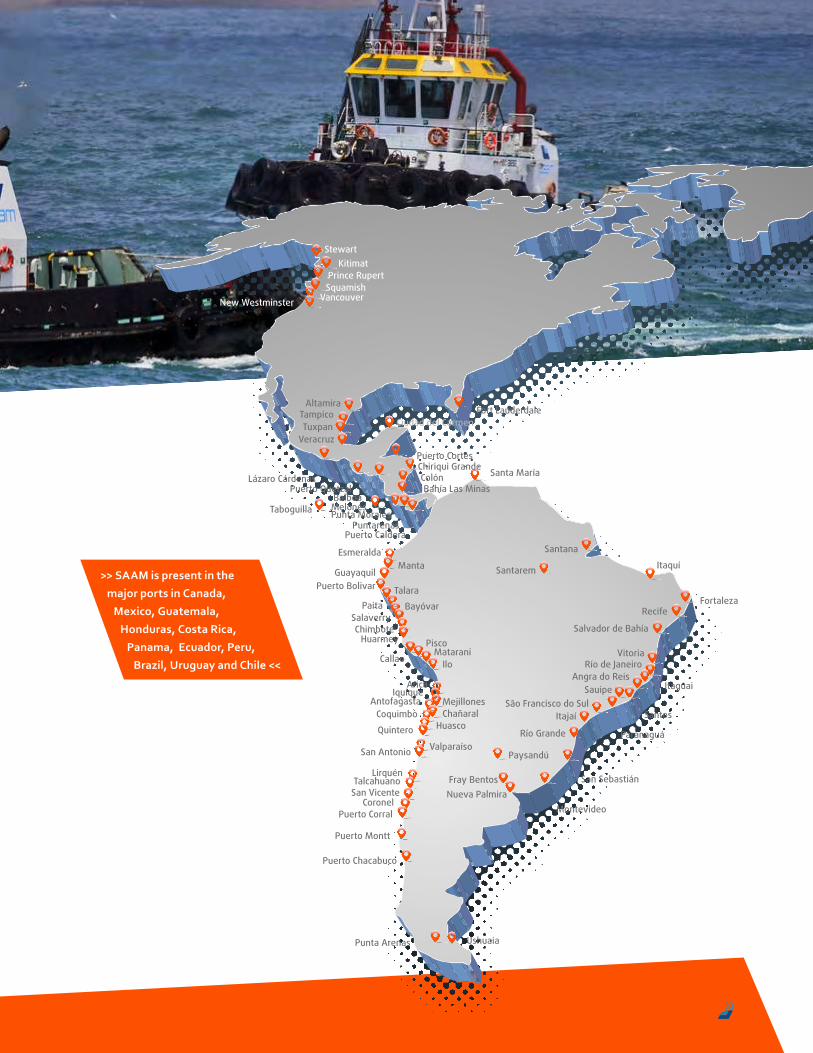
>> SAAM is present in the
major ports in Canada,
Mexico, Guatemala,
Honduras, Costa Rica,
Panama, Ecuador, Peru,
Brazil, Uruguay and Chile <<
33
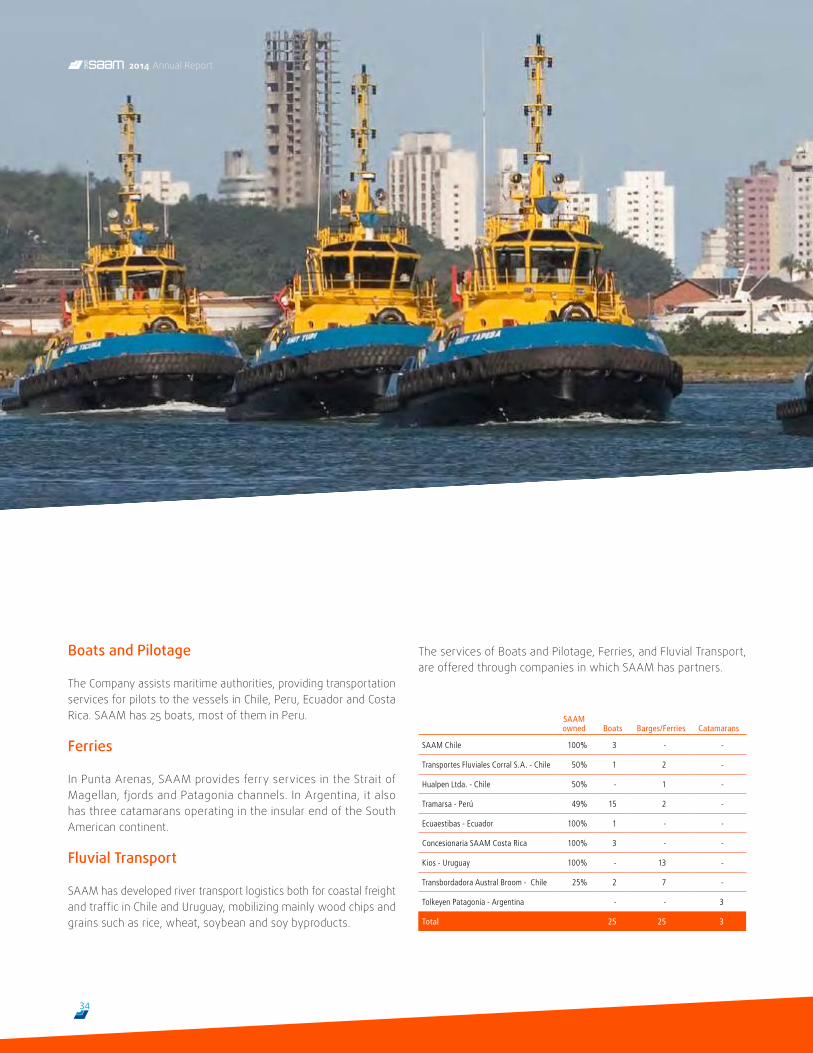
Boats and Pilotage
The Company assists maritime authorities, providing transportation services for pilots to the vessels in Chile, Peru, Ecuador and Costa Rica. SAAM has 25 boats, most of them in Peru.
Ferries
In Punta Arenas, SAAM provides ferry services in the Strait of Magellan, fjords and Patagonia channels. In Argentina, it also has three catamarans operating in the insular end of the South American continent.
Fluvial Transport
SAAM has developed river transport logistics both for coastal freight and traffic in Chile and Uruguay, mobilizing mainly wood chips and grains such as rice, wheat, soybean and soy byproducts.
The services of Boats and Pilotage, Ferries, and Fluvial Transport, are offered through companies in which SAAM has partners.
SAAM owned Boats Barges/Ferries Catamarans
SAAM Chile 100% 3 - -
Transportes Fluviales Corral S.A. - Chile 50% 1 2 -
Hualpen Ltda. - Chile 50% - 1 -
Tramarsa - Perú 49% 15 2 -
Ecuaestibas - Ecuador 100% 1 - -
Concesionaria SAAM Costa Rica 100% 3 - -
Kios - Uruguay 100% - 13 -
Transbordadora Austral Broom - Chile 25% 2 7 -
Tolkeyen Patagonia - Argentina - - 3
Total 25 25 3
34
2014 Annual Report
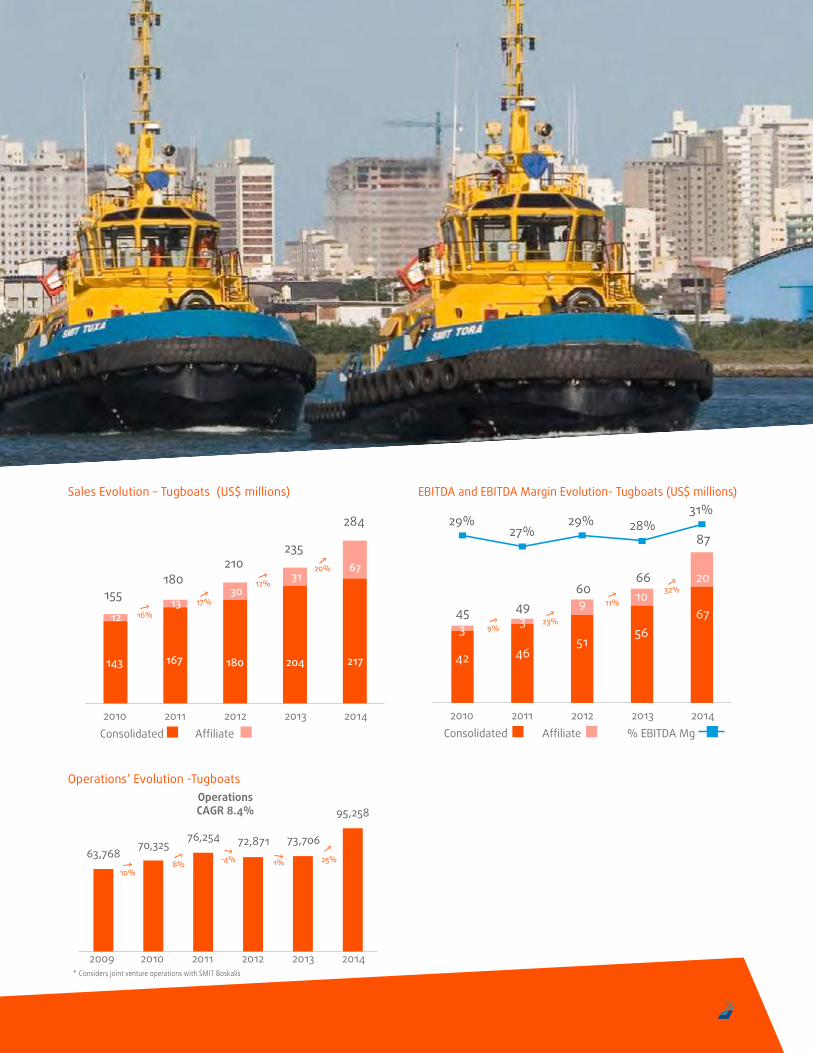
143
155 180
210 235
284
167 180 204 217
1213
3031
67
2010 2011 2012 2013 2014Consolidated Affiliate
16%17%
12%
20%
63,76810%
8% -4% 1% 25%70,325
76,254 72,871 73,706
95,258OperationsCAGR 8.4%
2009 2010 2011 2012 2013 2014
42
3
29%27%
29% 28%31%
39 10
20
4651
5667
2010 2011 2012 2013 2014Consolidated Affiliate % EBITDA Mg
45 4960
66
87
9%23%
11%32%
EBITDA and EBITDA Margin Evolution- Tugboats (US$ millions) Sales Evolution – Tugboats (US$ millions)
Operations’ Evolution -Tugboats
* Considers joint venture operations with SMIT Boskalis
35
Regulation
Ports and terminals’ towage activity is subject to the legislation of the country where it operates, and it is a much regulated industry, where in general the service is contemplated in local coastal navigation standards.
From the operating point of view, the industry is regulated in technical, safety and labor matters by the maritime authorities of each country.
In the commercial sphere, there co-exist various business models adopted by the authorities for the provision of towage services, from mono-operator concessions and regulated tariffs, to open markets and free tariffs.
Competition
Considering the number of tugboats in operation, SAAM is the major operator in Latin America, being present in 11 countries (Canada, Mexico, Guatemala, Honduras, Costa Rica, Colombia, Ecuador, Peru, Brazil, Uruguay and Chile).
In Mexico, Panama and in the West Coast of Canada, SAAM SMIT Towage is the market leader, while in Brazil it has positioned itself as the second in market share after its merger with SMIT.
In Chile, the main competitors are Ultratug Ltda. and CPT Remolcadores S.A. In overseas operations, tugboat markets vary
widely in their regulations, and open-competition markets co-exist with closed markets due to concessions or private contracts. In these markets, SAAM competes with major worldwide tugboat operators, such as Svitzer, SMIT, Boluda, and also at a regional level, with operators such as Wilson Sons, Intertug and Ultratug, among others.
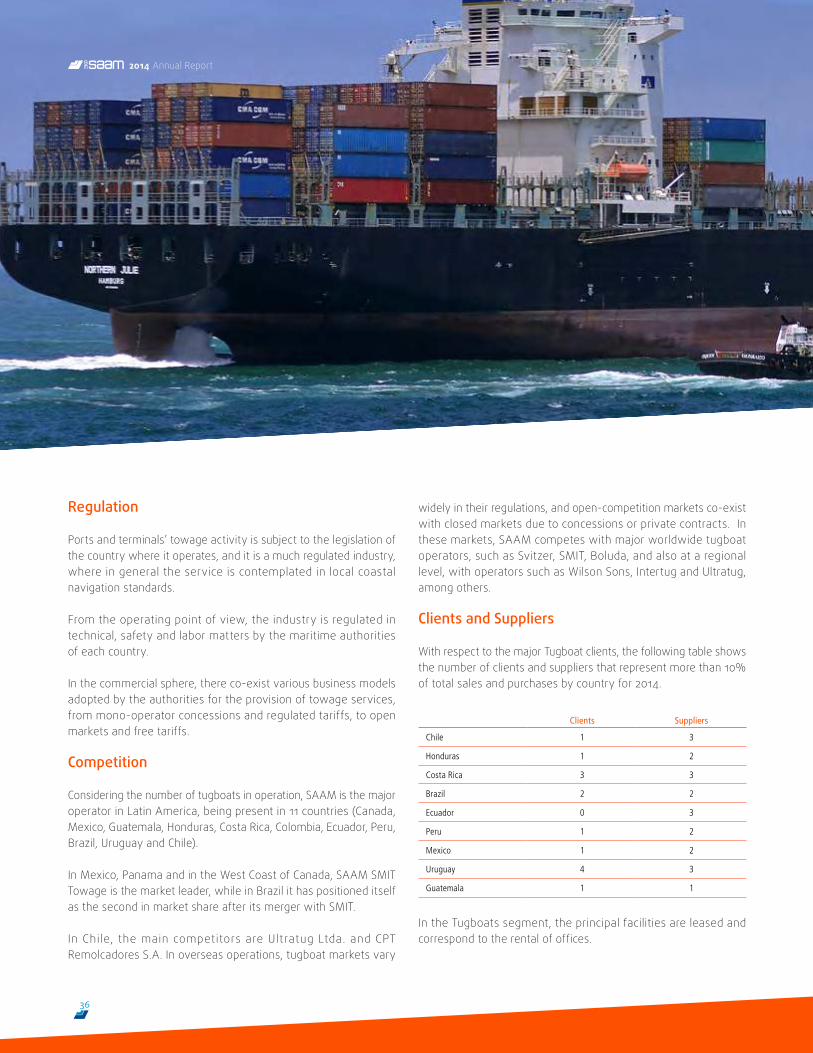
Clients and Suppliers
With respect to the major Tugboat clients, the following table shows the number of clients and suppliers that represent more than 10% of total sales and purchases by country for 2014.
Clients Suppliers
Chile 1 3
Honduras 1 2
Costa Rica 3 3
Brazil 2 2
Ecuador 0 3
Peru 1 2
Mexico 1 2
Uruguay 4 3
Guatemala 1 1
In the Tugboats segment, the principal facilities are leased and correspond to the rental of offices.
36
2014 Annual Report
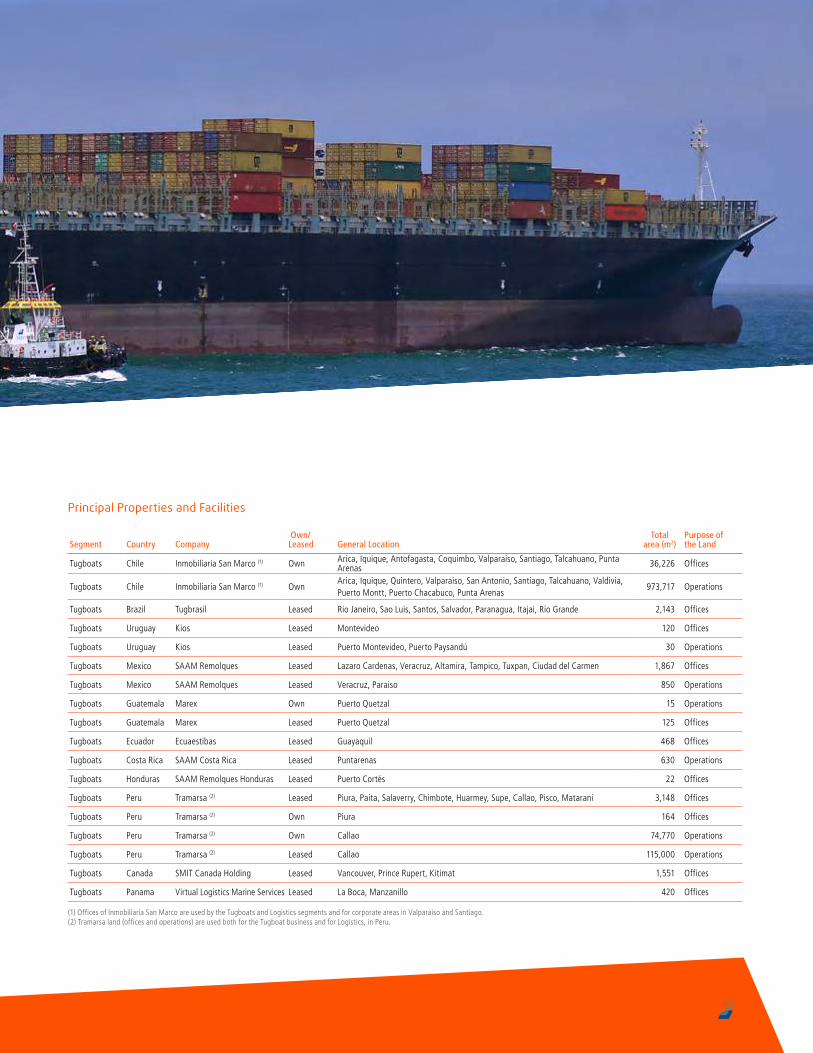
Principal Properties and Facilities
Segment Country Company Own/Leased General Location
Totalarea (m2)
Purpose of the Land
Tugboats Chile Inmobiliaria San Marco (1) Own Arica, Iquique, Antofagasta, Coquimbo, Valparaiso, Santiago, Talcahuano, Punta Arenas 36,226 Offices
Tugboats Chile Inmobiliaria San Marco (1) OwnArica, Iquique, Quintero, Valparaiso, San Antonio, Santiago, Talcahuano, Valdivia, Puerto Montt, Puerto Chacabuco, Punta Arenas
973,717 Operations
Tugboats Brazil Tugbrasil Leased Rio Janeiro, Sao Luis, Santos, Salvador, Paranagua, Itajai, Rio Grande 2,143 Offices
Tugboats Uruguay Kios Leased Montevideo 120 Offices
Tugboats Uruguay Kios Leased Puerto Montevideo, Puerto Paysandú 30 Operations
Tugboats Mexico SAAM Remolques Leased Lazaro Cardenas, Veracruz, Altamira, Tampico, Tuxpan, Ciudad del Carmen 1,867 Offices
Tugboats Mexico SAAM Remolques Leased Veracruz, Paraiso 850 Operations
Tugboats Guatemala Marex Own Puerto Quetzal 15 Operations
Tugboats Guatemala Marex Leased Puerto Quetzal 125 Offices
Tugboats Ecuador Ecuaestibas Leased Guayaquil 468 Offices
Tugboats Costa Rica SAAM Costa Rica Leased Puntarenas 630 Operations
Tugboats Honduras SAAM Remolques Honduras Leased Puerto Cortés 22 Offices
Tugboats Peru Tramarsa (2) Leased Piura, Paita, Salaverry, Chimbote, Huarmey, Supe, Callao, Pisco, Matarani 3,148 Offices
Tugboats Peru Tramarsa (2) Own Piura 164 Offices
Tugboats Peru Tramarsa (2) Own Callao 74,770 Operations
Tugboats Peru Tramarsa (2) Leased Callao 115,000 Operations
Tugboats Canada SMIT Canada Holding Leased Vancouver, Prince Rupert, Kitimat 1,551 Offices
Tugboats Panama Virtual Logistics Marine Services Leased La Boca, Manzanillo 420 Offices (1) Offices of Inmobiliaria San Marco are used by the Tugboats and Logistics segments and for corporate areas in Valparaiso and Santiago. (2) Tramarsa land (offices and operations) are used both for the Tugboat business and for Logistics, in Peru.
37
2014 Annual Report
Logistics
Valueadded Services
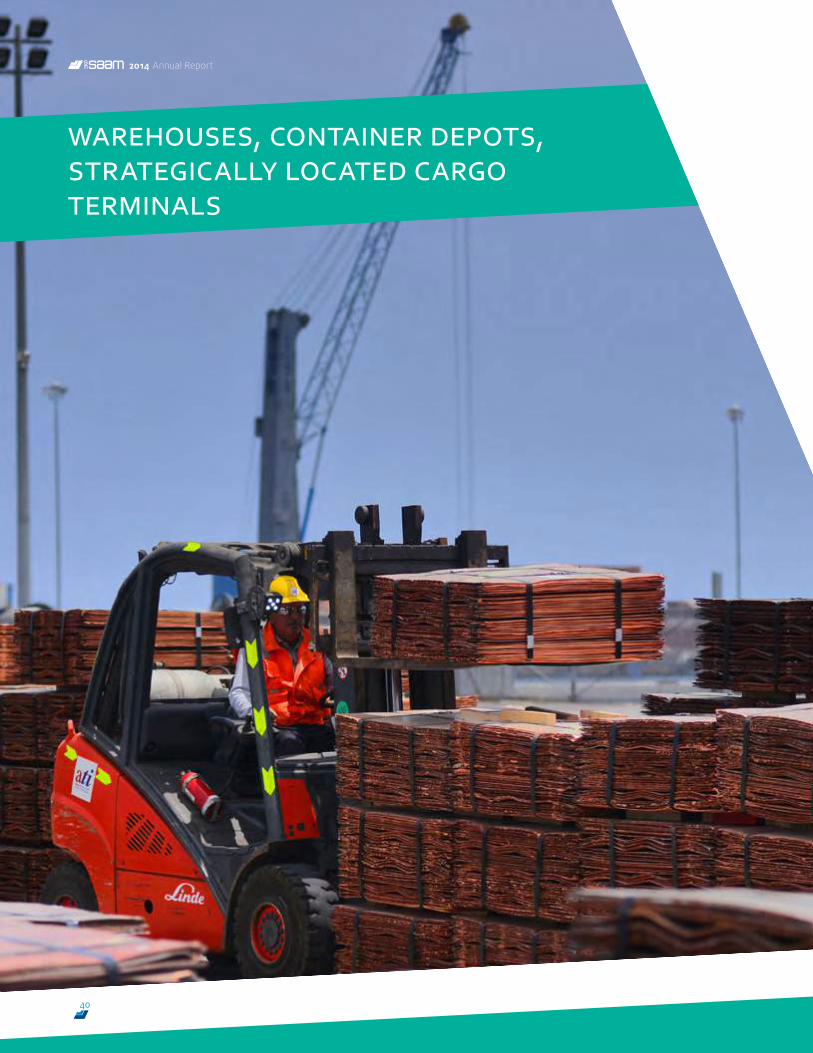
warehouses, container depots, strategically located cargo terminals
40
2014 Annual Report
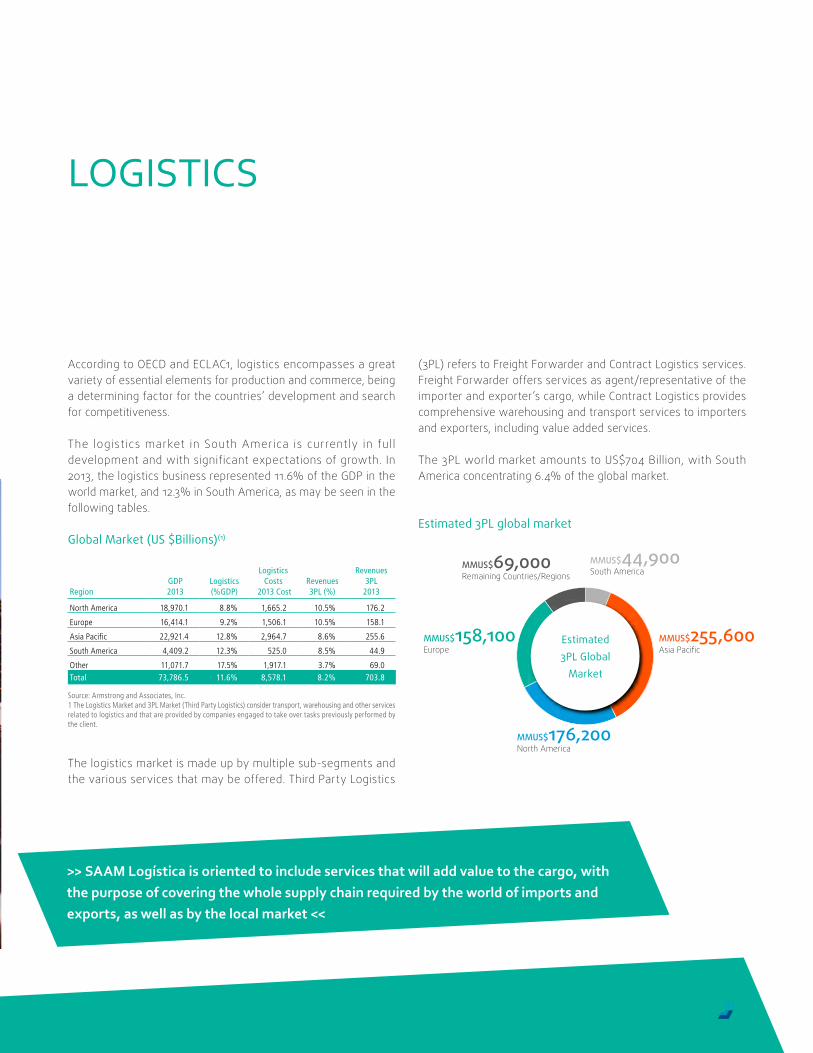
According to OECD and ECLAC1, logistics encompasses a great variety of essential elements for production and commerce, being a determining factor for the countries’ development and search for competitiveness.
The logistics market in South America is currently in full development and with significant expectations of growth. In 2013, the logistics business represented 11.6% of the GDP in the world market, and 12.3% in South America, as may be seen in the following tables.
Global Market (US $Billions)(1)
RegionGDP 2013
Logistics (%GDP)
Logistics Costs
2013 CostRevenues 3PL (%)
Revenues 3PL
2013
North America 18,970.1 8.8% 1,665.2 10.5% 176.2
Europe 16,414.1 9.2% 1,506.1 10.5% 158.1
Asia Pacific 22,921.4 12.8% 2,964.7 8.6% 255.6
South America 4,409.2 12.3% 525.0 8.5% 44.9
Other 11,071.7 17.5% 1,917.1 3.7% 69.0Total 73,786.5 11.6% 8,578.1 8.2% 703.8
Source: Armstrong and Associates, Inc. 1 The Logistics Market and 3PL Market (Third Party Logistics) consider transport, warehousing and other services related to logistics and that are provided by companies engaged to take over tasks previously performed by the client.
The logistics market is made up by multiple sub-segments and the various services that may be offered. Third Party Logistics
>> SAAM Logística is oriented to include services that will add value to the cargo, with the purpose of covering the whole supply chain required by the world of imports and exports, as well as by the local market <<
LOGISTICS
Europe Asia Pacific
North America
Remaining Countries/Regions South AmericaMMUS$69,000 MMUS$44,900
MMUS$158,100
MMUS$176,200
MMUS$255,600Estimated3PL Global
Market
(3PL) refers to Freight Forwarder and Contract Logistics services. Freight Forwarder offers services as agent/representative of the importer and exporter’s cargo, while Contract Logistics provides comprehensive warehousing and transport services to importers and exporters, including value added services.
The 3PL world market amounts to US$704 Billion, with South America concentrating 6.4% of the global market.
Estimated 3PL global market
41
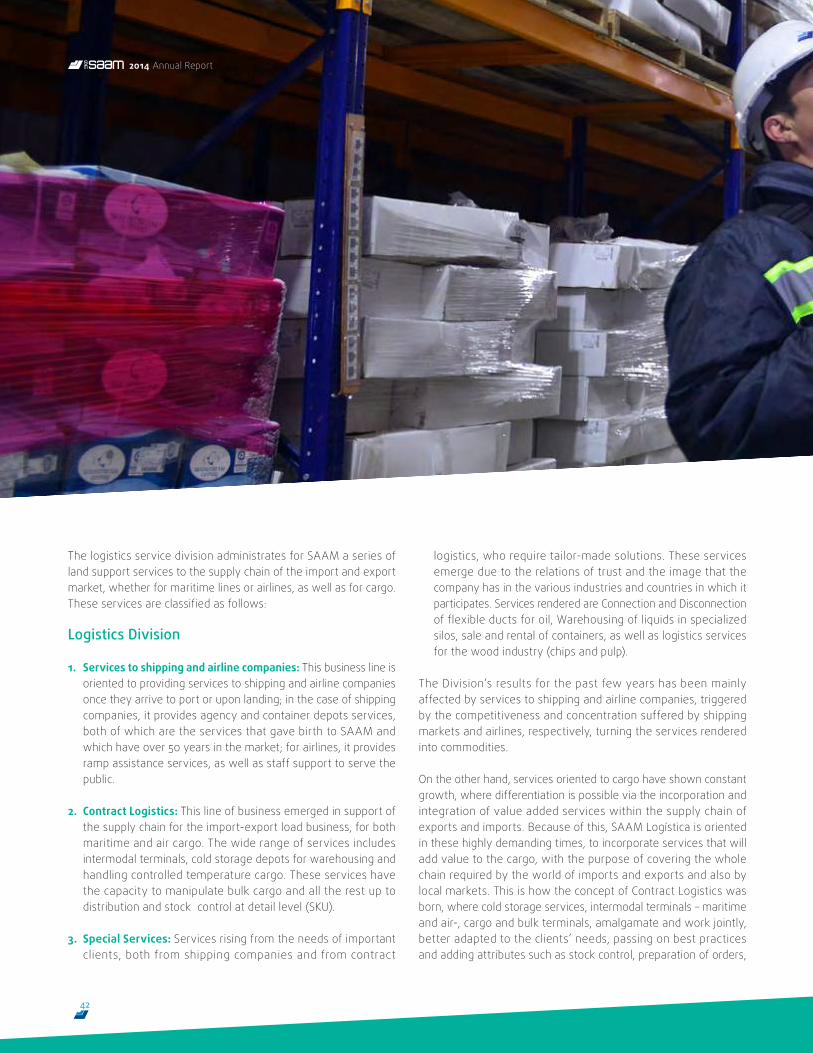
The logistics service division administrates for SAAM a series of land support services to the supply chain of the import and export market, whether for maritime lines or airlines, as well as for cargo. These services are classified as follows:
Logistics Division
1. Services to shipping and airline companies: This business line is oriented to providing services to shipping and airline companies once they arrive to port or upon landing; in the case of shipping companies, it provides agency and container depots services, both of which are the services that gave birth to SAAM and which have over 50 years in the market; for airlines, it provides ramp assistance services, as well as staff support to serve the public.
2. Contract Logistics: This line of business emerged in support of the supply chain for the import-export load business, for both maritime and air cargo. The wide range of services includes intermodal terminals, cold storage depots for warehousing and handling controlled temperature cargo. These services have the capacity to manipulate bulk cargo and all the rest up to distribution and stock control at detail level (SKU).
3. Special Services: Services rising from the needs of important clients, both from shipping companies and from contract
logistics, who require tailor-made solutions. These services emerge due to the relations of trust and the image that the company has in the various industries and countries in which it participates. Services rendered are Connection and Disconnection of flexible ducts for oil, Warehousing of liquids in specialized silos, sale and rental of containers, as well as logistics services for the wood industry (chips and pulp).
The Division’s results for the past few years has been mainly affected by services to shipping and airline companies, triggered by the competitiveness and concentration suffered by shipping markets and airlines, respectively, turning the services rendered into commodities.
On the other hand, services oriented to cargo have shown constant growth, where differentiation is possible via the incorporation and integration of value added services within the supply chain of exports and imports. Because of this, SAAM Logística is oriented in these highly demanding times, to incorporate services that will add value to the cargo, with the purpose of covering the whole chain required by the world of imports and exports and also by local markets. This is how the concept of Contract Logistics was born, where cold storage services, intermodal terminals – maritime and air-, cargo and bulk terminals, amalgamate and work jointly, better adapted to the clients’ needs, passing on best practices and adding attributes such as stock control, preparation of orders,
42
2014 Annual Report
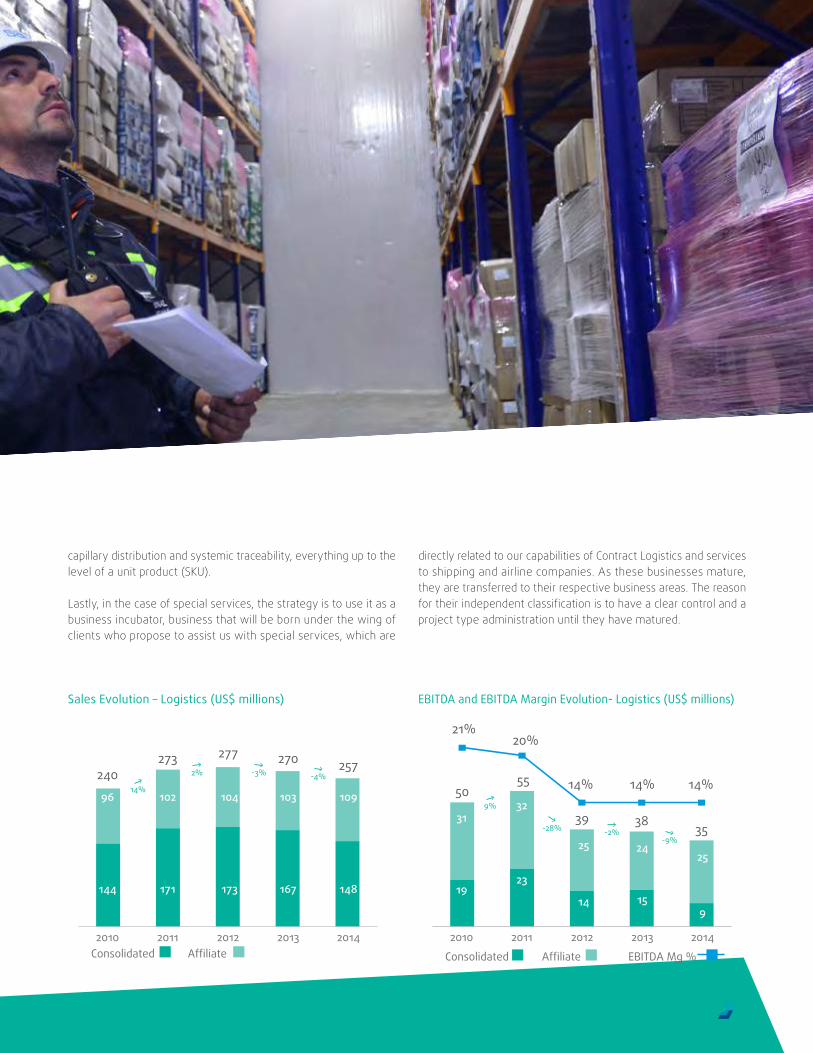
240273 277 270 257
2010 2011 2012 2013 2014Consolidated Affiliate
144 171 173 167 148
96 102 104 103 10914%
2% -3% -4%
21%20%
14% 14% 14%
2010 2011 2012 2013 2014
Consolidated Affiliate EBITDA Mg %
3132
25 2425
1923
14 159
9%
-2%-9%
-28%
5055
39 3835
Sales Evolution – Logistics (US$ millions) EBITDA and EBITDA Margin Evolution- Logistics (US$ millions)
capillary distribution and systemic traceability, everything up to the level of a unit product (SKU).
Lastly, in the case of special services, the strategy is to use it as a business incubator, business that will be born under the wing of clients who propose to assist us with special services, which are
directly related to our capabilities of Contract Logistics and services to shipping and airline companies. As these businesses mature, they are transferred to their respective business areas. The reason for their independent classification is to have a clear control and a project type administration until they have matured.
43
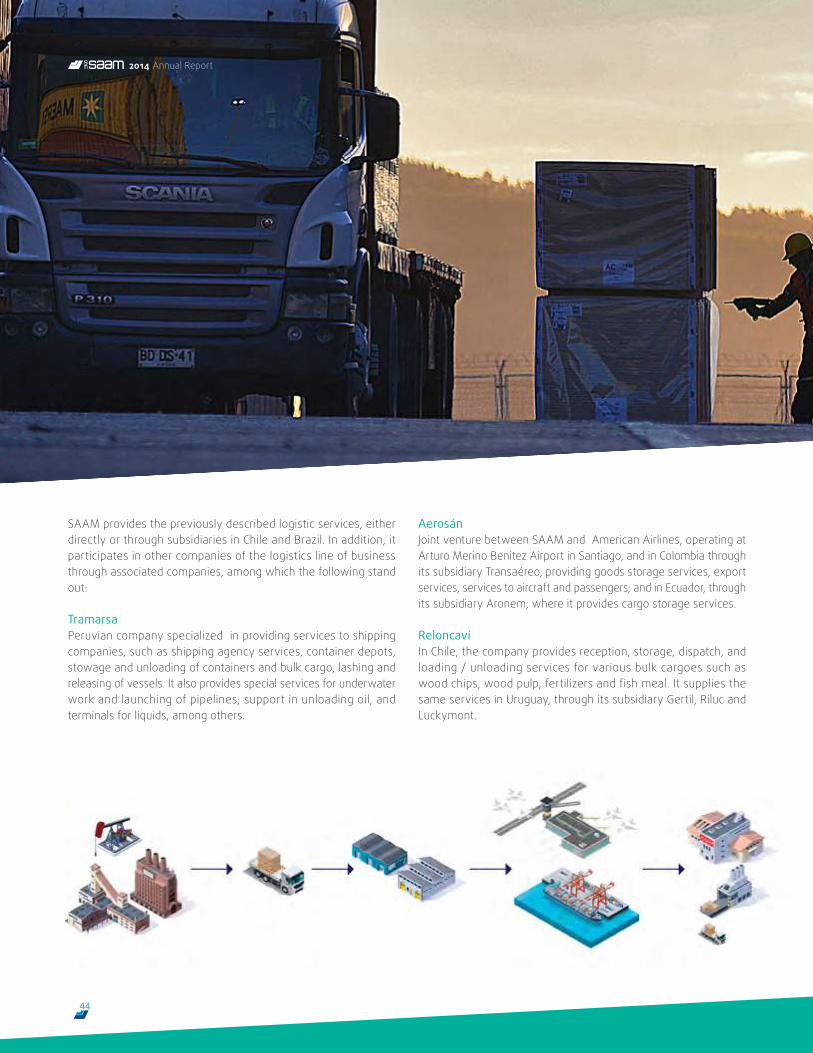
SAAM provides the previously described logistic services, either directly or through subsidiaries in Chile and Brazil. In addition, it participates in other companies of the logistics line of business through associated companies, among which the following stand out: TramarsaPeruvian company specialized in providing services to shipping companies, such as shipping agency services, container depots, stowage and unloading of containers and bulk cargo, lashing and releasing of vessels. It also provides special services for underwater work and launching of pipelines; support in unloading oil, and terminals for liquids, among others.
AerosánJoint venture between SAAM and American Airlines, operating at Arturo Merino Benitez Airport in Santiago, and in Colombia through its subsidiary Transaéreo, providing goods storage services, export services, services to aircraft and passengers; and in Ecuador, through its subsidiary Aronem, where it provides cargo storage services.
ReloncavíIn Chile, the company provides reception, storage, dispatch, and loading / unloading services for various bulk cargoes such as wood chips, wood pulp, fertilizers and fish meal. It supplies the same services in Uruguay, through its subsidiary Gertil, Riluc and Luckymont.
44
2014 Annual Report
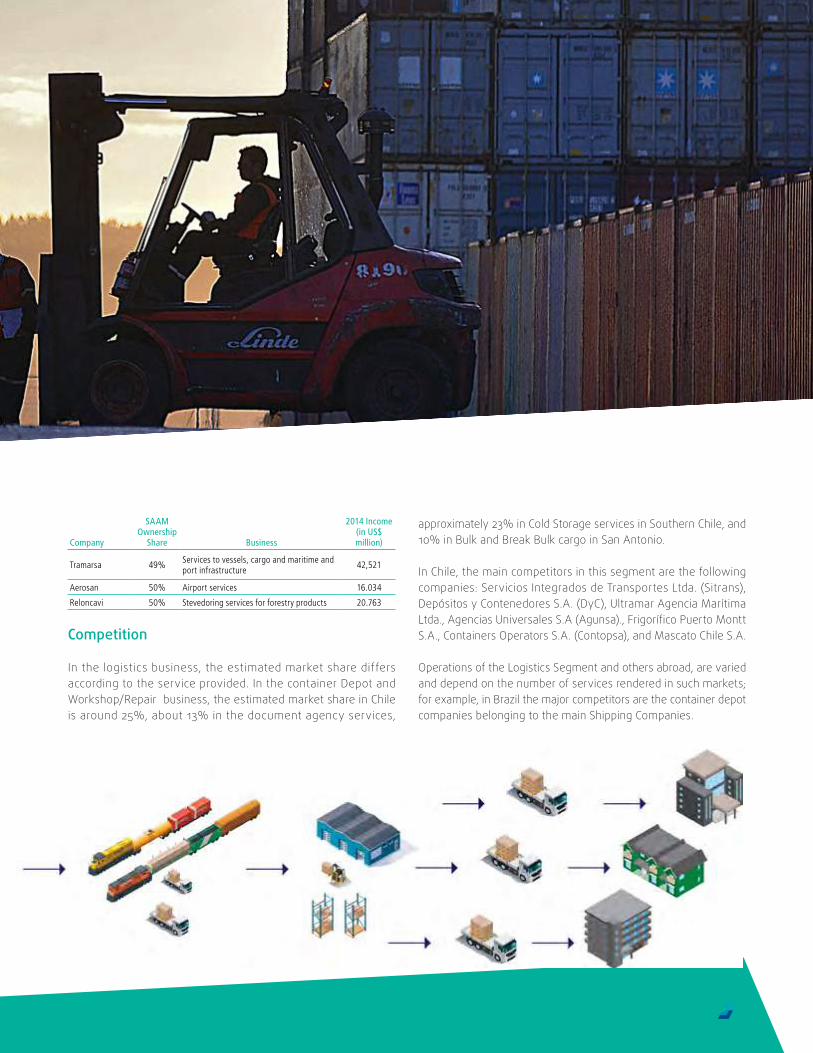
Company
SAAM Ownership
Share Business
2014 Income (in US$ million)
Tramarsa 49% Services to vessels, cargo and maritime and port infrastructure 42,521
Aerosan 50% Airport services 16.034
Reloncavi 50% Stevedoring services for forestry products 20.763
Competition
In the logistics business, the estimated market share differs according to the service provided. In the container Depot and Workshop/Repair business, the estimated market share in Chile is around 25%, about 13% in the document agency services,
approximately 23% in Cold Storage services in Southern Chile, and 10% in Bulk and Break Bulk cargo in San Antonio.
In Chile, the main competitors in this segment are the following companies: Servicios Integrados de Transportes Ltda. (Sitrans), Depósitos y Contenedores S.A. (DyC), Ultramar Agencia Marítima Ltda., Agencias Universales S.A (Agunsa)., Frigorífico Puerto Montt S.A., Containers Operators S.A. (Contopsa), and Mascato Chile S.A.
Operations of the Logistics Segment and others abroad, are varied and depend on the number of services rendered in such markets; for example, in Brazil the major competitors are the container depot companies belonging to the main Shipping Companies.
45
Clients and Suppliers Regarding the major clients of the Logistics segment, there is no one client representing more than 10% of total consolidated sales for 2014.
As to suppliers, there isn`t one representing more than 10% of the total number of purchases made in 2014 for the supply of goods and services.
Trademarks and Patents The Company and all its subsidiaries have inscribed on the Register of Trademarks their legal and commercial names, as well as those of some of its services and products.
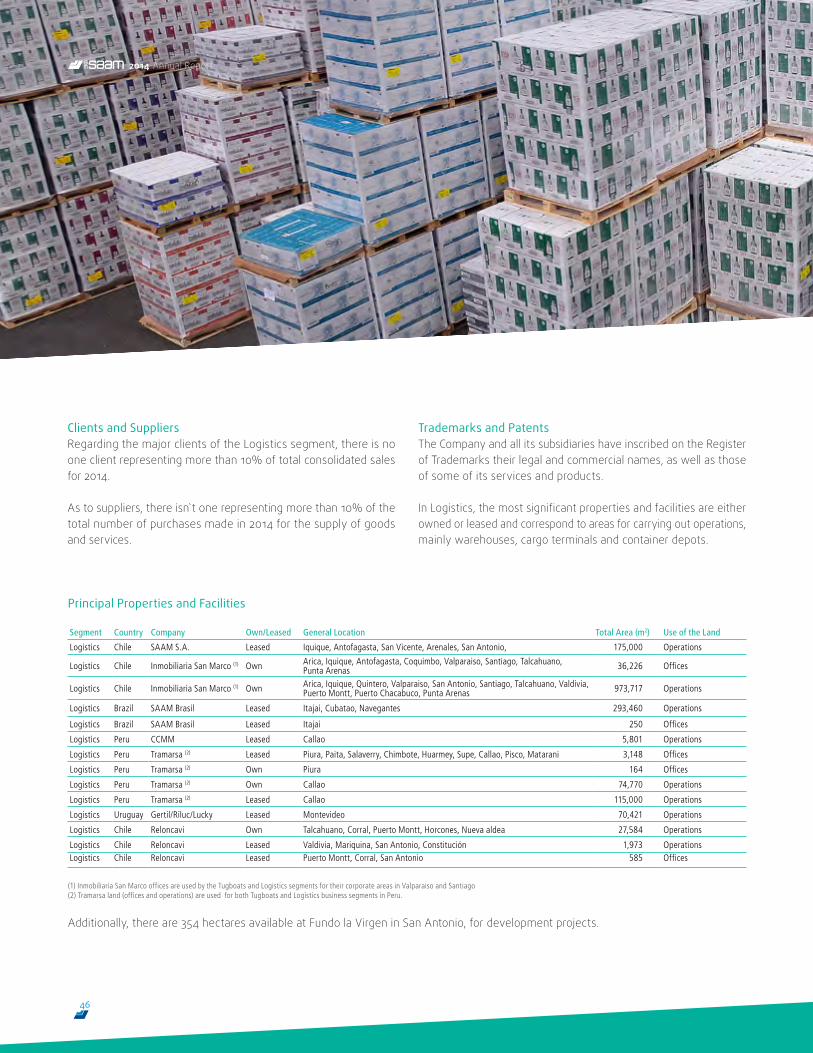
In Logistics, the most significant properties and facilities are either owned or leased and correspond to areas for carrying out operations, mainly warehouses, cargo terminals and container depots.
Principal Properties and Facilities
Segment Country Company Own/Leased General Location Total Area (m2) Use of the Land
Logistics Chile SAAM S.A. Leased Iquique, Antofagasta, San Vicente, Arenales, San Antonio, 175,000 Operations
Logistics Chile Inmobiliaria San Marco (1) Own Arica, Iquique, Antofagasta, Coquimbo, Valparaiso, Santiago, Talcahuano, Punta Arenas 36,226 Offices
Logistics Chile Inmobiliaria San Marco (1) Own Arica, Iquique, Quintero, Valparaiso, San Antonio, Santiago, Talcahuano, Valdivia, Puerto Montt, Puerto Chacabuco, Punta Arenas 973,717 Operations
Logistics Brazil SAAM Brasil Leased Itajai, Cubatao, Navegantes 293,460 Operations
Logistics Brazil SAAM Brasil Leased Itajai 250 Offices
Logistics Peru CCMM Leased Callao 5,801 Operations
Logistics Peru Tramarsa (2) Leased Piura, Paita, Salaverry, Chimbote, Huarmey, Supe, Callao, Pisco, Matarani 3,148 Offices
Logistics Peru Tramarsa (2) Own Piura 164 Offices
Logistics Peru Tramarsa (2) Own Callao 74,770 Operations
Logistics Peru Tramarsa (2) Leased Callao 115,000 Operations
Logistics Uruguay Gertil/Riluc/Lucky Leased Montevideo 70,421 Operations
Logistics Chile Reloncavi Own Talcahuano, Corral, Puerto Montt, Horcones, Nueva aldea 27,584 Operations
Logistics Chile Reloncavi Leased Valdivia, Mariquina, San Antonio, Constitución 1,973 OperationsLogistics Chile Reloncavi Leased Puerto Montt, Corral, San Antonio 585 Offices
(1) Inmobiliaria San Marco offices are used by the Tugboats and Logistics segments for their corporate areas in Valparaiso and Santiago(2) Tramarsa land (offices and operations) are used for both Tugboats and Logistics business segments in Peru.
Additionally, there are 354 hectares available at Fundo la Virgen in San Antonio, for development projects.
46
2014 Annual Report
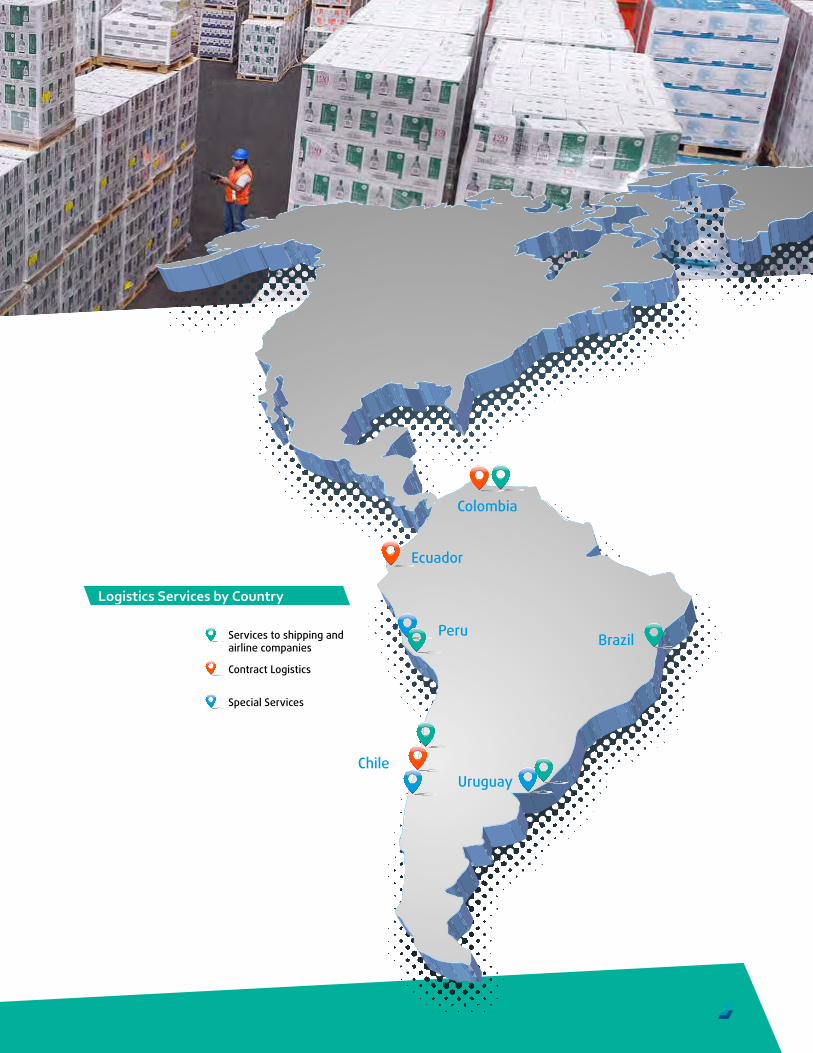
Chile
Services to shipping and airline companies
Contract Logistics
Special Services
Ecuador
Peru Brazil
Uruguay
Colombia
Logistics Services by Country
47
The main risk factors inherent to SM SAAM and subsidiaries are those of the markets in which they participate, both in Chile and abroad. They include:• Financial risks• Credit risks • Increased Competition • Skilled labor • Economic cycle
• Renewal of concessions • Risks due to political and economic conditions • Risks of accidents and natural disasters • Environmental Standards
Further detail may be found in the Management’s Analysis, in the section “Risk Factors”.
RISK FACTORS
48
2014 Annual Report
The investment policy considers mostly the constant renovation of port equipment and the fleet of tugboats, so as to have state-of-the-art technology to allow providing optimum services to ships and cargo.
At a consolidated level, investments in 2014 amounted to ThUS$84,371, of which ThUS$60,617 correspond to Tugboats, ThUS$12,490 to Port Terminals and ThUS$11,264 to investments in Logistics. In 2013, investments amounted to ThUS$79,410, corresponding mainly to investments in tugboats and civil works. Furthermore, SAAM participates in a significant number of operations through non consolidated participations (affiliate companies) whose investments IN 2014, at their proportional value, amounted to ThUS$38,040, of which ThUS$5,916 correspond
to Tugboats, ThUS$29,397 to Port Terminals and ThUS$2,727 to investments in Logistics. In 2013, SM SAAM carried out investments in affiliate companies at proportional value, for ThUS$46.762
Therefore, total investments carried out by SM SAAM in 2014, considering consolidated and affiliate companies at their proportional value, totaled ThUS$122,411 (ThUS$126,172 in 2013.)
SM SAAM’s policy is to finance itself, as far as possible, with its own resources. Specific needs of the parent company or of some subsidiary, such as reinforcement of the tugboat fleet or construction of works of infrastructure, have been covered with middle- and long-term financing (usually 7 years), in foreign currency through credit and/or financial leasing with purchase options.
INVESTMENTS
49
23
5
11
7
CHAIRMAN
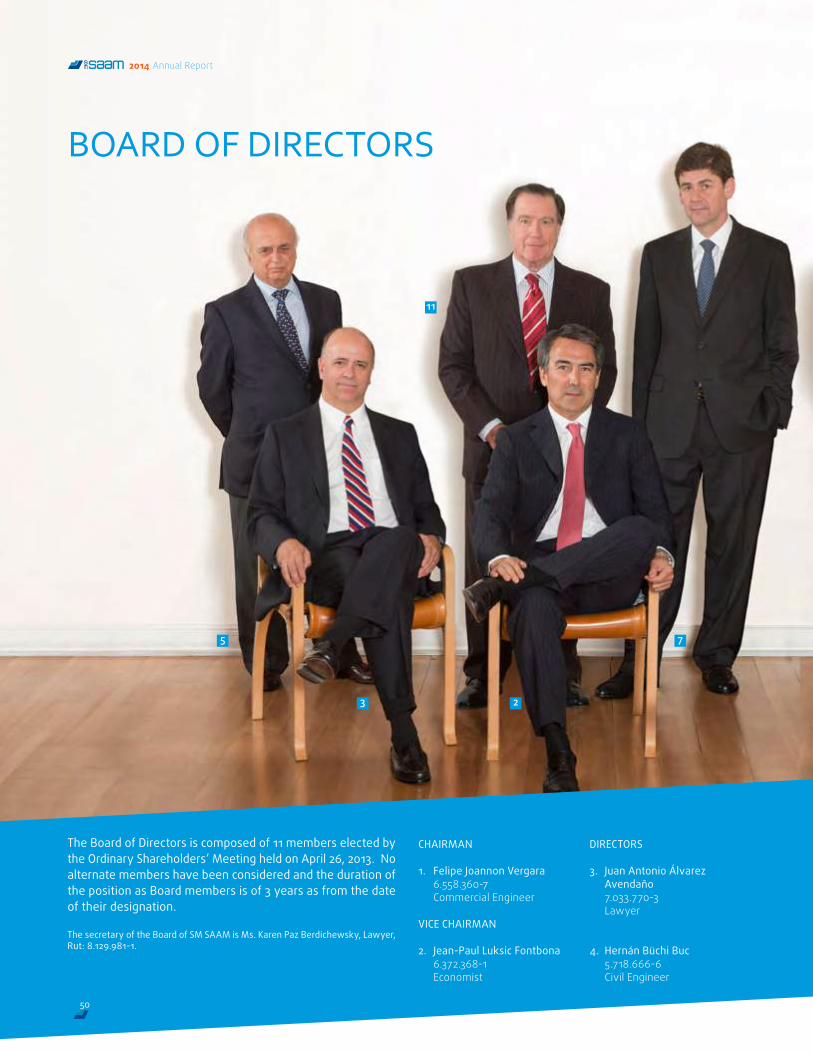
1. Felipe Joannon Vergara 6.558.360-7 Commercial Engineer
VICE CHAIRMAN
2. Jean-Paul Luksic Fontbona 6.372.368-1 Economist
DIRECTORS
3. Juan Antonio Álvarez Avendaño
7.033.770-3 Lawyer
4. Hernán Büchi Buc 5.718.666-6 Civil Engineer
The Board of Directors is composed of 11 members elected by the Ordinary Shareholders’ Meeting held on April 26, 2013. No alternate members have been considered and the duration of the position as Board members is of 3 years as from the date of their designation.
The secretary of the Board of SM SAAM is Ms. Karen Paz Berdichewsky, Lawyer, Rut: 8.129.981-1.
BOARD OF DIRECTORS
2014 Annual Report
50
1 8
10
9
4
6
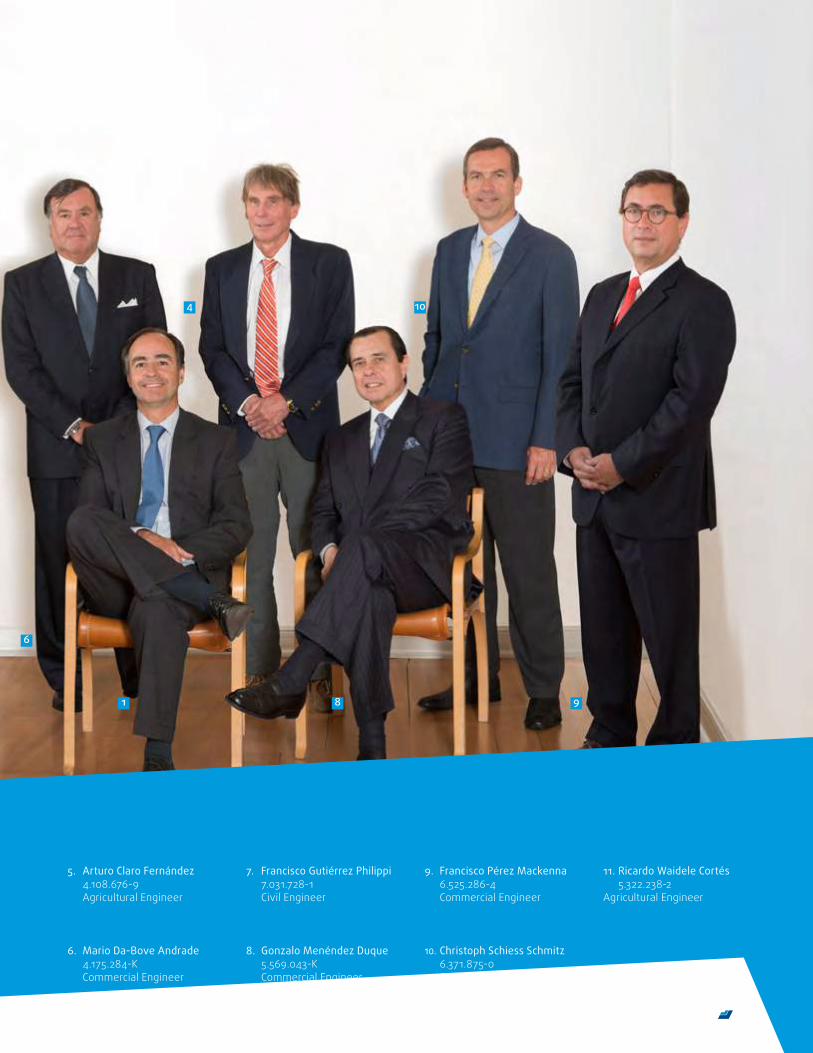
5. Arturo Claro Fernández 4.108.676-9 Agricultural Engineer
6. Mario Da-Bove Andrade 4.175.284-K Commercial Engineer
7. Francisco Gutiérrez Philippi 7.031.728-1 Civil Engineer
8. Gonzalo Menéndez Duque 5.569.043-K Commercial Engineer
9. Francisco Pérez Mackenna 6.525.286-4 Commercial Engineer
10. Christoph Schiess Schmitz 6.371.875-0 Commercial Engineer
11. Ricardo Waidele Cortés 5.322.238-2Agricultural Engineer
51
Board Remuneration
On April 4, 2014, the Ordinary Shareholders’ Meeting approved maintaining the Board’s remuneration system, consisting in an attendance allowance equivalent to 100 UF (index-linked fixed monetary unit) per Session with a monthly cap of one session, except in the case of the Chairman, who will receive twice the amount allocated to a Director for this concept, and a participation of 2% of the Company’s net profits of the 2014 exercise, without
minimum or maximum, to be distributed among the Directors in equal amounts, the Chairman receiving twice the amount perceived by the other Directors.
During the exercise ended December 31, 2014, the Company’s Board perceived ThUS$602 for the concept of allowances for attendance to Board sessions (ThUS$448 in 2013) and ThUS$1,473 for the concept of participation in Company profits (ThUS$1,283 in 2013).
Detail of Payments Received by each Director
Allowance for attendance Particip. in Net profit(ThUS$) (ThUS$)
Name RUT Relation 2014 2013 2014 2013Felipe Joannon Vergara 6.558.360-7 Chairman 100 70 214 87
Jean-Paul Luksic Fontbona 6.372.368-1 Vice Chairman 37 14 91 -
Juan Antonio Álvarez Avendaño 7.033.770-3 Director 50 42 123 116
Hernán Büchi Buc 5.718.666-6 Director 50 42 123 104
Arturo Claro Fernández 4.108.676-9 Director 41 38 123 116
Mario Da-Bove Andrade 4.175.284-K Director 56 38 123 75
Francisco Gutiérrez Philippi 7.031.728-1 Director 60 44 123 75
Gonzalo Menendez Duque 5.569.043-K Director 50 42 123 116
Francisco Pérez Mackenna 6.525.286-4 Director 56 38 123 116
Christoph Schiess Schmitz 6.371.875-0 Director 46 42 123 116
Ricardo Waidele Cortéz 5.322.238-2 Director 56 38 123 75
Guillermo Luksic Craig (+) 6.578.598-8 Ex-Chairman - - 61 203
Baltazar Sánchez Guzmán 6.060.760-5 Ex-Director - - 42
Luis Álvarez Marín 1.490.523-5 Ex-Director - - 42
Total 602 448 1,473 1,283
52
2014 Annual Report
Directors’ Committee
Sociedad Matriz SAAM S.A. Directors’ Committee was established by the Extraordinary Board Meeting held on January 23, 2013, in accordance with the provisions contained in Article 50 bis of Law 18,046. The Committee was originally composed of Messieurs Mario Da-Bove (Chairman) and Ricardo Waidele, both in the capacity of independent in accordance to the aforementioned article, and by Mr. Felipe Joannon, linked to the Controller. In April, 2013, Mr. Joannon was elected Chairman of the Board and of the Company; therefore, he resigned as member of Directors’ Committee, position that was then filled by Mr. Francisco Pérez-Mackenna.
During 2014, the Committee’s sessions were regularly attended by the General Manager Mr. Javier Bitar, the Finance and Administration Manager, Mr. Roberto Larraín, the Controller, Mr. José Andrés Calderón(*), and the Legal Counsel, Ms. Karen Paz Berdichewsky.(*)Jose Andrés Calderon retired from the Company in December, 2014.
Detail of Compensations perceived by each Committee memberThe Ordinary Shareholders’ Meeting of Sociedad Matriz SAAM S.A. held on April 5, 2014, established a remuneration for each Director member of the Directors’ Committee, consisting in an additional third of the remuneration received by regular Directors, which would be an allowance equivalent to 33.34 UF (indexed-linked fixed monetary unit) per Session with a monthly cap of one session, and a variable allowance equivalent to a third of the participation in Company profits for the year 2014, due to him/her as Director.
During the exercise ended December 31, 2014, the Directors’ Committee of the Company perceived ThUS$45 for the concept of allowances for attendance to sessions (ThUS$51 in 2013) and ThUS$120 for the concept of participation in Company profits (ThUS$0 in 2013).
Directors’ Committee Activities During 2014, the Committee focused on the exercise of their powers and duties established in Article 50 bis, of Law N° 18.046, carrying out the following activities:
1. Reviewed the Consolidated Financial Statements of Sociedad Matriz SAAM S.A. and Subsidiary, as well as the Report of External Auditors about them, all corresponding to the year ending December 31, 2013, and with respect to which the Committee expressed a favorable opinion prior to their presentation to the shareholders for their approval. Likewise,
the Committee examined the Consolidated Financial Statements of the Company and Subsidiary for the three quarters ending in March, June and September, 2014, without objections.
2. The Committee proposed to the Board of Directors appointing KPMG Auditores & Consultores Limitada as the external audit company in charge of examining accounting records, inventory, balance sheets and the rest of the financial statements during the 2014 exercise, to subsequently propose it to the Ordinary Shareholders’ Meeting. Likewise, it proposed maintaining the Risk Rating Agencies: Feller-Rate Clasificadora de Riesgo Limitada and Clasificadora de Riesgo Humphreys Limitada.
3. Examined the information concerning operations with related parties in which the Company and its subsidiaries had intervened, referred to in Title XVI of Law N° 18.046 and reported to the Board regarding these matters. Operations reviewed by the Committee, prior to their examination and approval by the Board of Directors, were the following: i) Transfer participation of Compañía Sud Americana de Vapores
S.A. (CSAV) in companies of the SM SAAM group.ii) Provide data transmission services through AGMA SAP to
CSAV and leasing of real estate in Iquique, Antofagasta and Talcahuano.
iii) Sale of industrial property “Las Golondrinas” to Transportes CCU Limitada.
iv) Submission of bids in public tenders summoned by Minera Esperanza S.A. and Minera Los Pelambres S.A.
v) Termination of the Memorandum of Agreement dated 2005 with CSAV, which regulated the provision of container depot services in Cubatao, Brazil; signing a new contract for the same service, and entering into a Maritime Agency Services contract for reefer ships and car carriers.
vi) Rental Agreement for CSAV corporate offices.
4. Analyzed remunerations policy and compensation plans for Managers and Senior Executives.
5. Furthermore, the Committee approved the annual internal audit plan for 2014 and acknowledged the results obtained by it.
The Directors’ Committee did not contract advisory services nor did it incur in additional expenditures for this concept and, furthermore, did not deem necessary to submit any type of recommendations to Company Shareholders.
Detail of Remunerations perceived by each of the members
Allowance for attending Committee Particip. in Net profit(ThUS$) (ThUS$) Dates in this Position
Name RUT Relation 2014 2013 2014 2013 Incorporated LeftMario Da-Bove Andrade 4.175.284-K Independent Director 15 17 40 - 13-01-20 -Francisco Pérez Mackenna 6.525.286-4 Independent Director 15 12 30 - 13-04-26 -Ricardo Waidele Cortéz 5.322.238-2 No Independent Director 15 17 40 - 13-01-26 -Felipe Joannon Vergara 6.558.360-7 No Independent Director - 5 10 - 13-01-23 14-04-26
Total 45 51 120 -
53
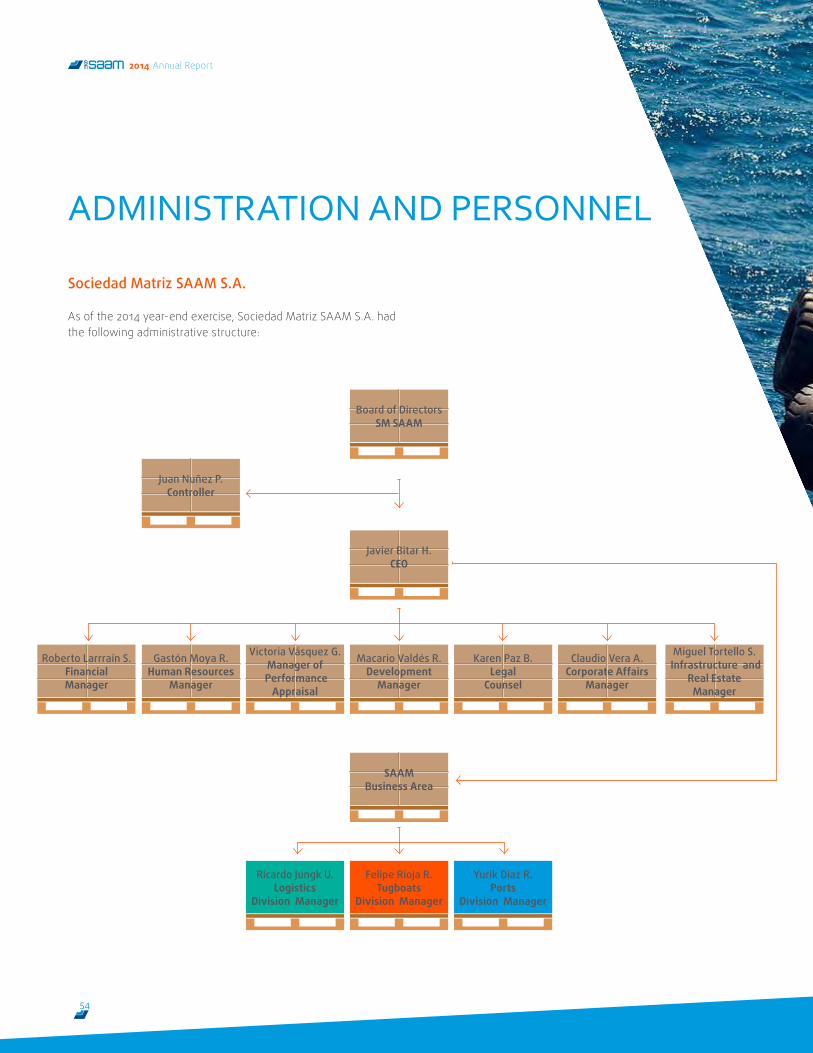
ADMINISTRATION AND PERSONNEL
Gastón Moya R.Human Resources
Manager
Roberto Larrraín S.FinancialManager
Victoria Vásquez G.Manager of
Performance Appraisal
Ricardo Jungk U.Logistics
Division Manager
Javier Bitar H.CEO
Board of DirectorsSM SAAM
Juan Nuñez P.Controller
Macario Valdés R.Development
Manager
SAAMBusiness Area
Felipe Rioja R.Tugboats
Division Manager
Karen Paz B.Legal
Counsel
Yurik Diaz R.Ports
Division Manager
Claudio Vera A.Corporate Affairs
Manager
Miguel Tortello S. Infrastructure and
Real EstateManager
Sociedad Matriz SAAM S.A.
As of the 2014 year-end exercise, Sociedad Matriz SAAM S.A. had the following administrative structure:
54
2014 Annual Report
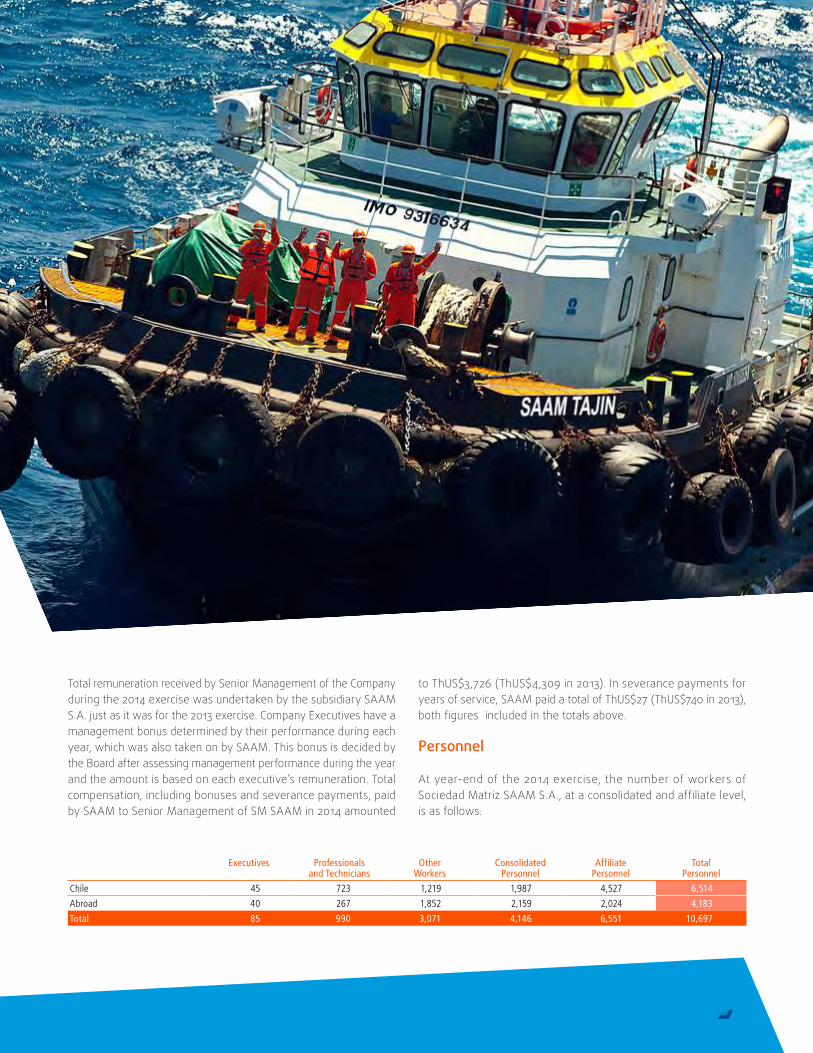
Total remuneration received by Senior Management of the Company during the 2014 exercise was undertaken by the subsidiary SAAM S.A. just as it was for the 2013 exercise. Company Executives have a management bonus determined by their performance during each year, which was also taken on by SAAM. This bonus is decided by the Board after assessing management performance during the year and the amount is based on each executive’s remuneration. Total compensation, including bonuses and severance payments, paid by SAAM to Senior Management of SM SAAM in 2014 amounted
to ThUS$3,726 (ThUS$4,309 in 2013). In severance payments for years of service, SAAM paid a total of ThUS$27 (ThUS$740 in 2013), both figures included in the totals above.
Personnel
At year-end of the 2014 exercise, the number of workers of Sociedad Matriz SAAM S.A., at a consolidated and affiliate level, is as follows:
Executives Professionalsand Technicians
Other Workers
Consolidated Personnel
AffiliatePersonnel
TotalPersonnel
Chile 45 723 1,219 1,987 4,527 6,514
Abroad 40 267 1,852 2,159 2,024 4,183
Total 85 990 3,071 4,146 6,551 10,697
55
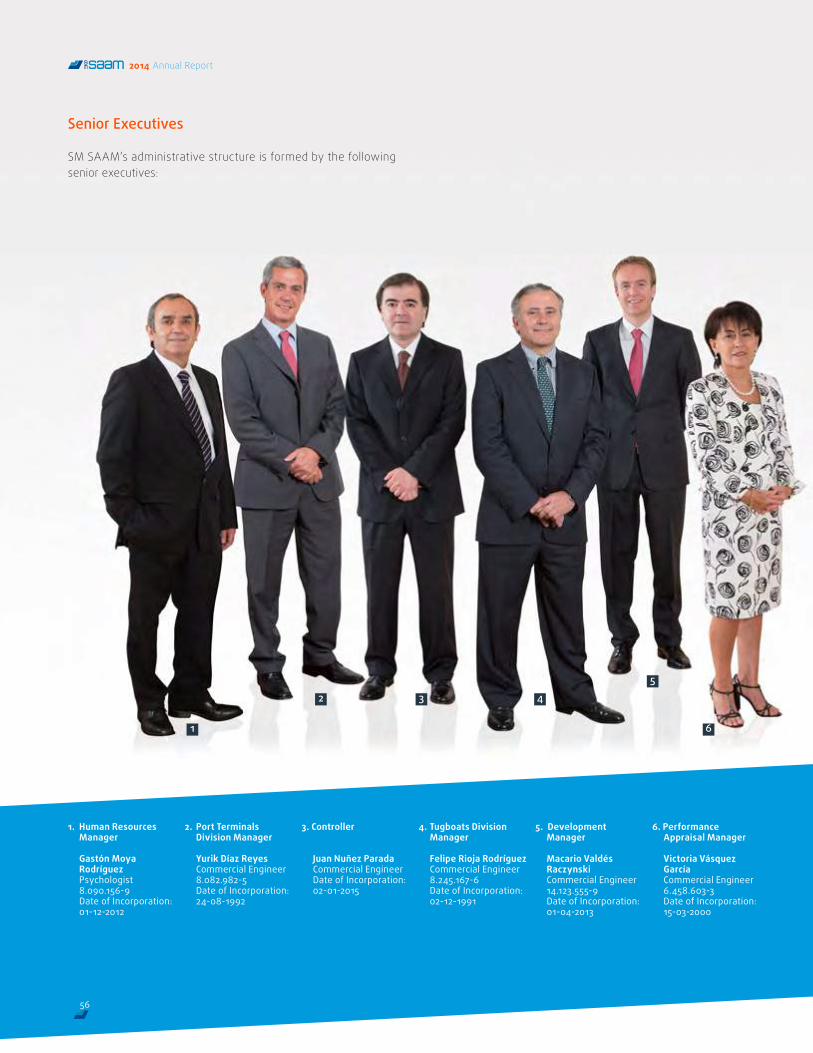
1. Human Resources Manager
Gastón Moya Rodríguez
Psychologist 8.090.156-9 Date of Incorporation: 01-12-2012
2. Port Terminals Division Manager
Yurik Díaz Reyes Commercial Engineer 8.082.982-5 Date of Incorporation: 24-08-1992
3. Controller
Juan Nuñez Parada Commercial Engineer Date of Incorporation: 02-01-2015
4. Tugboats Division Manager
Felipe Rioja Rodríguez Commercial Engineer 8.245.167-6 Date of Incorporation: 02-12-1991
5. Development Manager
Macario Valdés Raczynski
Commercial Engineer 14.123.555-9 Date of Incorporation: 01-04-2013
6. Performance Appraisal Manager
Victoria Vásquez García
Commercial Engineer 6.458.603-3 Date of Incorporation: 15-03-2000
Senior Executives
SM SAAM’s administrative structure is formed by the following senior executives:
2
1
3
6
4
5
2014 Annual Report
56
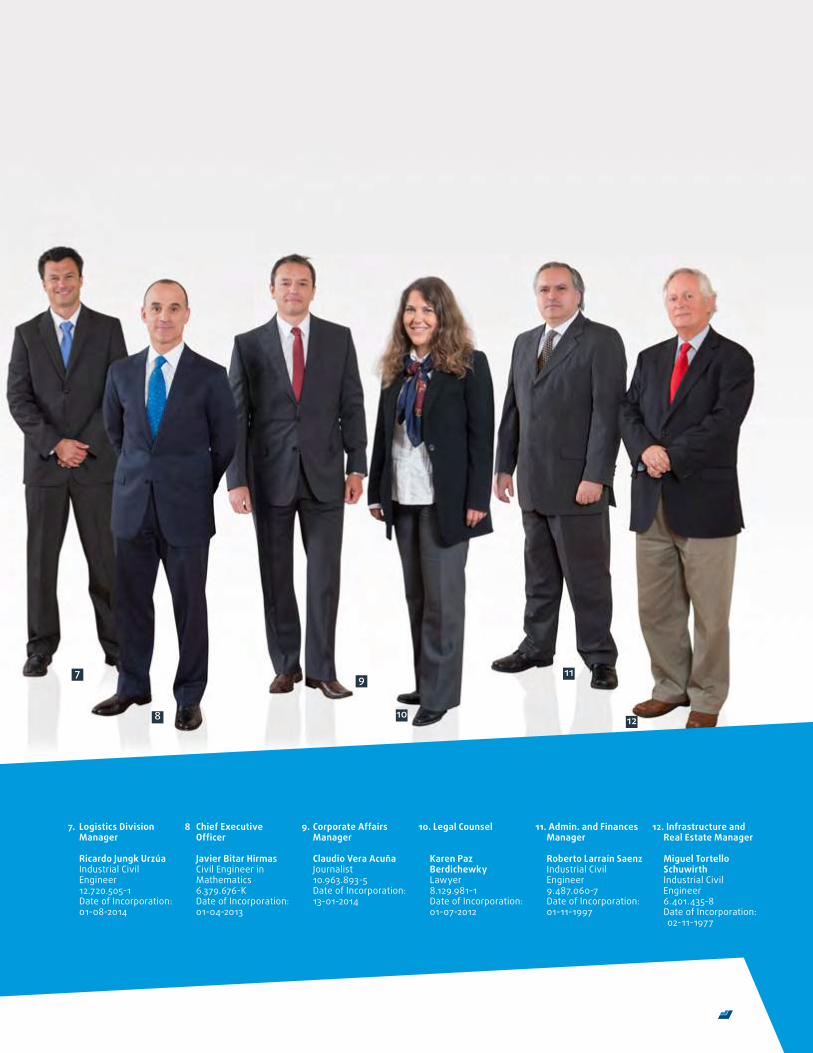
7. Logistics Division Manager
Ricardo Jungk Urzúa Industrial Civil
Engineer 12.720.505-1 Date of Incorporation: 01-08-2014
8 Chief Executive Officer
Javier Bitar Hirmas Civil Engineer in
Mathematics 6.379.676-K Date of Incorporation:
01-04-2013
9. Corporate Affairs Manager
Claudio Vera Acuña Journalist 10.963.893-5 Date of Incorporation: 13-01-2014
10. Legal Counsel
Karen Paz
Berdichewky Lawyer 8.129.981-1 Date of Incorporation: 01-07-2012
11. Admin. and Finances Manager
Roberto Larraín Saenz Industrial Civil
Engineer 9.487.060-7 Date of Incorporation: 01-11-1997
12. Infrastructure and Real Estate Manager
Miguel Tortello
Schuwirth Industrial Civil
Engineer 6.401.435-8 Date of Incorporation: 02-11-1977
7
8
11
10 12
9
57
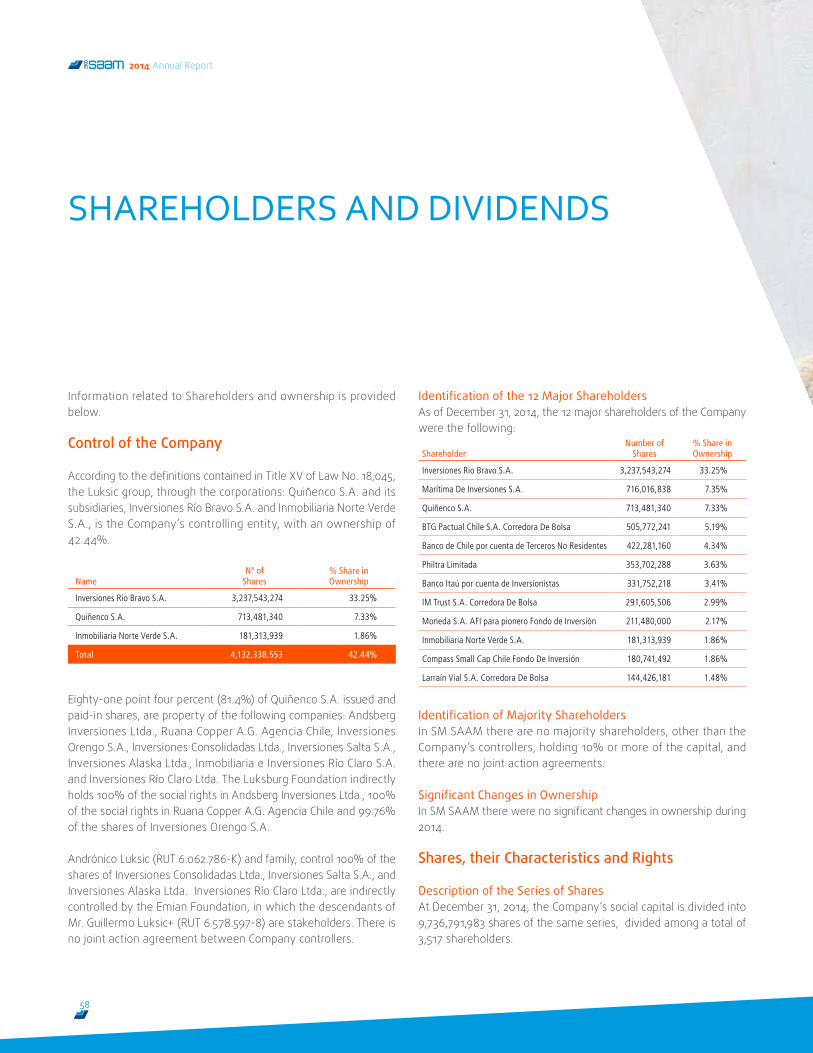
Information related to Shareholders and ownership is provided below.
Control of the Company
According to the definitions contained in Title XV of Law No. 18,045, the Luksic group, through the corporations: Quiñenco S.A. and its subsidiaries, Inversiones Río Bravo S.A. and Inmobiliaria Norte Verde S.A., is the Company’s controlling entity, with an ownership of 42.44%.
NameNº of
Shares% Share inOwnership
Inversiones Rio Bravo S.A. 3,237,543,274 33.25%
Quiñenco S.A. 713,481,340 7.33%
Inmobiliaria Norte Verde S.A. 181,313,939 1.86%
Total 4,132,338,553 42.44%
Eighty-one point four percent (81.4%) of Quiñenco S.A. issued and paid-in shares, are property of the following companies: Andsberg Inversiones Ltda., Ruana Copper A.G. Agencia Chile, Inversiones Orengo S.A., Inversiones Consolidadas Ltda., Inversiones Salta S.A., Inversiones Alaska Ltda., Inmobiliaria e Inversiones Río Claro S.A. and Inversiones Río Claro Ltda. The Luksburg Foundation indirectly holds 100% of the social rights in Andsberg Inversiones Ltda., 100% of the social rights in Ruana Copper A.G. Agencia Chile and 99.76% of the shares of Inversiones Orengo S.A.
Andrónico Luksic (RUT 6.062.786-K) and family, control 100% of the shares of Inversiones Consolidadas Ltda., Inversiones Salta S.A., and Inversiones Alaska Ltda. Inversiones Río Claro Ltda., are indirectly controlled by the Emian Foundation, in which the descendants of Mr. Guillermo Luksic+ (RUT 6.578.597-8) are stakeholders. There is no joint action agreement between Company controllers.
Identification of the 12 Major Shareholders As of December 31, 2014, the 12 major shareholders of the Company were the following:
ShareholderNumber of
Shares% Share in Ownership
Inversiones Rio Bravo S.A. 3,237,543,274 33.25%
Marítima De Inversiones S.A. 716,016,838 7.35%
Quiñenco S.A. 713,481,340 7.33%
BTG Pactual Chile S.A. Corredora De Bolsa 505,772,241 5.19%
Banco de Chile por cuenta de Terceros No Residentes 422,281,160 4.34%
Philtra Limitada 353,702,288 3.63%
Banco Itaú por cuenta de Inversionistas 331,752,218 3.41%
IM Trust S.A. Corredora De Bolsa 291,605,506 2.99%
Moneda S.A. AFI para pionero Fondo de Inversión 211,480,000 2.17%
Inmobiliaria Norte Verde S.A. 181,313,939 1.86%
Compass Small Cap Chile Fondo De Inversión 180,741,492 1.86%
Larraín Vial S.A. Corredora De Bolsa 144,426,181 1.48%
Identification of Majority Shareholders In SM SAAM there are no majority shareholders, other than the Company’s controllers, holding 10% or more of the capital, and there are no joint action agreements.
Significant Changes in Ownership In SM SAAM there were no significant changes in ownership during 2014.
Shares, their Characteristics and Rights
Description of the Series of Shares At December 31, 2014, the Company’s social capital is divided into 9,736,791,983 shares of the same series, divided among a total of 3,517 shareholders.
SHAREHOLDERS AND DIVIDENDS
58
2014 Annual Report
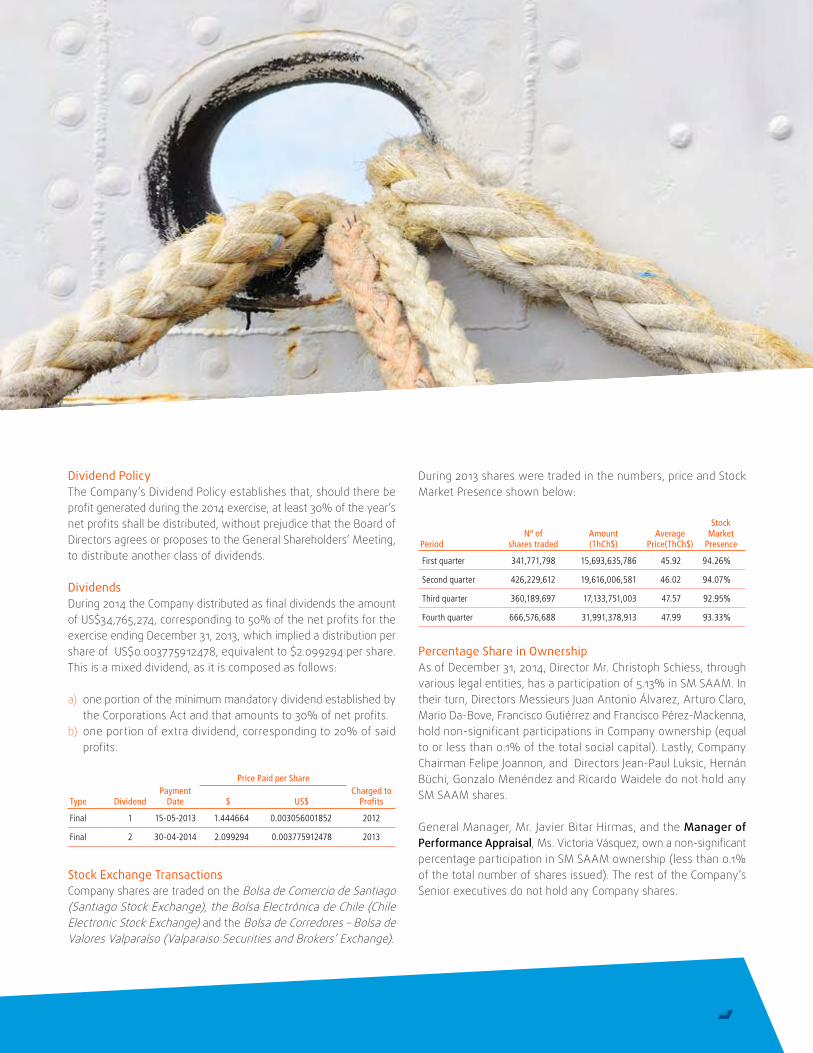
Dividend Policy The Company’s Dividend Policy establishes that, should there be profit generated during the 2014 exercise, at least 30% of the year’s net profits shall be distributed, without prejudice that the Board of Directors agrees or proposes to the General Shareholders’ Meeting, to distribute another class of dividends.
DividendsDuring 2014 the Company distributed as final dividends the amount of US$34,765,274, corresponding to 50% of the net profits for the exercise ending December 31, 2013, which implied a distribution per share of US$0.003775912478, equivalent to $2.099294 per share. This is a mixed dividend, as it is composed as follows:
a) one portion of the minimum mandatory dividend established by the Corporations Act and that amounts to 30% of net profits.
b) one portion of extra dividend, corresponding to 20% of said profits.
Price Paid per Share
Type DividendPayment
Date $ US$Charged to
Profits
Final 1 15-05-2013 1.444664 0.003056001852 2012
Final 2 30-04-2014 2.099294 0.003775912478 2013
Stock Exchange Transactions Company shares are traded on the Bolsa de Comercio de Santiago (Santiago Stock Exchange), the Bolsa Electrónica de Chile (Chile Electronic Stock Exchange) and the Bolsa de Corredores – Bolsa de Valores Valparaíso (Valparaiso Securities and Brokers’ Exchange).
During 2013 shares were traded in the numbers, price and Stock Market Presence shown below:
PeriodNº of
shares tradedAmount(ThCh$)
Average Price(ThCh$)
Stock Market
Presence
First quarter 341,771,798 15,693,635,786 45.92 94.26%
Second quarter 426,229,612 19,616,006,581 46.02 94.07%
Third quarter 360,189,697 17,133,751,003 47.57 92.95%
Fourth quarter 666,576,688 31,991,378,913 47.99 93.33%
Percentage Share in Ownership As of December 31, 2014, Director Mr. Christoph Schiess, through various legal entities, has a participation of 5.13% in SM SAAM. In their turn, Directors Messieurs Juan Antonio Álvarez, Arturo Claro, Mario Da-Bove, Francisco Gutiérrez and Francisco Pérez-Mackenna, hold non-significant participations in Company ownership (equal to or less than 0.1% of the total social capital). Lastly, Company Chairman Felipe Joannon, and Directors Jean-Paul Luksic, Hernán Büchi, Gonzalo Menéndez and Ricardo Waidele do not hold any SM SAAM shares.
General Manager, Mr. Javier Bitar Hirmas, and the Manager of Performance Appraisal, Ms. Victoria Vásquez, own a non-significant percentage participation in SM SAAM ownership (less than 0.1% of the total number of shares issued). The rest of the Company’s Senior executives do not hold any Company shares.
59
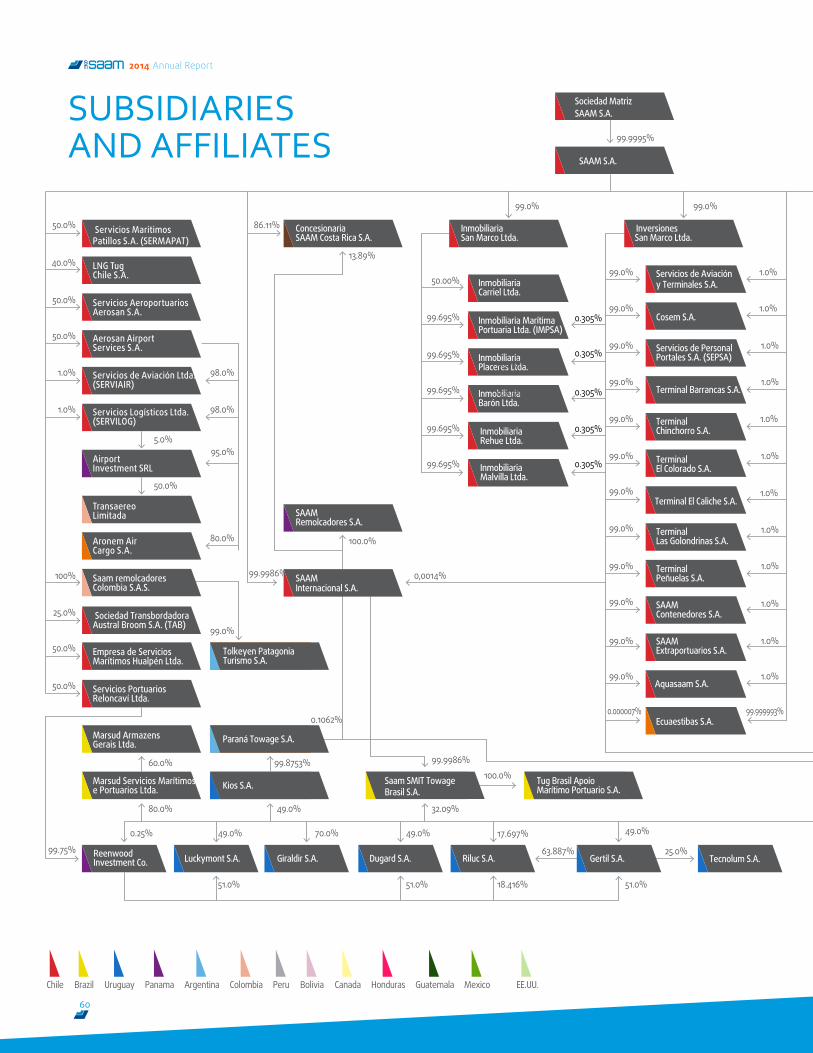
Servicios de Aviación Ltda.(SERVIAIR)
Servicios Logísticos Ltda.(SERVILOG)
LNG Tug Chile S.A.
Servicios Aeroportuarios Aerosan S.A.
Aerosan Airport Services S.A.
Servicios Maritimos Patillos S.A. (SERMAPAT)
TransaereoLimitada
Aronem AirCargo S.A.
AirportInvestment SRL
Saam remolcadoresColombia S.A.S.
Riluc S.A. Tecnolum S.A.
Marsud Armazens Gerais Ltda.
Equimac S.A.
InversionesSan Marco Ltda.
Sociedad Transbordadora Austral Broom S.A. (TAB)
Inmobiliaria Marítima Portuaria Ltda. (IMPSA)
Inmobiliaria Barón Ltda.
Inmobiliaria Placeres Ltda.
Tolkeyen Patagonia Turismo S.A.
Inmobiliaria Malvilla Ltda.
Inmobiliaria Carriel Ltda.
ConcesionariaSAAM Costa Rica S.A.
SAAMRemolcadores S.A.
Inmobiliaria Rehue Ltda.
Sociedad Matriz SAAM S.A.
InmobiliariaSan Marco Ltda.
SAAM Extraportuarios S.A.
Ecuaestibas S.A.
Kios S.A.
Paraná Towage S.A.
Reenwood Investment Co.
Tug Brasil Apoio Marítimo Portuario S.A.
Saam SMIT Towage Brasil S.A.
Luckymont S.A. Giraldir S.A.
Marsud Servicios Marítimos e Portuarios Ltda.
Dugard S.A. Gertil S.A.
Cosem S.A.
Terminal El Colorado S.A.
Terminal El Caliche S.A.
Aquasaam S.A.
Terminal Las Golondrinas S.A.
Servicios de Aviación y Terminales S.A.
Servicios de Personal Portales S.A. (SEPSA)
Terminal Peñuelas S.A.
SAAMContenedores S.A.
Terminal Chinchorro S.A.
SAAM Internacional S.A.
Empresa de Servicios Marítimos Hualpén Ltda.
Servicios Portuarios Reloncaví Ltda.
Elequip S.A.
Terminal Barrancas S.A.
SAAM S.A.
Inversiones Alaria S.A.
SAAM Puertos S.A.
Inversiones Habsburgo S.A.
Inarpi S.A.
SAAM Do Brasil Ltda.
G-Star Capital Inc.
Limoly S.A.
Inversiones Navieras SAC
Construcciones Modulares S.A.
Trabajos Marítimos S.A. (Tramarsa) Logística Petrolera
del Oriente S.A.
Juan Paulo Quay S.A.C.
Logística de Químicos del SUR S.A.C.
Almacén PacíficoSur S.A.
Kemfa Servicios, Inversiones y Representaciones SA
Inversiones Misti S.A.
Puerto Buenavista S.A.
Muellaje del Loa S.A. Terminal Puerto Arica S.A.
Muellaje del MaipoS.A.
SAAM Guatemala S.A.
Serv Port y Extraport Bío Bío Ltda.
SAAM Remolcadores S.A. de C.V.
Virtual Logistics Marine Services Inc.
Smit Canada Holdings Inc.
Smit Harbour Towage Vancouver Inc.
Smit Marine Canada Inc.
Smit Harbour Towage Westminster Inc.
Smit Harbour Towage Northern BC., Inc.
Minera Piura S.R.L.
ExpertajesMarítimos S.A.
Saam Remolques Honduras S.A.
San Antonio Terminal Internacional S.A. Muellaje STI S.A.
Florida International Terminal LLC
Portuaria Corral S.A.
Iquique Terminal Internacional S.A. Muellaje ITI S.A.
SAAM Florida Inc.San Vicente Terminal Internacional S.A. Muellaje SVTI S.A.
Inmobiliaria Sepbio Ltda.
Antofagasta Terminal Internacional S.A. Muellaje ATI S.A.
Recursos Portuarios Mazatlán S.A. de C.V.
Recursos Portuarios S.A. de C.V.
Terminal MarítimaMazatlán S.A. de C.V.
SAAM SMIT Towage México S.A. de C.V.
Transportes Fluviales Corral S.A.
80.0%
100%
50.0%
5.0%
98.0%
40.0%
50.0%
50.0%
50.0%
1.0%
1.0%
95.0%
50.0%
60.0%
50.0%
25.0%
99.0%
99.9986%
99.9986%
0.1062%
0.25%
80.0%
99.75%
99.8753%
49.0%
51.0%51.0%
17.697%49.0%
32.09%
49.0%
100.0%
70.0%
18.416%
25.0%63.887%
51.0%
49.0%
100.0%
84.5%
50.00%
99.695%
99.695%
99.695%
99.695%
99.695%
99.0%
0,305%
0,305%
0.305%
0.305%
0.305%
0.305%
0.305%
1.0%
99.0% 99.0%
99.9995%
1.0%
1.0%
1.0%
1.0%
1.0%
1.0%
1.0%
1.0%
1.0%
1.0%
1.0%
99.999993%
99.0%
99.0%
99.0%
99.0%
99.0%
99.0%
99.0%
99.0%
99.0%
99.0%
99.0%
0.000007%
0,0014%
98.0%
86.11%
13.89%
50.0%
49.8%
15.5%
0.25%99.75%
85.0% 99.5% 0.5%
70.0%
50.0%1.0%
100%
0.62%
1.0%
0,0003%
99.384%
98.0%
0.5%
0.5%
0.5%
0.5%
99.5%
99.5%
99.5%
99.0%
50.0%
50.0%
35.0%
15.0%
50.0%
50.0%
50.0%
50.0%
33.33%
0.0111%
99.9889%
0,925926%99.074074%
70.0%
70.0%
99.38%
99.0%
99.9997%
50.0%
2.0%
100%
0.616%
100%
100%
100%
50.8% 49.2%
100%
100%
100%
100%
97.75%
40.00%98.75%
0.63%
0.01%
49.0%
9.97%80.06%
99.97%50.00%
69.99%
49.0%
50.0%
Chile Brazil Uruguay Panama Argentina Colombia Peru Bolivia Canada Honduras Guatemala Mexico EE.UU.
SUBSIDIARIESAND AFFILIATES
60
2014 Annual Report
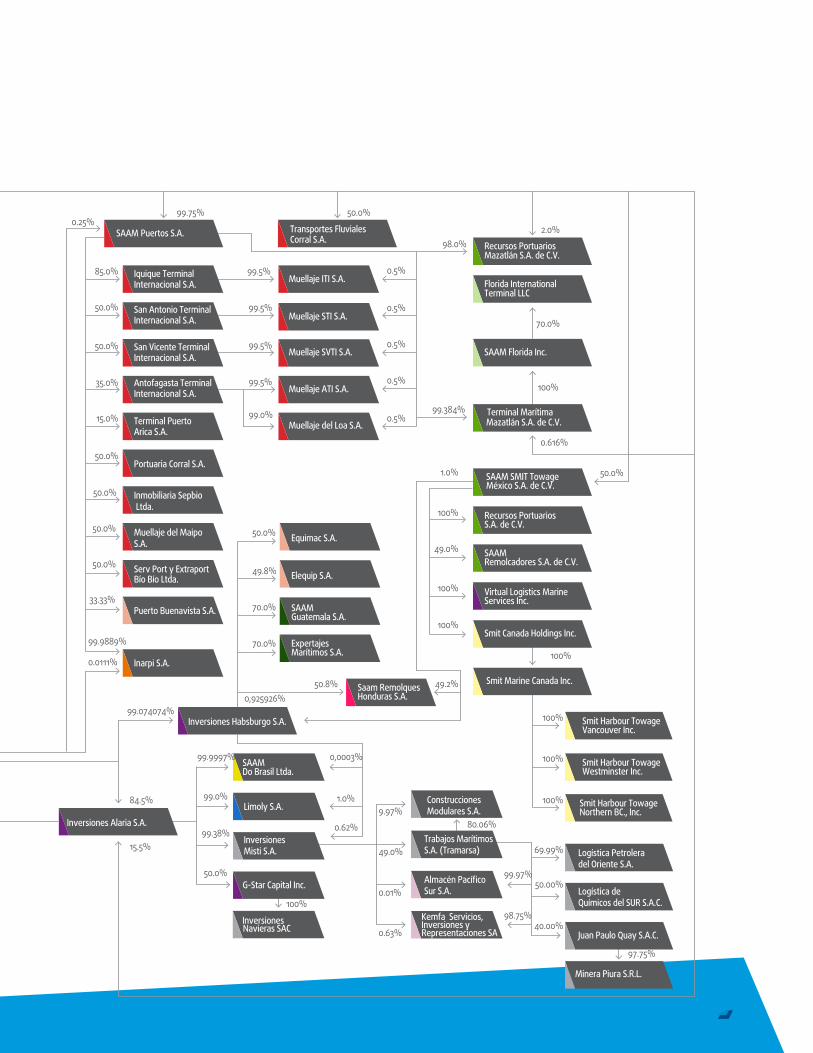
Servicios de Aviación Ltda.(SERVIAIR)
Servicios Logísticos Ltda.(SERVILOG)
LNG Tug Chile S.A.
Servicios Aeroportuarios Aerosan S.A.
Aerosan Airport Services S.A.
Servicios Maritimos Patillos S.A. (SERMAPAT)
TransaereoLimitada
Aronem AirCargo S.A.
AirportInvestment SRL
Saam remolcadoresColombia S.A.S.
Riluc S.A. Tecnolum S.A.
Marsud Armazens Gerais Ltda.
Equimac S.A.
InversionesSan Marco Ltda.
Sociedad Transbordadora Austral Broom S.A. (TAB)
Inmobiliaria Marítima Portuaria Ltda. (IMPSA)
Inmobiliaria Barón Ltda.
Inmobiliaria Placeres Ltda.
Tolkeyen Patagonia Turismo S.A.
Inmobiliaria Malvilla Ltda.
Inmobiliaria Carriel Ltda.
ConcesionariaSAAM Costa Rica S.A.
SAAMRemolcadores S.A.
Inmobiliaria Rehue Ltda.
Sociedad Matriz SAAM S.A.
InmobiliariaSan Marco Ltda.
SAAM Extraportuarios S.A.
Ecuaestibas S.A.
Kios S.A.
Paraná Towage S.A.
Reenwood Investment Co.
Tug Brasil Apoio Marítimo Portuario S.A.
Saam SMIT Towage Brasil S.A.
Luckymont S.A. Giraldir S.A.
Marsud Servicios Marítimos e Portuarios Ltda.
Dugard S.A. Gertil S.A.
Cosem S.A.
Terminal El Colorado S.A.
Terminal El Caliche S.A.
Aquasaam S.A.
Terminal Las Golondrinas S.A.
Servicios de Aviación y Terminales S.A.
Servicios de Personal Portales S.A. (SEPSA)
Terminal Peñuelas S.A.
SAAMContenedores S.A.
Terminal Chinchorro S.A.
SAAM Internacional S.A.
Empresa de Servicios Marítimos Hualpén Ltda.
Servicios Portuarios Reloncaví Ltda.
Elequip S.A.
Terminal Barrancas S.A.
SAAM S.A.
Inversiones Alaria S.A.
SAAM Puertos S.A.
Inversiones Habsburgo S.A.
Inarpi S.A.
SAAM Do Brasil Ltda.
G-Star Capital Inc.
Limoly S.A.
Inversiones Navieras SAC
Construcciones Modulares S.A.
Trabajos Marítimos S.A. (Tramarsa) Logística Petrolera
del Oriente S.A.
Juan Paulo Quay S.A.C.
Logística de Químicos del SUR S.A.C.
Almacén PacíficoSur S.A.
Kemfa Servicios, Inversiones y Representaciones SA
Inversiones Misti S.A.
Puerto Buenavista S.A.
Muellaje del Loa S.A. Terminal Puerto Arica S.A.
Muellaje del MaipoS.A.
SAAM Guatemala S.A.
Serv Port y Extraport Bío Bío Ltda.
SAAM Remolcadores S.A. de C.V.
Virtual Logistics Marine Services Inc.
Smit Canada Holdings Inc.
Smit Harbour Towage Vancouver Inc.
Smit Marine Canada Inc.
Smit Harbour Towage Westminster Inc.
Smit Harbour Towage Northern BC., Inc.
Minera Piura S.R.L.
ExpertajesMarítimos S.A.
Saam Remolques Honduras S.A.
San Antonio Terminal Internacional S.A. Muellaje STI S.A.
Florida International Terminal LLC
Portuaria Corral S.A.
Iquique Terminal Internacional S.A. Muellaje ITI S.A.
SAAM Florida Inc.San Vicente Terminal Internacional S.A. Muellaje SVTI S.A.
Inmobiliaria Sepbio Ltda.
Antofagasta Terminal Internacional S.A. Muellaje ATI S.A.
Recursos Portuarios Mazatlán S.A. de C.V.
Recursos Portuarios S.A. de C.V.
Terminal MarítimaMazatlán S.A. de C.V.
SAAM SMIT Towage México S.A. de C.V.
Transportes Fluviales Corral S.A.
80.0%
100%
50.0%
5.0%
98.0%
40.0%
50.0%
50.0%
50.0%
1.0%
1.0%
95.0%
50.0%
60.0%
50.0%
25.0%
99.0%
99.9986%
99.9986%
0.1062%
0.25%
80.0%
99.75%
99.8753%
49.0%
51.0%51.0%
17.697%49.0%
32.09%
49.0%
100.0%
70.0%
18.416%
25.0%63.887%
51.0%
49.0%
100.0%
84.5%
50.00%
99.695%
99.695%
99.695%
99.695%
99.695%
99.0%
0,305%
0,305%
0.305%
0.305%
0.305%
0.305%
0.305%
1.0%
99.0% 99.0%
99.9995%
1.0%
1.0%
1.0%
1.0%
1.0%
1.0%
1.0%
1.0%
1.0%
1.0%
1.0%
99.999993%
99.0%
99.0%
99.0%
99.0%
99.0%
99.0%
99.0%
99.0%
99.0%
99.0%
99.0%
0.000007%
0,0014%
98.0%
86.11%
13.89%
50.0%
49.8%
15.5%
0.25%99.75%
85.0% 99.5% 0.5%
70.0%
50.0%1.0%
100%
0.62%
1.0%
0,0003%
99.384%
98.0%
0.5%
0.5%
0.5%
0.5%
99.5%
99.5%
99.5%
99.0%
50.0%
50.0%
35.0%
15.0%
50.0%
50.0%
50.0%
50.0%
33.33%
0.0111%
99.9889%
0,925926%99.074074%
70.0%
70.0%
99.38%
99.0%
99.9997%
50.0%
2.0%
100%
0.616%
100%
100%
100%
50.8% 49.2%
100%
100%
100%
100%
97.75%
40.00%98.75%
0.63%
0.01%
49.0%
9.97%80.06%
99.97%50.00%
69.99%
49.0%
50.0%
Chile Brazil Uruguay Panama Argentina Colombia Peru Bolivia Canada Honduras Guatemala Mexico EE.UU.
61
Chilean Companies
SAAM S. A. Company Name: SAAM S. A.
Legal Nature: Closed Corporation
Subscribed and paid-in capital: US$143,101,566
Total share: 99.9995%
% of investment over total assets of parent company:
97.29%
Company object: To undertake, both in Chile and abroad, the provision of services in areas such as: agency services and/or assistance to vessels; ship owners or operators; maritime, air and land transport companies; agency services for freight, tickets and/or tourism; in the representation and commercial transportation services; coastal trade activities and port services; embarkation, loading and unloading of goods and warehousing; vessels, tugboats, boats and wharf services; in the construction, calls for tender, development, and operation of ports and port terminals; participation in other companies and in any other business related to the Company Object.
Board of Directors: Felipe Joannon (Chairman) (1), Jean Paul Luksic (Vice Chairman) (2), Juan Antonio Álvarez (3), Hernán Büchi (4), Arturo Claro (5), Francisco Gutiérrez (6), Gonzalo Menéndez (7), Francisco Pérez-Mackenna (8), and Christopher Schiess (9)
General Manager: Javier Bitar (10)
Major contracts with parent company: Providing administration, accounting, financial and tax advisory, legal advisory, internal audit and public relations advisory services.
.
AEROSAN AIRPORT SERVICES S.A.Company Name: AEROSAN AIRPORT SERVICES S.A
Legal Nature: Cosed Corporation
Subscribed and paid-in capital: Ch$3,181,002,928
Total share: 49.9998%
% of investment over total assets of parent company:
0.69%
Company object: Airport services to airplanes, cargo and passengers, airport maintenance, airplanes maintenance and repair, cargo handling and reception, warehousing, embarkation and delivery. Land transportation of passengers and cargo to and from airports.
Board of Directors: Javier Bitar (10), Ricardo Jungk , Marvin J. Díaz and Sergio Hurtado K.
General Manager: Patricio Latorre S.
ANTOFAGASTA TERMINAL INTERNACIONAL S.A.Company Name: ANTOFAGASTA TERMINAL INTERNACIONAL S.A. (ATI S.A.)
Legal Nature: Closed corporation, registered in the special register of reporting entities
Subscribed and paid-in capital: US$7,000,000
Total share: 34.9990%
% of investment over total assets of parent company:
1.29%
Company object: Development, maintenance and operation of Berthing Front Nº2 of the port of Antofagasta..
Board of Directors: Regulars: Javier Bitar (10), Eugenio Valenzuela, Franco Montalbetti, Ramón Jara, José Manuel Urenda, Miguel Sepúlveda, Francisco Gutiérrez (6), and Yurik Díaz.
Alternates: Pablo Ribbeck, Carlos Acuña, Francisco Gardeweg, Luis Mancilla, Rodrigo Faura, Roberto Larraín (12), Felipe Rioja and Macario Valdés (13).
General Manager: Felipe Barison K. (Interim)
62
2014 Annual Report
AQUASAAM S.A.Company Name: AQUASAAM S.A.
Legal Nature: Closed Corporation
Subscribed and paid-in capital: Ch$2,012,390,853
Total share: 99.0095%
% of investment over total assets of parent company:
(1.19%)
Company object: Advisory services for and execution of all kinds of engineering projects, particularly in the maritime sector; construction, development, building, assembly and maintenance of rafts and boats; anchoring services; maintenance and repair of nets and other services related to the salmon industry, and representation and commercialization of implements and accessories used mainly in the salmon industry and fish farming in general.
Board of Directors: Javier Bitar H. (10), Roberto Larraín S. (12), Felipe Barison K. y Miguel Tortello S.
General Manager: Miguel Tortello S.
COSEM S.A.Company Name: COSEM S.A.
Legal Nature: Closed Corporation
Subscribed and paid-in capital: US$87,734
Total share: 99.0095%
% of investment over total assets of parent company:
0.07%
Company object: Personnel services for mobilizing cargo.
Board of Directors: Felipe Barison, Claudio Hurtado and Gastón Moya (14)
General Manager: Claudio Hurtado.
EMPRESA DE SERVICIOS MARÍTIMOS Y PORTUARIOS HUALPEN LTDA.Company Name: EMPRESA DE SERVICIOS MARÍTIMOS Y PORTUARIOS HUALPEN LTDA.
Legal Nature: Limited Liability Company
Subscribed and paid-in capital: Ch$204,232,502
Total share: 49.9998%
% of investment over total assets of parent company:
0.02%
Company object: Stevedoring services to ships..
Board of Directors: Javier Bitar (10), Rodolfo Skalweit, Yurik Díaz and Martin Skalweit
General Manager: Horacio Diez O.
INMOBILIARIA BARÓN LIMITADACompany Name: INMOBILIARIA BARÓN LTDA.
Legal Nature: Limited Liability Company
Subscribed and paid-in capital: Ch$4,994,380,636
Total share: 98.9995%
% of investment over total assets of parent company:
0.94%
Company object: To perform all kinds of trade and/or business activities related to: Investment in real estate and their acquisition, commercialization, operation and construction in any form or modality..
Administration: Administered by Inmobiliaria San Marco Limitada through their representatives.
General Manager: Miguel Tortello S.
63
INMOBILIARIA CARRIEL LIMITADACompany Name: INMOBILIARIA CARRIEL LTDA.
Legal Nature: Limited Liability Company
Subscribed and paid-in capital: Ch$140,024,660
Total share: 49.4998%
% of investment over total assets of parent company:
0.03%
Company object: Administration, leasing, use and operation of urban real estate, in their various forms.
Board of Directors: Javier Bitar (10), Miguel Tortello, Rodolfo Skalweit and Martin Skalweit
General Manager: Nelson Soto
INMOBILIARIA MALVILLA LIMITADACompany Name: INMOBILIARIA MALVILLA LTDA.
Legal Nature: Limited Liability Company
Subscribed and paid-in capital: Ch$641,448,567
Total share: 98.9995%
% of investment over total assets of parent company:
0.25%
Company object: Administration and operation of agricultural and non-agricultural real estate.
Administration: Administered by Inmobiliaria San Marco Limitada through their representatives.
General Manager: Miguel Tortello
INMOBILIARIA MARÍTIMA PORTUARIA LIMITADACompany Name: INMOBILIARIA MARÍTIMA PORTUARIA LIMITADA (IMPSA LTDA.)
Legal Nature: Limited Liability Company
Subscribed and paid-in capital: Ch$20,155,984,626
Total share: 98.9995%
% of investment over total assets of parent company:
9.42%
Company object: To perform all kinds of trading and/or business activities related to: a) Investment in real estate and their acquisition, commercialization, operation and construction in any form or modality; and b) Investment in personal property, tangible or intangible, such as shares, bonds, debentures, company rights, etc.
Administration: Administered by Inmobiliaria San Marco Limitada through their representatives.
General Manager: Miguel Tortello
INMOBILIARIA PLACERES LIMITADACompany Name: INMOBILIARIA PLACERES LTDA.
Legal Nature: Limited Liability Company
Subscribed and paid-in capital: Ch$268,491,485
Total share: 98.9995%
% of investment over total assets of parent company:
0.11%
Company object: Administration of agricultural and non-agricultural real estate, whether owned by the Company or by third parties.
Administration: Administered by Inmobiliaria San Marco Limitada through their representatives.
General Manager: Miguel Tortello
64
2014 Annual Report

INMOBILIARIA REHUE LIMITADACompany Name: INMOBILIARIA REHUE LTDA.
Legal Nature: Limited Liability Company
Subscribed and paid-in capital: Ch$8,208,018,450
Total share: 98.9995%
% of investment over total assets of parent company:
2.50%
Company object: Administration of agricultural and non-agricultural real estate, whether owned by the Company or by third parties.
Administration: Administered by Inmobiliaria San Marco Limitada through their representatives.
General Manager: Miguel Tortello S.
INMOBILIARIA SAN MARCO LIMITADACompany Name: INMOBILIARIA SAN MARCO LTDA.
Legal Nature: Limited Liability Company
Subscribed and paid-in capital: Ch$33,717,023,789
Total share: 98.9995%
% of investment over total assets of parent company:
13.34%
Company object: Administration, rental, use and operation of urban real estate, in their various forms, directly or indirectly; and, in general, implementing every other related activity agreed to by the partners.
Administration: Roberto Larraín (12) y Yurik Díaz or Administrative Council run by their Legal Representatives.
General Manager: Miguel Tortello
INMOBILIARIA SEPBIO LTDA.Company Name: INMOBILIARIA SEPBIO LTDA.
Legal Nature: Limited Liability Company
Subscribed and paid-in capital: Ch$10,000,000
Total share: 49.9985%
% of investment over total assets of parent company:
0.03%
Company object: The acquisition, administration, transfer and commercialization of all kinds of tangible and intangible personal property, real estate, agricultural or non-agricultural, urban or rural, implementation of realtor activities on its own behalf or for third parties, and, in general, the direct or indirect execution of all kinds of real estate businesses; as well as every other complementary activity agreed to by the partners.
Administration: Administrative Council run by their Legal Representatives.
General Manager: Eduardo González
INVERSIONES SAN MARCO LIMITADACompany Name: INVERSIONES SAN MARCO LTDA.
Legal Nature: Limited Liability Company
Subscribed and paid-in capital: US$9,451,811
Total share: 98.9995%
% of investment over total assets of parent company:
1.66%
Company object: To perform all kinds of businesses and investments, on its own behalf or for third parties, in every kind of personal and real property, tangible and intangible, including securities and negotiable instruments..
Administration: Administrative Council run by their Legal Representatives
General Manager: Roberto Larraín (12)
65
IQUIQUE TERMINAL INTERNACIONAL S.A.Company Name: IQUIQUE TERMINAL INTERNACIONAL S.A. (ITI)
Legal Nature: Closed Corporation, registered in the Special Register for reporting entities..
Subscribed and paid-in capital: US$10,000,000
Total share: 84.9975%
% of investment over total assets of parent company:
2.33%
Company object: Development and operation of Berthing Front Nº2 of the port of Iquique, owned by Empresa Portuaria Iquique. Wharfs and warehousing in relation with the aforementioned berthing site.
Board of Directors: Javier Bitar (10), Franco Montalbetti, José Manuel Urenda, Francisco Gutiérrez (6), Roberto Larraín (12), Miguel Tortello and Yurik Díaz.
Alternates: Juan Esteban Bilbao, Diego Urenda, Gastón Moya (14), Macario Valdés (13), Karen Paz (11), Felipe Rioja and Claudio Vera (16).
General Manager: Manuel Cañas
LNG TUGS CHILE S.A.Company Name: LNG TUGS CHILE S.A.
Legal Nature: Closed Corporation
Subscribed and paid-in capital: US$500,000
Total share: 39.9998%
% of investment over total assets of parent company:
0.04%
Company object: Provision of tugboats for mooring and unmooring maneuvers, stand-by, and other related activities by vessels transporting liquefied natural gas that dock in Quinteros Bay, on its own behalf or for third parties.
Board of Directors: Alfred Hübner, Luis Sotomayor, Alberto Camacho, Cristián Rojas, Marcos Piña.
Alternates: Matthias Reinarz, Carlos Bastías, Mauricio Hinojosa, Pablo Cáceres. and Cristián Cifuentes.
General Manager: Raimundo Grez.
MUELLAJE ATI S.A.Company Name: MUELLAJE ATI S.A.
Legal Nature: Closed Corporation
Subscribed and paid-in capital: Ch$40,000,000
Total share: 35.3239%
% of investment over total assets of parent company:
0.00%
Company object: Provide Antofagasta Terminal Internacional with all personnel resources that may be required for complementary services performed by maritime transport or any other activity that may need said services.
Board of Directors: Alejandro García-Huidobro., Víctor Pino. and Victoria Vásquez (20)
General Manager: Giordy Constans
MUELLAJE DEL LOA S.A.Company Name: MUELLAJE DEL LOA S.A.
Legal Nature: Closed Corporation
Subscribed and paid-in capital: Ch$40,000,000
Total share: 34.6490%
% of investment over total assets of parent company:
(0.14%)
Company object: Provision of personnel services required for any complementary services performed by maritime transport or any other activity that may need said services.
Board of Directors: Eugenio Valenzuela and Pablo Ribbeck
General Manager:
66
2014 Annual Report
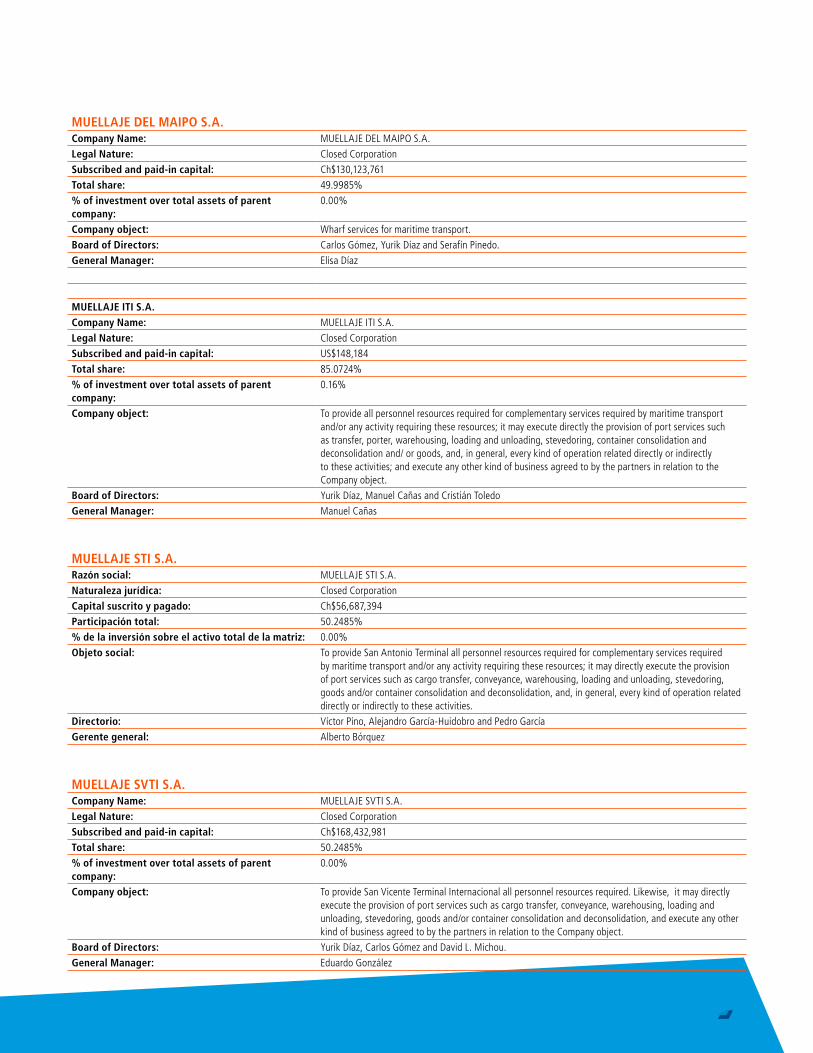
MUELLAJE DEL MAIPO S.A.Company Name: MUELLAJE DEL MAIPO S.A.
Legal Nature: Closed Corporation
Subscribed and paid-in capital: Ch$130,123,761
Total share: 49.9985%
% of investment over total assets of parent company:
0.00%
Company object: Wharf services for maritime transport.
Board of Directors: Carlos Gómez, Yurik Díaz and Serafín Pinedo.
General Manager: Elisa Díaz
MUELLAJE ITI S.A.Company Name: MUELLAJE ITI S.A.
Legal Nature: Closed Corporation
Subscribed and paid-in capital: US$148,184
Total share: 85.0724%
% of investment over total assets of parent company:
0.16%
Company object: To provide all personnel resources required for complementary services required by maritime transport and/or any activity requiring these resources; it may execute directly the provision of port services such as transfer, porter, warehousing, loading and unloading, stevedoring, container consolidation and deconsolidation and/ or goods, and, in general, every kind of operation related directly or indirectly to these activities; and execute any other kind of business agreed to by the partners in relation to the Company object.
Board of Directors: Yurik Díaz, Manuel Cañas and Cristián Toledo
General Manager: Manuel Cañas
MUELLAJE STI S.A.Razón social: MUELLAJE STI S.A.
Naturaleza jurídica: Closed Corporation
Capital suscrito y pagado: Ch$56,687,394
Participación total: 50.2485%
% de la inversión sobre el activo total de la matriz: 0.00%
Objeto social: To provide San Antonio Terminal all personnel resources required for complementary services required by maritime transport and/or any activity requiring these resources; it may directly execute the provision of port services such as cargo transfer, conveyance, warehousing, loading and unloading, stevedoring, goods and/or container consolidation and deconsolidation, and, in general, every kind of operation related directly or indirectly to these activities.
Directorio: Víctor Pino, Alejandro García-Huidobro and Pedro García
Gerente general: Alberto Bórquez
MUELLAJE SVTI S.A.Company Name: MUELLAJE SVTI S.A.
Legal Nature: Closed Corporation
Subscribed and paid-in capital: Ch$168,432,981
Total share: 50.2485%
% of investment over total assets of parent company:
0.00%
Company object: To provide San Vicente Terminal Internacional all personnel resources required. Likewise, it may directly execute the provision of port services such as cargo transfer, conveyance, warehousing, loading and unloading, stevedoring, goods and/or container consolidation and deconsolidation, and execute any other kind of business agreed to by the partners in relation to the Company object.
Board of Directors: Yurik Díaz, Carlos Gómez and David L. Michou.
General Manager: Eduardo González
67
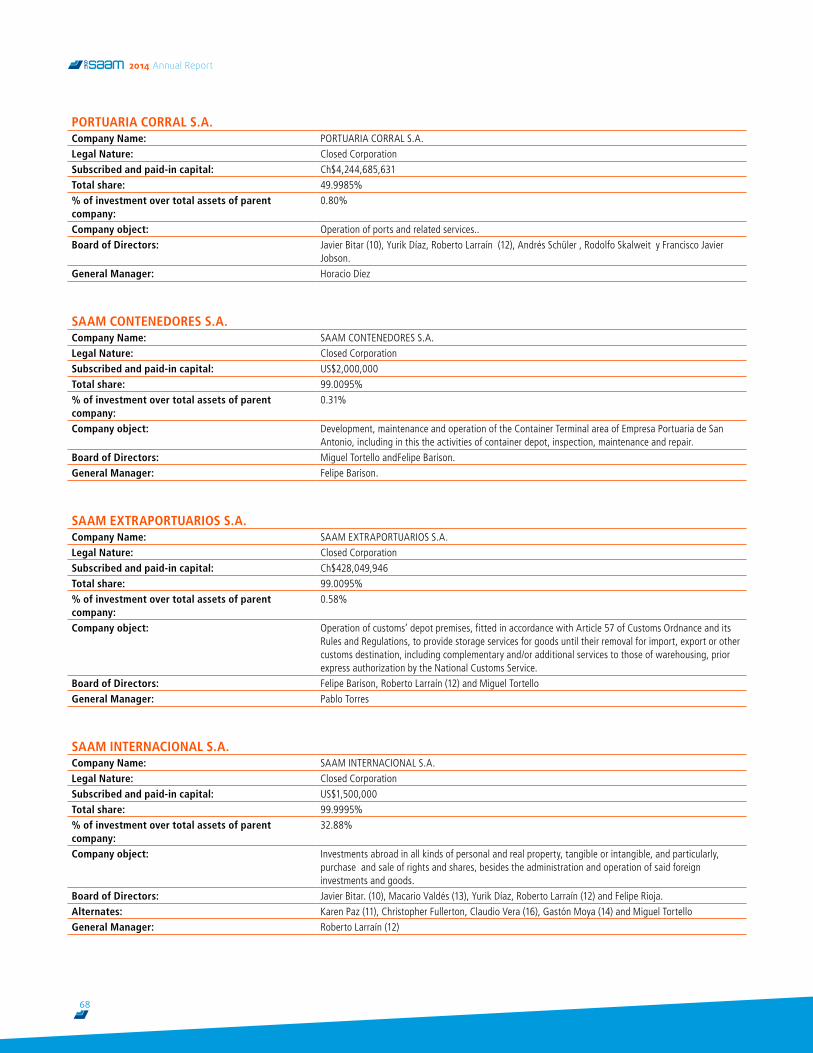
PORTUARIA CORRAL S.A.Company Name: PORTUARIA CORRAL S.A.
Legal Nature: Closed Corporation
Subscribed and paid-in capital: Ch$4,244,685,631
Total share: 49.9985%
% of investment over total assets of parent company:
0.80%
Company object: Operation of ports and related services..
Board of Directors: Javier Bitar (10), Yurik Díaz, Roberto Larraín (12), Andrés Schüler , Rodolfo Skalweit y Francisco Javier Jobson.
General Manager: Horacio Diez
SAAM CONTENEDORES S.A.Company Name: SAAM CONTENEDORES S.A.
Legal Nature: Closed Corporation
Subscribed and paid-in capital: US$2,000,000
Total share: 99.0095%
% of investment over total assets of parent company:
0.31%
Company object: Development, maintenance and operation of the Container Terminal area of Empresa Portuaria de San Antonio, including in this the activities of container depot, inspection, maintenance and repair.
Board of Directors: Miguel Tortello andFelipe Barison.
General Manager: Felipe Barison.
SAAM EXTRAPORTUARIOS S.A.Company Name: SAAM EXTRAPORTUARIOS S.A.
Legal Nature: Closed Corporation
Subscribed and paid-in capital: Ch$428,049,946
Total share: 99.0095%
% of investment over total assets of parent company:
0.58%
Company object: Operation of customs’ depot premises, fitted in accordance with Article 57 of Customs Ordnance and its Rules and Regulations, to provide storage services for goods until their removal for import, export or other customs destination, including complementary and/or additional services to those of warehousing, prior express authorization by the National Customs Service.
Board of Directors: Felipe Barison, Roberto Larraín (12) and Miguel Tortello
General Manager: Pablo Torres
SAAM INTERNACIONAL S.A.Company Name: SAAM INTERNACIONAL S.A.
Legal Nature: Closed Corporation
Subscribed and paid-in capital: US$1,500,000
Total share: 99.9995%
% of investment over total assets of parent company:
32.88%
Company object: Investments abroad in all kinds of personal and real property, tangible or intangible, and particularly, purchase and sale of rights and shares, besides the administration and operation of said foreign investments and goods.
Board of Directors: Javier Bitar. (10), Macario Valdés (13), Yurik Díaz, Roberto Larraín (12) and Felipe Rioja.
Alternates: Karen Paz (11), Christopher Fullerton, Claudio Vera (16), Gastón Moya (14) and Miguel Tortello
General Manager: Roberto Larraín (12)
68
2014 Annual Report
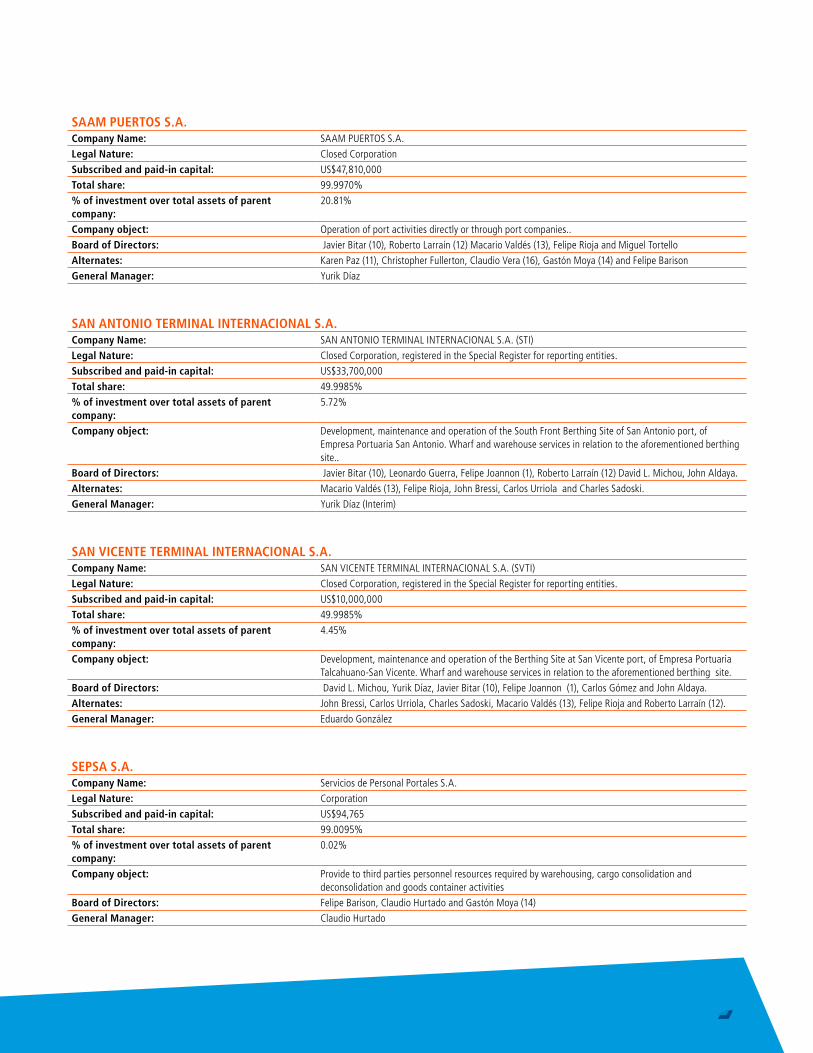
SAAM PUERTOS S.A.Company Name: SAAM PUERTOS S.A.
Legal Nature: Closed Corporation
Subscribed and paid-in capital: US$47,810,000
Total share: 99.9970%
% of investment over total assets of parent company:
20.81%
Company object: Operation of port activities directly or through port companies..
Board of Directors: Javier Bitar (10), Roberto Larraín (12) Macario Valdés (13), Felipe Rioja and Miguel Tortello
Alternates: Karen Paz (11), Christopher Fullerton, Claudio Vera (16), Gastón Moya (14) and Felipe Barison
General Manager: Yurik Díaz
SAN ANTONIO TERMINAL INTERNACIONAL S.A.Company Name: SAN ANTONIO TERMINAL INTERNACIONAL S.A. (STI)
Legal Nature: Closed Corporation, registered in the Special Register for reporting entities.
Subscribed and paid-in capital: US$33,700,000
Total share: 49.9985%
% of investment over total assets of parent company:
5.72%
Company object: Development, maintenance and operation of the South Front Berthing Site of San Antonio port, of Empresa Portuaria San Antonio. Wharf and warehouse services in relation to the aforementioned berthing site..
Board of Directors: Javier Bitar (10), Leonardo Guerra, Felipe Joannon (1), Roberto Larraín (12) David L. Michou, John Aldaya.
Alternates: Macario Valdés (13), Felipe Rioja, John Bressi, Carlos Urriola and Charles Sadoski.
General Manager: Yurik Díaz (Interim)
SAN VICENTE TERMINAL INTERNACIONAL S.A.Company Name: SAN VICENTE TERMINAL INTERNACIONAL S.A. (SVTI)
Legal Nature: Closed Corporation, registered in the Special Register for reporting entities.
Subscribed and paid-in capital: US$10,000,000
Total share: 49.9985%
% of investment over total assets of parent company:
4.45%
Company object: Development, maintenance and operation of the Berthing Site at San Vicente port, of Empresa Portuaria Talcahuano-San Vicente. Wharf and warehouse services in relation to the aforementioned berthing site.
Board of Directors: David L. Michou, Yurik Díaz, Javier Bitar (10), Felipe Joannon (1), Carlos Gómez and John Aldaya.
Alternates: John Bressi, Carlos Urriola, Charles Sadoski, Macario Valdés (13), Felipe Rioja and Roberto Larraín (12).
General Manager: Eduardo González
SEPSA S.A.Company Name: Servicios de Personal Portales S.A.
Legal Nature: Corporation
Subscribed and paid-in capital: US$94,765
Total share: 99.0095%
% of investment over total assets of parent company:
0.02%
Company object: Provide to third parties personnel resources required by warehousing, cargo consolidation and deconsolidation and goods container activities
Board of Directors: Felipe Barison, Claudio Hurtado and Gastón Moya (14)
General Manager: Claudio Hurtado
69
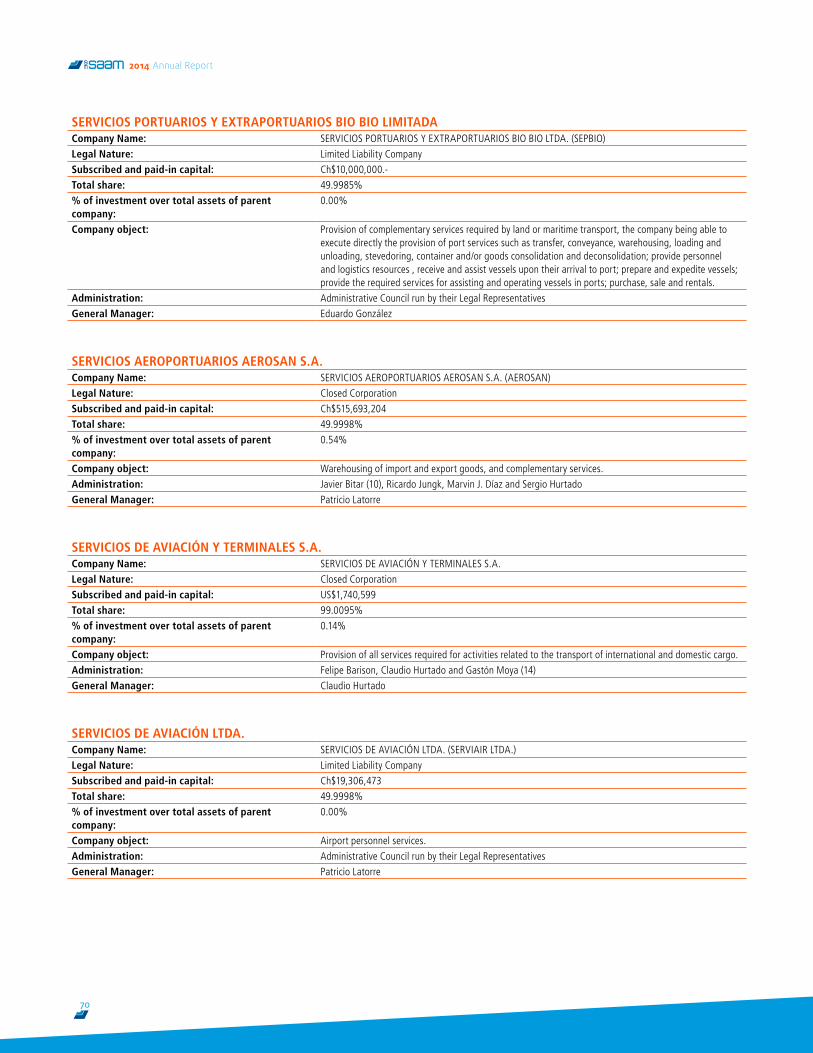
SERVICIOS PORTUARIOS Y EXTRAPORTUARIOS BIO BIO LIMITADACompany Name: SERVICIOS PORTUARIOS Y EXTRAPORTUARIOS BIO BIO LTDA. (SEPBIO)
Legal Nature: Limited Liability Company
Subscribed and paid-in capital: Ch$10,000,000.-
Total share: 49.9985%
% of investment over total assets of parent company:
0.00%
Company object: Provision of complementary services required by land or maritime transport, the company being able to execute directly the provision of port services such as transfer, conveyance, warehousing, loading and unloading, stevedoring, container and/or goods consolidation and deconsolidation; provide personnel and logistics resources , receive and assist vessels upon their arrival to port; prepare and expedite vessels; provide the required services for assisting and operating vessels in ports; purchase, sale and rentals.
Administration: Administrative Council run by their Legal Representatives
General Manager: Eduardo González
SERVICIOS AEROPORTUARIOS AEROSAN S.A.Company Name: SERVICIOS AEROPORTUARIOS AEROSAN S.A. (AEROSAN)
Legal Nature: Closed Corporation
Subscribed and paid-in capital: Ch$515,693,204
Total share: 49.9998%
% of investment over total assets of parent company:
0.54%
Company object: Warehousing of import and export goods, and complementary services.
Administration: Javier Bitar (10), Ricardo Jungk, Marvin J. Díaz and Sergio Hurtado
General Manager: Patricio Latorre
SERVICIOS DE AVIACIÓN Y TERMINALES S.A.Company Name: SERVICIOS DE AVIACIÓN Y TERMINALES S.A.
Legal Nature: Closed Corporation
Subscribed and paid-in capital: US$1,740,599
Total share: 99.0095%
% of investment over total assets of parent company:
0.14%
Company object: Provision of all services required for activities related to the transport of international and domestic cargo.
Administration: Felipe Barison, Claudio Hurtado and Gastón Moya (14)
General Manager: Claudio Hurtado
SERVICIOS DE AVIACIÓN LTDA.Company Name: SERVICIOS DE AVIACIÓN LTDA. (SERVIAIR LTDA.)
Legal Nature: Limited Liability Company
Subscribed and paid-in capital: Ch$19,306,473
Total share: 49.9998%
% of investment over total assets of parent company:
0.00%
Company object: Airport personnel services.
Administration: Administrative Council run by their Legal Representatives
General Manager: Patricio Latorre
70
2014 Annual Report
SERVICIOS LOGÍSTICOS LIMITADACompany Name: SERVICIOS LOGÍSTICOS LTDA. (SERVILOG LTDA.)
Legal Nature: Limited Liability Company
Subscribed and paid-in capital: Ch$70,000,000
Total share: 49.9998%
% of investment over total assets of parent company:
0.0001%
Company object: Provision of logistics services, personnel administration, airport services, rental of airplanes, air transport, representation and administration of warehouses for third parties, air freight, land and maritime freight, courier services, general sales agent, equipment and machinery rentals, travel agency, IT solutions, warehousing, distribution and related services.
Administration: Administrative Council run by their Legal Representatives
General Manager: Patricio Latorre
SERVICIOS MARÍTIMOS PATILLOS S.A.Company Name: SERVICIOS MARÍTIMOS PATILLOS S.A. (SERMAPAT)
Legal Nature: Closed Corporation
Subscribed and paid-in capital: US$1,972
Total share: 49.9998%
% of investment over total assets of parent company:
0.01%
Company object: Provision of maritime and port services.
Board of Directors: Felipe Rioja, Cristián Rojas, Ricardo Gómez and Walther Meyer
General Manager: Walther Meyer
SERVICIOS PORTUARIOS RELONCAVÍ LTDA.Company Name: SERVICIOS PORTUARIOS RELONCAVÍ LTDA.
Legal Nature: Limited Liability Company
Subscribed and paid-in capital: Ch$165,000,000
Total share: 49.9998%
% of investment over total assets of parent company:
0.96%
Company object: Stevedoring service (loading and unloading cargo from ships).
Board of Directors: Javier Bitar (10), Roberto Larraín (12), Francisco Javier Jobson and Martin Skalweit.
General Manager: Horacio Diez
SOCIEDAD TRANSBORDADORA AUSTRAL BROOM S.A.Company Name: SOCIEDAD TRANSBORDADORA AUSTRAL BROOM S.A. (TABSA)
Legal Nature: Closed Corporation
Subscribed and paid-in capital: Ch$15,403,397,240
Total share: 24.9999%
% of investment over total assets of parent company:
1.75%
Company object: Maritime Transport of cargo, vehicles and passengers in the Strait of Magellan and other points in the country
Board of Directors: Pedro Lecaros, Marcelo Vargas, Felipe Rioja and James Wells
General Manager: Alejandro Kusanovic
71
TERMINAL BARRANCAS S.A.Company Name: TERMINAL BARRANCAS S.A.
Legal Nature: Closed Corporation
Subscribed and paid-in capital: US$47,473
Total share: 99.0095%
% of investment over total assets of parent company:
0.03%
Company object: Provision of services associated to national and international transport of cargo, such as full or empty container depots, workshop services and complementary operations related to cargo and/or containers..
Board of Directors: Felipe Barison, Claudio Hurtado and Gastón Moya (14).
General Manager: Claudio Hurtado
TERMINAL CHINCHORRO S.A.Company Name: TERMINAL CHINCHORRO S.A.
Legal Nature: Closed Corporation
Subscribed and paid-in capital: US$47,473
Total share: 99.0095%
% of investment over total assets of parent company:
0.02%
Company object: Provision of services associated to national and international transport of cargo, such as full or empty container depots, workshop services and complementary operations related to cargo and/or containers..
Board of Directors: Felipe Barison, Claudio Hurtado and Gastón Moya (14).
General Manager: Claudio Hurtado
TERMINAL EL CALICHE S.A.Company Name: TERMINAL EL CALICHE S.A.
Legal Nature: Closed Corporation
Subscribed and paid-in capital: US$28,023
Total share: 99.0095%
% of investment over total assets of parent company:
0.01%
Company object: Provision of services associated to national and international transport of cargo, such as full or empty container depots, workshop services and complementary operations related to cargo and/or containers..
Board of Directors: Felipe Barison, Claudio Hurtado and Gastón Moya (14).
General Manager: Claudio Hurtado
TERMINAL EL COLORADO S.A.Company Name: TERMINAL EL COLORADO S.A.
Legal Nature: Closed Corporation
Subscribed and paid-in capital: US$47,473
Total share: 99.0095%
% of investment over total assets of parent company:
0.02%
Company object: Provision of services associated to national and international transport of cargo, such as full or empty container depots, workshop services and complementary operations related to cargo and/or containers..
Board of Directors: Felipe Barison, Claudio Hurtado and Gastón Moya (14).
General Manager: Claudio Hurtado
72
2014 Annual Report

TERMINAL LAS GOLONDRINAS S.A.Company Name: TERMINAL LAS GOLONDRINAS S.A.
Legal Nature: Closed Corporation
Subscribed and paid-in capital: US$28,023
Total share: 99.0095%
% of investment over total assets of parent company:
(0.01%)
Company object: Provision of services associated to national and international transport of cargo, such as full or empty container depots, workshop services and complementary operations related to cargo and/or containers.
Board of Directors: Felipe Barison, Claudio Hurtado and Gastón Moya (14).
General Manager: Claudio Hurtado
TERMINAL PEÑUELAS S.A.Company Name: TERMINAL PEÑUELAS S.A.
Legal Nature: Closed Corporation
Subscribed and paid-in capital: US$48,125
Total share: 99.0095%
% of investment over total assets of parent company:
0.04%
Company object: Provision of services associated to national and international transport of cargo, such as full or empty container depots, workshop services and complementary operations related to cargo and/or containers.
Board of Directors: Felipe Barison, Claudio Hurtado and Gastón Moya (14).
General Manager: Claudio Hurtado
TERMINAL PUERTO ARICA S.A.Company Name: TERMINAL PUERTO ARICA S.A. (TPA S.A.)
Legal Nature: Closed Corporation, registered in the Special Register for reporting entities.
Subscribed and paid-in capital: US$5,000,000
Total share: 14.9996%
% of investment over total assets of parent company:
0.67%
Company object: Development, maintenance and operation of Berthing Site Nº1, Port of Arica, Arica Port Company..
Board of Directors: Álvaro Brunet, Jaime Barahona, Alfonso Rioja, Javier Bitar (10), Jan Vermeij and Dionisio Romero.
Alternates: Miguel Tortello, Melvin Wenger, Andrés Elgueta, Richard Von Appen, Rodrigo Faura and Emilio Fantozzi
General Manager: Diego Bulnes
TRANSPORTES FLUVIALES CORRAL S.A.Company Name: TRANSPORTES FLUVIALES CORRAL S.A.
Legal Nature: Closed Corporation
Subscribed and paid-in capital: Ch$2,147,376,520
Total share: 49.9998%
% of investment over total assets of parent company:
0.23%
Company object: Maritime and river transport, plus related services.
Board of Directors: Javier Bitar (10), Yurik Díaz, Andrés Schüler and Francisco Javier Jobson.
General Manager: Horacio Diez
73
Foreign Companies
AIRPORT INVESTMENTS S. DE R.L.Company Name: AIRPORT INVESTMENTS S. DE R.L.
Legal Nature: Limited Liability Company (Panama)
Subscribed and paid-in capital: US$1,000
Total share: 49.9998%
% of investment over total assets of parent company:
0.513%
Company object: The Company will focus mainly on investment activities.
Board of Directors: Julio E. Linares, Patricio Latorre and Juan Garrido
General Manager: Patricio Latorre
ALMACÉN PACÍFICO SUR S.A.Company Name: ALMACÉN PACÍFICO SUR S.A.
Legal Nature: Corporation (Bolivia)
Subscribed and paid-in capital: BS. 138,000.00
Total share: 48.9843%
% of investment over total assets of parent company:
0.17%
Company object: Provision of Logistics services for cargo, and General Agents of Shipping Companies.
Board of Directors: Dionisio Romero, Álvaro Galindo, Ángel Irazola and Emilio Fantozzi.
General Manager: Erick Hein
ARONEM S. A.Company Name: ARONEM AIR CARGO S. A.
Legal Nature: Closed Corporation (Ecuador)
Subscribed and paid-in capital: US$40,000
Total share: 39.9998%
% of investment over total assets of parent company:
0.06%
Company object: Provision of general air-maritime services and also to air cargo.
Board of Directors: Jaime Pérez, Patricio Latorre and Juan Garrido.
General Manager: Marco Benítez
CONCESIONARIA SAAM COSTA RICA S.A.Company Name: CONCESIONARIA SAAM COSTA RICA S.A.
Legal Nature: Corporation (Costa Rica)
Subscribed and paid-in capital: US$4,500,000
Total share: 99.9995%
% of investment over total assets of parent company:
0.63%
Company object: Provision of services: transport, agency, towage, salvage, assistance, removal of wrecked ships remains, pilotage, boats and coastal navigation.
Board of Directors: Javier Bitar (10), Felipe Rioja, Roberto Larraín (12) and Macario Valdés (13).
General Manager: Juan Pablo González
74
2014 Annual Report
CONSTRUCCIONES MODULARES S.A.Company Name: CONSTRUCCIONES MODULARES S.A.
Legal Nature: Corporation (Peru)
Subscribed and paid-in capital: N/$3,766,541
Total share: 49.1991%
% of investment over total assets of parent company:
0.05%
Company object: Installation and operation of container and cargo terminals; cold storage; container operator, warehousing and cargo services, packing, container consolidation and deconsolidation; construction, maintenance, modification and repair of containers and modules.
Board of Directors: Luis Romero, Emilio Fantozzi, Calixto Romero, Álvaro Galindo and Mario Hart
General Manager: José Luis León
DUGARD S.A. Company Name: DUGARD S.A.
Legal Nature: Corporation (Uruguay)
Subscribed and paid-in capital: Ur$400,000
Total share: 74.5634%
% of investment over total assets of parent company:
0%
Company object: Professional transport of bulk cargo.
Board of Directors: Javier Bitar (10), Roberto Larraín (12), Ricardo Jungk, Francisco Javier Jobson and Horacio Diez
General Manager: Luis Fabini
ECUAESTIBAS S.A.Company Name: ECUAESTIBAS S.A.
Legal Nature: Corporation (Ecuador)
Subscribed and paid-in capital: US$586,640
Total share: 99.9995%
% of investment over total assets of parent company:
2.15%
Company object: Provision of all kinds of port services, such as port operator, and/or complementary services company.
Board of Directors: Javier Bitar (10), Felipe Rioja and Roberto Larraín (12).
Alternates: Yurik Díaz and Pablo Cáceres
General Manager: Enrique Brito
ELEQUIP S.ACompany Name: ELEQUIP S.A.
Legal Nature: Corporation (Colombia)
Subscribed and paid-in capital: Col$992,674,600
Total share: 49.7997%
% of investment over total assets of parent company:
1.08%
Company object: To run operational equipment for stevedoring and complementary services.
Board of Directors: Javier Bitar (10), Felipe Rioja, Juan Carlos Rueda and Bernd Haubold
Alternates: Yurik Díaz, Roberto Larraín (12), Beatriz Oesterreich and José Gabriel Salinas
General Manager: Antonio Rodríguez
75
EQUIMAC S.A.Company Name: EQUIMAC S.A.
Legal Nature: Corporation (Colombia)
Subscribed and paid-in capital: Col$97,338,600
Total share: 49.9997%
% of investment over total assets of parent company:
0.15%
Company object: Provision of towage services.
Board of Directors: Javier Bitar (10), Felipe Rioja, Juan Carlos Rueda y Bernd Haubold
Alternates: Yurik Díaz, Roberto Larraín (12), Beatriz Oesterreich and José Gabriel Salinas
General Manager: Antonio Rodríguez
EXPERTAJES MARITIMOS S.A.Company Name: EXPERTAJES MARITIMOS S.A. (MAREX S.A.)
Legal Nature: Corporation (Guatemala)
Subscribed and paid-in capital: GTQ3,800,000
Total share: 69.9996%
% of investment over total assets of parent company:
0.01%
Company object: Provision of maritime and port services. The purchase, sale, subcontracting, rental, exchange, assignment, and any activity, legal action, contract or business, related to businesses, investments and personal and real property.
Board of Directors: Javier Bitar (10), Felipe Rioja, Harry Marcus Nadle and Roberto Larraín (12).
General Manager: Harry Marcus Nadle
FLORIDA INTERNATIONAL TERMINAL, LLCCompany Name: FLORIDA INTERNATIONAL TERMINAL, LLC
Legal Nature: Limited Liability Company (United States)
Subscribed and paid-in capital: US$3,000,000
Total share: 69.9996%
% of investment over total assets of parent company:
0.59%
Company object: Port Terminal Operations and stevedoring services.
Board of Directors: Javier Bitar (10), Yurik Díaz, Luis Mancilla, Roberto Larraín (12), Macario Valdes (13) and Franco Montalbetti
General Manager: José Alberto Díaz
GERTIL S.A.Company Name: GERTIL S.A.
Legal Nature: Corporation (Uruguay)
Subscribed and paid-in capital: US$3,785,894
Total share: 74.5634%
% of investment over total assets of parent company:
0.54%
Company object: Stevedoring port services.
Board of Directors: Javier Bitar (10), Roberto Larraín (12), Ricardo Jungk, Francisco Javier Jobson and Horacio Diez
General Manager: Luis Fabini W.
76
2014 Annual Report
GIRALDIR S.A.Company Name: GIRALDIR S.A.
Legal Nature: Corporation (Uruguay)
Subscribed and paid-in capital: Ur$50,000
Total share: 99.999%
% of investment over total assets of parent company:
0.20%
Company object: Towage services and maritime services in general.
Board of Directors: Javier Bitar (10), Felipe Rioja and Roberto Larraín (12).
G-STAR CAPITAL INC.Company Name: G-STAR CAPITAL INC.
Legal Nature: Corporation (Panama)
Subscribed and paid-in capital: US$0
Total share: 49.9997%
% of investment over total assets of parent company:
0.43%
Company object: Investment activities.
Board of Directors: Luis Eduardo Céspedes, Lilia Aminta de Salcedo and Miguel Urriola
INARPI S.A.Company Name: INARPI S.A.
Legal Nature: Corporation (Ecuador)
Subscribed and paid-in capital: US$7,215,800
Total share: 99.9969%
% of investment over total assets of parent company:
3.01%
Company object: Company dedicated to providing services in the area of ports, such as cargo port operator..
Administration: Administrative Council run by their Legal Representatives.
General Manager: Juan Alfredo Illingworth
INVERSIONES ALARIA S.A.Company Name: INVERSIONES ALARIA S.A.
Legal Nature: Corporation (Panama)
Subscribed and paid-in capital: US$1,000,000
Total share: 99.9995%
% of investment over total assets of parent company:
13.19%
Company object: Purchase and sale of every type of personal and real property. General investments and operation in securities and real estate, participation in industrial, commercial or financial companies. Operation of maritime businesses, in relation with fluvial or maritime transport, air or land transport, and operation of maritime agencies in the country (Panama) or abroad. Participation in Panamanian or foreign corporations..
Board of Directors: Julio E. Linares, Roberto Larraín (12) and Felipe Rioja
77
INVERSIONES HABSBURGO S.A.Company Name: INVERSIONES HABSBURGO S.A.
Legal Nature: Corporation (Panama)
Subscribed and paid-in capital: US$216,000
Total share: 99.9995%
% of investment over total assets of parent company:
21.54%
Company object: Purchase and sale of every type of personal and real property. General investments and operation in securities and real estate, participation in industrial, commercial or financial companies. Operation of maritime businesses, in relation with fluvial or maritime transport, air or land transport, and operation of maritime agencies in the country (Panama) or abroad. Participation in Panamanian or foreign corporations.
Board of Directors: Julio E. Linares, Roberto Larraín (12) and Felipe Rioja
INVERSIONES MISTI S.A.Company Name: INVERSIONES MISTI S.A.
Legal Nature: Corporation (Peru)
Subscribed and paid-in capital: N/$700,233
Total share: 99.9995%
% of investment over total assets of parent company:
4.57%
Company object: Business and activities in the ports and maritime area, loading and unloading, warehousing, port operator, tonnage, boats, ships brokerage and agency, port equipment, transport and handling of cargo and containers, etc. Participation in other companies.
Board of Directors: Javier Bitar (10), Roberto Larraín (12) and Felipe Rioja
General Manager: Roberto Larraín (12)
INVERSIONES NAVIERAS S.A.C.Company Name: INVERSIONES NAVIERAS S.A.C.
Legal Nature: Commercial Corporation (Peru)
Subscribed and paid-in capital: N/$5,150,000
Total share: 49.9997%
% of investment over total assets of parent company:
0.16%
Company object: Business of ship contracting, agent and brokerage, maritime transport of bulk cargo, solid or liquid, for export or import, and general cargo in the same services, in international traffic or coastal navigation, and every activity connected or linked to navy and port businesses, either on its own behalf or for third parties, operation of boats and large boats, towage services, pilotage, transport within the Bay, maritime salvage and other related services.
Board of Directors: Does not have a Board
General Manager: Mario Hart
78
2014 Annual Report
JUAN PAULO QUAY S.A.C.Company Name: JUAN PABLO QUAY S.A.C.
Legal Nature: Commercial Corporation (Peru)
Subscribed and paid-in capital: N/$ 12,039
Total share: 19.6%
% of investment over total assets of parent company:
0.13%
Company object: 1. The constitution, operation and administration of ports, wharfs, piers, berths and lashing and, in general, of a maritime terminal. 2. To perform port operations inherent, linked to, similar and/or related to the activity of general agent, port agent or maritime agent; and 3. Loading and unloading, stevedoring, transport, porter and warehousing in general, of containers and goods from ships.
Board of Directors: Julio De Blas, Dionisio Romero, Álvaro Galindo, Felipe Vivar and Andrés Leroux
General Manager: Alvaro Galindo
KEMFA S.A.Company Name: Kemfa Servicios, Inversiones y Representaciones S.A.
Legal Nature: Corporation (Bolivia)
Subscribed and paid-in capital: BS. 16,000
Total share: 48.38%
% of investment over total assets of parent company:
0.10%
Company object: Consolidation and deconsolidation of cargo, investments and business representations, representation of products and/or services, carrying out on its own behalf or for third parties, foreign trade operations, investments, capturing clients oir partners and performing consultancy and advisory activities.
Board of Directors: Jamiro Franco, Luis Ernesto Meneses, César de la Vega.
Alternates: José Antonio, Érica Palenque and Sergio Salazar.
General Manager: Erick Hein
KIOS S.A.Company Name: KIOS S.A.
Legal Nature: Corporation (Uruguay)
Subscribed and paid-in capital: Ur$13,146,264
Total share: 48.9997%
% of investment over total assets of parent company:
1.33%
Company object: General Towage Services.
Board of Directors: Fernando Capurro, Felipe Rioja and Francisco Licio.
General Manager: Fernando Capurro.
LIMOLY S.A.Company Name: LIMOLY S.A.
Legal Nature: Corporation (Uruguay)
Subscribed and paid-in capital: Ur$400,000
Total share: 99.9995%
% of investment over total assets of parent company:
0.69%
Company object: Its object is to industrialize and commercialize in all its forms, goods, rental of goods, works and services.
Board of Directors: Javier Bitar (10), Felipe Rioja, Roberto Larraín (12) and Macario Valdés (13)
79
LOGÍSTICA PERUANA DEL ORIENTE S.A.Company Name: LOGÍSTICA PERUANA DEL ORIENTE S.A.
Legal Nature: Corporation (Peru)
Subscribed and paid-in capital: N/. 7,500,000
Total share: 34.29%
% of investment over total assets of parent company:
0.08%
Company object: To devote itself to the design, construction and maintenance of fluvial wharfs in the jungle region, intended for the viability and fulfillment of Ransa purposes as provider of logistics and transport services.
Board of Directors: Álvaro Galindo, Emilio Fantozzi, Mario Hart and Erick Hein
General Manager: Álvaro Galindo
LOGÍSTICA DE QUÍMICOS DEL SUR S.A.Company Name: LOGÍSTICA DE QUÍMICOS DEL SUR S.A.
Legal Nature: Corporation (Peru)
Subscribed and paid-in capital: N/. 3,644,000.00
Total share: 0.17%
% of investment over total assets of parent company:
24,5%
Company object: To provide services of reception, warehousing, dispatch and transport of liquid chemical products in bulk.
Board of Directors: Álvaro Galindo, Erick Hein, Holder Cristian and Luis Díaz.
Alternates Dionisio Romero, Jose Antonio Onrubia, Andres Bereilh and Francisco Dulante.
General Manager: Andres Bereilh
LUCKYMONT S.A. Company Name: LUCKYMONT S.A.
Legal Nature: Corporation (Uruguay)
Subscribed and paid-in capital: UU$472
Total share: 74.5634%
% of investment over total assets of parent company:
0.02%
Company object: Set up the legal form of Zona Franca (Free Trade Zone) to develop logistics services for Montes de Plata (Punta Pereira, Colonia, Uruguay) .
Board of Directors: Javier Bitar (10), Roberto Larraín (12), Ricardo Jungk, Francisco Javier Jobson and Horacio Diez
General Manager: Luis Fabini
MARSUD ARMAZENS GERAIS LTDA.Company Name: MARSUD ARMAZENS GERAIS LTDA.
Legal Nature: Limited Liability Company (Brazil)
Subscribed and paid-in capital: R$3,000,000
Total share: 47.9998%
% of investment over total assets of parent company:
0.10%
Company object: General storehouses.
Administration: Administrative Council run by their Legal Representatives.
General Manager: Rosane Martins
80
2014 Annual Report
MARSUD SERVIÇOS MARITIMOS E PORTUARIOS LTDA.Company Name: MARSUD SERVIÇOS MARITIMOS E PORTUARIOS LTDA.
Legal Nature: Limited Liability Company (Brazil)
Subscribed and paid-in capital: R$520,000
Total share: 79.9996%
% of investment over total assets of parent company:
0.08%
Company object: Maritime Agency Services
Administration: Administrative Council run by their Legal Representatives
General Manager: Rosane Martins
MINERA PIURA S.R.LCompany Name: MINERA PIURA S.R.L.
Legal Nature: Limited Liability Company (Peru)
Subscribed and paid-in capital: N/ 4,000
Total share: 19.55%
% of investment over total assets of parent company:
0.01%
Company object: Prospecting, exploration and reporting of all types of mining substances, their purchase and sale, formulate and work all kinds of mining rights, purchase and sale, whether in the domestic market or internationally, all kinds of mining substances and their derivatives, purchase and sale of all kinds of mining rights and all types of similar or related and derived activities in relation to the mining activity. Lastly, it may devote itself to operate and profit any mining substance through the grant of permits or concessions.
Administration: Administrative Council run by their Legal Representatives
General Manager: Álvaro Galindo
PARANA TOWAGE S.A.Company Name: PARANA TOWAGE S.A.
Legal Nature: Corporation (Argentina)
Subscribed and paid-in capital: Ar$12,000
Total share: 49.0448%
% of investment over total assets of parent company:
0.02%
Company object: Maritime services in general.
Board of Directors: Fernando Capurro, Jorge Portela and Sergio R. Pez
General Manager: Fernando Capurro
PUERTO BUENAVISTA S.A.Company Name: PUERTO BUENAVISTA S.A.
Legal Nature: Corporation (Colombia)
Subscribed and paid-in capital: Col$11,872,966,000
Total share: 33.25%
% of investment over total assets of parent company:
0.72%
Company object: Investments in port construction, maintenance and administration. Provision of services of loading and unloading and warehousing in ports, and every other service directly related to port activities and all other activities allowed to port companies by Law 01/91 and complementary norms.
Board of Directors: Alberto Jiménez, Enrique Esparragoza D., María Cristina Pareja, Federico De Vries, Yurik Díaz R., y Macario Valdés R. (13).
Alternates: Alejandro Uribe, Álvaro González, Jorge Arbeláez, Rafael Zorrilla, Javier Bitar (10) and Roberto Larraín (12).
General Manager: Cristián Wulf
81
RECURSOS PORTUARIOS MAZATLAN S.A. DE C.V.Company Name: RECURSOS PORTUARIOS MAZATLAN S.A. DE C.V.
Legal Nature: Variable Stock Corporation (Mexico)
Subscribed and paid-in capital: M$50,000
Total share: 99.7345%
% of investment over total assets of parent company:
0.00%
Company object: Provision of technological services and manpower, transmission of technical knowledge, personnel training, and provision of administration services.
Board of Directors: Javier Bitar (10), Felipe Rioja, Roberto Larraín (12), Macario Valdés (13) y Yurik Díaz
General Manager: Miguel Chávez.
RECURSOS PORTUARIOS S.A. DE C.V.Company Name: RECURSOS PORTUARIOS S.A. DE C.V.
Legal Nature: Variable Stock Corporation (Mexico)
Subscribed and paid-in capital: M$5,729,116
Total share: 51%
% of investment over total assets of parent company:
009%
Company object: Provision of technological services and manpower, transmission of technical knowledge, personnel training, and provision of administration services.
Board of Directors: Javier Bitar (10), Felipe Rioja., Roberto Larraín (12), Macario Valdés (13) and Henry Foulkes.
Alternates: Marcelo Jullian, Cristián Rojas, Felipe Barison, Miguel Tortello. y Jaime Romero.
General Manager: Marcelo Jullian
REENWOOD INVESTMENTS INC.Company Name: REENWOOD INVESTMENTS INC.
Legal Nature: Corporation (Panama)
Subscribed and paid-in capital: US$124,475
Total share: 50.1247%
% of investment over total assets of parent company:
000%
Company object: Invesment Corporation.
Board of Directors: Julio E. Linares, Roberto Larraín (12) and Horacio Diez
RILUC S.A.Company Name: RILUC S.A.
Legal Nature: Corporation (Uruguay)
Subscribed and paid-in capital: Ur$4,285,634
Total share: 74.5646%
% of investment over total assets of parent company:
0.00%
Company object: Professional Cargo Transport Services.
Board of Directors: Javier Bitar (10), Roberto Larraín (12), Ricardo Jungk, Francisco Javier Jobson and Horacio Diez
General Manager: Luis Fabini
SAAM FLORIDA, INC.Company Name: SAAM FLORIDA INC.
Legal Nature: Corporation (United States)
Subscribed and paid-in capital: US$2,100,000
Total share: 99.9970%
% of investment over total assets of parent company:
0.54%
Company object: Investment Company.Board of Directors: Javier Bitar (10), Yurik Díaz and Roberto Larraín (12).General Manager: José Alberto Díaz
82
2014 Annual Report
SAAM DO BRASIL LTDA.Company Name: SUDAMERICANA AGENCIA MARITIMA DO BRASIL LTDA.
Legal Nature: Limited Liability Company (Brazil)
Subscribed and paid-in capital: R$5,000,000
Total share: 99.9995%
% of investment over total assets of parent company:
1.33%
Company object: Port support navigation, terminals operations, loading and unloading; logistics organization of the transport of goods; transport, except hazardous products, between cities, inter-state and international; assistance activities of water transport not mentioned before; general storehouse – issuance of warrants; administration of port infrastructure, maintenance and repair of equipment and various products..
Administration: Administrative Council run by their Legal Representatives.
General Manager: Rosane Martins
SAAM GUATEMALA S.A.Razón social: SAAM GUATEMALA S.A.
Naturaleza jurídica: Corporation (Guatemala)
Capital suscrito y pagado: GTQ10,402,701
Participación total: 69.9996%
% de la inversión sobre el activo total de la matriz: 0.17%
Objeto social: Provision of maritime and port services. The purchase, sale, subcontracting, rental, exchange, assignment, and any activity, legal action, contract or business, related to businesses, investments and personal and real property.
Directorio: Javier Bitar (10), Felipe Rioja, Harry Marcus Nadle and Roberto Larraín (12).
Gerente general: Harry Marcus Nadle
Company Name: SAAM REMOLCADORES COLOMBIA S.A.S.
Legal Nature: Corporation (Colombia)
Subscribed and paid-in capital: Col$3,564,959,000
Total share: 99.9995%
% of investment over total assets of parent company:
0.11%
Company object: (i) Provide services in ports directly related to port activities, such as loading and unloading, warehousing, pilotage, towing, boats, stevedoring, cargo land handling or conveyance, dredging, classification, mooring and unmooring, conditioning and supply of booms and rigging, opening of warehouses and between-decks, tally, tie up, recognizing and classification, containers’ loading and unloading , cargo packing, repairing cargo packing, weighing and determining cubic capacity, equipment rental, reception of waste ballast, container repairs.; ii) execution of various maritime activities and provision of services required by them, including (but not limited to) maritime towage activities, consisting in all operations and services in maneuvers of assistance, support, transport and salvage, provided to vessels and naval artifacts within territorial waters and Colombian ports by means of tugboats, and iii) carry out any kind of lawful activity.
Board of Directors: Javier Bitar (10), Felipe Rioja.and Roberto Larraín (12)
General Manager: Juan Pablo González
SAAM REMOLCADORES S.A.Company Name: SAAM REMOLCADORES S.A.
Legal Nature: Corporation (Panama)
Subscribed and paid-in capital: US$10,000
Total share: 99.9995%
% of investment over total assets of parent company:
0.38%
Company object: To provide tugboat services in any port in accordance with private contract or public concession..
Board of Directors: Julio E. Linares, Felipe Rioja and Roberto Larraín (12)
83
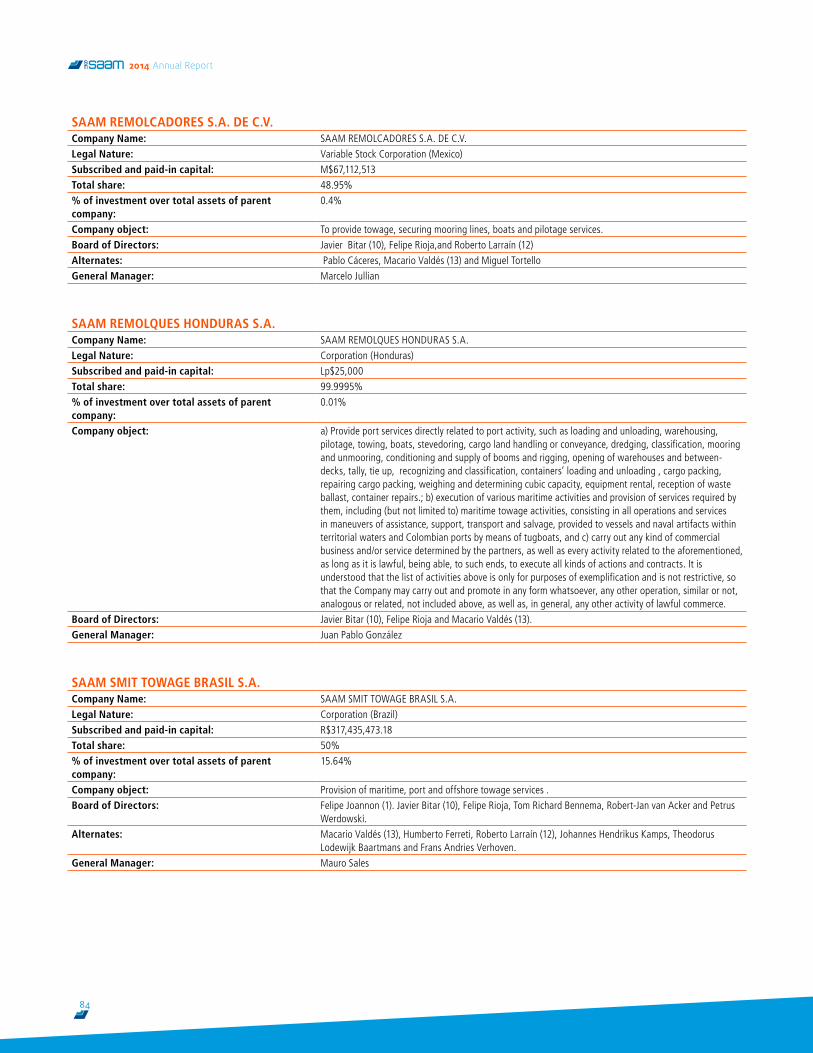
SAAM REMOLCADORES S.A. DE C.V.Company Name: SAAM REMOLCADORES S.A. DE C.V.
Legal Nature: Variable Stock Corporation (Mexico)
Subscribed and paid-in capital: M$67,112,513
Total share: 48.95%
% of investment over total assets of parent company:
0.4%
Company object: To provide towage, securing mooring lines, boats and pilotage services.
Board of Directors: Javier Bitar (10), Felipe Rioja,and Roberto Larraín (12)
Alternates: Pablo Cáceres, Macario Valdés (13) and Miguel Tortello
General Manager: Marcelo Jullian
SAAM REMOLQUES HONDURAS S.A.Company Name: SAAM REMOLQUES HONDURAS S.A.
Legal Nature: Corporation (Honduras)
Subscribed and paid-in capital: Lp$25,000
Total share: 99.9995%
% of investment over total assets of parent company:
0.01%
Company object: a) Provide port services directly related to port activity, such as loading and unloading, warehousing, pilotage, towing, boats, stevedoring, cargo land handling or conveyance, dredging, classification, mooring and unmooring, conditioning and supply of booms and rigging, opening of warehouses and between-decks, tally, tie up, recognizing and classification, containers’ loading and unloading , cargo packing, repairing cargo packing, weighing and determining cubic capacity, equipment rental, reception of waste ballast, container repairs.; b) execution of various maritime activities and provision of services required by them, including (but not limited to) maritime towage activities, consisting in all operations and services in maneuvers of assistance, support, transport and salvage, provided to vessels and naval artifacts within territorial waters and Colombian ports by means of tugboats, and c) carry out any kind of commercial business and/or service determined by the partners, as well as every activity related to the aforementioned, as long as it is lawful, being able, to such ends, to execute all kinds of actions and contracts. It is understood that the list of activities above is only for purposes of exemplification and is not restrictive, so that the Company may carry out and promote in any form whatsoever, any other operation, similar or not, analogous or related, not included above, as well as, in general, any other activity of lawful commerce.
Board of Directors: Javier Bitar (10), Felipe Rioja and Macario Valdés (13).
General Manager: Juan Pablo González
SAAM SMIT TOWAGE BRASIL S.A.Company Name: SAAM SMIT TOWAGE BRASIL S.A.
Legal Nature: Corporation (Brazil)
Subscribed and paid-in capital: R$317,435,473.18
Total share: 50%
% of investment over total assets of parent company:
15.64%
Company object: Provision of maritime, port and offshore towage services .
Board of Directors: Felipe Joannon (1). Javier Bitar (10), Felipe Rioja, Tom Richard Bennema, Robert-Jan van Acker and Petrus Werdowski.
Alternates: Macario Valdés (13), Humberto Ferreti, Roberto Larraín (12), Johannes Hendrikus Kamps, Theodorus Lodewijk Baartmans and Frans Andries Verhoven.
General Manager: Mauro Sales
84
2014 Annual Report

SAAM SMIT TOWAGE MÉXICO S.A. DE C.V.Company Name: SAAM SMIT TOWAGE MÉXICO S.A. DE C.V.
Legal Nature: Variable Stock Corporation (Mexico)
Subscribed and paid-in capital: M$ 31,817,810
Total share: 50.9997%
% of investment over total assets of parent company:
13.88%
Company object: To provide port services such as towage, securing mooring lines, and boats.
Board of Directors: Felipe Joannon (1). Javier Bitar (10), Felipe Rioja, Tom Richard Bennema and Robert-Jan van Acker.
Alternates: Macario Valdés (13), Humberto Ferreti, Roberto Larraín (12), Johannes Hendrikus Kamps and Frans Andries Verhoven.
General Manager: Marcelo Jullian
SMIT CANADA HOLDING INC.Company Name: SMIT CANADA HOLDING INC.
Legal Nature: Corporation (Canada)
Subscribed and paid-in capital: C$14,640
Total share: 50.999%
% of investment over total assets of parent company:
7.59%
Company object: Holding Company
Administration: Robert-Jan van Acker
SMIT HARBOUR TOWAGE VANCOUVER INC.Company Name: SMIT HARBOUR TOWAGE VANCOUVER INC.
Legal Nature: Corporation (Canada)
Subscribed and paid-in capital: C$ 0.01
Total share: 50.9997%
% of investment over total assets of parent company:
0.00%
Company object: Provision of maritime, port and offshore Towage .
Administration: Frans Tjallingii
SMIT HARBOUR TOWAGE NORTHERN BC INC. (No operativa)Company Name: SMIT HARBOUR TOWAGE NORTHERN BC INC.
Legal Nature: Corporation (Canada)
Subscribed and paid-in capital: C$ 100
Total share: 50.9997%
% of investment over total assets of parent company:
0.00%
Company object: Provision of maritime, port and offshore Towage
Administration: Frans Tjallingii
SMIT HARBOUR TOWAGE WESTMINSTER INC.Company Name: SMIT HARBOUR TOWAGE WESTMINSTER INC.
Legal Nature: Corporation (Canada)
Subscribed and paid-in capital: C$ 1
Total share: 50.9997%
% of investment over total assets of parent company:
0.00%
Company object: Provision of maritime, port and offshore Towage .
Administration: Frans Tjallingii
85
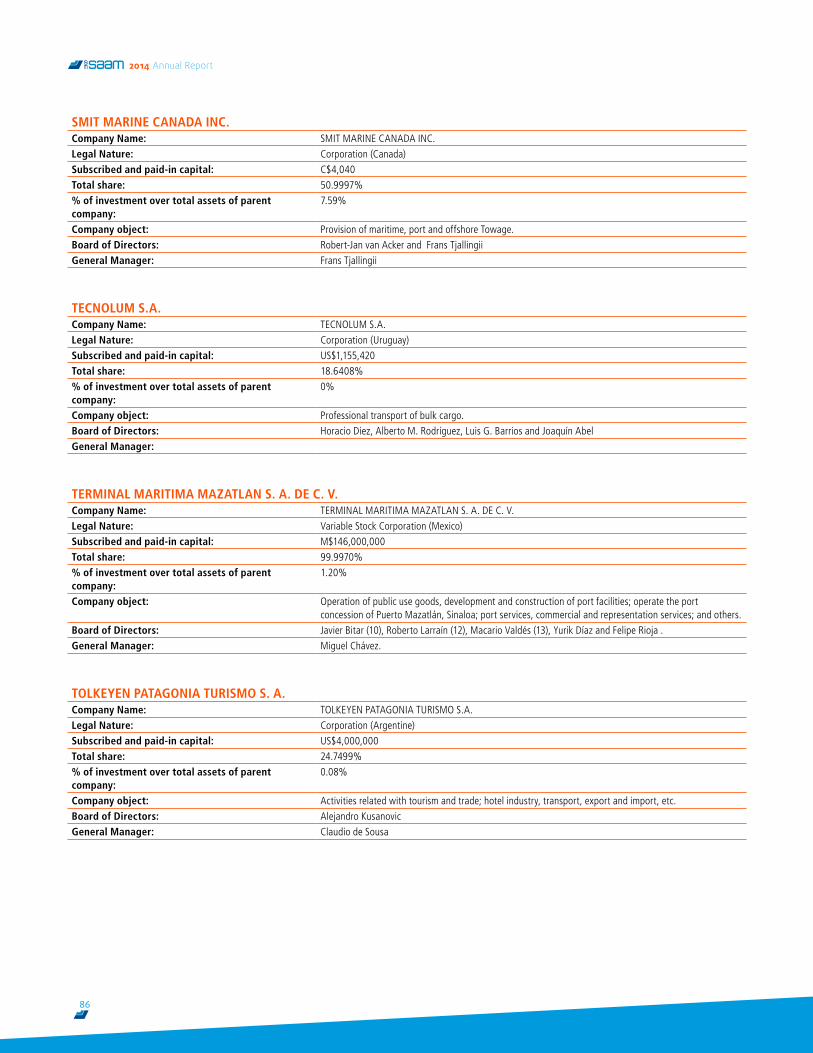
SMIT MARINE CANADA INC.Company Name: SMIT MARINE CANADA INC.
Legal Nature: Corporation (Canada)
Subscribed and paid-in capital: C$4,040
Total share: 50.9997%
% of investment over total assets of parent company:
7.59%
Company object: Provision of maritime, port and offshore Towage.
Board of Directors: Robert-Jan van Acker and Frans Tjallingii
General Manager: Frans Tjallingii
TECNOLUM S.A.Company Name: TECNOLUM S.A.
Legal Nature: Corporation (Uruguay)
Subscribed and paid-in capital: US$1,155,420
Total share: 18.6408%
% of investment over total assets of parent company:
0%
Company object: Professional transport of bulk cargo.
Board of Directors: Horacio Diez, Alberto M. Rodríguez, Luis G. Barrios and Joaquín Abel
General Manager:
TERMINAL MARITIMA MAZATLAN S. A. DE C. V.Company Name: TERMINAL MARITIMA MAZATLAN S. A. DE C. V.
Legal Nature: Variable Stock Corporation (Mexico)
Subscribed and paid-in capital: M$146,000,000
Total share: 99.9970%
% of investment over total assets of parent company:
1.20%
Company object: Operation of public use goods, development and construction of port facilities; operate the port concession of Puerto Mazatlán, Sinaloa; port services, commercial and representation services; and others.
Board of Directors: Javier Bitar (10), Roberto Larraín (12), Macario Valdés (13), Yurik Díaz and Felipe Rioja .
General Manager: Miguel Chávez.
TOLKEYEN PATAGONIA TURISMO S. A.Company Name: TOLKEYEN PATAGONIA TURISMO S.A.
Legal Nature: Corporation (Argentine)
Subscribed and paid-in capital: US$4,000,000
Total share: 24.7499%
% of investment over total assets of parent company:
0.08%
Company object: Activities related with tourism and trade; hotel industry, transport, export and import, etc.
Board of Directors: Alejandro Kusanovic
General Manager: Claudio de Sousa
86
2014 Annual Report

TRABAJOS MARITIMOS S. A.Company Name: TRABAJOS MARITIMOS S.A. (TRAMARSA)
Legal Nature: Corporation (Peru)
Subscribed and paid-in capital: N/$10,000,000
Total share: 48.9997%
% of investment over total assets of parent company:
4.45%
Company object: Maritime transport, coastal trade, vessel towage, maritime agent, port operator, loading and unloading of ships in port, provision of fuel, pilotage, equipment rental s, and logistic support.
Board of Directors: Luis Romero, José Antonio Onrubia , Emilio Fantozzi, Calixto Romero, Javier Bitar (10), Macario Valdés (13), Felipe Rioja and Álvaro Galindo (Executive Director).
General Manager: Mario Hart
TRANSAEREO LTDA.Company Name: TRANSAEREO LTDA.
Legal Nature: Limited Liability Company (Colombia)
Subscribed and paid-in capital: Col$1,000,000
Total share: 24.9999%
% of investment over total assets of parent company:
0.6%
Company object: To provide airport services, cargo handling on land, as well as other airport-related services and facilities..
Board of Directors: Gabriel Salinas, Juan Garrido, Daniel Cundy and Patricio Latorre
General Manager: Hans Timcke
TUG BRASIL APOIO MARITIMO PORTUARIO S.A.Company Name: TUG BRASIL APOIO PORTUARIO S.A.
Legal Nature: Corporation (Brazil)
Subscribed and paid-in capital: R$153,008,292
Total share: 50%
% of investment over total assets of parent company:
9.49%
Company object: Operation of port and maritime navigation activities. Rental to third parties of equipment and vessels. Participation in civil and commercial companies, as partner or shareholder.
Board of Directors: Administrative Council run by their Legal Representatives.
General Manager: Mauro Sales
VIRTUAL LOGISTICS MARINE SERVICES INC. Company Name: VIRTUAL LOGISTICS MARINE SERVICES INC.
Legal Nature: Corporation (Panama)
Subscribed and paid-in capital: US$10,000
Total share: 50.9997%
% of investment over total assets of parent company:
0.67%
Company object: General maritime services including: towage, pilotage, boats, fire and pollution control, salvages, maritime traffic control in various ports in Panama.
Board of Directors: Arjen van Dijk, Edwin Ros and Walter van der Dussen.
General Manager: Walter van der Dussen
87
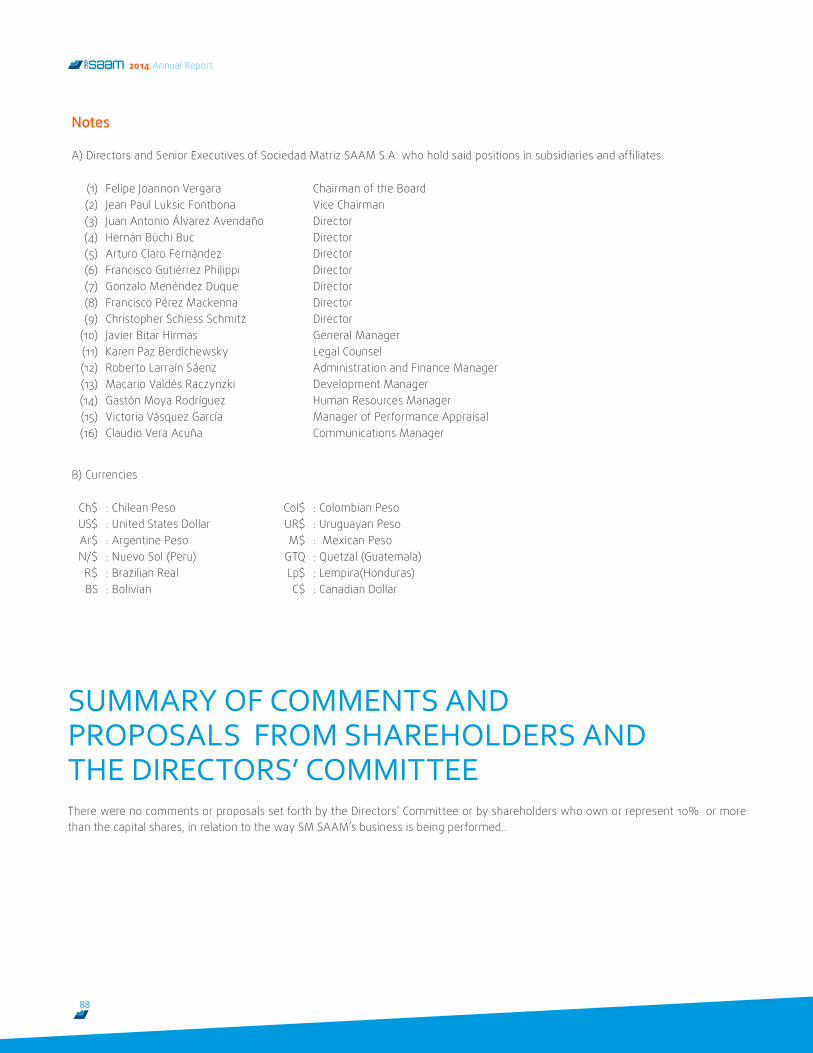
SUMMARY OF COMMENTS AND PROPOSALS FROM SHAREHOLDERS AND THE DIRECTORS’ COMMITTEE
Notes
A) Directors and Senior Executives of Sociedad Matriz SAAM S.A. who hold said positions in subsidiaries and affiliates:
(1) Felipe Joannon Vergara Chairman of the Board (2) Jean Paul Luksic Fontbona Vice Chairman (3) Juan Antonio Álvarez Avendaño Director (4) Hernán Büchi Buc Director(5) Arturo Claro Fernández Director (6) Francisco Gutiérrez Philippi Director (7) Gonzalo Menéndez Duque Director (8) Francisco Pérez Mackenna Director (9) Christopher Schiess Schmitz Director
(10) Javier Bitar Hirmas General Manager (11) Karen Paz Berdichewsky Legal Counsel (12) Roberto Larraín Sáenz Administration and Finance Manager (13) Macario Valdés Raczynzki Development Manager (14) Gastón Moya Rodríguez Human Resources Manager (15) Victoria Vásquez García Manager of Performance Appraisal (16) Claudio Vera Acuña Communications Manager
B) Currencies
Ch$ : Chilean Peso Col$ : Colombian Peso US$ : United States Dollar UR$ : Uruguayan Peso Ar$ : Argentine Peso M$ : Mexican Peso N/$ : Nuevo Sol (Peru) GTQ : Quetzal (Guatemala) R$ : Brazilian Real Lp$ : Lempira(Honduras) BS : Bolivian C$ : Canadian Dollar
There were no comments or proposals set forth by the Directors’ Committee or by shareholders who own or represent 10% or more than the capital shares, in relation to the way SM SAAM’s business is being performed..
88
2014 Annual Report
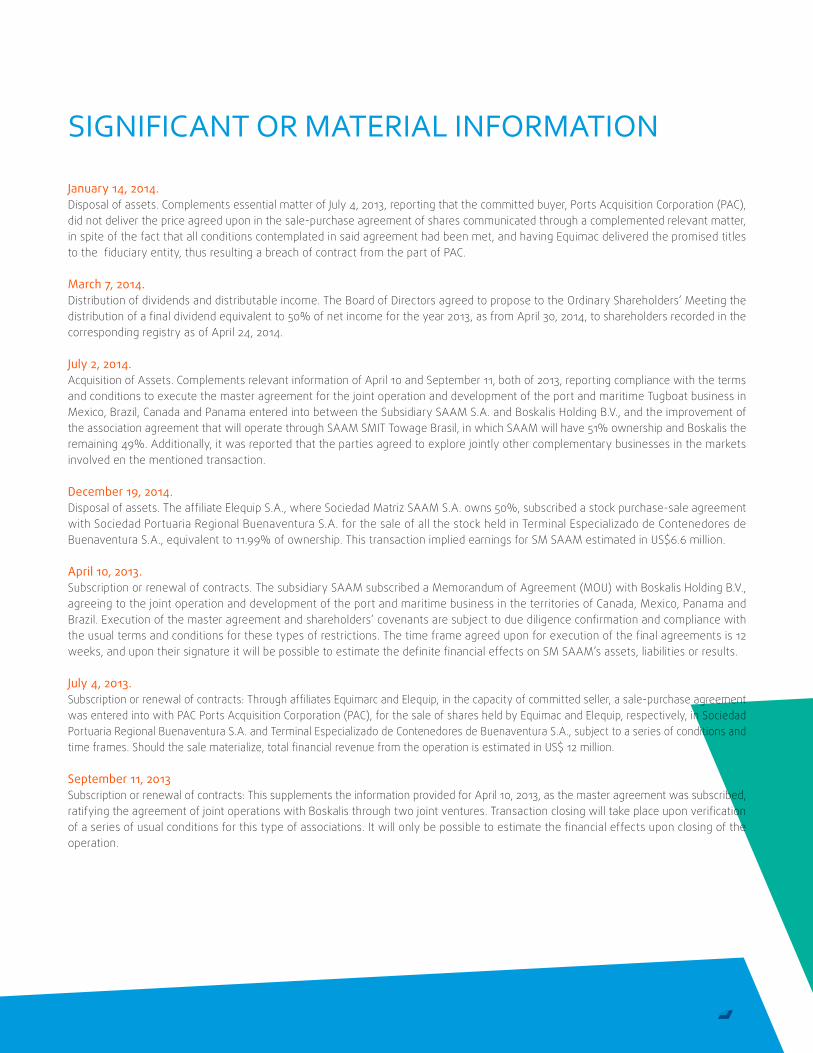
SIGNIFICANT OR MATERIAL INFORMATION
January 14, 2014. Disposal of assets. Complements essential matter of July 4, 2013, reporting that the committed buyer, Ports Acquisition Corporation (PAC), did not deliver the price agreed upon in the sale-purchase agreement of shares communicated through a complemented relevant matter, in spite of the fact that all conditions contemplated in said agreement had been met, and having Equimac delivered the promised titles to the fiduciary entity, thus resulting a breach of contract from the part of PAC.
March 7, 2014. Distribution of dividends and distributable income. The Board of Directors agreed to propose to the Ordinary Shareholders’ Meeting the distribution of a final dividend equivalent to 50% of net income for the year 2013, as from April 30, 2014, to shareholders recorded in the corresponding registry as of April 24, 2014.
July 2, 2014. Acquisition of Assets. Complements relevant information of April 10 and September 11, both of 2013, reporting compliance with the terms and conditions to execute the master agreement for the joint operation and development of the port and maritime Tugboat business in Mexico, Brazil, Canada and Panama entered into between the Subsidiary SAAM S.A. and Boskalis Holding B.V., and the improvement of the association agreement that will operate through SAAM SMIT Towage Brasil, in which SAAM will have 51% ownership and Boskalis the remaining 49%. Additionally, it was reported that the parties agreed to explore jointly other complementary businesses in the markets involved en the mentioned transaction.
December 19, 2014. Disposal of assets. The affiliate Elequip S.A., where Sociedad Matriz SAAM S.A. owns 50%, subscribed a stock purchase-sale agreement with Sociedad Portuaria Regional Buenaventura S.A. for the sale of all the stock held in Terminal Especializado de Contenedores de Buenaventura S.A., equivalent to 11.99% of ownership. This transaction implied earnings for SM SAAM estimated in US$6.6 million.
April 10, 2013.Subscription or renewal of contracts. The subsidiary SAAM subscribed a Memorandum of Agreement (MOU) with Boskalis Holding B.V., agreeing to the joint operation and development of the port and maritime business in the territories of Canada, Mexico, Panama and Brazil. Execution of the master agreement and shareholders’ covenants are subject to due diligence confirmation and compliance with the usual terms and conditions for these types of restrictions. The time frame agreed upon for execution of the final agreements is 12 weeks, and upon their signature it will be possible to estimate the definite financial effects on SM SAAM’s assets, liabilities or results.
July 4, 2013.Subscription or renewal of contracts: Through affiliates Equimarc and Elequip, in the capacity of committed seller, a sale-purchase agreement was entered into with PAC Ports Acquisition Corporation (PAC), for the sale of shares held by Equimac and Elequip, respectively, in Sociedad Portuaria Regional Buenaventura S.A. and Terminal Especializado de Contenedores de Buenaventura S.A., subject to a series of conditions and time frames. Should the sale materialize, total financial revenue from the operation is estimated in US$ 12 million.
September 11, 2013 Subscription or renewal of contracts: This supplements the information provided for April 10, 2013, as the master agreement was subscribed, ratifying the agreement of joint operations with Boskalis through two joint ventures. Transaction closing will take place upon verification of a series of usual conditions for this type of associations. It will only be possible to estimate the financial effects upon closing of the operation.
89
FINANCIAL STATEMENTSSociedad Matriz SAAM S.A. and Subsidiary
CONTENTS• Independent Auditors’ Report• Consolidated Statements of Financial Position• Consolidated Statements of Comprehensive Income by Function• Consolidated Statements of Cash Flows• Consolidated Statements of Changes in Equity• Notes to the Consolidated Financial Statements
ThUS$ (amounts expressed in thousands of United States dollars)
90
2014 Annual Report
91
KPMG Auditores Consultores Ltda. Av. Isidora Goyenechea 3520, Piso 2 Las Condes, Santiago, Chile
Teléfono +56 (2) 2798 1000 Fax +56 (2) 2798 1001 www.kpmg.cl
KPMG Auditores Consultores Ltda. Av. Isidora Goyenechea 3520, Piso 2 Las Condes, Santiago, Chile
KPMG Auditores Consultores Ltda., Sociedad de responsabilidad limitada chilena y una firma miembro de la red de firmas miembro independiente de KPMG afiliadas a KPMG International Cooperative (“KPMG International”), una entidad Suiza, Todo los derechos reservados.
Independent Auditor’s Report
The Shareholders and Directors of Sociedad Matriz SAAM S.A.:
Report on the financial statements
We have audited the accompanying consolidated financial statements of Sociedad Matriz SAAM S.A. and its subsidiary, which comprise the consolidated statement of financial position as of December 31, 2014 and the related consolidated statements of comprehensive income, changes in equity, and cash flows for the year then ended, and the related notes to the financial statements.
Management’s responsibility for the consolidated financial statements
Management is responsible for the preparation and fair presentation of these consolidated financial statements in accordance with the instructions and standards for the preparation and presentation of financial information issued by the Chilean Superintendence of Securities and Insurance (SVS) described in Note 2 a) to the consolidated financial statements; this includes the design, implementation, and maintenance of internal control relevant to the preparation and fair presentation of consolidated financial statements that are free from material misstatement, whether due to fraud or error.
Auditors’ responsibility
Our responsibility is to express an opinion on these consolidated financial statements based on our audits. We did not audit the financial statements of certain indirect associates, reflected in the financial statements under the equity method of accounting, which statements reflect total consolidated assets of ThUS$22,218 as of December 31, 2014, and accrued net profit of ThUS$10,717 for the period then ended. Those financial statements were audited by other auditors, whose report have been furnished to us and our opinion, insofar as it relates to the amounts included for those associates and subsidiaries, is based solely on the report of the other auditors. We conducted our audits in accordance with auditing standards generally accepted in Chile. Those standards require that we plan and perform an audit to obtain reasonable assurance about whether the financial statements are free of material misstatement.
An audit involves performing procedures to obtain audit evidence about the amounts and disclosures in the consolidated financial statements. The procedures selected depend on the auditor’s judgment, including the assessment of the risks of material misstatement of the consolidated financial statements, whether due to fraud or error. In making those risk assessments, the auditor considers internal control relevant to the entity’s preparation and fair presentation of the financial statements in order to design audit procedures that are appropriate in the circumstances, but not for the purpose of expressing an opinion on the effectiveness of the entity’s internal control. Accordingly, we express no such opinion. An audit also includes evaluating the appropriateness of accounting policies used and the reasonableness of significant accounting estimates made by management, as well as evaluating the overall presentation of the consolidated financial statements.
92
2014 Annual Report
KPMG Auditores Consultores Ltda., Sociedad de responsabilidad limitada chilena y una firma miembro de la red de firmas miembro independiente de KPMG afiliadas a KPMG International Cooperative (“KPMG International”), una entidad Suiza, Todo los derechos reservados.
We believe that the audit evidence that we have obtained is sufficient and appropriate to provide a basis for our audit opinion.
Opinion on the regulatory basis of accounting
In our opinion, based on our audit and other auditors’ reports, the consolidated financial statements referred to above present fairly, in all material respects, the financial position of Sociedad Matriz SAAM S.A. and its subsidiary as of December 31, 2014, and the results of their operations and their cash flows for the year then ended in accordance with instructions and standards for the preparation and presentation of financial information issued by the Chilean Superintendence of Securities and Insurance (SVS) described in Note 2 a) to the consolidated financial statements.
Basis of accounting
As described in Note 2 a) to the consolidated financial statements, by virtue of its powers, the Chilean Superintendence of Securities and Insurance (SVS) on October 17, 2014 issued Circular No.856 requiring regulated entities to record the differences in deferred tax assets and liabilities generated by the direct impact of the increase in the corporate income tax rate required by Law No.20.780 against equity, changing the accounting framework for the preparation and presentation of financial information adopted up to that date, because the accounting framework previously used (IFRS) requires its full, explicit and unreserved adoption. As of December 31, 2014 and for the year then ended, the quantification of the change in the accounting framework is also described in Note 21 to the consolidated financial statements. Our opinion is not modified with respect to this matter.
Other matters
We have previously audited, in accordance with auditing standards generally accepted in Chile, the accompanying consolidated financial statements as of December 31, 2013 of Sociedad Matriz SAAM S.A. and its subsidiary, and in our report thereon dated February 28, 2014, we expressed an unmodified audit opinion on those consolidated financial statements, based on our audit and other auditors’ reports.
The above translation of the auditor’s report is provided as a free translation from the Spanish language original, which is the official and binding version. Such translation has been made solely for the convenience of non-Spanish readers.
Gonzalo Rojas Ruz KPMG Ltda.
Viña del Mar, March 6, 2015
93
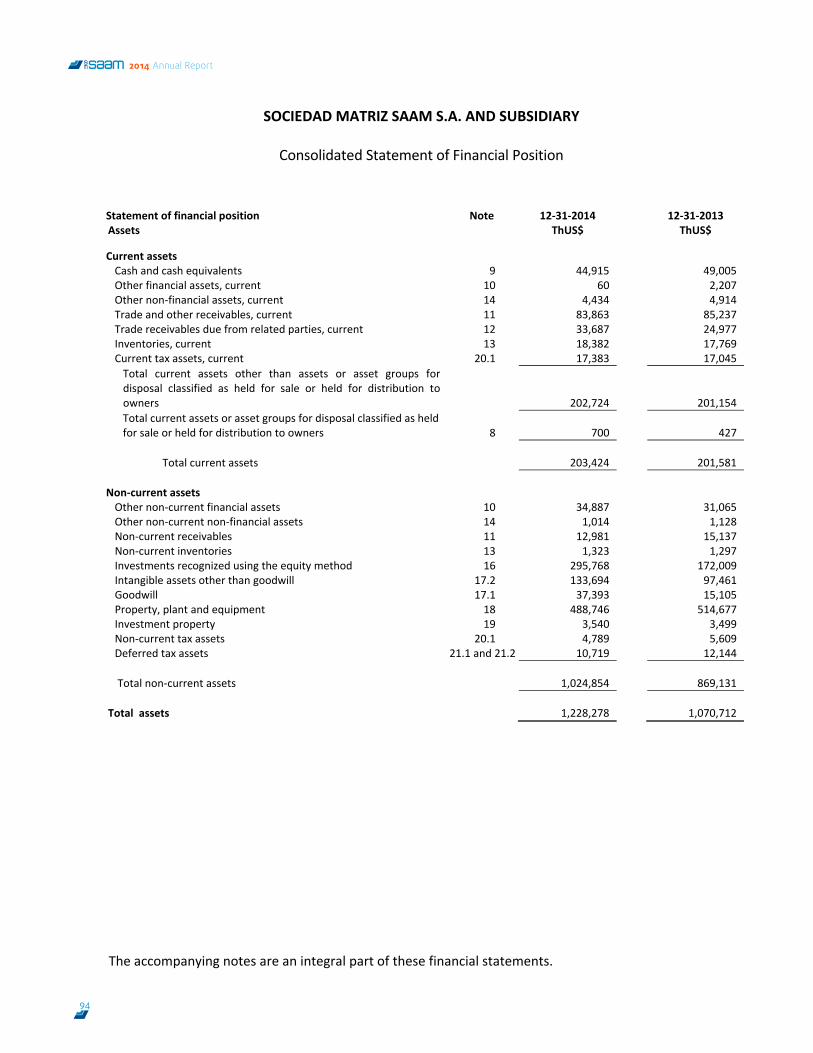
SOCIEDAD MATRIZ SAAM S.A. AND SUBSIDIARY
Consolidated Statement of Financial Position
The accompanying notes are an integral part of these financial statements.
3
Statement of financial position Note
12‐31‐2014
12‐31‐2013 Assets ThUS$ ThUS$
Current assets
Cash and cash equivalents 9 44,915 49,005 Other financial assets, current 10 60 2,207 Other non‐financial assets, current 14 4,434 4,914 Trade and other receivables, current 11 83,863 85,237 Trade receivables due from related parties, current 12 33,687 24,977 Inventories, current 13 18,382 17,769 Current tax assets, current 20.1 17,383 17,045 Total current assets other than assets or asset groups for disposal classified as held for sale or held for distribution to owners 202,724 201,154 Total current assets or asset groups for disposal classified as held for sale or held for distribution to owners 8 700
427
Total current assets 203,424 201,581
Non‐current assets Other non‐current financial assets 10 34,887 31,065 Other non‐current non‐financial assets 14 1,014 1,128 Non‐current receivables 11 12,981 15,137 Non‐current inventories 13 1,323 1,297 Investments recognized using the equity method 16 295,768 172,009 Intangible assets other than goodwill 17.2 133,694 97,461 Goodwill 17.1 37,393 15,105 Property, plant and equipment 18 488,746 514,677 Investment property 19 3,540 3,499 Non‐current tax assets 20.1 4,789 5,609 Deferred tax assets 21.1 and 21.2 10,719 12,144 Total non‐current assets 1,024,854 869,131
Total assets 1,228,278 1,070,712
94
2014 Annual Report
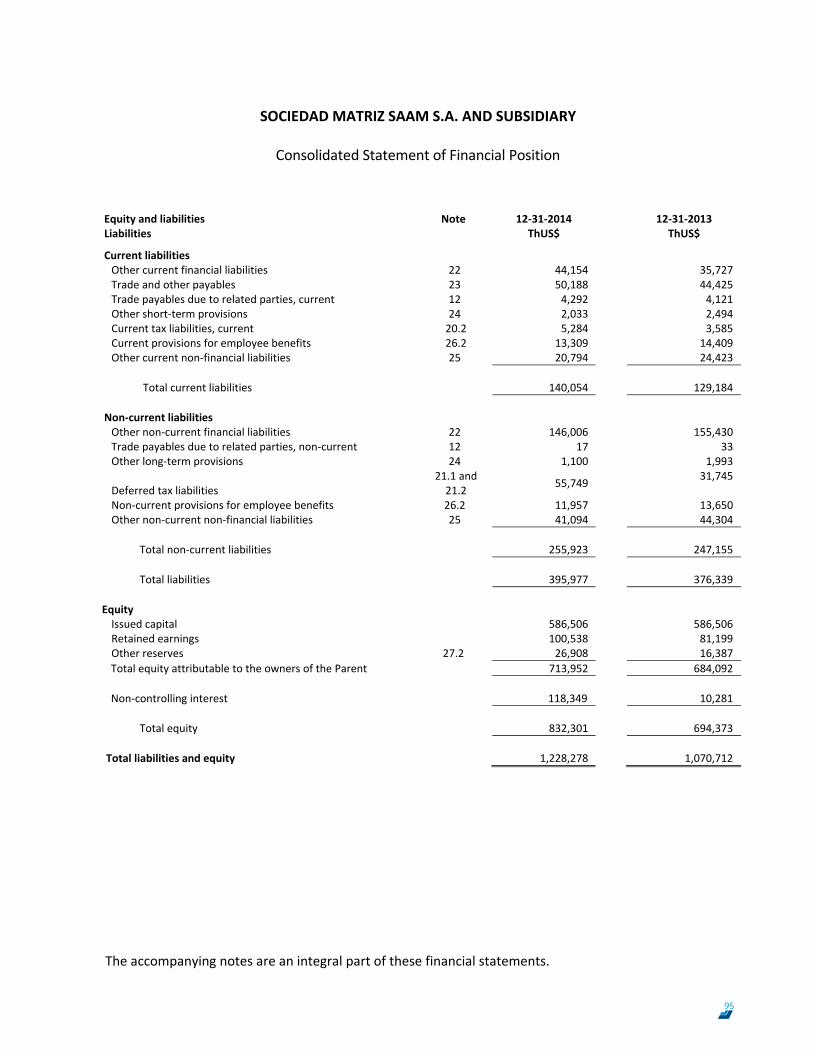
SOCIEDAD MATRIZ SAAM S.A. AND SUBSIDIARY
Consolidated Statement of Financial Position
The accompanying notes are an integral part of these financial statements.
4
Equity and liabilities Note
12‐31‐2014
12‐31‐2013 Liabilities ThUS$ ThUS$ Current liabilities Other current financial liabilities 22 44,154 35,727 Trade and other payables 23 50,188 44,425 Trade payables due to related parties, current 12 4,292 4,121 Other short‐term provisions 24 2,033 2,494 Current tax liabilities, current 20.2 5,284 3,585 Current provisions for employee benefits 26.2 13,309 14,409 Other current non‐financial liabilities 25 20,794 24,423
Total current liabilities 140,054 129,184
Non‐current liabilities Other non‐current financial liabilities 22 146,006 155,430 Trade payables due to related parties, non‐current 12 17 33 Other long‐term provisions 24 1,100 1,993
Deferred tax liabilities 21.1 and 21.2 55,749 31,745
Non‐current provisions for employee benefits 26.2 11,957 13,650 Other non‐current non‐financial liabilities 25 41,094 44,304
Total non‐current liabilities 255,923 247,155 Total liabilities 395,977 376,339
Equity Issued capital 586,506 586,506 Retained earnings 100,538 81,199 Other reserves 27.2 26,908 16,387 Total equity attributable to the owners of the Parent 713,952 684,092
Non‐controlling interest 118,349 10,281
Total equity 832,301 694,373
Total liabilities and equity 1,228,278 1,070,712
95
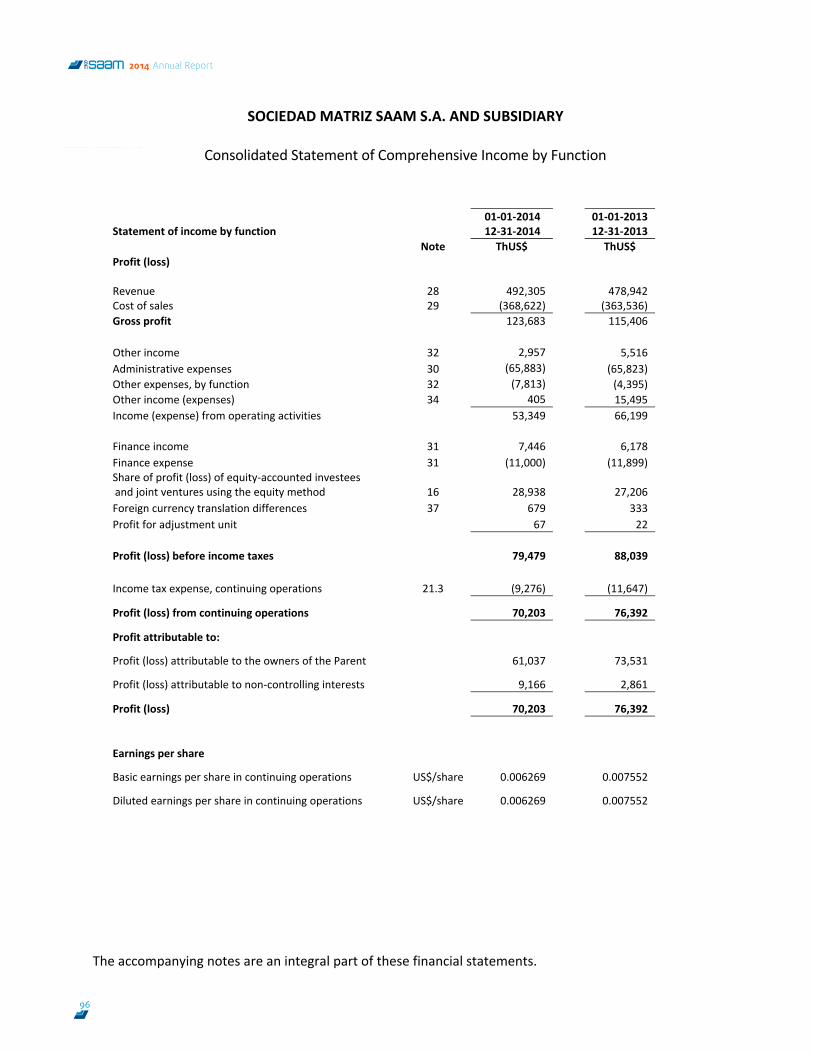
SOCIEDAD MATRIZ SAAM S.A. AND SUBSIDIARY
Consolidated Statement of Comprehensive Income by Function
The accompanying notes are an integral part of these financial statements.
5
Statement of income by function 01‐01‐2014
12‐31‐2014 01‐01‐2013
12‐31‐2013
Note ThUS$ ThUS$ Profit (loss) Revenue 28 492,305
478,942
Cost of sales 29 (368,622) (363,536) Gross profit 123,683 115,406 Other income 32 2,957 5,516 Administrative expenses 30 (65,883) (65,823) Other expenses, by function 32 (7,813) (4,395) Other income (expenses) 34 405 15,495 Income (expense) from operating activities 53,349 66,199 Finance income 31 7,446 6,178 Finance expense 31 (11,000) (11,899) Share of profit (loss) of equity‐accounted investees and joint ventures using the equity method 16 28,938
27,206
Foreign currency translation differences 37 679 333 Profit for adjustment unit 67 22 Profit (loss) before income taxes 79,479 88,039 Income tax expense, continuing operations 21.3 (9,276) (11,647)
Profit (loss) from continuing operations 70,203
76,392
Profit attributable to:
Profit (loss) attributable to the owners of the Parent
61,037
73,531
Profit (loss) attributable to non‐controlling interests
9,166
2,861
Profit (loss)
70,203
76,392
Earnings per share
Basic earnings per share in continuing operations US$/share 0.006269
0.007552
Diluted earnings per share in continuing operations US$/share 0.006269
0.007552
96
2014 Annual Report
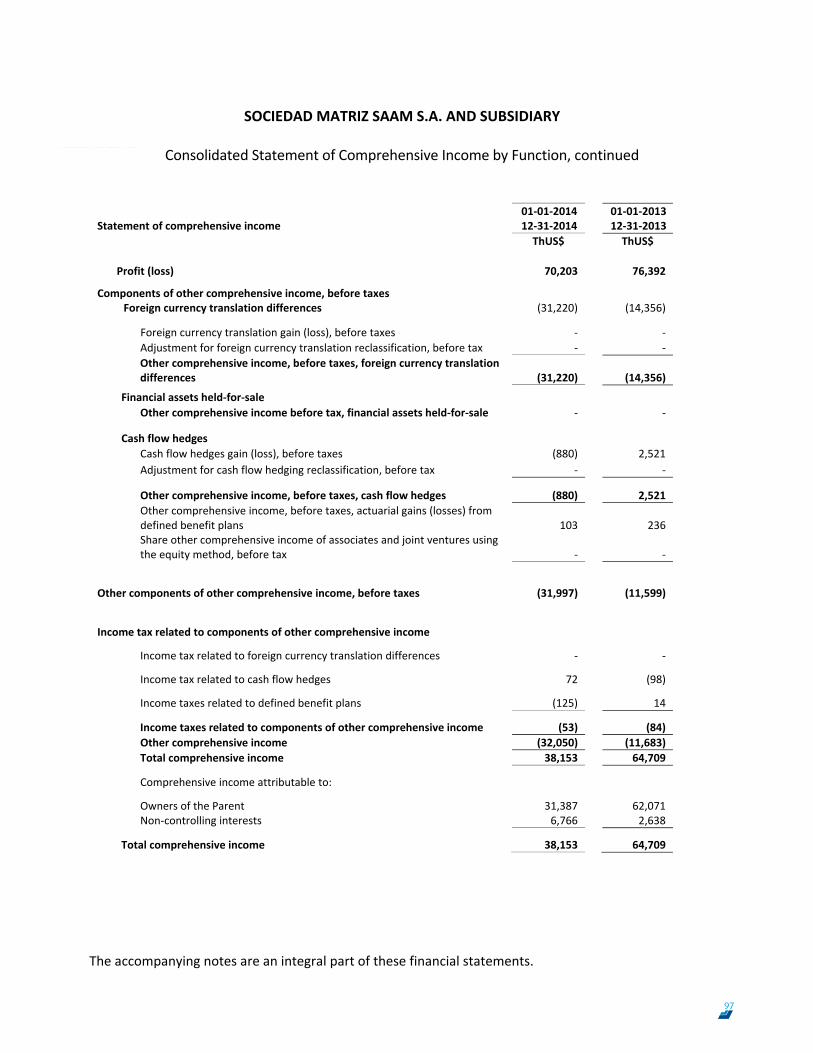
SOCIEDAD MATRIZ SAAM S.A. AND SUBSIDIARY
Consolidated Statement of Comprehensive Income by Function, continued
The accompanying notes are an integral part of these financial statements.
6
Statement of comprehensive income 01‐01‐2014 12‐31‐2014
01‐01‐2013 12‐31‐2013
ThUS$ ThUS$ Profit (loss) 70,203
76,392
Components of other comprehensive income, before taxes
Foreign currency translation differences (31,220) (14,356)
Foreign currency translation gain (loss), before taxes ‐
‐
Adjustment for foreign currency translation reclassification, before tax ‐ ‐ Other comprehensive income, before taxes, foreign currency translation differences (31,220)
(14,356)
Financial assets held‐for‐sale
Other comprehensive income before tax, financial assets held‐for‐sale ‐ ‐
Cash flow hedges
Cash flow hedges gain (loss), before taxes (880) 2,521 Adjustment for cash flow hedging reclassification, before tax ‐ ‐
Other comprehensive income, before taxes, cash flow hedges (880)
2,521
Other comprehensive income, before taxes, actuarial gains (losses) from defined benefit plans 103
236
Share other comprehensive income of associates and joint ventures using the equity method, before tax ‐ ‐
Other components of other comprehensive income, before taxes (31,997)
(11,599)
Income tax related to components of other comprehensive income
Income tax related to foreign currency translation differences ‐ ‐
Income tax related to cash flow hedges 72
(98)
Income taxes related to defined benefit plans (125)
14
Income taxes related to components of other comprehensive income (53)
(84)
Other comprehensive income (32,050) (11,683) Total comprehensive income 38,153 64,709
Comprehensive income attributable to:
Owners of the Parent 31,387
62,071
Non‐controlling interests 6,766 2,638
Total comprehensive income 38,153
64,709
97
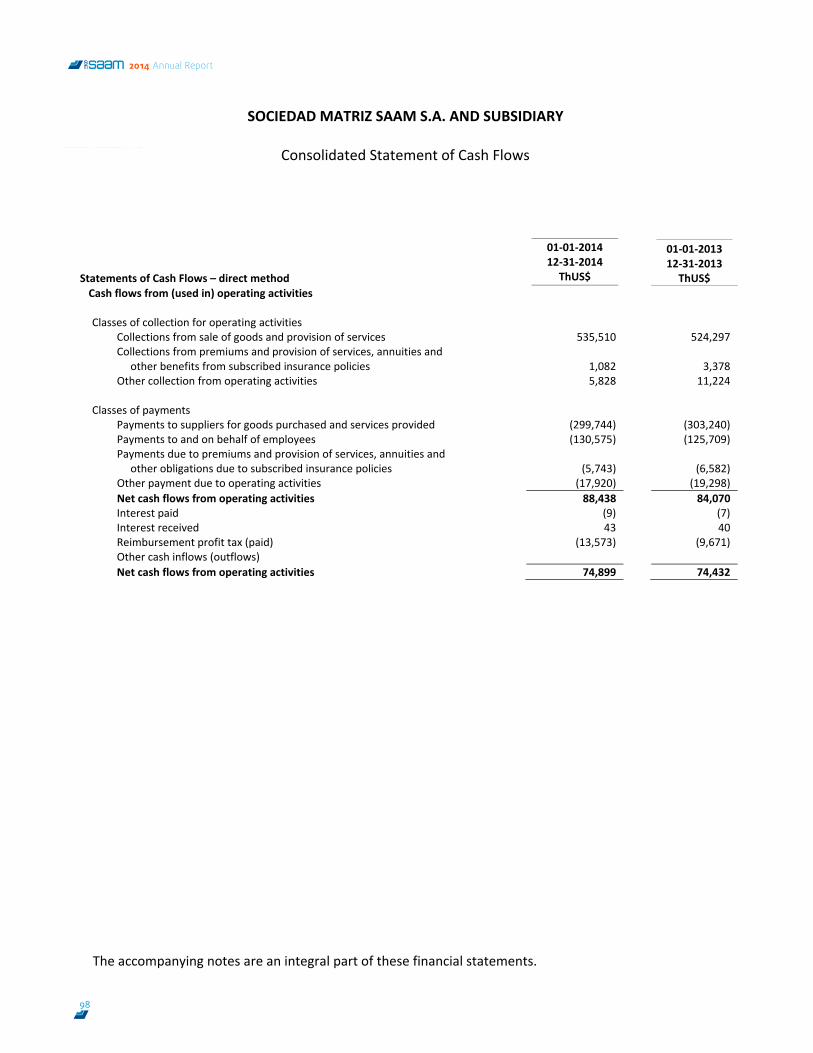
SOCIEDAD MATRIZ SAAM S.A. AND SUBSIDIARY
Consolidated Statement of Cash Flows
The accompanying notes are an integral part of these financial statements.
7
Statements of Cash Flows – direct method
01‐01‐2014 12‐31‐2014 ThUS$
01‐01‐2013 12‐31‐2013 ThUS$
Cash flows from (used in) operating activities Classes of collection for operating activities
Collections from sale of goods and provision of services 535,510 524,297 Collections from premiums and provision of services, annuities and
other benefits from subscribed insurance policies 1,082
3,378 Other collection from operating activities 5,828 11,224
Classes of payments
Payments to suppliers for goods purchased and services provided (299,744) (303,240) Payments to and on behalf of employees (130,575) (125,709) Payments due to premiums and provision of services, annuities and
other obligations due to subscribed insurance policies (5,743)
(6,582) Other payment due to operating activities (17,920) (19,298) Net cash flows from operating activities 88,438 84,070 Interest paid (9) (7) Interest received 43 40 Reimbursement profit tax (paid) (13,573) (9,671) Other cash inflows (outflows) Net cash flows from operating activities 74,899 74,432
98
2014 Annual Report
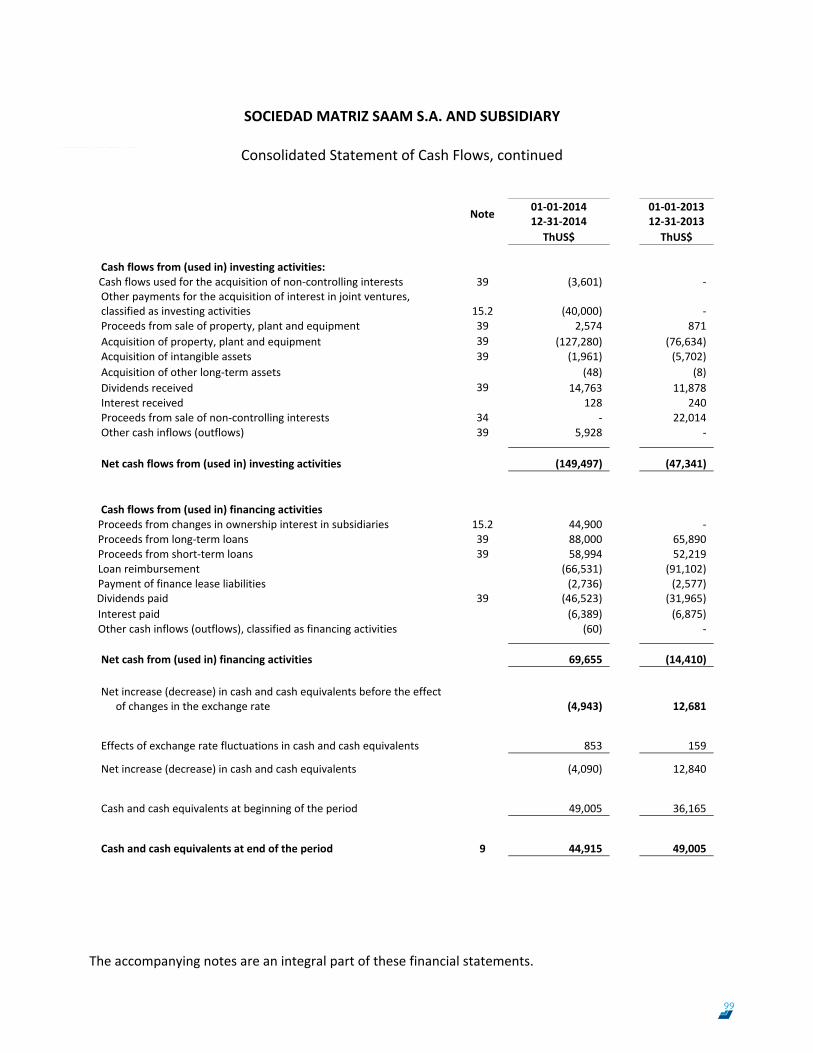
SOCIEDAD MATRIZ SAAM S.A. AND SUBSIDIARY
Consolidated Statement of Cash Flows, continued
The accompanying notes are an integral part of these financial statements.
8
Note 01‐01‐2014 12‐31‐2014
01‐01‐2013 12‐31‐2013
ThUS$ ThUS$
Cash flows from (used in) investing activities:
Cash flows used for the acquisition of non‐controlling interests 39 (3,601) ‐ Other payments for the acquisition of interest in joint ventures, classified as investing activities 15.2 (40,000)
‐
Proceeds from sale of property, plant and equipment 39 2,574 871 Acquisition of property, plant and equipment 39 (127,280) (76,634) Acquisition of intangible assets 39 (1,961) (5,702) Acquisition of other long‐term assets (48) (8) Dividends received 39 14,763 11,878 Interest received 128 240 Proceeds from sale of non‐controlling interests 34 ‐ 22,014 Other cash inflows (outflows) 39 5,928 ‐
Net cash flows from (used in) investing activities (149,497)
(47,341)
Cash flows from (used in) financing activities
Proceeds from changes in ownership interest in subsidiaries 15.2 44,900 ‐ Proceeds from long‐term loans 39 88,000 65,890 Proceeds from short‐term loans 39 58,994 52,219 Loan reimbursement (66,531) (91,102) Payment of finance lease liabilities (2,736) (2,577) Dividends paid 39 (46,523) (31,965) Interest paid (6,389) (6,875) Other cash inflows (outflows), classified as financing activities (60) ‐
Net cash from (used in) financing activities 69,655
(14,410) Net increase (decrease) in cash and cash equivalents before the effect
of changes in the exchange rate (4,943)
12,681
Effects of exchange rate fluctuations in cash and cash equivalents 853
159
Net increase (decrease) in cash and cash equivalents (4,090)
12,840
Cash and cash equivalents at beginning of the period 49,005
36,165
Cash and cash equivalents at end of the period 9 44,915
49,005
99
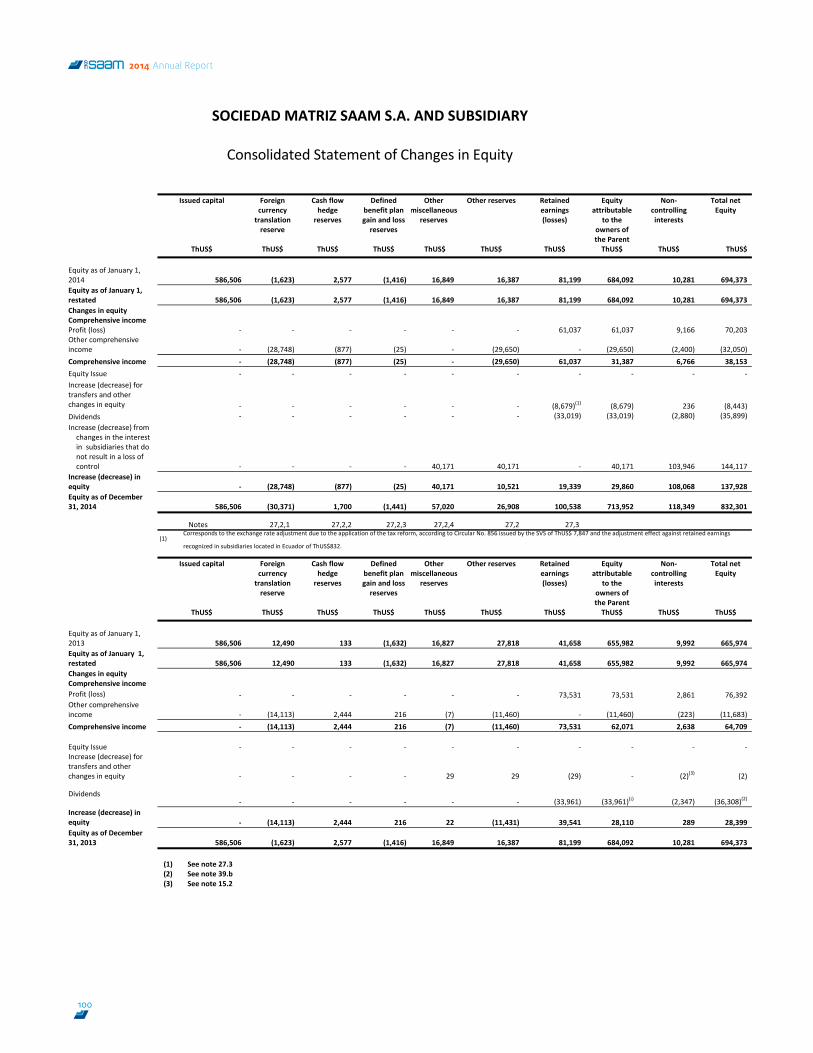
SOCIEDAD MATRIZ SAAM S.A. AND SUBSIDIARY
Consolidated Statement of Changes in Equity
9
Issued capital Foreign currency translation reserve
Cash flow hedge reserves
Defined benefit plan gain and loss reserves
Other miscellaneous
reserves
Other reserves Retained earnings (losses)
Equity attributable
to the owners of the Parent
Non‐controlling interests
Total net Equity
ThUS$ ThUS$ ThUS$ ThUS$ ThUS$ ThUS$ ThUS$ ThUS$ ThUS$ ThUS$ Equity as of January 1, 2014 586,506 (1,623) 2,577 (1,416) 16,849 16,387 81,199 684,092 10,281 694,373 Equity as of January 1, restated 586,506 (1,623) 2,577 (1,416) 16,849 16,387 81,199 684,092 10,281 694,373 Changes in equity Comprehensive income Profit (loss) ‐ ‐ ‐ ‐ ‐ ‐ 61,037 61,037 9,166 70,203 Other comprehensive income ‐ (28,748) (877) (25) ‐ (29,650) ‐ (29,650) (2,400) (32,050) Comprehensive income ‐ (28,748) (877) (25) ‐ (29,650) 61,037 31,387 6,766 38,153 Equity Issue ‐ ‐ ‐ ‐ ‐ ‐ ‐ ‐ ‐ ‐ Increase (decrease) for transfers and other changes in equity ‐ ‐ ‐ ‐ ‐ ‐ (8,679)(1) (8,679) 236 (8,443) Dividends ‐ ‐ ‐ ‐ ‐ ‐ (33,019) (33,019) (2,880) (35,899) Increase (decrease) from
changes in the interest in subsidiaries that do not result in a loss of control ‐ ‐ ‐ ‐ 40,171 40,171 ‐ 40,171 103,946 144,117
Increase (decrease) in equity ‐ (28,748) (877) (25) 40,171 10,521 19,339 29,860 108,068 137,928 Equity as of December 31, 2014 586,506 (30,371) 1,700 (1,441) 57,020 26,908 100,538 713,952 118,349 832,301
Notes 27,2,1 27,2,2 27,2,3 27,2,4 27,2 27,3
(1)
Corresponds to the exchange rate adjustment due to the application of the tax reform, according to Circular No. 856 issued by the SVS of ThUS$ 7,847 and the adjustment effect against retained earnings
recognized in subsidiaries located in Ecuador of ThUS$832.
Issued capital Foreign currency translation reserve
Cash flow hedge reserves
Defined benefit plan gain and loss reserves
Other miscellaneous
reserves
Other reserves Retained earnings (losses)
Equity attributable
to the owners of the Parent
Non‐controlling interests
Total net Equity
ThUS$ ThUS$ ThUS$ ThUS$ ThUS$ ThUS$ ThUS$ ThUS$ ThUS$ ThUS$ Equity as of January 1, 2013 586,506 12,490 133 (1,632) 16,827 27,818 41,658 655,982 9,992 665,974 Equity as of January 1, restated 586,506 12,490 133 (1,632) 16,827 27,818 41,658 655,982 9,992 665,974 Changes in equity Comprehensive income Profit (loss) ‐ ‐ ‐ ‐ ‐ ‐ 73,531 73,531 2,861 76,392 Other comprehensive income ‐ (14,113) 2,444 216 (7) (11,460) ‐ (11,460) (223) (11,683) Comprehensive income ‐ (14,113) 2,444 216 (7) (11,460) 73,531 62,071 2,638 64,709
Equity Issue ‐ ‐ ‐ ‐ ‐ ‐ ‐
‐ ‐ ‐ Increase (decrease) for transfers and other changes in equity ‐ ‐ ‐ ‐ 29 29 (29) ‐ (2)(3) (2)
Dividends ‐ ‐ ‐ ‐ ‐ ‐ (33,961) (33,961)(¡) (2,347) (36,308)(2)
Increase (decrease) in equity ‐ (14,113) 2,444 216 22 (11,431) 39,541 28,110 289 28,399 Equity as of December 31, 2013 586,506 (1,623) 2,577 (1,416) 16,849 16,387 81,199 684,092 10,281 694,373
(1) See note 27.3 (2) See note 39.b (3) See note 15.2
100
2014 Annual Report
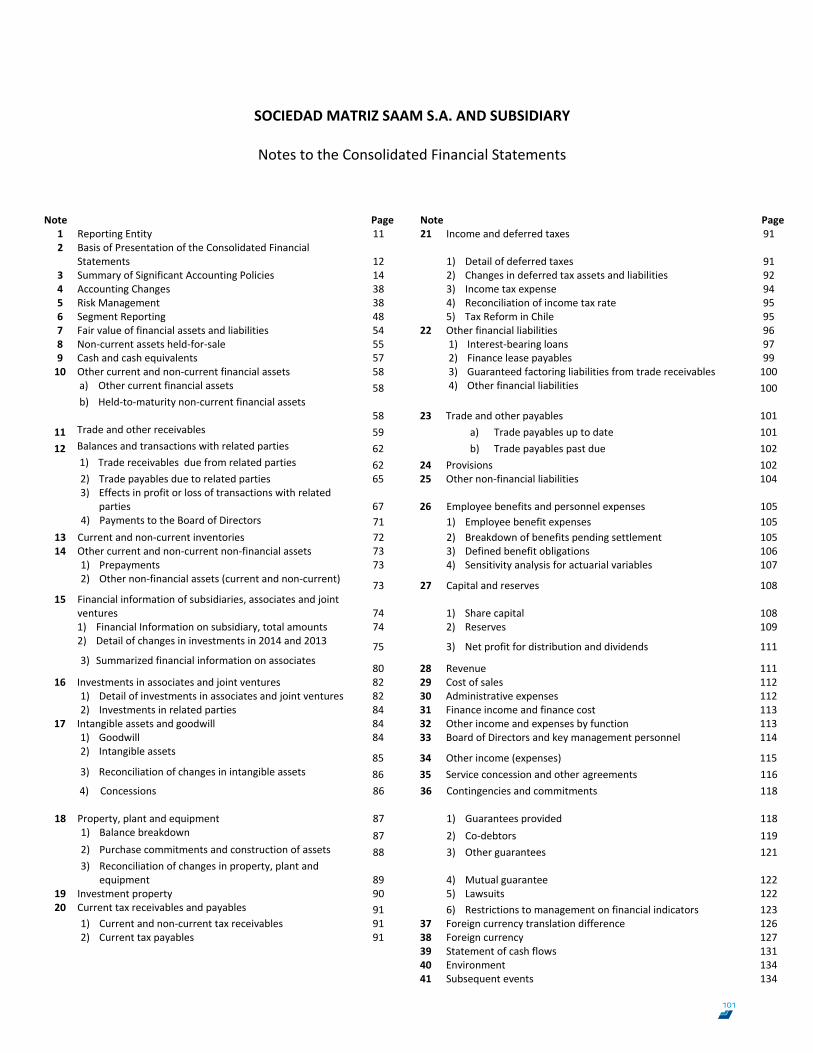
SOCIEDAD MATRIZ SAAM S.A. AND SUBSIDIARY
Notes to the Consolidated Financial Statements
10
Note Page Note Page1 Reporting Entity 11 21 Income and deferred taxes 912 Basis of Presentation of the Consolidated Financial
Statements 12 1) Detail of deferred taxes 91 3 Summary of Significant Accounting Policies 14 2) Changes in deferred tax assets and liabilities 924 Accounting Changes 38 3) Income tax expense 945 Risk Management 38 4) Reconciliation of income tax rate 956 Segment Reporting 48 5) Tax Reform in Chile 957 Fair value of financial assets and liabilities 54 22 Other financial liabilities 968 Non‐current assets held‐for‐sale 55 1) Interest‐bearing loans 979 Cash and cash equivalents 57 2) Finance lease payables 9910 Other current and non‐current financial assets 58 3) Guaranteed factoring liabilities from trade receivables 100 a) Other current financial assets 58 4) Other financial liabilities 100
b) Held‐to‐maturity non‐current financial assets
58 23 Trade and other payables 101 11 Trade and other receivables 59 a) Trade payables up to date 101 12 Balances and transactions with related parties 62 b) Trade payables past due 102 1) Trade receivables due from related parties 62 24 Provisions 102 2) Trade payables due to related parties 65 25 Other non‐financial liabilities 104
3) Effects in profit or loss of transactions with related
parties 67 26 Employee benefits and personnel expenses 105 4) Payments to the Board of Directors 71 1) Employee benefit expenses 105
13 Current and non‐current inventories 72 2) Breakdown of benefits pending settlement 105 14 Other current and non‐current non‐financial assets 73 3) Defined benefit obligations 106 1) Prepayments 73 4) Sensitivity analysis for actuarial variables 107
2) Other non‐financial assets (current and non‐current) 73 27 Capital and reserves 108 15 Financial information of subsidiaries, associates and joint
ventures 74 1) Share capital 108 1) Financial Information on subsidiary, total amounts 74 2) Reserves 109
2) Detail of changes in investments in 2014 and 2013 75 3) Net profit for distribution and dividends 111
3) Summarized financial information on associates
80 28 Revenue 111 16 Investments in associates and joint ventures 82 29 Cost of sales 112 1) Detail of investments in associates and joint ventures 82 30 Administrative expenses 112 2) Investments in related parties 84 31 Finance income and finance cost 113
17 Intangible assets and goodwill 84 32 Other income and expenses by function 113 1) Goodwill 84 33 Board of Directors and key management personnel 114
2) Intangible assets 85 34 Other income (expenses) 115 3) Reconciliation of changes in intangible assets 86 35 Service concession and other agreements 116 4) Concessions 86 36 Contingencies and commitments 118
18 Property, plant and equipment 87 1) Guarantees provided 118
1) Balance breakdown 87 2) Co‐debtors 119 2) Purchase commitments and construction of assets 88 3) Other guarantees 121
3) Reconciliation of changes in property, plant and
equipment 89 4) Mutual guarantee 122 19 Investment property 90 5) Lawsuits 12220 Current tax receivables and payables 91 6) Restrictions to management on financial indicators 123 1) Current and non‐current tax receivables 91 37 Foreign currency translation difference 126 2) Current tax payables 91 38 Foreign currency 127 39 Statement of cash flows 131 40 Environment 134 41 Subsequent events 134
101
SOCIEDAD MATRIZ SAAM S.A. AND SUBSIDIARY
Notes to the Consolidated Financial Statements
11
NOTE 1 Reporting Entity
Sociedad Matriz SAAM S.A. was incorporated on February 15, 2012 whose bylaws are contained in the public deed dated October 14, 2011, as witnessed at the Valparaíso Notary Public of Mr. Luis Enrique Fischer Yávar, which resulted from the wording of the minute of the Extraordinary Stockholders’ Meeting of October 5, 2011. Sociedad Matriz SAAM S.A., (hereinafter SM‐SAAM or the Company) is incorporated with ownership of approximately 99.9995% of the shares by SAAM S.A., a closely‐held corporation. The Company is engaged in providing services related to marine transportation, mainly in the tugboat, port and logistics business. The shares of Sociedad Matriz SAAM S.A., Corporate tax number 76.196.718‐5, registered under No.1.091 at the Securities Register of the Superintendence of Securities and Insurance, first traded on March 1, 2012 and with share capital divided into 9,736,791,983 shares. The domicile of the Company is in Santiago, Chile. The Company is engaged in acquiring, purchasing, selling and disposing shares of closely‐held corporations, shares or rights in other companies, bonds, debentures, commercial papers and other marketable securities; in administrating, transferring and operating them, receiving their benefits and taking advantage of their sale and disposal. That classifies the Company as an investment company whose economic activity code is No.1.300. These consolidated financial statements include the indirect subsidiary Iquique Terminal Internacional S.A., registered under No.57 in the Registry of reporting Entities (Law No.20.382) of the Superintendence of Securities and Insurance. The other indirect subsidiaries are not directly subject to the regulations of this Superintendence. Hereinafter “Sociedad Matriz SAAM S.A. and Subsidary”, will be SM‐SAAM or the Company. The Company conducts its business through SAAM and subsidiaries rendering tugboat, port terminal and logistics services. SM‐SAAM is controlled by the Quiñenco Group, as stated in articles 97 and 99 of the Securities Market Law No.18.045, with 42.44% ownership through the companies Inversiones Río Bravo S.A. (33.25%), Quiñenco S.A. (7.33%) and Inmobiliaria Norte Verde S.A. (1.86%). As of December 31, 2014, SM SAAM has 3,517 registered shareholders (3,526 shareholders as of December 31, 2013).
102
2014 Annual Report
SOCIEDAD MATRIZ SAAM S.A. AND SUBSIDIARY
Notes to the Consolidated Financial Statements
12
NOTE 2 Basis of Presentation of the Consolidated Financial Statements
a. Statement of compliance
Financial statements as of December 31, 2014 The consolidated financial statements as of December 31, 2014 and for the year then ended, have been prepared in accordance with International Financial Reporting Standards (IFRS), as issued by the International Accounting Standards Board (hereinafter the “IASB”) and the instructions issued by the Chilean Superintendence of Securities and Insurance (SVS) and were authorized by the Board of Directors at their meeting No. 51 of March 6, 2015.
Should there be any discrepancies between IFRS and the instructions issued by the Chilean Superintendence of Securities and Insurance (SVS), the latter shall prevail. As of December 31, 2014, the only instruction issued by the SVS that contravenes IFRS refers to the recognition of the effects of changes in deferred taxes, as established in Circular No.856 issued by the SVS on October 17, 2014. Such Circular establishes a mandatory single‐time exception to the framework for preparing and presenting financial information adopted, under International Financial Reporting Standards (IFRS). Such Circular provides instructions to regulated entities to “account for those differences in deferred tax assets and liabilities generated as a direct effect of an increase in the corporate income tax rate introduced by Law No.20.780 in the related year against equity.” Consequently, this results in a change in the framework for preparing and presenting financial information adopted prior to the issuance of such Circular, as International Financial Reporting Standards (IFRS) require the full, explicit and unreserved adoption. Accordingly, the financial statements as of December 31, 2014, were not prepared entirely in accordance with IFRS. Financial statements as of December 31, 2013 The consolidated financial statements of Sociedad Matriz SAAM S.A. and Subsidiary as of December 31, 2013, and for the year then ended, have been prepared in accordance with International Financial Reporting Standards (IFRS), issued by the International Accounting Standards Board (IASB). b. Basis of preparation of the consolidated financial statements These consolidated financial statements give a true and fair view of the consolidated financial statements of Sociedad Matriz SAAM S.A. and Subsidiary as of December 31, 2014 and 2013, of its comprehensive income by function, changes in net equity and cash flows for the year ended December 31, 2014 and 2013. The consolidated financial statements have been prepared following the going concern principle on the historical cost basis, except for the items recognized at fair value.
103
SOCIEDAD MATRIZ SAAM S.A. AND SUBSIDIARY
Notes to the Consolidated Financial Statements
13
NOTE 2 Basis of Presentation of the Consolidated Financial Statements, continued
b. Basis of preparation of the consolidated financial statements, continued The carrying amount of assets and liabilities hedged through transactions qualifying for hedge accounting is adjusted to reflect changes in their fair value in relation to the hedged risks. c. Use of estimates and judgments
In the preparation of the consolidated financial statements, the Company has used critical accounting estimates to quantify some assets, liabilities, revenues, expenses and commitments. Those areas involving a higher degree of judgment or complexity or those areas in which assumptions and estimates are significant for the consolidated financial statements are described as follows: 1. Evaluation of possible impairment losses related to certain assets, (See notes, 3.6 d,
3.7e, 3.8, 3.15a 2, 3.15a 7, 3.15c, 3.16). 2. Assumptions used in the actuarial estimate of employee benefit liabilities, (See note 26.3). 3. Useful life of property, plant and equipment and intangible assets, (See notes 3.6b
3.6d, 3.7c ). 4. Criteria used in the valuation of certain assets. 5. Probability of occurrence and valuation of certain liabilities and contingencies, (See note
24). 6. Fair value of certain financial instruments, (See note 3.19) 7. Recoverability of deferred tax assets, (See note 21)
These estimates are made based on the best information available about the facts analyzed. Nevertheless, it is possible that events that may occur in the future require changes in such estimates in future year‐ends. If required, such changes would be made prospectively, recognizing the effects of the changes in future financial statements.
104
2014 Annual Report
SOCIEDAD MATRIZ SAAM S.A. AND SUBSIDIARY
Notes to the Consolidated Financial Statements
14
NOTE 3 Summary of Significant Accounting Policies 3.1 Basis of Consolidation
a) Subsidiaries
Subsidiaries are entities controlled by SM SAAM. Control exists when the Company has the power to govern financial and operating policies of an entity so as to obtain benefits from its activities, In assessing control, SM‐SAAM takes into consideration potential voting that currently is exercisable or convertible in shares or other instruments that allow controlling the other entity. The financial statements of subsidiaries are included in the consolidated financial statements from the date that control is transferred to SM SAAM until the date that control ceases.
b) Transactions eliminated on consolidation Intra‐group balances, transactions, and any unrealized income and expenses arising from intra‐group transactions are eliminated in preparing the consolidated financial statements. Unrealized gains arising from transactions with equity accounted investees are eliminated against the investment to the extent of the Company’s interest in the investee.
c) Investments in associates and entities under common control (equity method))
Associates are those entities in which SM‐SAAM has significant influence but not control over the financial and operating policies. Significant influence is presumed to exist when the Company holds between 20% and 50% of the voting power of another entity. Joint ventures are those entities over whose activities SM‐SAAM has joint control established by contractual agreement and requiring unanimous consent for making strategic, financial and operating decisions, Investments in associates and jointly controlled entities are accounted for using the equity method (equity‐accounted investees) and are recognized initially at cost. The Company’s investments include the goodwill identified on acquisition, if any, net of any accumulated impairment losses An investment is accounted for using the equity method from the date on which it becomes an associate or a joint venture. On acquisition of the investment, any difference between the cost of the investment and the entity’s share of the net fair value of the investee’s identifiable assets and liabilities is accounted for as goodwill and is included in the carrying amount of the investment.
105
SOCIEDAD MATRIZ SAAM S.A. AND SUBSIDIARY
Notes to the Consolidated Financial Statements
15
NOTE 3 Summary of Significant Accounting Policies, continued 3.1 Basis of Consolidation, continued
c) Investments in associates and entities under common control (equity method), continued The entity applies IAS 39 to determine whether any additional impairment loss is recognized with respect to its interest in the associate or joint venture. The entire carrying amount of the investment (including goodwill) is tested for impairment in accordance with IAS 36 as a single asset, by comparing its recoverable amount (higher of value in use and fair value less cost to sell) with its carrying amount, whenever application if IAS 39 indicates that the investment may be impaired. Accordingly, any reversal of that impairment loss is recognized in accordance with IAS 36 to the extent that the recoverable amount of the investment subsequently increases. The Company discontinues the use of the equity method from the date the associate or joint venture is no longer classified as an associate or joint venture, or when the investment is classified as held‐for‐sale. The consolidated financial statements include the Company’s share of the profit or loss and equity movements of equity accounted investees after adjustments to align the accounting criteria with those of SM‐SAAM, from the date that significant influence and/or joint control commences. When the Company’s share of losses exceeds its interest in an equity‐accounted investee, the carrying amount of that interest, including any long‐term investments, is reduced to zero, and the recognition of further losses is discontinued except to the extent that SM‐SAAM has an obligation or has made payments on behalf of the investee. When the Company decreases its interest in an associate or joint venture, and uses the equity method, the effects previously recognized in OCI are reclassified to profit or loss, in accordance with the proportion of decrease in interest in such associate or joint venture. When a Group company performs transactions with an associate or joint venture, gains or losses arising from such transaction with the associate or joint venture are recognized in the Company’s consolidated financial statements, only to the extent of the interests of third‐parties to the associate or joint venture.
106
2014 Annual Report
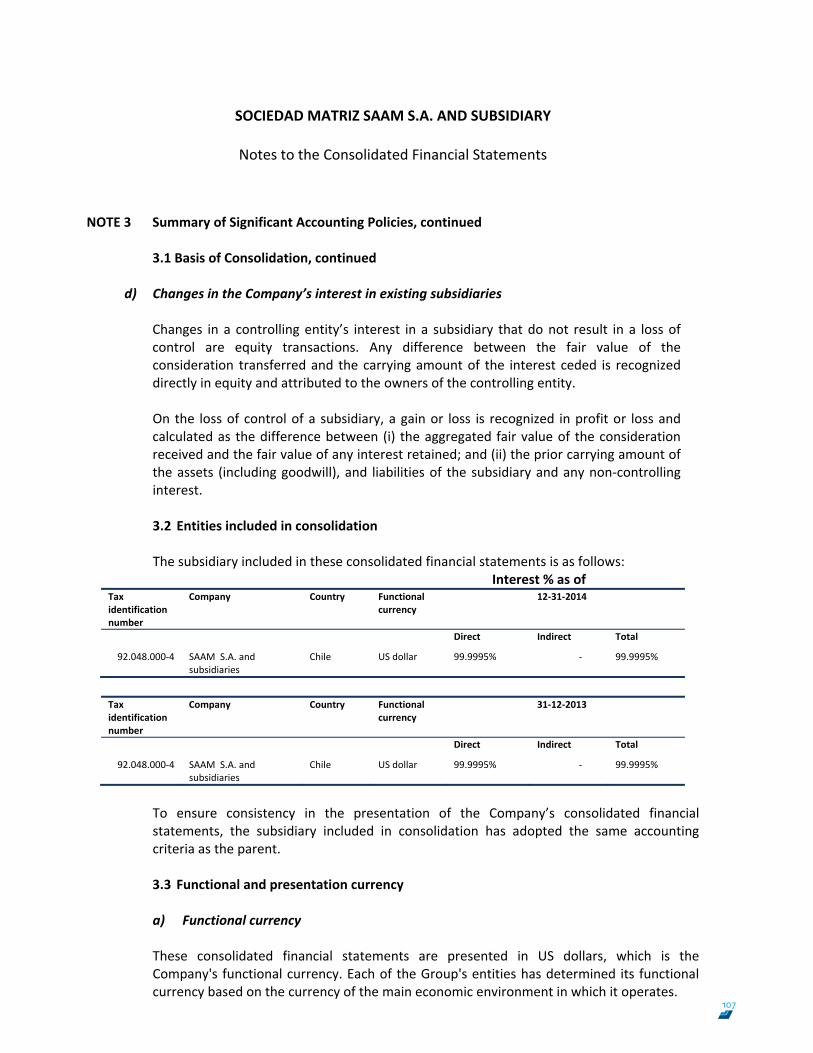
SOCIEDAD MATRIZ SAAM S.A. AND SUBSIDIARY
Notes to the Consolidated Financial Statements
16
NOTE 3 Summary of Significant Accounting Policies, continued 3.1 Basis of Consolidation, continued
d) Changes in the Company’s interest in existing subsidiaries
Changes in a controlling entity’s interest in a subsidiary that do not result in a loss of control are equity transactions. Any difference between the fair value of the consideration transferred and the carrying amount of the interest ceded is recognized directly in equity and attributed to the owners of the controlling entity. On the loss of control of a subsidiary, a gain or loss is recognized in profit or loss and calculated as the difference between (i) the aggregated fair value of the consideration received and the fair value of any interest retained; and (ii) the prior carrying amount of the assets (including goodwill), and liabilities of the subsidiary and any non‐controlling interest.
3.2 Entities included in consolidation
The subsidiary included in these consolidated financial statements is as follows:
Interest % as of Tax identification number
Company Country Functionalcurrency
12‐31‐2014
Direct Indirect Total
92.048.000‐4 SAAM S.A. and subsidiaries
Chile US dollar 99.9995% ‐ 99.9995%
Tax identification number
Company Country Functionalcurrency
31‐12‐2013
Direct Indirect Total
92.048.000‐4 SAAM S.A. and subsidiaries
Chile US dollar 99.9995% ‐ 99.9995%
To ensure consistency in the presentation of the Company’s consolidated financial statements, the subsidiary included in consolidation has adopted the same accounting criteria as the parent. 3.3 Functional and presentation currency
a) Functional currency These consolidated financial statements are presented in US dollars, which is the Company's functional currency. Each of the Group's entities has determined its functional currency based on the currency of the main economic environment in which it operates. 107
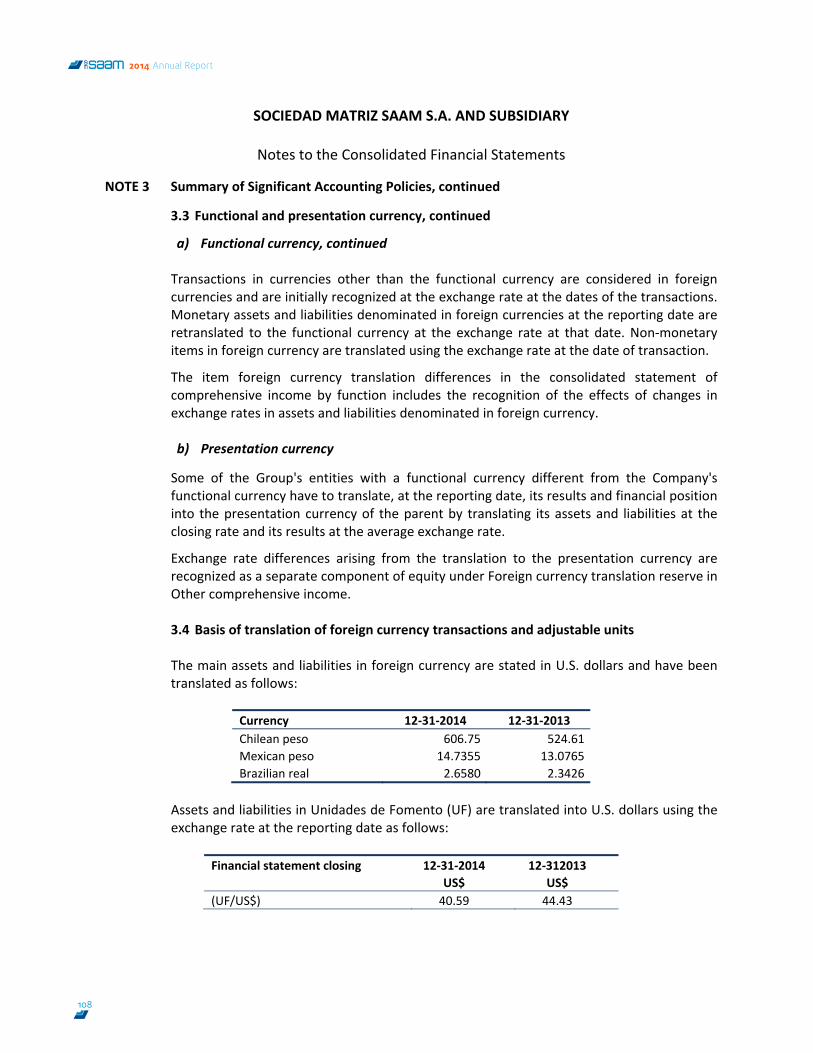
SOCIEDAD MATRIZ SAAM S.A. AND SUBSIDIARY
Notes to the Consolidated Financial Statements
17
NOTE 3 Summary of Significant Accounting Policies, continued
3.3 Functional and presentation currency, continued
a) Functional currency, continued Transactions in currencies other than the functional currency are considered in foreign currencies and are initially recognized at the exchange rate at the dates of the transactions. Monetary assets and liabilities denominated in foreign currencies at the reporting date are retranslated to the functional currency at the exchange rate at that date. Non‐monetary items in foreign currency are translated using the exchange rate at the date of transaction. The item foreign currency translation differences in the consolidated statement of comprehensive income by function includes the recognition of the effects of changes in exchange rates in assets and liabilities denominated in foreign currency. b) Presentation currency
Some of the Group's entities with a functional currency different from the Company's functional currency have to translate, at the reporting date, its results and financial position into the presentation currency of the parent by translating its assets and liabilities at the closing rate and its results at the average exchange rate. Exchange rate differences arising from the translation to the presentation currency are recognized as a separate component of equity under Foreign currency translation reserve in Other comprehensive income. 3.4 Basis of translation of foreign currency transactions and adjustable units
The main assets and liabilities in foreign currency are stated in U.S. dollars and have been translated as follows:
Currency 12‐31‐2014 12‐31‐2013 Chilean peso 606.75 524.61Mexican peso 14.7355 13.0765Brazilian real 2.6580 2.3426
Assets and liabilities in Unidades de Fomento (UF) are translated into U.S. dollars using the exchange rate at the reporting date as follows:
Financial statement closing 12‐31‐2014
US$ 12‐312013
US$ (UF/US$) 40.59 44.43
108
2014 Annual Report
SOCIEDAD MATRIZ SAAM S.A. AND SUBSIDIARY
Notes to the Consolidated Financial Statements
18
NOTE 3 Summary of Significant Accounting Policies, continued
3.5 Inventories
Inventories are measured at the lower of cost and net realizable value. The cost of inventories is based on the first‐in first‐out principle, and includes expenditure incurred in acquiring the inventories, production or conversion costs and other costs incurred in bringing them to their existing location and condition. Net realizable value is the estimated selling price in the ordinary course of business, less the estimated selling expenses. Spare‐parts are valued at historical cost and recognized in profit or loss using the FIFO method. Low turnover spare‐parts, mainly those used for repairing and maintaining the Company's main assets, tugboats and cranes, are considered as strategic inventories, and given demands unlikely to be forecasted, they are recognized under non‐current inventories. 3.6 Intangible assets Intangible assets include those identifiable non‐monetary assets with no physical substance resulting from commercial transactions. The Company recognizes only those intangible assets whose costs can be fairly estimated and from which economic benefits are probable to be obtained in the future. Intangible assets with finite useful lives are initially recognized at acquisition or development cost and are valued at cost less accumulated amortization and possible impairment losses.
a) Port concessions
Assets for port concessions are recognized as intangible assets when there is the right to collect revenue based on use in conformity with IFRIC 12. The cost of the related intangible assets includes mandatory infrastructure works defined in the concession contracts and the present value of all minimum contract payments. Accordingly, a non‐financial liability at the present value equivalent to the value of the recognized intangible asset is recorded. These consolidated financial statements include concession agreements recorded in the indirect subsidiaries Iquique Terminal Internacional S.A. and Terminal Marítima Mazatlán S.A. de C.V. (See note 35).
109
SOCIEDAD MATRIZ SAAM S.A. AND SUBSIDIARY
Notes to the Consolidated Financial Statements
19
NOTE 3 Summary of Significant Accounting Policies, continued
3.6 Intangible assets, continued
b) Relationship with customers Intangible assets classified as “Relationship with customers” generated during the business combination, are amortized in the expected term of return of benefits associated with the current customer portfolio of each company, at the acquisition date. These assets are amortized starting on July 1, 2014, which is the same date these operations were conducted.
c) Goodwill
Goodwill is the difference between the acquisition cost of the subsidiaries, associates and joint ventures shares or rights, and the fair value of identifiable contingent assets and liabilities at the acquisition date. Goodwill related with acquisition of associates and joint ventures is included in investments under the equity method and joint ventures. Goodwill from acquisition of subsidiaries, joint ventures and associated with a functional currency other tan US dollar is measured using the functional currency of the acquiree, performing the currency translation to U.S. dollar using the Exchange rate in force at the reporting date. Goodwill is not amortized and at the reporting date is reviewed to determine whether there is any indication of impairment that may decrease its recoverable amount to an amount lower than the recorded cost. If such indication exists, an adjustment for impairment is performed. At the reporting date, there is no impairment indication that can cause an adjustment. d) Amortization of intangible assets
Amortization will be recognized in the consolidated statement of income on the basis of the estimated straight‐line depreciation method starting from the date in which the asset is available for use.
110
2014 Annual Report
SOCIEDAD MATRIZ SAAM S.A. AND SUBSIDIARY
Notes to the Consolidated Financial Statements
20
NOTE 3 Summary of Significant Accounting Policies, continued
3.6 Intangible assets, continued The estimated useful lives by type of asset are as follows: Class Minimum
range Maximum range
Goodwill IndefiniteWater rights IndefiniteLicenses and franchises 5 years 20 years Port concessions (Note 35) Concession period Concession for the use of tugboats (Note 35) Concession period Relationship with customers (Note 17.2) 10 years 15 years IT programs 3 years 7 years
e) Impairment of intangible assets Intangible assets with indefinite useful lives are stated at cost and annually are tested for impairment. The Company and subsidiaries assess at the reporting date, or when necessary, whether there is any indication that an asset may be impaired, If such indication exists, the recoverable amount of that asset is estimated. The recoverable amount of an asset is the higher of its fair value less costs to sell and its value in use. In order to determine the fair value less costs to sell, reports from and independent valuation company and/or objective information available is used. To determine the value in use, the estimated cash flows shall be discounted from the Company’s WACC rate.
3.7 Property, plant and equipment
a) Recognition and measurement Items of property, plant and equipment are measured at cost less accumulated depreciation and accumulated impairment losses, if applicable. Cost includes expenditure that is directly attributable to the acquisition of the asset. The cost of self‐constructed assets includes the cost of materials, direct labor, financial expenses related to external financing and any other costs directly attributable to bringing the assets to a working condition for their intended use, and the costs of dismantling and removing the items and restoring the site on which they are located.
111
SOCIEDAD MATRIZ SAAM S.A. AND SUBSIDIARY
Notes to the Consolidated Financial Statements
21
NOTE 3 Summary of Significant Accounting Policies, continued 3.7 Property, plant and equipment, continued
a) Recognition and measurement, continued
When parts of an item of property, plant and equipment have different useful lives, they are accounted for as separate items (major components) of property, plant and equipment. The gain or loss on disposal of an item of property, plant and equipment is determined by comparing the proceeds from disposal with the carrying amount of the property, plant and equipment, and is recognized net within other income/other expenses in profit or loss. b) Subsequent costs The cost of replacing a component of an item of property, plant and equipment is recognized in the carrying amount of the item if it is probable that the future economic benefits embodied within the component will flow for more than a period to SM‐SAAM, and its cost can be measured reliably. The costs of the day‐to‐day servicing of property, plant and equipment are recognized in the consolidated statement of comprehensive income as incurred. Subsequent to acquisition, only those disbursements that increase the asset’s useful life or economic capacity, other than routine servicing, are capitalized.
c) Depreciation and useful lives Depreciation is recognized in the consolidated statement of comprehensive income by function on a straight‐line basis over the estimated useful lives of each component of an item of property, plant and equipment. This is the method that best reflects the use and consumption of the assets.
112
2014 Annual Report
SOCIEDAD MATRIZ SAAM S.A. AND SUBSIDIARY
Notes to the Consolidated Financial Statements
22
NOTE 3 Summary of Significant Accounting Policies, continued
3.7 Property, plant and equipment, continued
c) Depreciation and useful lives, continued The estimated useful lives for the years are as follows:
Class Year Range Minimum Maximum Buildings and constructions 40 80 Port terminal infrastructure (1) Concession period Facilities and improvements in leased properties Lease period Vessels, tugboats, barges, boats (2) 10 30
Machinery 5 15 Transportation equipment 3 10 Office equipment 1 3 Furniture, fixtures and accessories 3 5 (1) Includes assets that cannot be controlled by the grantor of the concession, the useful lives
of these assets may exceed the concession period when the assets can be transferred to other Company’s operations.
(2) As a result of the business combination, the maximum range of useful life for tugboats in
Canada and Panama increased, due to the useful life allocated to these assets by the subsidiaries acquired.
d) Leases
Leases in terms of which SM‐SAAM assumes substantially all the risks and rewards of ownership are classified as finance leases; otherwise, they are classified as operating leases. Upon inception of the finance lease, the Company shall record an asset for the difference between the lower of the fair value of the leased asset and the present value of minimum lease payments. Minimum lease payments are composed of the finance cost and amortization of the principal. Minimum lease payments related to operating leases are recorded as expenses on a straight‐line basis during the term of the lease.
113
SOCIEDAD MATRIZ SAAM S.A. AND SUBSIDIARY
Notes to the Consolidated Financial Statements
23
NOTE 3 Summary of Significant Accounting Policies, continued
3.7 Property, plant and equipment, continued
e) Impairment of property, plant and equipment
Finance lease liabilities are recognized under Interest‐bearing liabilities, current and non‐current. The Company holds no embedded leases in contracts that need to be separated.
The Company and subsidiaries assess at the reporting date, or when necessary, whether there is any indication that an asset may be impaired. If such indication exists, the recoverable amount of that asset is estimated. The recoverable amount of an asset is the higher of its fair value less costs to sell and its value in use. In order to determine the fair value less costs to sell, reports from and independent valuation company and/or objective information available is used. To determine the value in use, the estimated cash flows shall be discounted using SAAM’s Weighted Average Cost of Capital rate. If the Company's management notes impairment indicators on assets non‐related to CGU, the Company shall determine the impairment based on the group of assets that generate the identifiable cash flows (cash‐generating units). If the recoverable amount of an asset is less than its carrying amount, the Company will record a provision for impairment with debit to profit or loss, recording the asset at its fair value. Because impairment losses correspond to revalued assets, they are recognized in equity up to the amount of the previous revaluation. Impairment losses recognized in prior periods are assessed annually to determine whether there is any indication that the loss may have decreased or may no longer exist, crediting the reversal to profit or loss unless an assets is recognized at its revalued amount, in which case the reversal is debited to equity. At the reporting date, the SM SAAM S.A. and its subsidiary SAAM S.A. show no evidence of impairment loss due to any significant change such as the decrease in the market value, obsolescence, physical damage, market return, etc, which may affect the measurement of property, plant and equipment.
114
2014 Annual Report
SOCIEDAD MATRIZ SAAM S.A. AND SUBSIDIARY
Notes to the Consolidated Financial Statements
24
NOTE 3 Summary of Significant Accounting Policies, continued
3.8 Investment property
Investment property is property held either to earn rental income or for capital appreciation or for both, but not for sale in the ordinary course of business, use in the production or supply of goods or services or for administrative purposes. Investment property is measured at cost less accumulated depreciation and accumulated impairment losses. When the use of a property changes, it is reclassified to the caption in the statement of financial position which best reflects its new use.
3.9 Provisions
A provision is recognized if, as a result of a past event, the Company has a present legal or constructive obligation that can be estimated reliably, and it is probable that an outflow of economic benefits will be required to settle the obligation. The amount recognized as a provision shall be the best estimate of the expenditure required to settle the present obligation at the end of the reporting period. When the estimated time to settle the obligation is in the long‐term and the obligation can be estimated reliably, the provision will be recorded at its present value by discounting the expected future cash flows at a pre‐tax rate that reflects the risks specific to the liability. Provisions shall be reviewed at the end of each reporting period and adjusted to reflect the current best estimate.
3.10 Employee Benefits
a) Defined benefit plans For the Company, severance payments are defined benefits plans; the Company estimates the amount of the future benefits employees have earned in return for their service in the current and prior periods. The risk free interest rate is used to estimate the present value of the benefit (see note 26.3), The calculation is made using the projected credit unit method. The Company recognizes all actuarial gains and losses arising from defined benefit plans directly in equity in other comprehensive income, servicing costs are recognized directly in profit or loss by function.
115
SOCIEDAD MATRIZ SAAM S.A. AND SUBSIDIARY
Notes to the Consolidated Financial Statements
25
NOTE 3 Summary of Significant Accounting Policies, continued
3.10 Employee Benefits, continued
b) Short‐term benefits
Short‐term employee benefit obligations are measured on an undiscounted basis and are expensed as the related service is provided.
3.11 Revenue and cost of sales
Revenue from services rendered and the cost of sales are recognized in profit or loss on an accrual basis. Revenue is recognized only to the extent that services have been provided, can be measured reliably and it is probable that the related economic benefits will flow to the Company regardless of the time when such benefits are received. The costs of sales related to services provided are recognized on an accrual basis directly in the Company’s different business areas. Revenue is recognized net of usual discounts and bonuses.
3.12 Finance income and finance expense
Interest income is recognized as it accrues in the statement of comprehensive income by function. Finance expenses are usually recognized in profit or loss as incurred with the exception of those incurred to finance the construction or development of qualifying assets that require a substantial time period to prepare the asset for its intended use, and those related to the actuarial cost of employee benefits.
3.13 Income tax
The Company and its subsidiaries in Chile account for income tax on a net taxable income basis determined according to the standards established in the Income Tax Law. The Company’s foreign subsidiaries are subject to the standards established in each country in which they are located.
116
2014 Annual Report
SOCIEDAD MATRIZ SAAM S.A. AND SUBSIDIARY
Notes to the Consolidated Financial Statements
26
NOTE 3 Summary of Significant Accounting Policies, continued
3.13 Income tax, continued
On September 29, 2014, the Tax Reform Law was enacted which, amongst other aspects, defines the default tax system applicable to the Company, the corporate income tax rate that will be gradually applied between 2014 and 2018 and allows companies to opt for one of two tax systems established, being the attributed income system or the partially‐integrated system, which results in entities being subject to different tax rates starting on 2017. The Attributed regime is applicable to individual entrepreneurs, single‐owner limited liability companies, communities and partnerships when formed exclusively by natural persons domiciled or residents in Chile. The Partially Integrated regime is applicable to the remaining taxpayers, such as openly and closely held shareholders’ corporations, joint stock companies or partnerships whose owners are not solely natural persons domiciled or residents in Chile. The tax system to which the Company, by default, shall be subject to as of January 1, 2017, is the partially integrated system. Likewise, the Company may opt for a change in the tax system so as to use a system other than its default system during the last three months of the 2016 calendar year, following approval by the shareholders at an Extraordinary Shareholders' Meeting with a quorum of at least two thirds of voting‐right shares issued. It will become effective through submission of the declaration signed by the Company, and the minutes, drafted as public deed, entered by the company. The Company shall be subject to the tax system that was assigned to it, for at least five consecutive business years. After this period it is able to change the tax system, and should be subject to such new system for at least five consecutive years.
3.14 Deferred taxes Deferred tax assets and liabilities are recognized in the statement of financial position in respect of temporary differences between the carrying amounts of assets and liabilities for financial reporting purposes and the amounts used for taxation purposes, and are recognized in accordance with IAS 12 “Income Taxes”, except for the application of Circular No. 856 in 2014, issued by the Chilean Superintendence of Securities and Insurance on October 17, 2014, which establishes that differences in deferred tax assets and liabilities generated as a direct effect of the increase in the corporate income tax rate required by Law No.20.780 should be recognized during the year in equity.
117
SOCIEDAD MATRIZ SAAM S.A. AND SUBSIDIARY
Notes to the Consolidated Financial Statements
27
NOTE 3 Summary of Significant Accounting Policies, continued
3.14 Deferred taxes, continued
Deferred taxes are measured at the tax rates that are expected to be applied to temporary differences when they reverse, based on the laws that have been enacted or substantively enacted by each reporting date.
3.15 Financial instruments
a) Non‐derivative financial instruments Financial instruments are initially recognized as financial assets, financial liabilities or equity securities depending on the economic substance of the agreement. In addition and for purposes of measurement, financial instruments are classified as financial assets at fair value through profit or loss, loans and receivables, investments held‐to maturity and financial liabilities. The classification depends on the characteristics of the instrument and the purpose for which it was acquired. SM‐SAAM derecognizes a financial liability when its contractual obligations are cancelled or expire. Subsequent to initial recognition, non‐derivative financial assets are measured as follows:
a) 1. Cash and cash equivalents Cash and cash equivalents comprise cash in bank and on hand and other highly liquid short‐term investments (with original maturities of three months or less) with no significant risk of changes in value. a) 2. Trade and other receivables Trade and other receivables are initially recognized at fair value. Subsequent to initial recognition, they are measured at amortized cost using the effective interest method, less impairment losses. Trade and other receivables also includes non‐trade receivables such as other receivables, loans to personnel and loans to other foreign entities.
118
2014 Annual Report
SOCIEDAD MATRIZ SAAM S.A. AND SUBSIDIARY
Notes to the Consolidated Financial Statements
28
NOTE 3 Summary of Significant Accounting Policies, continued 3.15 Financial instruments, continued
a) Non‐derivative financial instruments, continued
a) 3. Financial assets at fair value through profit or loss
A financial asset is classified at fair value through profit or loss if it is classified as held for trading or is designated as such upon initial recognition. A financial asset or liability is classified as held for trading when:
It is acquired or incurred mainly with the purpose of selling or repurchasing in the near future;
It is part of a portfolio of identified financial instruments that are managed jointly and for which there is a recent pattern of short‐term benefits; or
It is a derivative, except for those derivatives that have been designated as hedging instruments and meet the conditions to be effective.
Financial assets at fair value through profit or loss are initially measured at fair value. Transaction costs directly attributable to the purchase or issuance are recognized as expenses as incurred, Subsequent to initial recognition, they are measured at fair value through profit or loss. a) 4. Investments held‐to‐maturity Investments held‐to‐maturity are those non‐derivative financial assets with fixed or determinable payments and fixed maturities for which SM‐SAAM has the positive intent and ability to hold to maturity. Measurement criteria applicable to financial instruments held‐to maturity are the same than those for loans and receivables. a) 5. Financial liabilities These liabilities are initially recognized at their transaction cost. Incurred costs that are directly attributable to the transaction are amortized during the period of the loan and are presented deducting the liability, they are measured at amortized cost using the effective interest method (equivalent annual charge). a) 6. Trade and other payables This item records unpaid balances for commercial purchases and related expenses as well as other non‐trade payables such as other payables and other withholdings related to payroll and others.
119
SOCIEDAD MATRIZ SAAM S.A. AND SUBSIDIARY
Notes to the Consolidated Financial Statements
29
NOTE 3 Summary of Significant Accounting Policies, continued 3.15 Financial instruments, continued
a) Non‐derivative financial instruments, continued
a) 7. Other
Other non‐derivative financial instruments including loans and receivables are measured at amortized cost using the effective interest method, less any impairment losses. b) Derivative financial instruments Derivative financial instruments maintained to hedge foreign currency and interest rate risk exposures are initially recognized at fair value; directly attributable transactions costs are recognized in profit or loss as incurred. Subsequent to initial recognition, derivative financial instruments are measured at fair value and changes therein are accounted for as described below: b.1) Hedge accounting Derivative financial instruments meeting the criteria for hedge accounting are initially recognized at fair value plus/less those transaction costs directly attributable to their contracting or issue. Gains or losses resulting from the measurement of the hedging instrument are recognized immediately in comprehensive income as well as any changes in the fair value of the hedged item attributable to the hedged risk. If the hedging instrument no longer meets the criteria for hedge accounting then hedge accounting is discontinued prospectively. Accumulated gains or losses previously recognized in equity will remain until the forecasted transactions occur. b.2) Economic hedge Hedge accounting is not applicable to derivative instruments that provide economic hedge to monetary assets and liabilities in foreign currency. Changes in the fair value of such derivatives are recognized in profit or loss by function as part of foreign currency translation gains or losses. Derivative financial instruments not meeting the criteria to qualify for hedge accounting are classified and measured as financial assets or liabilities at fair value through profit or loss by function.
120
2014 Annual Report
SOCIEDAD MATRIZ SAAM S.A. AND SUBSIDIARY
Notes to the Consolidated Financial Statements
30
NOTE 3 Summary of Significant Accounting Policies, continued
3.15 Financial instruments, continued c) Impairment of financial assets A financial asset not carried at fair value through profit or loss is assessed at each reporting date to determine whether there is objective evidence that it is impaired. A financial asset is impaired if objective evidence indicates that a loss event has occurred after the initial recognition of the asset, and that the loss event had a negative effect on the estimated future cash flows of that asset that can be estimated reliably. Objective evidence that financial assets are impaired (including equity instruments) can include default or delinquency by a debtor, restructuring of an amount due to SM‐SAAM on terms that SM‐SAAM would not consider otherwise, indications that a debtor or issuer will enter bankruptcy or the disappearance of an active market for a security. In addition, for an investment in an equity security, a significant or prolonged decline in its fair value below its cost is objective evidence of impairment. In assessing impairment the Company uses historical trends of the probability of default, the timing of recoveries and the amount of loss incurred, adjusted for management’s judgment as to whether current economic and credit conditions are such that the actual losses are likely to be greater or less than suggested by historical trends. An impairment loss in respect of a financial asset measured at amortized cost is calculated as the difference between its carrying amount and the present value of the estimated future cash flows discounted at the asset’s original effective interest rate. Losses are recognized in profit or loss and reflected in an allowance account against financial assets. When a subsequent event causes the amount of impairment loss to decrease, the decrease in impairment loss is reversed through profit or loss.
3.16 Non‐current assets held for sale
Non‐current assets, or disposal groups comprising assets and liabilities, that are expected to be recovered primarily through sale rather than through continuing use, are classified as held for sale and carried at the lower of their carrying amount and fair value less cost to sell. Immediately before this classification, the assets, or component of an available‐for‐sale group are measured at the lower of their carrying amount and fair value less the cost to sell.
121
SOCIEDAD MATRIZ SAAM S.A. AND SUBSIDIARY
Notes to the Consolidated Financial Statements
31
NOTE 3 Summary of Significant Accounting Policies, continued
3.16 Non‐current assets held for sale, continued Any impairment loss on a disposal group first is allocated to goodwill, and then to remaining assets and liabilities on a pro rata basis, Impairment losses on initial classification as held for sale or distribution and subsequent gains and losses on remeasurement are recognized in profit or loss. Gains are not recognized in excess of any cumulative impairment loss.
3.17 Onerous contracts
A provision for onerous contracts is recognized when the expected benefits to be derived from a contract are lower than the unavoidable cost of meeting the obligations under the contract. As of December 31, 2014 SM‐SAAM does not have this type of contracts and therefore, does not record any provision for onerous contracts.
3.18 Cash and cash equivalent
The Company considers cash and cash equivalents in banks and on hand and other highly liquid short‐term investments with original maturities of three months or less with no risk on changes in value to be cash and cash equivalents. Cash and cash equivalents also include investments related to cash management such as repurchase and resale agreements with original maturities of three months or less. Bank overdrafts used are included within short‐term loans in current liabilities.
3.19 Determination of fair values
Certain of the Company’s accounting criteria and disclosures require the determination of fair value of certain financial assets, as follows: a) Financial assets The fair value of financial assets at fair value through profit or loss and available‐for‐sale financial assets are determined at market value. b) Trade and other receivables Considering that trade receivables are performed at less than 90 days, it has been estimated that their fair values do not significantly differ from their carrying amounts. c) Derivatives The fair value of derivatives is based on their market price.
122
2014 Annual Report
SOCIEDAD MATRIZ SAAM S.A. AND SUBSIDIARY
Notes to the Consolidated Financial Statements
32
NOTE 3 Summary of Significant Accounting Policies, continued
3.20 Minimum dividend
Article 79 of the Chilean Corporations Law establishes that, unless otherwise agreed unanimously by all the issued shares at the respective shareholders’ meeting, publicly‐held corporations should distribute annually as a cash dividend to their shareholders, pro rata to their shares or in the proportion established in the by‐laws if preferred shares exist, at least 30% of the profits of each year, except when accumulated losses from previous years have first to be absorbed. SM‐SAAM, determines the amount of minimum dividends it will have to pay to its shareholders during the following year, and is recorded under the caption “Other current non‐financial liabilities” charged to the account Accumulated gains (losses) under Net Equity.
3.21 Environment Disbursements associated with environmental protection are debited to profit or loss when incurred.
123
SOCIEDAD MATRIZ SAAM S.A. AND SUBSIDIARY
Notes to the Consolidated Financial Statements
33
NOTE 3 Summary of Significant Accounting Policies, continued
3.22 New standards and interpretations issued but not effective
a) Standards early adopted by the Group SM‐SAAM has not early adopted or applied the standards issued by the International Accounting Standards Board (hereinafter IASB). b) Standards, amendments and interpretations effective on or after January 1, 2013: Standard and/or amendment Mandatory application for: IFRS 10: Consolidated Financial Statements Provides clarity and new parameters for the definition of control as well as the principles to prepare consolidated financial statements applicable to all entities (including special purpose entities and structured entities).
Annual periods beginning on or after January 1, 2013.
IFRS 11: Joint Arrangements, Redefines the concept of joint control, thus aligning to IFRS 10, and requires that entities that are part of a joint arrangement determine the type of arrangement (joint operation or joint venture) by assessing its rights and obligations, The standard eliminates the possibility of proportionate consolidation for joint ventures.
Annual periods beginning on or after January 1, 2013.
IFRS 12: Disclosure of Involvement with Other Entities, Requires disclosures that enable to evaluate the nature of, and risks associated with, its interests in other entities and the effects of those interests on its financial position, financial performance and cash flows.
Annual periods beginning on or after January 1, 2013.
IFRS 13: Fair Value Measurement, Sets in a single standard a single framework for measuring fair value of assets and liabilities and includes new concepts and clarification for its measurement, In addition, it requires disclosures by entities on fair value measurement of the fair value of its assets and liabilities.
Annual periods beginning on or after January 1, 2013.
New IAS 27: Separate Financial Statements, As a result of the new IFRS 10, all information related to the consolidated financial statements was eliminated from IAS 27, limiting the scope to the separate financial statements only.
Annual periods beginning on or after January 1, 2013.
New IAS 28: Investments in Associates and Joint Ventures, Amended because of the issue of IFRS 10 and IFRS 11, to provide uniform definitions and other clarifications contained in these new IFRSs.
Annual periods beginning on or after January 1, 2013.
Amendment to IFRS 7: Financial Instruments: Disclosures, Clarifies the disclosure requirements for the offsetting of financial assets and financial liabilities.
Annual periods beginning on or after January 1, 2013.
124
2014 Annual Report
SOCIEDAD MATRIZ SAAM S.A. AND SUBSIDIARY
Notes to the Consolidated Financial Statements
34
NOTE 3 Summary of Significant Accounting Policies, continued
3.22 New standards and interpretations issued but not effective, continued
b) Standards, amendments and interpretations effective on or after January 1, 2013, continued
Standard and/or amendment Mandatory application for: Amendment to IAS 19: Employee Benefits. Amends the recognition and disclosure of changes in the defined benefit obligation and plan assets, removing the corridor method and accelerating the recognition of past service costs.
Annual periods beginning on or after January 1, 2013.
Improvements to IFRSs Correspond to a series of necessary but not urgent improvements that amend the following standards: IFRS 1, IAS 1, IAS 16, IAS 32 and IAS 34
Annual periods beginning on or after January 1, 2013.
Transition guidance (Amendments to IFRS 10, IFRS 11 and IFRS 12). The amendments clarify the transition guidance contained in IFRS 10. In addition, they provide additional transition relief to IFRS 10, IFRS 11 and IFRS 12, to limit the requirement to provide adjusted comparative information to the immediately preceding comparative period only. Furthermore, for disclosures related to unconsolidated structured entities, the amendments will remove the requirement to present comparative information.
Annual periods beginning on or after January 1, 2013.
125
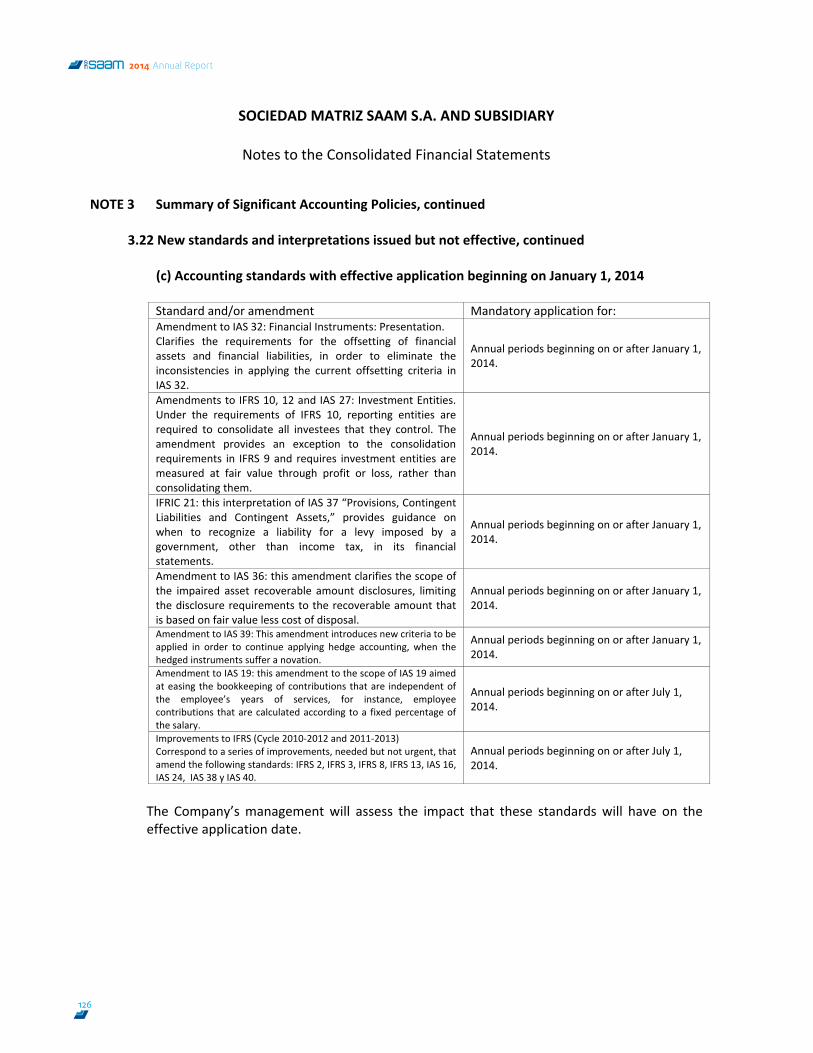
SOCIEDAD MATRIZ SAAM S.A. AND SUBSIDIARY
Notes to the Consolidated Financial Statements
35
NOTE 3 Summary of Significant Accounting Policies, continued
3.22 New standards and interpretations issued but not effective, continued
(c) Accounting standards with effective application beginning on January 1, 2014 Standard and/or amendment Mandatory application for: Amendment to IAS 32: Financial Instruments: Presentation. Clarifies the requirements for the offsetting of financial assets and financial liabilities, in order to eliminate the inconsistencies in applying the current offsetting criteria in IAS 32.
Annual periods beginning on or after January 1, 2014.
Amendments to IFRS 10, 12 and IAS 27: Investment Entities. Under the requirements of IFRS 10, reporting entities are required to consolidate all investees that they control. The amendment provides an exception to the consolidation requirements in IFRS 9 and requires investment entities are measured at fair value through profit or loss, rather than consolidating them.
Annual periods beginning on or after January 1, 2014.
IFRIC 21: this interpretation of IAS 37 “Provisions, Contingent Liabilities and Contingent Assets,” provides guidance on when to recognize a liability for a levy imposed by a government, other than income tax, in its financial statements.
Annual periods beginning on or after January 1, 2014.
Amendment to IAS 36: this amendment clarifies the scope of the impaired asset recoverable amount disclosures, limiting the disclosure requirements to the recoverable amount that is based on fair value less cost of disposal.
Annual periods beginning on or after January 1, 2014.
Amendment to IAS 39: This amendment introduces new criteria to be applied in order to continue applying hedge accounting, when the hedged instruments suffer a novation.
Annual periods beginning on or after January 1, 2014.
Amendment to IAS 19: this amendment to the scope of IAS 19 aimed at easing the bookkeeping of contributions that are independent of the employee’s years of services, for instance, employee contributions that are calculated according to a fixed percentage of the salary.
Annual periods beginning on or after July 1, 2014.
Improvements to IFRS (Cycle 2010‐2012 and 2011‐2013)Correspond to a series of improvements, needed but not urgent, that amend the following standards: IFRS 2, IFRS 3, IFRS 8, IFRS 13, IAS 16, IAS 24, IAS 38 y IAS 40.
Annual periods beginning on or after July 1, 2014.
The Company’s management will assess the impact that these standards will have on the effective application date.
126
2014 Annual Report
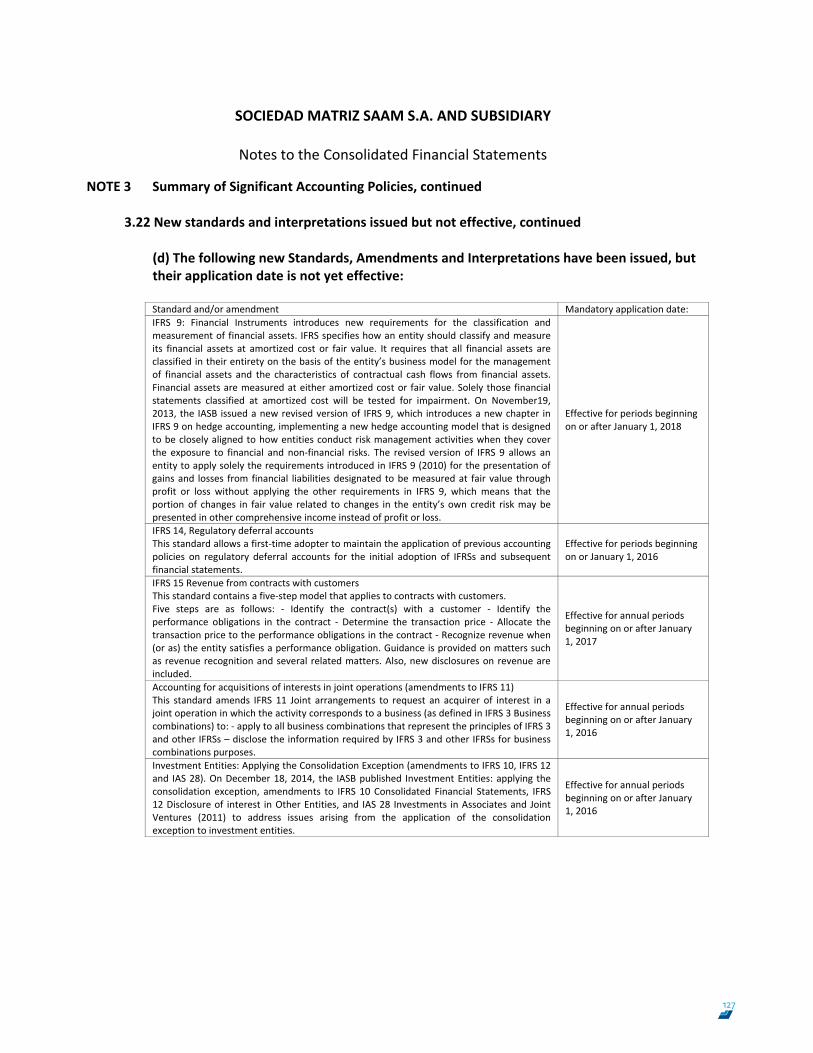
SOCIEDAD MATRIZ SAAM S.A. AND SUBSIDIARY
Notes to the Consolidated Financial Statements
36
NOTE 3 Summary of Significant Accounting Policies, continued
3.22 New standards and interpretations issued but not effective, continued (d) The following new Standards, Amendments and Interpretations have been issued, but their application date is not yet effective: Standard and/or amendment Mandatory application date:IFRS 9: Financial Instruments introduces new requirements for the classification and measurement of financial assets. IFRS specifies how an entity should classify and measure its financial assets at amortized cost or fair value. It requires that all financial assets are classified in their entirety on the basis of the entity’s business model for the management of financial assets and the characteristics of contractual cash flows from financial assets. Financial assets are measured at either amortized cost or fair value. Solely those financial statements classified at amortized cost will be tested for impairment. On November19, 2013, the IASB issued a new revised version of IFRS 9, which introduces a new chapter in IFRS 9 on hedge accounting, implementing a new hedge accounting model that is designed to be closely aligned to how entities conduct risk management activities when they cover the exposure to financial and non‐financial risks. The revised version of IFRS 9 allows an entity to apply solely the requirements introduced in IFRS 9 (2010) for the presentation of gains and losses from financial liabilities designated to be measured at fair value through profit or loss without applying the other requirements in IFRS 9, which means that the portion of changes in fair value related to changes in the entity’s own credit risk may be presented in other comprehensive income instead of profit or loss.
Effective for periods beginning on or after January 1, 2018
IFRS 14, Regulatory deferral accounts This standard allows a first‐time adopter to maintain the application of previous accounting policies on regulatory deferral accounts for the initial adoption of IFRSs and subsequent financial statements.
Effective for periods beginning on or January 1, 2016
IFRS 15 Revenue from contracts with customers This standard contains a five‐step model that applies to contracts with customers. Five steps are as follows: ‐ Identify the contract(s) with a customer ‐ Identify the performance obligations in the contract ‐ Determine the transaction price ‐ Allocate the transaction price to the performance obligations in the contract ‐ Recognize revenue when (or as) the entity satisfies a performance obligation. Guidance is provided on matters such as revenue recognition and several related matters. Also, new disclosures on revenue are included.
Effective for annual periods beginning on or after January 1, 2017
Accounting for acquisitions of interests in joint operations (amendments to IFRS 11)This standard amends IFRS 11 Joint arrangements to request an acquirer of interest in a joint operation in which the activity corresponds to a business (as defined in IFRS 3 Business combinations) to: ‐ apply to all business combinations that represent the principles of IFRS 3 and other IFRSs – disclose the information required by IFRS 3 and other IFRSs for business combinations purposes.
Effective for annual periods beginning on or after January 1, 2016
Investment Entities: Applying the Consolidation Exception (amendments to IFRS 10, IFRS 12 and IAS 28). On December 18, 2014, the IASB published Investment Entities: applying the consolidation exception, amendments to IFRS 10 Consolidated Financial Statements, IFRS 12 Disclosure of interest in Other Entities, and IAS 28 Investments in Associates and Joint Ventures (2011) to address issues arising from the application of the consolidation exception to investment entities.
Effective for annual periods beginning on or after January 1, 2016
127
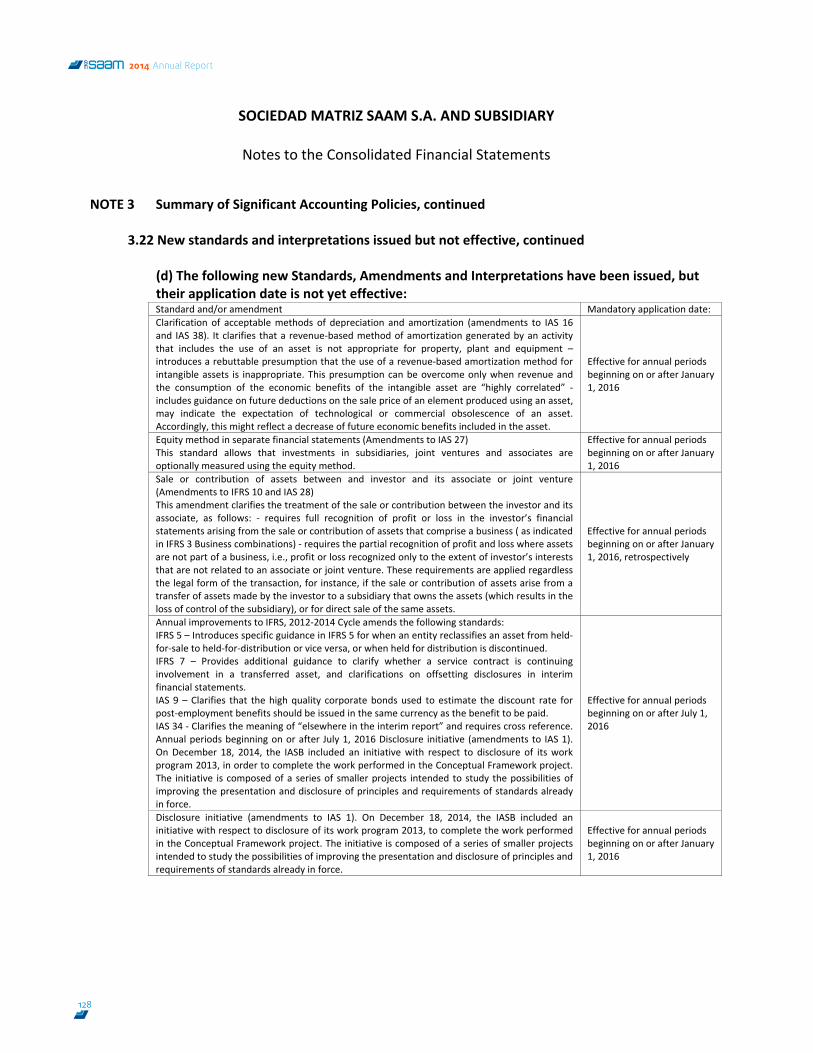
SOCIEDAD MATRIZ SAAM S.A. AND SUBSIDIARY
Notes to the Consolidated Financial Statements
37
NOTE 3 Summary of Significant Accounting Policies, continued
3.22 New standards and interpretations issued but not effective, continued
(d) The following new Standards, Amendments and Interpretations have been issued, but their application date is not yet effective: Standard and/or amendment Mandatory application date:Clarification of acceptable methods of depreciation and amortization (amendments to IAS 16 and IAS 38). It clarifies that a revenue‐based method of amortization generated by an activity that includes the use of an asset is not appropriate for property, plant and equipment – introduces a rebuttable presumption that the use of a revenue‐based amortization method for intangible assets is inappropriate. This presumption can be overcome only when revenue and the consumption of the economic benefits of the intangible asset are “highly correlated” ‐ includes guidance on future deductions on the sale price of an element produced using an asset, may indicate the expectation of technological or commercial obsolescence of an asset. Accordingly, this might reflect a decrease of future economic benefits included in the asset.
Effective for annual periods beginning on or after January 1, 2016
Equity method in separate financial statements (Amendments to IAS 27) This standard allows that investments in subsidiaries, joint ventures and associates are optionally measured using the equity method.
Effective for annual periods beginning on or after January 1, 2016
Sale or contribution of assets between and investor and its associate or joint venture (Amendments to IFRS 10 and IAS 28) This amendment clarifies the treatment of the sale or contribution between the investor and its associate, as follows: ‐ requires full recognition of profit or loss in the investor’s financial statements arising from the sale or contribution of assets that comprise a business ( as indicated in IFRS 3 Business combinations) ‐ requires the partial recognition of profit and loss where assets are not part of a business, i.e., profit or loss recognized only to the extent of investor’s interests that are not related to an associate or joint venture. These requirements are applied regardless the legal form of the transaction, for instance, if the sale or contribution of assets arise from a transfer of assets made by the investor to a subsidiary that owns the assets (which results in the loss of control of the subsidiary), or for direct sale of the same assets.
Effective for annual periods beginning on or after January 1, 2016, retrospectively
Annual improvements to IFRS, 2012‐2014 Cycle amends the following standards: IFRS 5 – Introduces specific guidance in IFRS 5 for when an entity reclassifies an asset from held‐for‐sale to held‐for‐distribution or vice versa, or when held for distribution is discontinued. IFRS 7 – Provides additional guidance to clarify whether a service contract is continuing involvement in a transferred asset, and clarifications on offsetting disclosures in interim financial statements. IAS 9 – Clarifies that the high quality corporate bonds used to estimate the discount rate for post‐employment benefits should be issued in the same currency as the benefit to be paid. IAS 34 ‐ Clarifies the meaning of “elsewhere in the interim report” and requires cross reference. Annual periods beginning on or after July 1, 2016 Disclosure initiative (amendments to IAS 1). On December 18, 2014, the IASB included an initiative with respect to disclosure of its work program 2013, in order to complete the work performed in the Conceptual Framework project. The initiative is composed of a series of smaller projects intended to study the possibilities of improving the presentation and disclosure of principles and requirements of standards already in force.
Effective for annual periods beginning on or after July 1, 2016
Disclosure initiative (amendments to IAS 1). On December 18, 2014, the IASB included an initiative with respect to disclosure of its work program 2013, to complete the work performed in the Conceptual Framework project. The initiative is composed of a series of smaller projects intended to study the possibilities of improving the presentation and disclosure of principles and requirements of standards already in force.
Effective for annual periods beginning on or after January 1, 2016
128
2014 Annual Report
SOCIEDAD MATRIZ SAAM S.A. AND SUBSIDIARY
Notes to the Consolidated Financial Statements
38
NOTE 4 Accounting changes
During the period between January 1 and December 31, 2014, the Company has uniformly applied all the accounting principles compared with the same period of 2013, and there are no accounting changes that have significantly affected the interpretation of such accounting principles.
NOTE 5 Risk management The Company has exposure to the following risks from its operations: credit risk, liquidity, market risk, currency risk, operating risk and capital management risk. These risks arise from the Company’s normal business activities and management manages exposure to them using SM‐SAAM’s strategy. SM‐SAAM’s risk management policies are established to identify and analyze the risks faced by the Company, to set appropriate risk limits and controls, and to monitor risks and adherence to limits. The Company’s financing sources correspond mainly to equity, loans and leases as well as the balance of the Company’s payables. The policy defined to mitigate the credit effects is intended to reach a balanced structure between long and short‐term financing sources, low credit exposure and credits in line with the flows generated by the Company. a) Credit risk
Credit risk is the risk of financial loss to the Company if a customer or counterparty to a financial instrument fails to meet its contractual obligations, and arises principally from the Company’s receivables from customers. In granting credits, clients are assessed in order to reduce the risk of default. The credits granted are reviewed on a periodical basis to apply the controls defined by the Company and monitor the status of pending receivables. Most services to clients are rendered under market conditions (simple credits not exceeding 90 days). Transactions are not concentrated on significant clients; on the contrary, the Company’s clients are much diversified which allows distributing the risk.
129
SOCIEDAD MATRIZ SAAM S.A. AND SUBSIDIARY
Notes to the Consolidated Financial Statements
39
NOTE 5 Risk management, continued
a) Credit risk, continued Allowance for doubtful accounts is determined on a monthly basis, and the calculation methodology considers 100% of the past due trade receivables for a period exceeding 360 days that are not secured, as well as all documents set to judicial collection.
Starting from November 1, 2013, the direct subsidiary SAAM S.A. has a hedging credit insurance of 90% for clients with credit revolving facilities exceeding UF20, that are previously approved by the insurance company. For notes receivable issued subsequent to November 1, 2013, SAAM makes an allowance in the event that evidence of impairment of trade receivables is found, per the following criterion: Asset aging Factor After 60 days from the maturity date of the notes receivable 10% For those customer portfolios not supported by a credit insurance agreement that corresponds to notes receivable issued by the direct subsidiary SAAM, prior to November 1, 2013 and for the remaining subsidiaries included in the consolidation, allowances are recognized in the event of finding evidence of impairment of trade receivables, in accordance with the following: Asset aging Factor Over 360 days 100% Legal collection, rubber checks and others 100% High risk clients reviewed individually and market conditions 100%
130
2014 Annual Report
SOCIEDAD MATRIZ SAAM S.A. AND SUBSIDIARY
Notes to the Consolidated Financial Statements
40
NOTE 5 Risk management, continued
a) Credit risk, continued The carrying amount of financial assets represents the maximum credit exposure. The maximum credit exposure at the reporting date is as follows: Impairment losses The maximum exposure to credit risk for trade receivables as of December 31, 2014 and 2013 is as follows:
Note 12‐31‐2014ThUS$
12‐31‐2013ThUS$
Current Non‐current Total Current Non‐current Total
Trade receivables 80,212 ‐ 80,212 78,360 ‐ 78,360Impairment of trade receivables (1) (5,230) ‐ (5,230) (4,462) ‐ (4,462)Trade receivables, net 74,982 ‐ 74,982 73,898 ‐ 73,898
Other accounts receivable 8,883 12,981 21,864 11,383 15,137 26,520Impairment of other accounts receivable (2) ‐ (2) (44) ‐ (44)Other accounts receivable, net 8,881 12,981 21,862 11,339 15,137 26,476Trade and other receivables 11 83,863 12,981 96,844 85,237 15,137 100,374
(1) Includes legal collection, rubber checks and high risk clients. Variations in the provision for impairment 12‐31‐2014
ThUS$ 12‐31‐2013
ThUS$ Opening balance as of January 1 4,506 3,411Increase in provision (Note 32) 1,664 1,316Write‐down of receivables (542) (272)Foreign currency translation difference (396) 51
Total provision for impairment 5,232 4,506
131
SOCIEDAD MATRIZ SAAM S.A. AND SUBSIDIARY
Notes to the Consolidated Financial Statements
41
NOTE 5 Risk management, continued
b) Liquidity risk
Liquidity risk is the risk that the Group will encounter difficulty in meeting the obligations associated with its financial liabilities that are settled by delivering cash or another financial asset. The Company’s approach to managing liquidity is to ensure, as far as possible, that it will always have sufficient liquidity to meet its liabilities when due, under both normal and stressed conditions, without incurring unacceptable losses or risking damage to the Company’s reputation. SM‐SAAM believes the forecasted liquidity needs between receivables (balances receivable from customers, dividends, etc,), the related expenses (trade, financial expenses, etc,) and the cash amounts so that the Company does not have to request any short‐term external financing. Should cash surpluses exist, these may be invested in low risk financial instruments. b.1) Exposure to liquidity risk Contractual maturities of financial liabilities, including estimated interest payments and excluding the impact of balance offsetting agreements are as follows:
12‐31‐2014
Note CarryingAmount
ThUS$
Contractualcash flows
ThUS$
6months or less ThUS$
6 – 12months
ThUS$
1 – 2 years
ThUS$
2 – 5years
ThUS$
Morethan 5 years ThUS$
Non‐derivative financial liabilities Secured bank loans 22.1 (25,977) (28,763) (1,847) (2,093) (3,672) (14,149) (7,002)Unsecured bank loans 22.1 (156,284) (167,598) (17,790) (22,529) (27,564) (79,138) (20,577)Finance lease liabilities 22.2 (6,205) (6,620) (1,024) (1,024) (1,140) (3,345) (87)Guaranteed factoring liabilities from trade receivables
22.3 (800) (800) (800) ‐ ‐ ‐ ‐
Trade and other payables and due to related parties
12 and 23
(54,497) (54,497) (40,873) (13,607) ‐ ‐ (17)
Derivative financial assets Foreign exchange derivative forwards
10.a
60 60 ‐ 60 ‐ ‐ ‐
Change in exchange rate used for hedging
22.4 (894) (894) ‐ (538) (356) ‐ ‐
Total (244,597) (259,112) (62,334) (39,731) (32,732) (96,632) (27,683)
Maturity dates included in the aging analysis are not expected to differ significantly from the settlement date.
132
2014 Annual Report
SOCIEDAD MATRIZ SAAM S.A. AND SUBSIDIARY
Notes to the Consolidated Financial Statements
42
NOTE 5 Risk management, continued
b) Liquidity risk, continued
b.1) Exposure to liquidity risk, continued
12‐31‐2013
Note CarryingAmount
ThUS$
Contractualcash flows
ThUS$
6months or less ThUS$
6 – 12months
ThUS$
1 – 2 years
ThUS$
2 – 5years
ThUS$
Morethan 5 years ThUS$
Non‐derivative financial liabilities Secured bank loans 22.1 (111,619) (132,539) (6,090) (8,774) (23,657) (46,216) (47,802)Unsecured bank loans 22.1 (76,806) (79,427) (8,770) (15,338) (22,560) (27,559) (5,200)Finance lease liabilities 22.2 (2,199) (2,254) (492) (493) (1,039) (230) ‐Trade and other payables and due to related parties
12 and 23
(48,579) (48,579) (35,725) (12,821) ‐ ‐ (33)
Derivative financial assets Foreign exchange derivative forwards
10.a
2,207 2,207 551 1,656 ‐ ‐ ‐
Change in exchange rate used for hedging
22.4 (533) (533) ‐ (68) (465) ‐ ‐
Total (237,529) (261,125) (50,526) (35,838) (47,721) (74,005) (53,035)
c) Market risk
Market risk is the risk that changes in market prices, such as foreign exchange rates, interest rates and equity prices will affect the SM‐SAAM’ income or the value of its holdings of financial instruments. The objective of market risk management is to manage and control market risk exposures within acceptable parameters, while optimizing the return. The Company buys and sells derivatives, and also incurs financial liabilities, in order to manage market risks. Generally, SM‐SAAM seeks to apply hedge accounting in order to manage volatility in profit or loss resulting from net exposure of assets and liabilities in foreign currency, mainly in Chilean pesos, Mexican pesos and Brazilian reais. To minimize the interest risk rate to which some credits and finance leases obtained in Chile and abroad are subject, the Company contracts interest rate swaps.
133
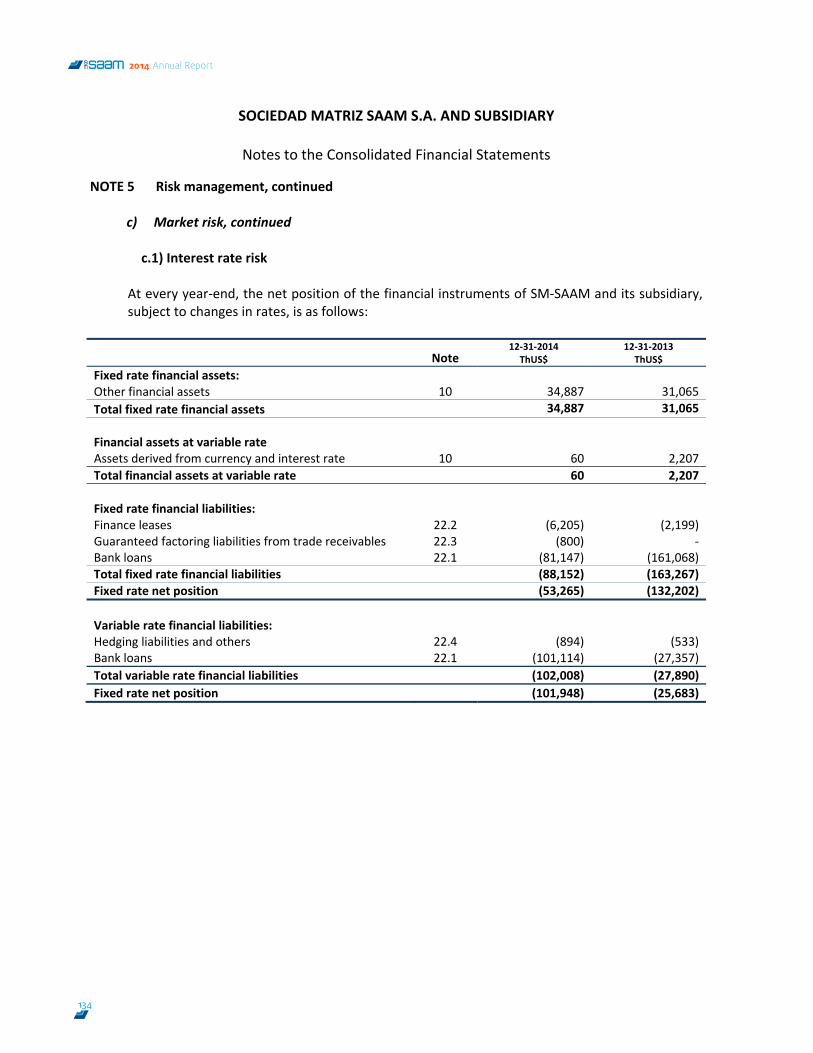
SOCIEDAD MATRIZ SAAM S.A. AND SUBSIDIARY
Notes to the Consolidated Financial Statements
43
NOTE 5 Risk management, continued c) Market risk, continued c.1) Interest rate risk
At every year‐end, the net position of the financial instruments of SM‐SAAM and its subsidiary, subject to changes in rates, is as follows:
Note
12‐31‐2014ThUS$
12‐31‐2013ThUS$
Fixed rate financial assets: Other financial assets 10 34,887 31,065Total fixed rate financial assets 34,887 31,065 Financial assets at variable rate Assets derived from currency and interest rate 10 60 2,207Total financial assets at variable rate 60 2,207 Fixed rate financial liabilities: Finance leases 22.2 (6,205) (2,199)Guaranteed factoring liabilities from trade receivables 22.3 (800) ‐ Bank loans 22.1 (81,147) (161,068)Total fixed rate financial liabilities (88,152) (163,267)Fixed rate net position (53,265) (132,202) Variable rate financial liabilities: Hedging liabilities and others 22.4 (894) (533)Bank loans 22.1 (101,114) (27,357)Total variable rate financial liabilities (102,008) (27,890)Fixed rate net position (101,948) (25,683)
134
2014 Annual Report
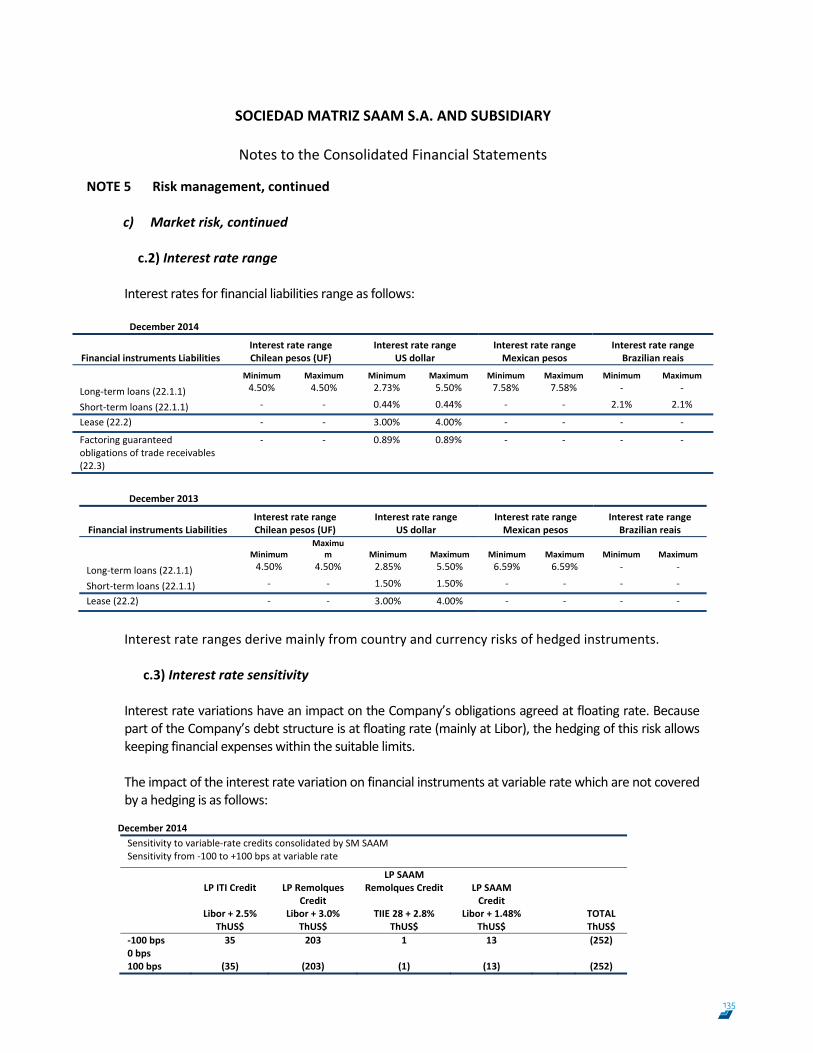
SOCIEDAD MATRIZ SAAM S.A. AND SUBSIDIARY
Notes to the Consolidated Financial Statements
44
NOTE 5 Risk management, continued c) Market risk, continued
c.2) Interest rate range
Interest rates for financial liabilities range as follows:
December 2014
Financial instruments Liabilities Interest rate range Chilean pesos (UF)
Interest rate range US dollar
Interest rate range Mexican pesos
Interest rate range Brazilian reais
Minimum Maximum Minimum Maximum Minimum Maximum Minimum Maximum
Long‐term loans (22.1.1) 4.50% 4.50% 2.73% 5.50% 7.58% 7.58% ‐ ‐
Short‐term loans (22.1.1) ‐ ‐ 0.44% 0.44% ‐ ‐ 2.1% 2.1%
Lease (22.2) ‐ ‐ 3.00% 4.00% ‐ ‐ ‐ ‐
Factoring guaranteed obligations of trade receivables (22.3)
‐ ‐ 0.89% 0.89% ‐ ‐ ‐ ‐
December 2013
Financial instruments Liabilities Interest rate range Chilean pesos (UF)
Interest rate range US dollar
Interest rate range Mexican pesos
Interest rate range Brazilian reais
Minimum
Maximum Minimum Maximum Minimum Maximum Minimum Maximum
Long‐term loans (22.1.1) 4.50% 4.50% 2.85% 5.50% 6.59% 6.59% ‐ ‐
Short‐term loans (22.1.1) ‐ ‐ 1.50% 1.50% ‐ ‐ ‐ ‐
Lease (22.2) ‐ ‐ 3.00% 4.00% ‐ ‐ ‐ ‐
Interest rate ranges derive mainly from country and currency risks of hedged instruments.
c.3) Interest rate sensitivity
Interest rate variations have an impact on the Company’s obligations agreed at floating rate. Because part of the Company’s debt structure is at floating rate (mainly at Libor), the hedging of this risk allows keeping financial expenses within the suitable limits. The impact of the interest rate variation on financial instruments at variable rate which are not covered by a hedging is as follows:
December 2014
Sensitivity to variable‐rate credits consolidated by SM SAAMSensitivity from ‐100 to +100 bps at variable rate
LP ITI Credit
LP Remolques Credit
LP SAAM Remolques Credit LP SAAM
Credit
Libor + 2.5% Libor + 3.0% TIIE 28 + 2.8% Libor + 1.48% TOTAL ThUS$ ThUS$ ThUS$ ThUS$ ThUS$ ‐100 bps 35 203 1 13 (252) 0 bps 100 bps (35) (203) (1) (13) (252)
135
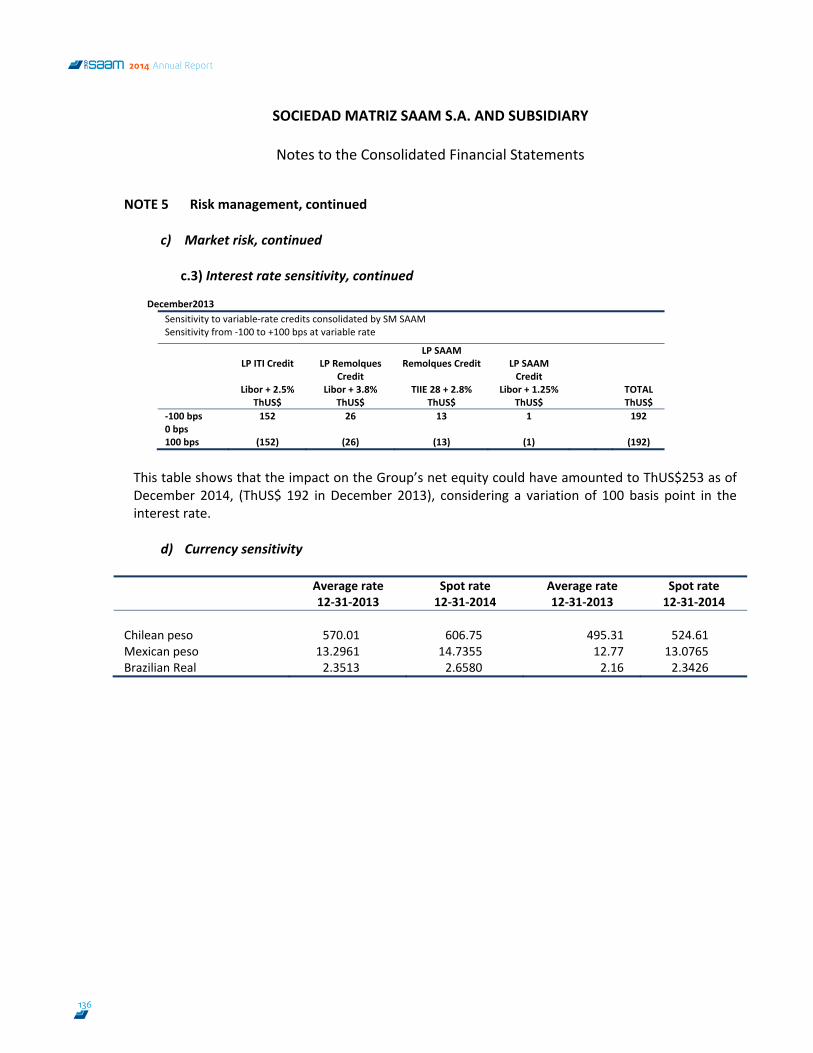
SOCIEDAD MATRIZ SAAM S.A. AND SUBSIDIARY
Notes to the Consolidated Financial Statements
45
NOTE 5 Risk management, continued
c) Market risk, continued
c.3) Interest rate sensitivity, continued
December2013
Sensitivity to variable‐rate credits consolidated by SM SAAMSensitivity from ‐100 to +100 bps at variable rate
LP ITI Credit
LP Remolques Credit
LP SAAM Remolques Credit LP SAAM
Credit
Libor + 2.5% Libor + 3.8% TIIE 28 + 2.8% Libor + 1.25% TOTAL ThUS$ ThUS$ ThUS$ ThUS$ ThUS$ ‐100 bps 152 26 13 1 192 0 bps 100 bps (152) (26) (13) (1) (192)
This table shows that the impact on the Group’s net equity could have amounted to ThUS$253 as of December 2014, (ThUS$ 192 in December 2013), considering a variation of 100 basis point in the interest rate.
d) Currency sensitivity
Average rate
12‐31‐2013 Spot rate12‐31‐2014
Average rate 12‐31‐2013
Spot rate12‐31‐2014
Chilean peso 570.01 606.75 495.31 524.61Mexican peso 13.2961 14.7355 12.77 13.0765Brazilian Real 2.3513 2.6580 2.16 2.3426
136
2014 Annual Report
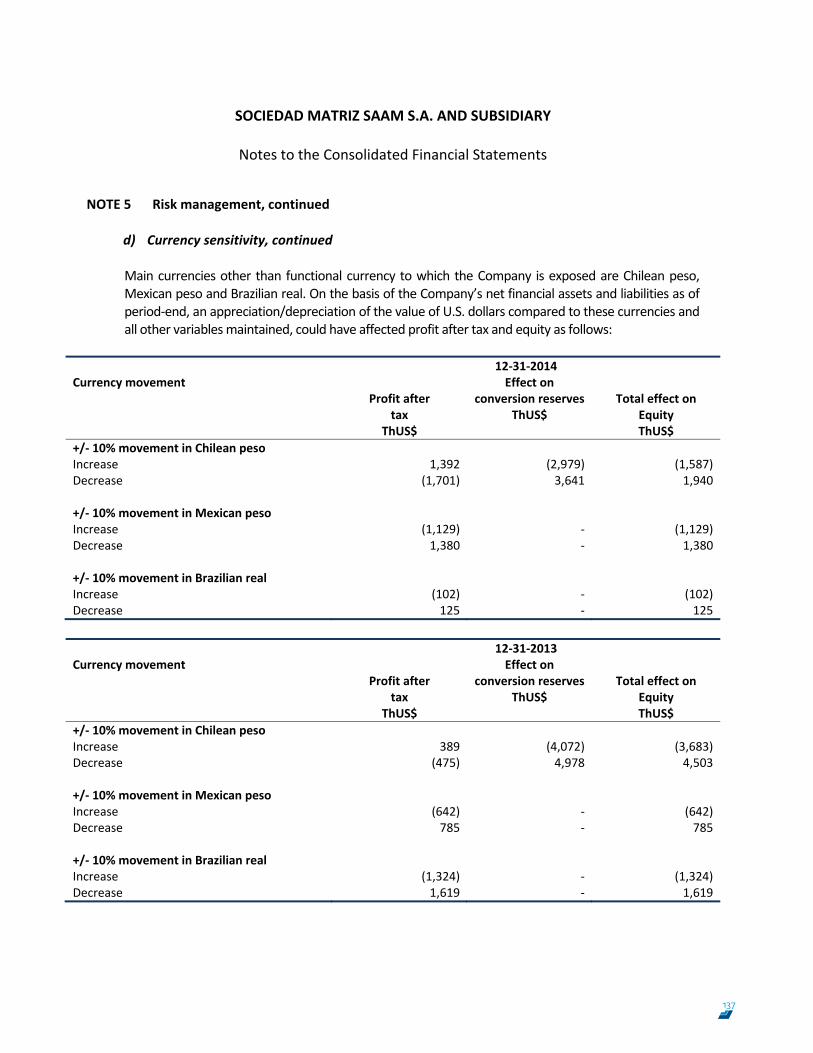
SOCIEDAD MATRIZ SAAM S.A. AND SUBSIDIARY
Notes to the Consolidated Financial Statements
46
NOTE 5 Risk management, continued
d) Currency sensitivity, continued Main currencies other than functional currency to which the Company is exposed are Chilean peso, Mexican peso and Brazilian real. On the basis of the Company’s net financial assets and liabilities as of period‐end, an appreciation/depreciation of the value of U.S. dollars compared to these currencies and all other variables maintained, could have affected profit after tax and equity as follows:
12‐31‐2014Currency movement
Profit after tax
ThUS$
Effect on conversion reserves
ThUS$ Total effect on
Equity ThUS$
+/‐ 10% movement in Chilean peso Increase 1,392 (2,979) (1,587)Decrease (1,701) 3,641 1,940 +/‐ 10% movement in Mexican peso Increase (1,129) ‐ (1,129)Decrease 1,380 ‐ 1,380 +/‐ 10% movement in Brazilian real Increase (102) ‐ (102)Decrease 125 ‐ 125
12‐31‐2013Currency movement
Profit after tax
ThUS$
Effect on conversion reserves
ThUS$ Total effect on
Equity ThUS$
+/‐ 10% movement in Chilean peso Increase 389 (4,072) (3,683)Decrease (475) 4,978 4,503 +/‐ 10% movement in Mexican peso Increase (642) ‐ (642)Decrease 785 ‐ 785 +/‐ 10% movement in Brazilian real Increase (1,324) ‐ (1,324)Decrease 1,619 ‐ 1,619
137
SOCIEDAD MATRIZ SAAM S.A. AND SUBSIDIARY
Notes to the Consolidated Financial Statements
47
NOTE 5 Risk management, continued
e) Operational risk
Operational risk is the risk of direct or indirect losses resulting from a variety of causes associated to the processes, personnel, technology and infrastructure of the Company and to external factors other than liquidity, market and credit risks such as those derived from legal and regulatory requirements. Operational risks arise from all of the operations of the SM‐SAAM. The main responsibility for the development and implementation of controls to manage the operational risk is assigned to senior management within each business activity. This responsibility is supported by the development of organizational standards for managing the operational risk such as: adequate segregations of duties including the independent authorization of transactions, reconciliation and monitoring of transactions, compliance with regulatory and other legal requirements, documentation of controls and procedures, periodical assessment of the operational risk faced and the adequacy of the controls and procedures to manage the risks identified, periodical reporting of operating losses and proposed remediation actions, development of contingency plans, professional training and development, ethic and business standards and mitigation of risks, including insurance when effective. f) Capital management SM‐SAAM’s policy is to maintain a strong capital base so as to maintain investor, creditor and market confidence and to sustain future development of the business. The Board of Directors monitors the return on capital on a monthly basis. The Company’s senior management maintains a balance between the higher returns that can be obtained from higher credit levels and the advantages and security provided by a strong capital base. SM‐SAAM’s capital management policy is restricted exclusively to the covenants agreed in debt agreements with domestic banks, these covenants are detailed on note 36.6.
138
2014 Annual Report
SOCIEDAD MATRIZ SAAM S.A. AND SUBSIDIARY
Notes to the Consolidated Financial Statements
48
NOTE 6 Segment reporting a) Segmenting criteria
According to the definitions in IFRS 8, SM‐SAAM has defined the following operating segments:
Tugboats Ports Logistics and other
The main services of the mentioned segments are the following:
The tugboats segment comprises the docking, undocking, tugboats, rescue and
offshore support services the Company renders using its fleet comprised of more than 179 ships in the main ports of Chile, Peru, Ecuador, Mexico, Colombia, Uruguay, Brazil, Guatemala, Honduras, Costa Rica, Canada and Panama.
The ports segment renders port operator services in Chile, The United States, Ecuador and Colombia.
The main services of the Logistics and other segment correspond to services related to cargo, such as stowage, unstowage, documentation, storage, deposits, logistics and transport, among others.
b) Operational segments reporting:
The Company used the following criteria to measure revenue, assets and liabilities of the reported segments:
(i) Revenue of each segment is comprised of income and expenses from operations which are directly attributable to each of the reported segments.
(ii) Reported assets and liabilities for each operating segment correspond to those that are directly related to the rendering of the service or operation which are directly attributable to each segment.
(iii) Transactions between segments are not material and they have been removed at
segment level.
139
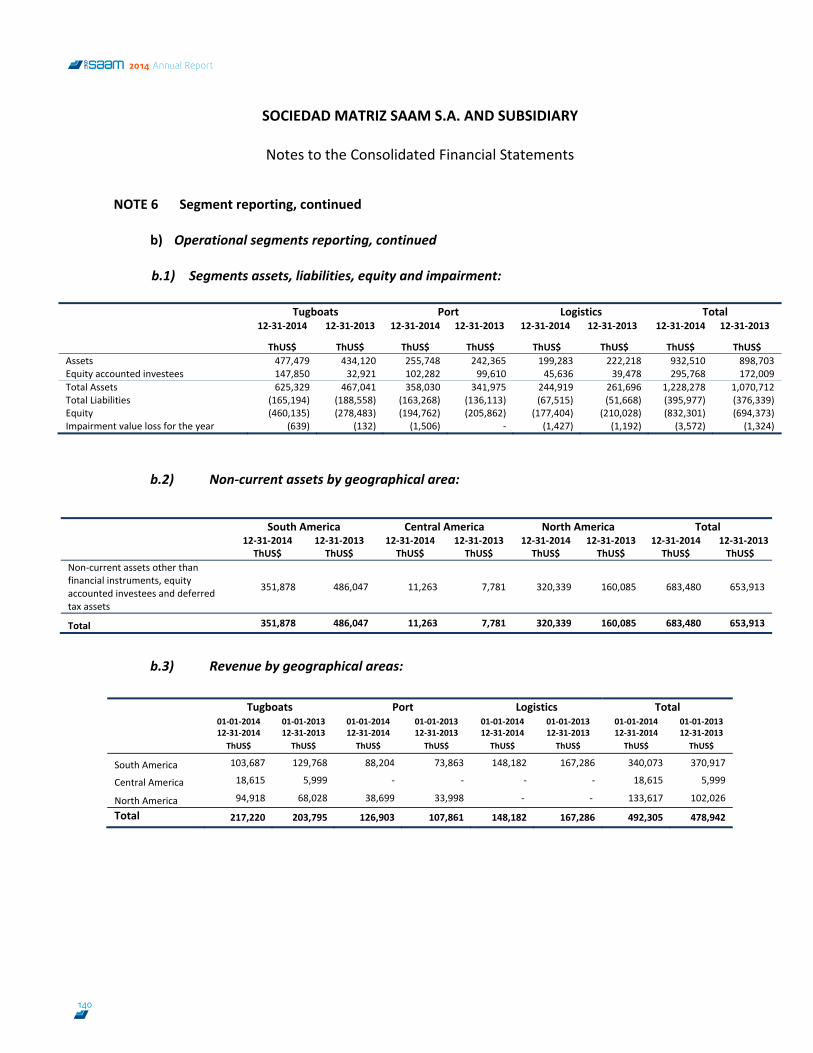
SOCIEDAD MATRIZ SAAM S.A. AND SUBSIDIARY
Notes to the Consolidated Financial Statements
49
NOTE 6 Segment reporting, continued
b) Operational segments reporting, continued
b.1) Segments assets, liabilities, equity and impairment:
Tugboats Port Logistics Total 12‐31‐2014 12‐31‐2013 12‐31‐2014 12‐31‐2013 12‐31‐2014 12‐31‐2013 12‐31‐2014 12‐31‐2013
ThUS$ ThUS$ ThUS$ ThUS$ ThUS$ ThUS$ ThUS$ ThUS$Assets 477,479 434,120 255,748 242,365 199,283 222,218 932,510 898,703Equity accounted investees 147,850 32,921 102,282 99,610 45,636 39,478 295,768 172,009Total Assets 625,329 467,041 358,030 341,975 244,919 261,696 1,228,278 1,070,712Total Liabilities (165,194) (188,558) (163,268) (136,113) (67,515) (51,668) (395,977) (376,339)Equity (460,135) (278,483) (194,762) (205,862) (177,404) (210,028) (832,301) (694,373)Impairment value loss for the year (639) (132) (1,506) ‐ (1,427) (1,192) (3,572) (1,324)
b.2) Non‐current assets by geographical area:
South America Central America North America Total 12‐31‐2014 12‐31‐2013 12‐31‐2014 12‐31‐2013 12‐31‐2014 12‐31‐2013 12‐31‐2014 12‐31‐2013 ThUS$ ThUS$ ThUS$ ThUS$ ThUS$ ThUS$ ThUS$ ThUS$
Non‐current assets other than financial instruments, equity accounted investees and deferred tax assets
351,878 486,047 11,263 7,781 320,339 160,085 683,480 653,913
Total 351,878 486,047 11,263 7,781 320,339 160,085 683,480 653,913
b.3) Revenue by geographical areas:
Tugboats Port Logistics Total 01‐01‐2014
12‐31‐2014 01‐01‐2013 12‐31‐2013
01‐01‐2014 12‐31‐2014
01‐01‐2013 12‐31‐2013
01‐01‐2014 12‐31‐2014
01‐01‐2013 12‐31‐2013
01‐01‐2014 12‐31‐2014
01‐01‐2013 12‐31‐2013
ThUS$ ThUS$ ThUS$ ThUS$ ThUS$ ThUS$ ThUS$ ThUS$
South America 103,687 129,768 88,204 73,863 148,182 167,286 340,073 370,917
Central America 18,615 5,999 ‐ ‐ ‐ ‐ 18,615 5,999
North America 94,918 68,028 38,699 33,998 ‐ ‐ 133,617 102,026
Total 217,220 203,795 126,903 107,861 148,182 167,286 492,305 478,942
140
2014 Annual Report
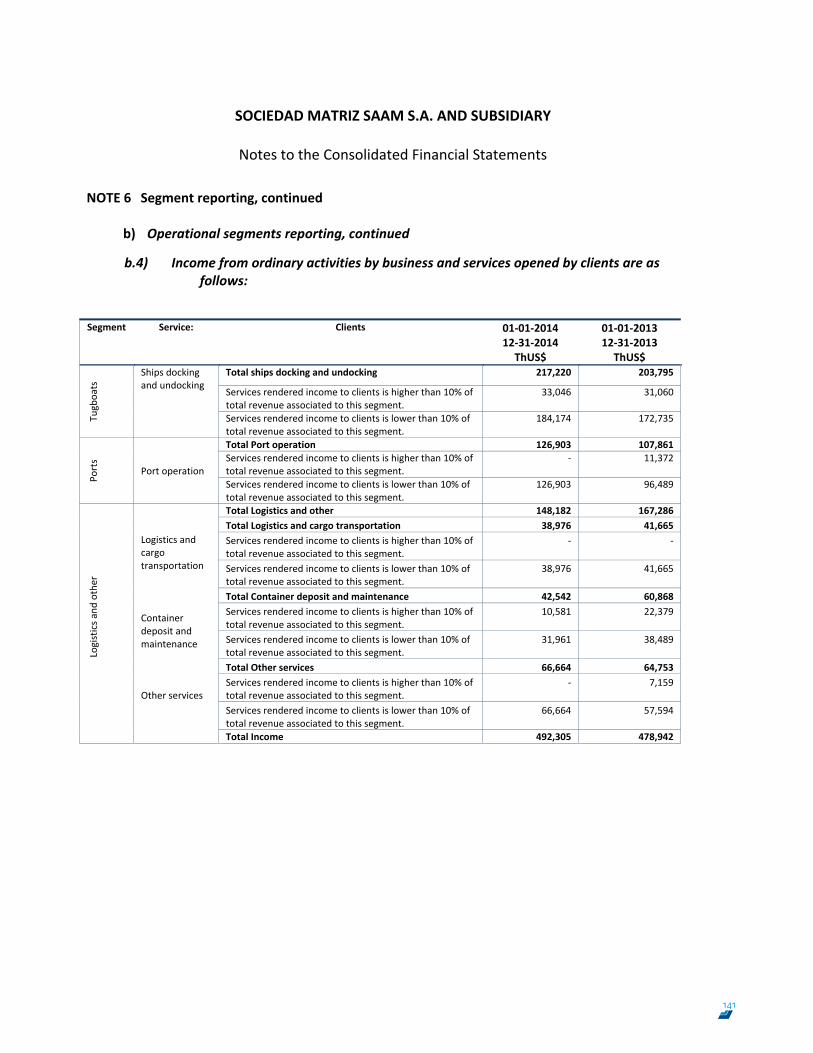
SOCIEDAD MATRIZ SAAM S.A. AND SUBSIDIARY
Notes to the Consolidated Financial Statements
50
NOTE 6 Segment reporting, continued
b) Operational segments reporting, continued
b.4) Income from ordinary activities by business and services opened by clients are as follows:
Segment Service: Clients 01‐01‐2014
12‐31‐2014 ThUS$
01‐01‐2013 12‐31‐2013 ThUS$
Tugboats Ships docking
and undocking Total ships docking and undocking 217,220 203,795 Services rendered income to clients is higher than 10% of total revenue associated to this segment.
33,046 31,060
Services rendered income to clients is lower than 10% of total revenue associated to this segment.
184,174 172,735
Ports
Port operation
Total Port operation 126,903 107,861Services rendered income to clients is higher than 10% of total revenue associated to this segment.
‐ 11,372
Services rendered income to clients is lower than 10% of total revenue associated to this segment.
126,903 96,489
Logistics a
nd other
Logistics and cargo transportation
Total Logistics and other 148,182 167,286Total Logistics and cargo transportation 38,976 41,665Services rendered income to clients is higher than 10% of total revenue associated to this segment.
‐ ‐
Services rendered income to clients is lower than 10% of total revenue associated to this segment.
38,976 41,665
Container deposit and maintenance
Total Container deposit and maintenance 42,542 60,868Services rendered income to clients is higher than 10% of total revenue associated to this segment.
10,581 22,379
Services rendered income to clients is lower than 10% of total revenue associated to this segment.
31,961 38,489
Other services
Total Other services 66,664 64,753Services rendered income to clients is higher than 10% of total revenue associated to this segment.
‐ 7,159
Services rendered income to clients is lower than 10% of total revenue associated to this segment.
66,664 57,594
Total Income 492,305 478,942
141
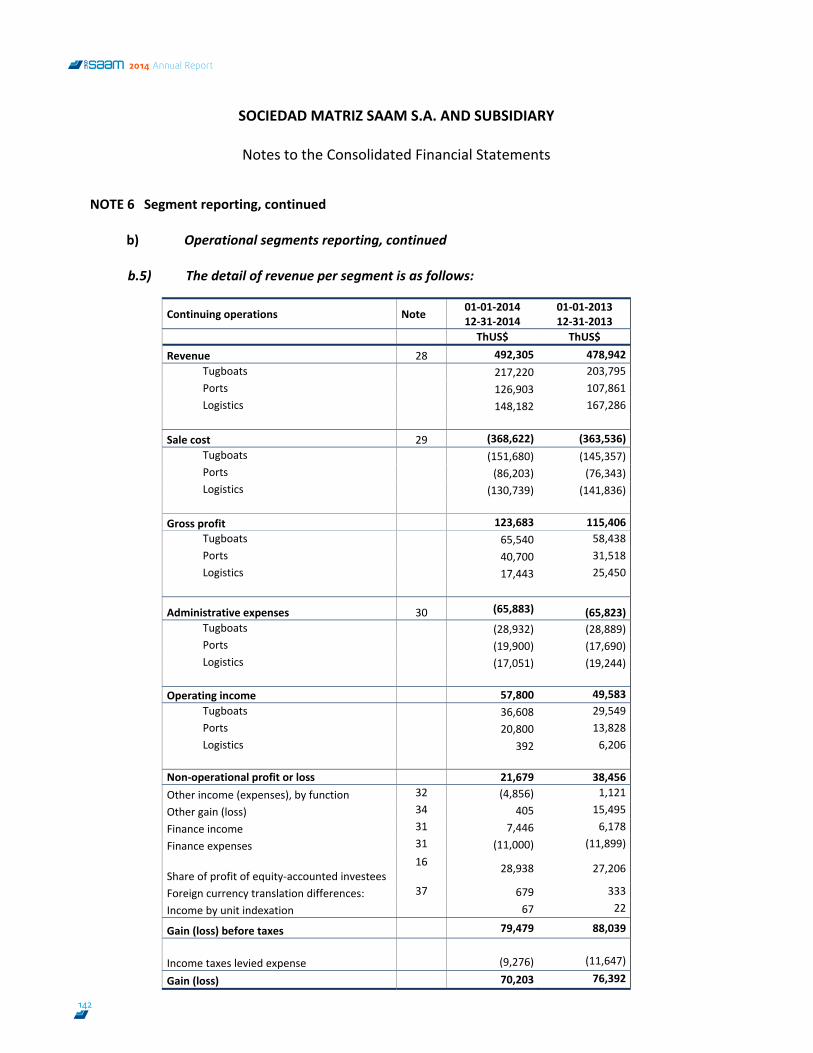
SOCIEDAD MATRIZ SAAM S.A. AND SUBSIDIARY
Notes to the Consolidated Financial Statements
51
NOTE 6 Segment reporting, continued
b) Operational segments reporting, continued
b.5) The detail of revenue per segment is as follows:
Continuing operations Note 01‐01‐2014 12‐31‐2014
01‐01‐2013 12‐31‐2013
ThUS$ ThUS$ Revenue 28 492,305 478,942
Tugboats 217,220 203,795 Ports 126,903 107,861 Logistics 148,182 167,286
Sale cost 29 (368,622) (363,536)
Tugboats (151,680) (145,357) Ports (86,203) (76,343) Logistics (130,739) (141,836)
Gross profit 123,683 115,406
Tugboats 65,540 58,438 Ports 40,700 31,518 Logistics 17,443 25,450
Administrative expenses 30 (65,883) (65,823) Tugboats (28,932) (28,889) Ports (19,900) (17,690) Logistics (17,051) (19,244)
Operating income 57,800 49,583
Tugboats 36,608 29,549 Ports 20,800 13,828 Logistics 392 6,206
Non‐operational profit or loss 21,679 38,456 Other income (expenses), by function 32 (4,856) 1,121
Other gain (loss) 34 405 15,495
Finance income 31 7,446 6,178
Finance expenses 31 (11,000) (11,899)
Share of profit of equity‐accounted investees 16
28,938 27,206
Foreign currency translation differences: 37 679 333
Income by unit indexation 67 22
Gain (loss) before taxes 79,479 88,039
Income taxes levied expense (9,276) (11,647)
Gain (loss) 70,203 76,392
142
2014 Annual Report
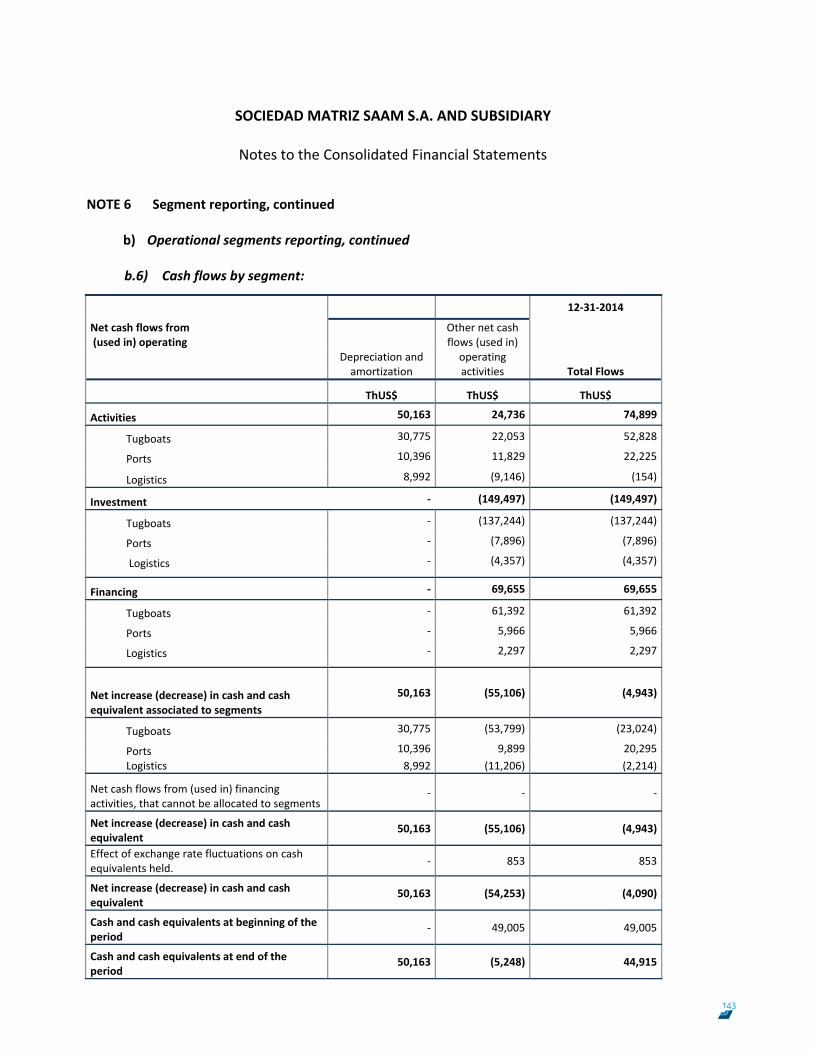
SOCIEDAD MATRIZ SAAM S.A. AND SUBSIDIARY
Notes to the Consolidated Financial Statements
52
NOTE 6 Segment reporting, continued
b) Operational segments reporting, continued
b.6) Cash flows by segment:
12‐31‐2014
Net cash flows from (used in) operating
Depreciation and amortization
Other net cash flows (used in) operating activities
Total Flows
ThUS$ ThUS$ ThUS$
Activities 50,163 24,736 74,899
Tugboats 30,775 22,053 52,828
Ports 10,396 11,829 22,225
Logistics 8,992 (9,146) (154)
Investment ‐ (149,497) (149,497)
Tugboats ‐ (137,244) (137,244)
Ports ‐ (7,896) (7,896)
Logistics ‐ (4,357) (4,357)
Financing ‐ 69,655 69,655
Tugboats ‐ 61,392 61,392
Ports ‐ 5,966 5,966
Logistics ‐ 2,297 2,297
Net increase (decrease) in cash and cash equivalent associated to segments
50,163 (55,106) (4,943)
Tugboats 30,775 (53,799) (23,024)
Ports 10,396 9,899 20,295Logistics 8,992 (11,206) (2,214)
Net cash flows from (used in) financing activities, that cannot be allocated to segments
‐ ‐ ‐
Net increase (decrease) in cash and cash equivalent
50,163 (55,106) (4,943)
Effect of exchange rate fluctuations on cash equivalents held. ‐ 853 853
Net increase (decrease) in cash and cash equivalent
50,163 (54,253) (4,090)
Cash and cash equivalents at beginning of the period
‐ 49,005 49,005
Cash and cash equivalents at end of the period
50,163 (5,248) 44,915
143
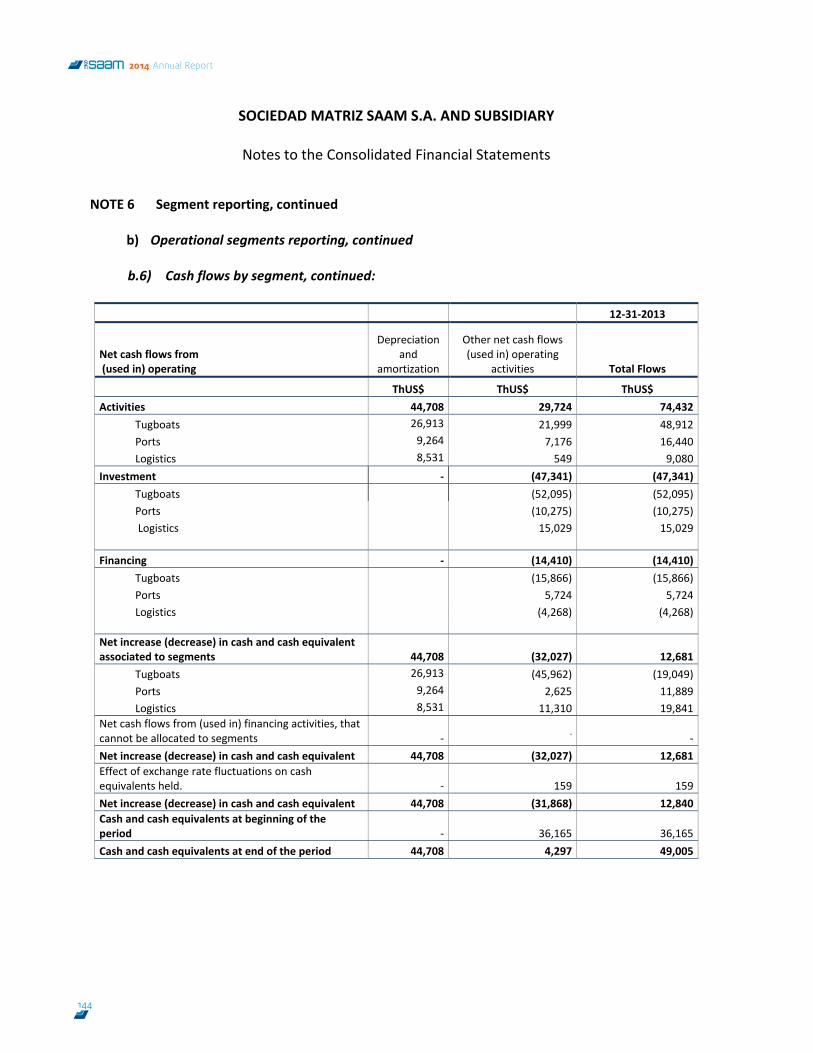
SOCIEDAD MATRIZ SAAM S.A. AND SUBSIDIARY
Notes to the Consolidated Financial Statements
53
NOTE 6 Segment reporting, continued
b) Operational segments reporting, continued
b.6) Cash flows by segment, continued:
12‐31‐2013
Net cash flows from (used in) operating
Depreciation and
amortization
Other net cash flows (used in) operating
activities
Total Flows
ThUS$ ThUS$ ThUS$ Activities 44,708 29,724 74,432
Tugboats 26,913 21,999 48,912Ports 9,264 7,176 16,440Logistics 8,531 549 9,080
Investment ‐ (47,341) (47,341)Tugboats (52,095) (52,095)Ports (10,275) (10,275) Logistics 15,029 15,029
Financing ‐ (14,410) (14,410)Tugboats (15,866) (15,866)Ports 5,724 5,724Logistics (4,268) (4,268)
Net increase (decrease) in cash and cash equivalent associated to segments 44,708 (32,027) 12,681
Tugboats 26,913 (45,962) (19,049)Ports 9,264 2,625 11,889Logistics 8,531 11,310 19,841
Net cash flows from (used in) financing activities, that cannot be allocated to segments ‐ ‐ ‐Net increase (decrease) in cash and cash equivalent 44,708 (32,027) 12,681Effect of exchange rate fluctuations on cash equivalents held. ‐ 159 159Net increase (decrease) in cash and cash equivalent 44,708 (31,868) 12,840Cash and cash equivalents at beginning of the period ‐ 36,165 36,165Cash and cash equivalents at end of the period 44,708 4,297 49,005
144
2014 Annual Report
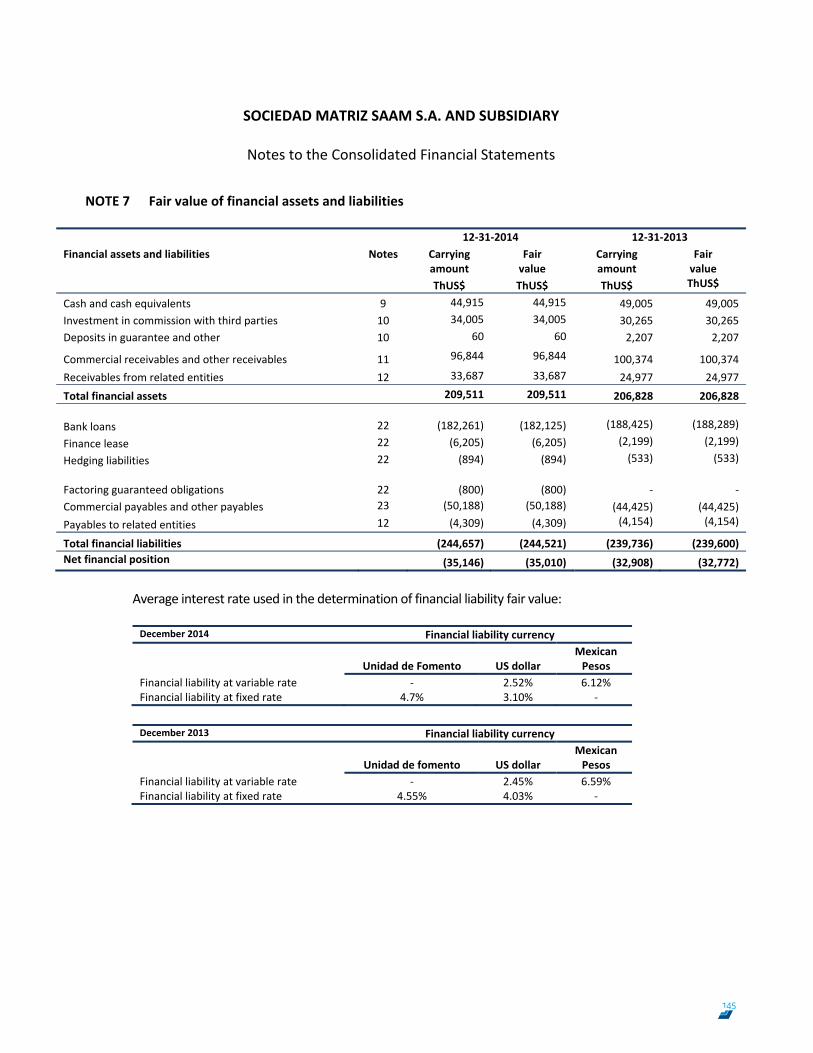
SOCIEDAD MATRIZ SAAM S.A. AND SUBSIDIARY
Notes to the Consolidated Financial Statements
54
NOTE 7 Fair value of financial assets and liabilities
12‐31‐2014 12‐31‐2013 Financial assets and liabilities Notes Carrying
amount Fair value
Carrying amount
Fair value
ThUS$ ThUS$ ThUS$ ThUS$
Cash and cash equivalents 9 44,915 44,915 49,005 49,005 Investment in commission with third parties 10 34,005 34,005 30,265 30,265 Deposits in guarantee and other 10 60 60 2,207 2,207
Commercial receivables and other receivables 11 96,844 96,844 100,374 100,374 Receivables from related entities 12 33,687 33,687 24,977 24,977 Total financial assets 209,511 209,511 206,828 206,828 Bank loans 22 (182,261) (182,125) (188,425) (188,289)
Finance lease 22 (6,205) (6,205) (2,199) (2,199)
Hedging liabilities 22 (894) (894) (533) (533)
Factoring guaranteed obligations
22 (800) (800) ‐
‐
Commercial payables and other payables 23 (50,188) (50,188) (44,425) (44,425) Payables to related entities 12 (4,309) (4,309) (4,154) (4,154)
Total financial liabilities (244,657) (244,521) (239,736) (239,600) Net financial position (35,146) (35,010) (32,908) (32,772)
Average interest rate used in the determination of financial liability fair value:
December 2014 Financial liability currency
Unidad de Fomento
US dollar
Mexican Pesos
Financial liability at variable rate ‐ 2.52% 6.12% Financial liability at fixed rate 4.7% 3.10% ‐
December 2013 Financial liability currency
Unidad de fomento
US dollar Mexican Pesos
Financial liability at variable rate ‐ 2.45% 6.59% Financial liability at fixed rate 4.55% 4.03% ‐
145
SOCIEDAD MATRIZ SAAM S.A. AND SUBSIDIARY
Notes to the Consolidated Financial Statements
55
NOTE 8 Non‐current assets held‐for‐sale
Part of property, plant and equipment is presented as a disposal group held‐for‐sale following the commitment by the management of the following companies:
a) On July 30, 2013, the indirect subsidiary Cosem S.A. subscribed a promise of purchase and sale
with Inverko S.A. for real estate of their ownership, these goods’ carrying amounts amount to ThUS$269 and were part of the opening balance of non‐current assets held‐for‐sale. This operation generates a profit of ThUS$326 to the Company.
b) On July 30, 2013, through its direct subsidiary, SAAM S.A., as vendor, subscribed a promise of
purchase and sale with Inmobiliaria Cargo Park S.P.A., for all of Cargo Park S.A.’s shares, of which SAAM has a 50% share. This promise of purchase and sale correspond to the formalization of the promise of purchase and sale subscribed on May 7, 2013 with Inmobiliaria Renta II S.p.A. This transaction generated a profit net of adjustments and commission of ThUS$14,688 (ThUS$11,995 net of tax).
c) On October 24, 2013, through its indirect subsidiary SAAM Puertos S.A., the Company, as vendor, subscribed a promise of purchase and sale with Marítima Valparaíso – Chile S.A., for all of Puerto Panul S.A. shares, of which SAAM Puertos S.A. had a 14.4% share.
d) On November 11, 2013 through its indirect subsidiary, Aquasaam S.A., the Company, as vendor, subscribed a promise of purchase and sale with Inversiones “CJV” Limitada., for all of Tecnologías Industriales Buildteck S.A. shares, of which Aquasaam had a 50% share.
e) As of December 31, 2012, the indirect subsidiary, Tug Brasil S.A., held the tugboat “Avalon” as an asset held‐for‐sale, due to the non‐compliance of the agreement by the buyer. The Company’s management estimates that is unlikely to complete the sale and decided to reclassify this asset to the item “tugboats” for an amount ThUS$1,577. Currently, this tugboat is under domestic rooting, as long as the trial continues.
146
2014 Annual Report
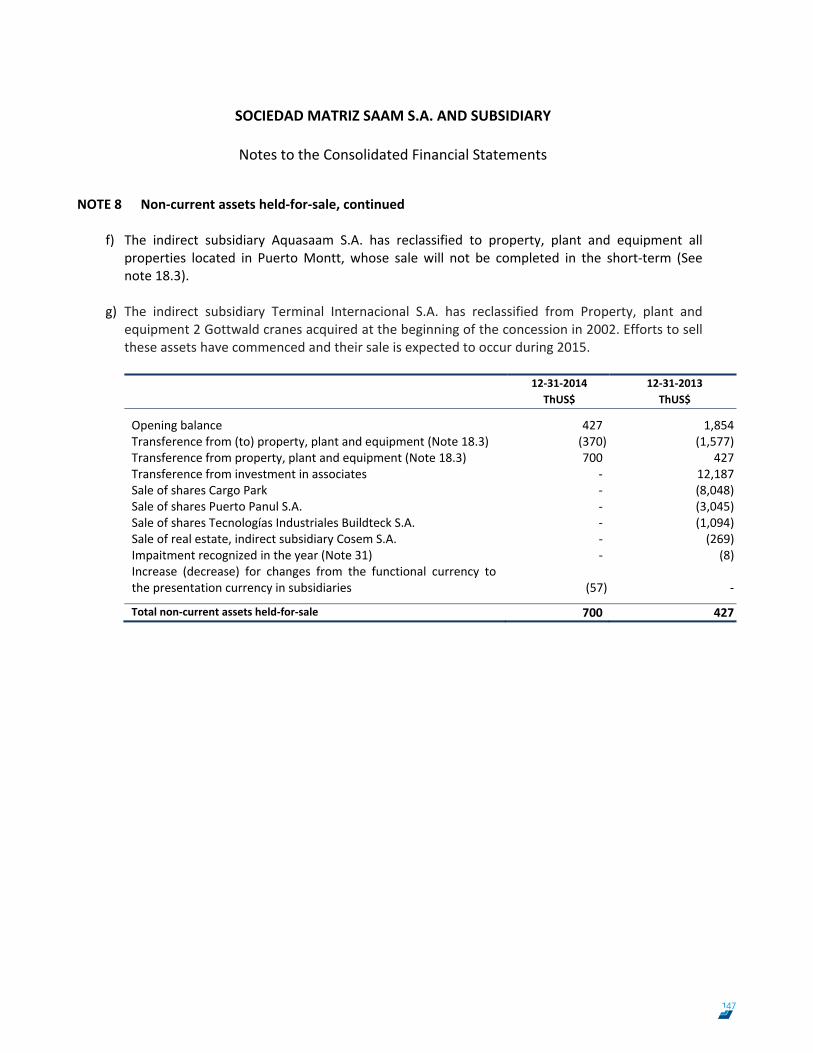
SOCIEDAD MATRIZ SAAM S.A. AND SUBSIDIARY
Notes to the Consolidated Financial Statements
56
NOTE 8 Non‐current assets held‐for‐sale, continued
f) The indirect subsidiary Aquasaam S.A. has reclassified to property, plant and equipment all
properties located in Puerto Montt, whose sale will not be completed in the short‐term (See note 18.3).
g) The indirect subsidiary Terminal Internacional S.A. has reclassified from Property, plant and equipment 2 Gottwald cranes acquired at the beginning of the concession in 2002. Efforts to sell these assets have commenced and their sale is expected to occur during 2015. 12‐31‐2014 12‐31‐2013 ThUS$ ThUS$ Opening balance 427 1,854Transference from (to) property, plant and equipment (Note 18.3) (370) (1,577)Transference from property, plant and equipment (Note 18.3) 700 427Transference from investment in associates ‐ 12,187Sale of shares Cargo Park ‐ (8,048)Sale of shares Puerto Panul S.A. ‐ (3,045)Sale of shares Tecnologías Industriales Buildteck S.A. ‐ (1,094)Sale of real estate, indirect subsidiary Cosem S.A. ‐ (269)Impaitment recognized in the year (Note 31) ‐ (8)Increase (decrease) for changes from the functional currency to the presentation currency in subsidiaries (57) ‐ Total non‐current assets held‐for‐sale 700 427
147
SOCIEDAD MATRIZ SAAM S.A. AND SUBSIDIARY
Notes to the Consolidated Financial Statements
57
NOTE 9 Cash and cash equivalents
The detail of cash and cash equivalents by type of currency is as follows:
12‐31‐2014 12‐31‐2013 ThUS$ ThUS$ Cash 640 239 Balances in banks 25,727 29,945 Short‐term deposits 15,753 16,358 Other cash and cash equivalents 2,795 2,463 Total Cash and cash equivalents 44,915 49,005
Cash is comprised of cash on hand and in bank; short‐term deposits correspond to fixed deposits with banks which are recorded at the investment value plus interest earned at year end. Other cash and cash equivalents relate to financial instruments acquired under reverse repurchase agreements. The detail of cash and cash equivalents by type of currency is as follows:
13‐31‐2014 12‐31‐2013 ThUS$ ThUS$ United State dollar 31,966 33,812 Chilean peso 1,137 ‐ Real 7,770 7,740 Mexican peso 1,785 5,615 Other currencies 1,794 1,075 United State dollar 463 763 Total cash and cash equivalents by currency 44,915 49,005
148
2014 Annual Report
SOCIEDAD MATRIZ SAAM S.A. AND SUBSIDIARY
Notes to the Consolidated Financial Statements
58
NOTE 10 Other current and non‐current financial assets
12‐31‐2014 12‐31‐2013 ThUS$ ThUS$ Total other current financial assets (Note 10.a) 60 2,207 Total other non‐current financial assets (Note 10.b) 34,887 31,065 Total other financial assets 34,947 33,272
Investments held‐to‐maturity are those non‐derivative financial assets with fixed or determinable payments and fixed maturities for which the Company have the positive intent and ability to hold to maturity. Any sale or reclassification of a more than insignificant amount of held‐to maturity investments not close to their maturity would result in the reclassification of all held‐to maturity investments as available for sale.
a) Other current financial assets
The detail of current financial assets is the following:
12‐31‐2014 12‐31‐2013 ThUS$ ThUS$ Interest rate derivative (swap)(1) ‐ 2,207 Interest rate derivative (forward)(2) 60 ‐ Total financial assets at fair value, current 60 2,207
(1) Corresponds to Interest rate derivatives (swap), subscribed by the Company to minimize the risk of interest rate variation, associated with variable rate loans. These derivative contracts were entered into on March 28, 2014, resulting in a debit to comprehensive income of ThUS$1,122, recognized in hedging reserves.
(2) Corresponds to currency derivative contracts (forward) entered into by the Company to minimize the foreign currency exchange
risk in the unhedged balance items (mismatch).
b) Held‐to‐maturity non‐current financial assets
12‐31‐2014 12‐31‐2013 ThUS$ ThUS$ Non‐current Investment in commission with third parties (*) 34,005 30,265 Other financial assets, non‐current 882 800 Total other financial assets, non‐current 34,887 31,065
(*) Interests in non‐controlling investments abroad (South America), accompanying company's line of business that
reported profit for ThUS$5,941 in the period ended December 31, 2014 (ThUS$4,630 same period previous year) included in the caption finance income, (See note 31). In addition, an amount of ThUS$(2,201) related to the investment conversion (ThUS$ 326 en 2013), considering these balances are controlled by the subsidiary Inversiones en Puertos S.A. whose accounting is performed in Peruvian Nuevo sol, the company’s functional currency.
149
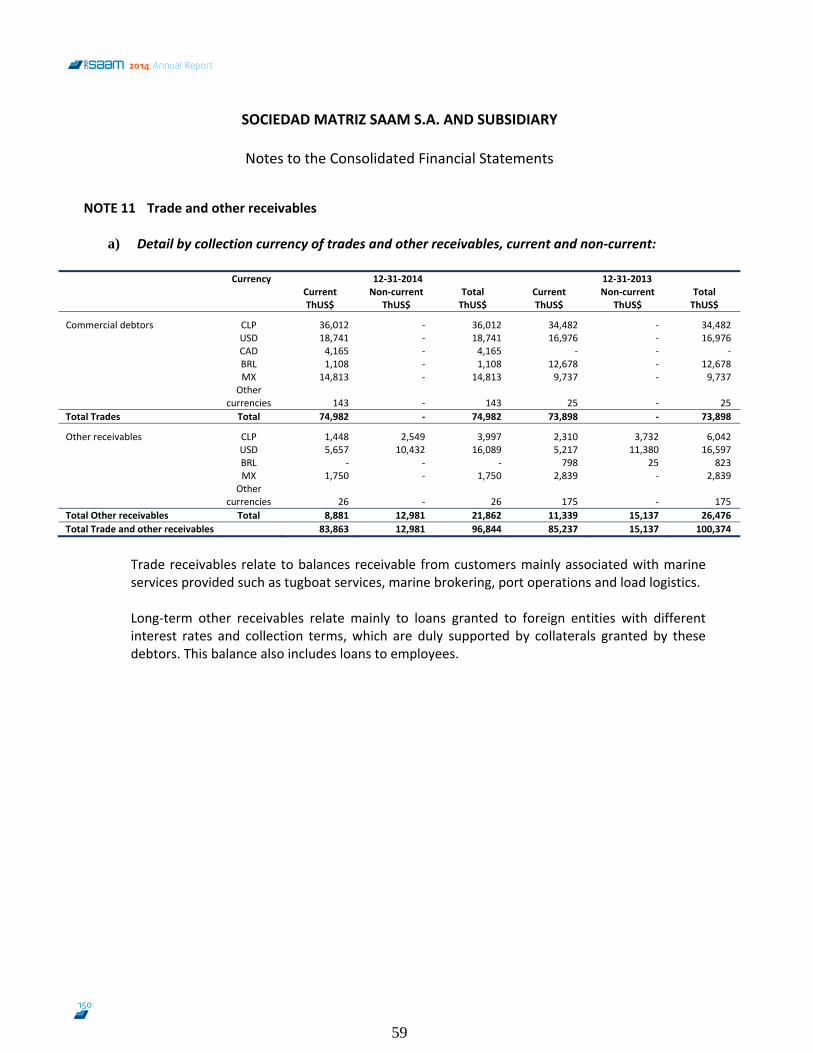
SOCIEDAD MATRIZ SAAM S.A. AND SUBSIDIARY
Notes to the Consolidated Financial Statements
59
NOTE 11 Trade and other receivables
a) Detail by collection currency of trades and other receivables, current and non‐current:
Currency 12‐31‐2014 12‐31‐2013 Current
ThUS$ Non‐current
ThUS$ TotalThUS$
CurrentThUS$
Non‐current ThUS$
TotalThUS$
Commercial debtors CLP 36,012 ‐ 36,012 34,482 ‐ 34,482USD 18,741 ‐ 18,741 16,976 ‐ 16,976CAD 4,165 ‐ 4,165 ‐ ‐ ‐BRL 1,108 ‐ 1,108 12,678 ‐ 12,678MX 14,813 ‐ 14,813 9,737 ‐ 9,737Other
currencies 143 ‐ 143 25 ‐ 25 Total Trades Total 74,982 ‐ 74,982 73,898 ‐ 73,898
Other receivables CLP 1,448 2,549 3,997 2,310 3,732 6,042USD 5,657 10,432 16,089 5,217 11,380 16,597BRL ‐ ‐ ‐ 798 25 823MX 1,750 ‐ 1,750 2,839 ‐ 2,839
Other currencies 26 ‐ 26 175 ‐ 175
Total Other receivables Total 8,881 12,981 21,862 11,339 15,137 26,476Total Trade and other receivables 83,863 12,981 96,844 85,237 15,137 100,374
Trade receivables relate to balances receivable from customers mainly associated with marine services provided such as tugboat services, marine brokering, port operations and load logistics. Long‐term other receivables relate mainly to loans granted to foreign entities with different interest rates and collection terms, which are duly supported by collaterals granted by these debtors. This balance also includes loans to employees.
150
2014 Annual Report
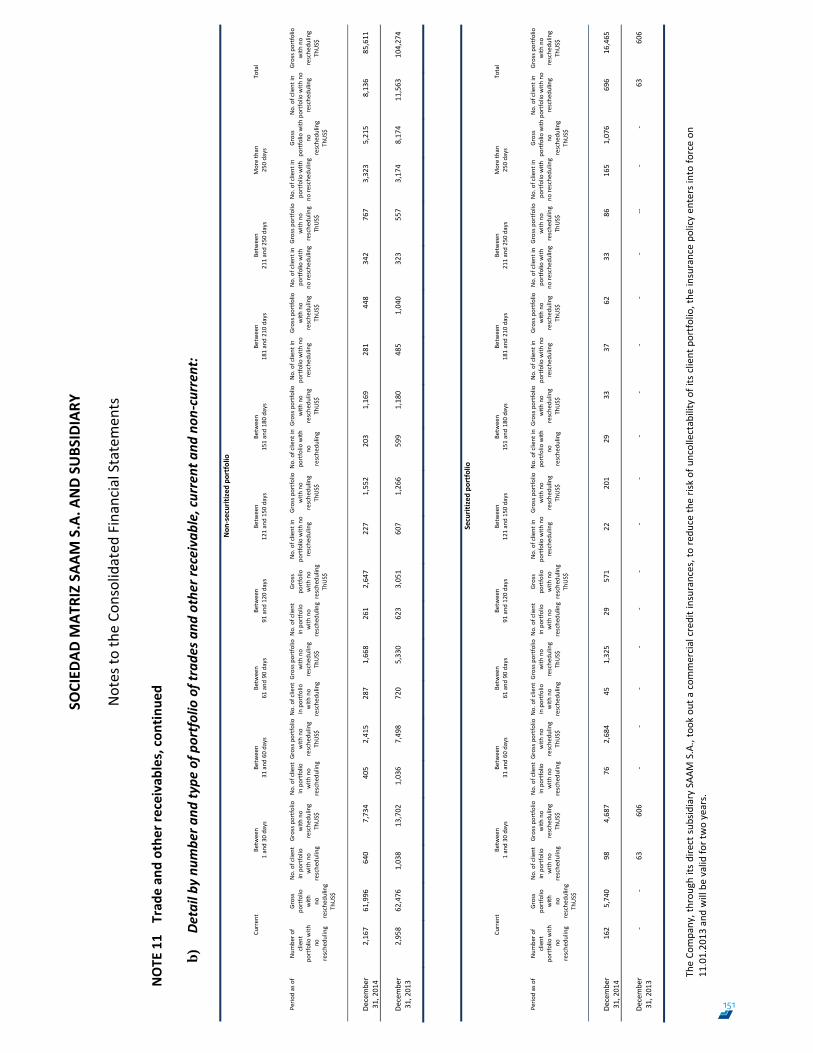
SOCIED
AD M
ATRIZ SA
AM S.A. A
ND SU
BSIDIARY
Notes to
the Co
nsolidated
Financial Statemen
ts
60
NOTE
11
Trad
e an
d othe
r receivables, con
tinue
d
b)De
tail by
num
ber a
nd ty
pe of p
ortfolio of trade
s and
other re
ceivab
le, current and
non
‐current:
Th
e Co
mpany, throu
gh its direct sub
sidiary SAA
M S.A., took
out a com
mercial credit insurances, to
redu
ce th
e risk of uncollectability of its client portfolio, the
insurance po
licy en
ters in
to fo
rce on
11.01.20
13 and
will be valid
for two years.
Non
‐securitized po
rtfolio
Cu
rren
t Be
tween
1 and 30
days
Betw
een
31 and
60 days
Betw
een
61 and
90 days
Betw
een
91 and
120
days
Betw
een
121 and 150 days
Betw
een
151 and 180 days
Betw
een
181 and 210 days
Betw
een
211 and 250 days
More than
250 days
Total
Perio
d as of
Num
ber o
f client
portfolio
with
no
resche
duling
Gross
portfolio
with
no
resche
duling
ThUS$
No. of client
in portfolio
with
no
resche
duling
Gross p
ortfolio
with
no
resche
duling
ThUS$
No. of client
in portfolio
with
no
resche
duling
Gross p
ortfolio
with
no
resche
duling
ThUS$
No. of client
in portfolio
with
no
resche
duling
Gross p
ortfolio
with
no
resche
duling
ThUS$
No. of client
in portfolio
with
no
resche
duling
Gross
portfolio
with
no
resche
duling
ThUS$
No. of client in
po
rtfolio
with
no
resche
duling
Gross p
ortfolio
with
no
resche
duling
ThUS$
No. of client in
po
rtfolio
with
no
resche
duling
Gross p
ortfolio
with
no
resche
duling
ThUS$
No. of client in
po
rtfolio
with
no
resche
duling
Gross p
ortfolio
with
no
resche
duling
ThUS$
No. of client in
po
rtfolio
with
no
resche
duling
Gross p
ortfolio
with
no
resche
duling
ThUS$
No. of client in
po
rtfolio
with
no
resche
duling
Gross
portfolio
with
no
resche
duling
ThUS$
No. of client in
po
rtfolio
with
no
resche
duling
Gross p
ortfolio
with
no
resche
duling
ThUS$
De
cembe
r 31
, 201
4 2,16
7 61
,996
64
0 7,73
4 40
5 2,41
5 28
7 1,66
8 26
1 2,64
7 22
7 1,55
2 20
3 1,16
9 28
1 44
8 34
2 76
7 3,32
3 5,21
5 8,13
6 85
,611
De
cembe
r 31
, 201
3 2,95
8 62
,476
1,03
8 13
,702
1,03
6 7,49
8 72
0 5,33
0 62
3 3,05
1 60
7 1,26
6 59
9 1,18
0 48
5 1,04
0 32
3 55
7 3,17
4 8,17
4 11
,563
10
4,274
Securitized
portfolio
Cu
rren
t Be
tween
1 and 30
days
Betw
een
31 and
60 days
Betw
een
61 and
90 days
Betw
een
91 and
120
days
Betw
een
121 and 150 days
Betw
een
151 and 180 days
Betw
een
181 and 210 days
Betw
een
211 and 250 days
More than
250 days
Total
Perio
d as of
Num
ber o
f client
portfolio
with
no
resche
duling
Gross
portfolio
with
no
resche
duling
ThUS$
No. of client
in portfolio
with
no
resche
duling
Gross p
ortfolio
with
no
resche
duling
ThUS$
No. of client
in portfolio
with
no
resche
duling
Gross p
ortfolio
with
no
resche
duling
ThUS$
No. of client
in portfolio
with
no
resche
duling
Gross p
ortfolio
with
no
resche
duling
ThUS$
No. of client
in portfolio
with
no
resche
duling
Gross
portfolio
with
no
resche
duling
ThUS$
No. of client in
po
rtfolio
with
no
resche
duling
Gross p
ortfolio
with
no
resche
duling
ThUS$
No. of client in
po
rtfolio
with
no
resche
duling
Gross p
ortfolio
with
no
resche
duling
ThUS$
No. of client in
po
rtfolio
with
no
resche
duling
Gross p
ortfolio
with
no
resche
duling
ThUS$
No. of client in
po
rtfolio
with
no
resche
duling
Gross p
ortfolio
with
no
resche
duling
ThUS$
No. of client in
po
rtfolio
with
no
resche
duling
Gross
portfolio
with
no
resche
duling
ThUS$
No. of client in
po
rtfolio
with
no
resche
duling
Gross p
ortfolio
with
no
resche
duling
ThUS$
De
cembe
r 31
, 201
4 16
2 5,74
0 98
4,68
7 76
2,68
4 45
1,32
5 29
57
1 22
20
1 29
33
37
62
33
86
16
5 1,07
6 69
6 16
,465
De
cembe
r 31
, 201
3 ‐
‐ 63
60
6 ‐
‐ ‐
‐ ‐
‐ ‐
‐ ‐
‐ ‐
‐ ‐
‐‐ ‐
‐ 63
60
6
151
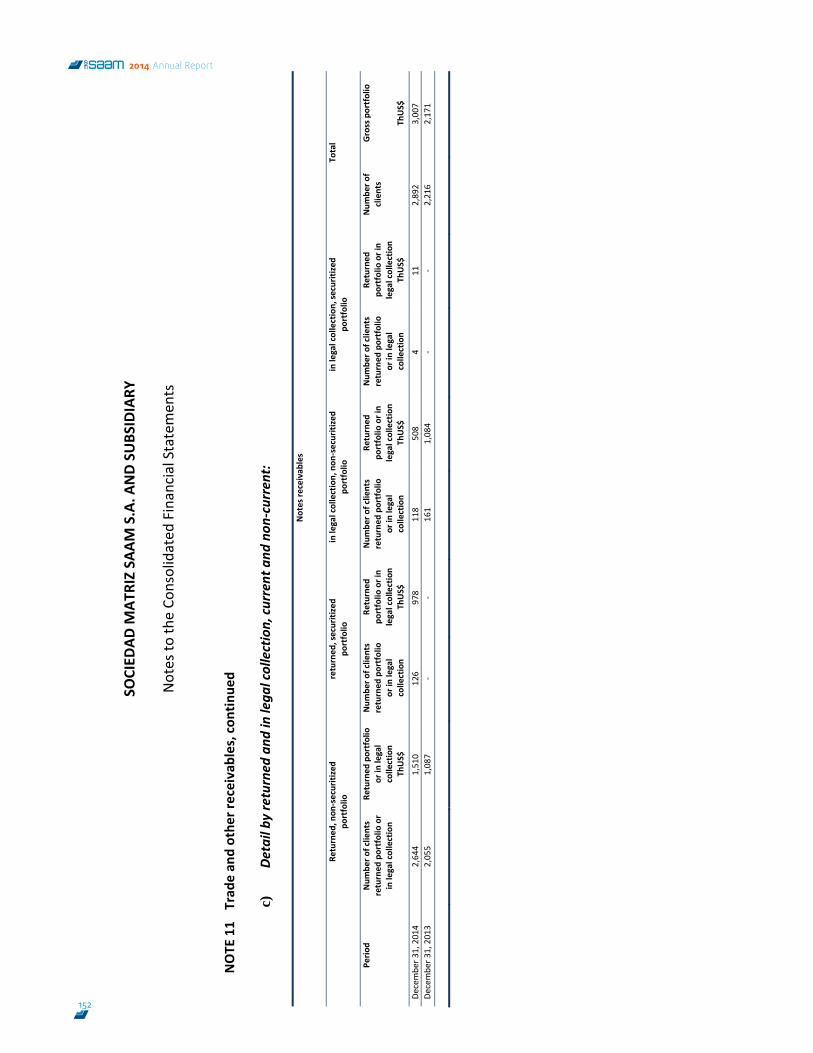
SOCIED
AD M
ATRIZ SA
AM S.A. A
ND SU
BSIDIARY
Notes to
the Co
nsolidated
Financial Statemen
ts
61
NOTE
11
Trad
e an
d othe
r receivables, con
tinue
d
c)De
tail by
returned
and
in lega
l collection, cu
rren
t and
non
‐current:
Notes re
ceivab
les
Re
turned
, non
‐securitized
portfolio
returned
, securitized
portfolio
in legal collection, non
‐securitized
portfolio
in legal collection, se
curitized
po
rtfolio
To
tal
Perio
d Num
ber o
f clients
returned
portfolio or
in legal collection
Returned
portfolio
or in
legal
collection
ThUS$
Num
ber o
f clients
returned
portfolio
or in
legal
collection
Returned
po
rtfolio
or in
legal collection
ThUS$
Num
ber o
f clients
returned
portfolio
or in
legal
collection
Returned
po
rtfolio
or in
legal collection
ThUS$
Num
ber o
f clients
returned
portfolio
or in
legal
collection
Returned
po
rtfolio
or in
legal collection
ThUS$
Num
ber o
f clients
Gross portfolio
Th
US$
De
cembe
r 31, 2014
2,644
1,510
126
978
118
508
4 11
2,892
3,007
Decembe
r 31, 2013
2,055
1,087
‐ ‐
161
1,084
‐ ‐
2,216
2,171
152
2014 Annual Report
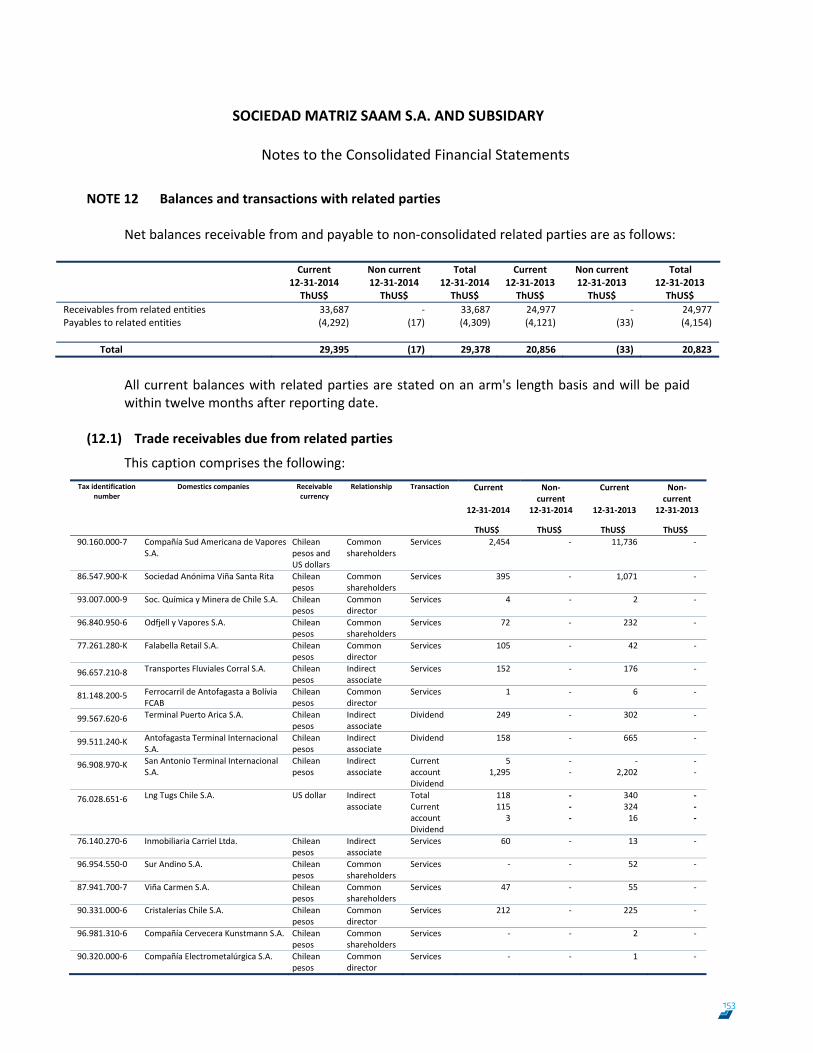
SOCIEDAD MATRIZ SAAM S.A. AND SUBSIDARY
Notes to the Consolidated Financial Statements
62
NOTE 12 Balances and transactions with related parties
Net balances receivable from and payable to non‐consolidated related parties are as follows:
Current Non current Total Current Non current Total 12‐31‐2014 12‐31‐2014 12‐31‐2014 12‐31‐2013 12‐31‐2013 12‐31‐2013 ThUS$ ThUS$ ThUS$ ThUS$ ThUS$ ThUS$Receivables from related entities 33,687 ‐ 33,687 24,977 ‐ 24,977Payables to related entities (4,292) (17) (4,309) (4,121) (33) (4,154)
Total 29,395 (17) 29,378 20,856 (33) 20,823
All current balances with related parties are stated on an arm's length basis and will be paid within twelve months after reporting date.
(12.1) Trade receivables due from related parties
This caption comprises the following:
Tax identification number
Domestics companies Receivable currency
Relationship Transaction Current Non‐current
Current Non‐current
12‐31‐2014 12‐31‐2014 12‐31‐2013 12‐31‐2013
ThUS$ ThUS$ ThUS$ ThUS$ 90.160.000‐7 Compañía Sud Americana de Vapores
S.A. Chilean pesos and US dollars
Common shareholders
Services 2,454 ‐ 11,736 ‐
86.547.900‐K Sociedad Anónima Viña Santa Rita Chilean pesos
Common shareholders
Services 395 ‐ 1,071 ‐
93.007.000‐9 Soc. Química y Minera de Chile S.A. Chilean pesos
Common director
Services 4 ‐ 2 ‐
96.840.950‐6 Odfjell y Vapores S.A. Chilean pesos
Common shareholders
Services 72 ‐ 232 ‐
77.261.280‐K Falabella Retail S.A. Chilean pesos
Common director
Services 105 ‐ 42 ‐
96.657.210‐8 Transportes Fluviales Corral S.A. Chilean pesos
Indirect associate
Services 152 ‐ 176 ‐
81.148.200‐5 Ferrocarril de Antofagasta a Bolívia FCAB
Chilean pesos
Common director
Services 1 ‐ 6 ‐
99.567.620‐6 Terminal Puerto Arica S.A. Chilean pesos
Indirect associate
Dividend 249 ‐ 302 ‐
99.511.240‐K Antofagasta Terminal Internacional S.A.
Chilean pesos
Indirect associate
Dividend 158 ‐ 665 ‐
96.908.970‐K San Antonio Terminal Internacional S.A.
Chilean pesos
Indirect associate
Current account Dividend
5 1,295
‐ ‐
‐ 2,202
‐ ‐
76.028.651‐6 Lng Tugs Chile S.A. US dollar Indirect associate
Total Current account Dividend
118 115 3
‐ ‐ ‐
340 324 16
‐ ‐ ‐
76.140.270‐6 Inmobiliaria Carriel Ltda. Chilean pesos
Indirect associate
Services 60 ‐ 13 ‐
96.954.550‐0 Sur Andino S.A. Chilean pesos
Common shareholders
Services ‐ ‐ 52 ‐
87.941.700‐7 Viña Carmen S.A. Chilean pesos
Common shareholders
Services 47 ‐ 55 ‐
90.331.000‐6 Cristalerías Chile S.A. Chilean pesos
Common director
Services 212 ‐ 225 ‐
96.981.310‐6 Compañía Cervecera Kunstmann S.A. Chilean pesos
Common shareholders
Services ‐ ‐ 2 ‐
90.320.000‐6 Compañía Electrometalúrgica S.A. Chilean pesos
Common director
Services ‐ ‐ 1 ‐
153
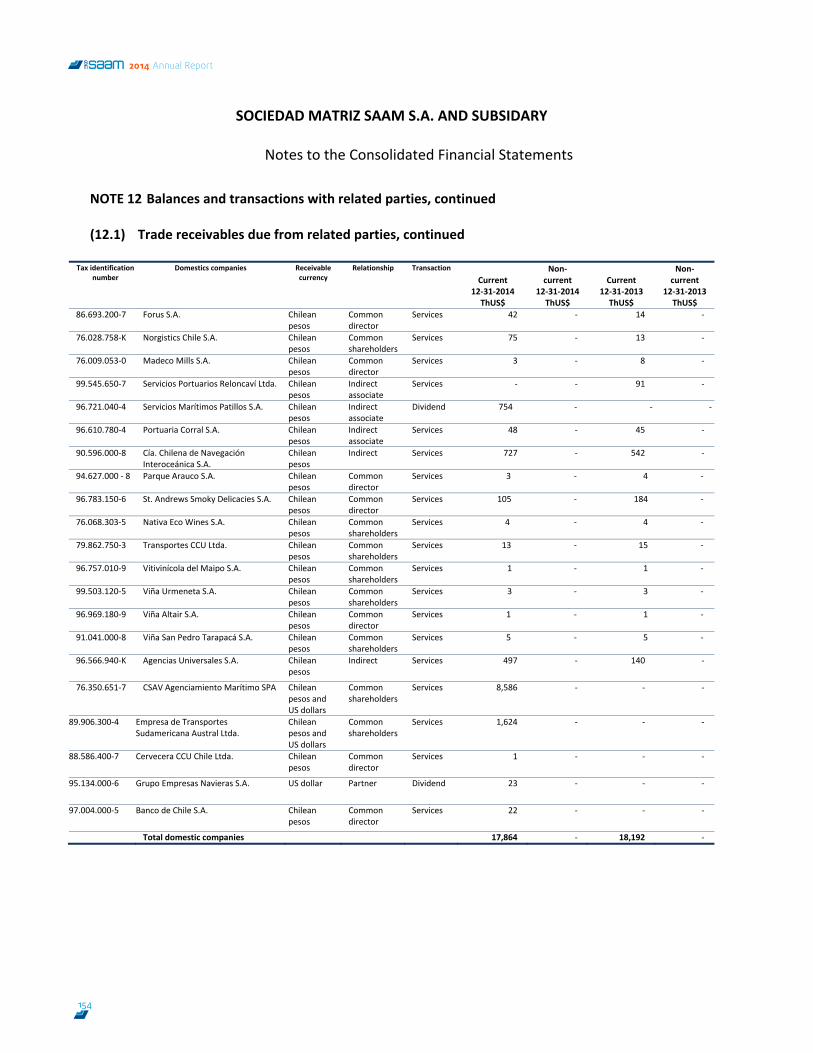
SOCIEDAD MATRIZ SAAM S.A. AND SUBSIDARY
Notes to the Consolidated Financial Statements
63
NOTE 12 Balances and transactions with related parties, continued (12.1) Trade receivables due from related parties, continued
Tax identification number
Domestics companies Receivable currency
Relationship Transaction Current
12‐31‐2014 ThUS$
Non‐current
12‐31‐2014 ThUS$
Current
12‐31‐2013 ThUS$
Non‐current
12‐31‐2013 ThUS$
86.693.200‐7 Forus S.A. Chilean pesos
Common director
Services 42 ‐ 14 ‐
76.028.758‐K Norgistics Chile S.A. Chilean pesos
Common shareholders
Services 75 ‐ 13 ‐
76.009.053‐0 Madeco Mills S.A. Chilean pesos
Common director
Services 3 ‐ 8 ‐
99.545.650‐7 Servicios Portuarios Reloncaví Ltda. Chilean pesos
Indirect associate
Services ‐ ‐ 91 ‐
96.721.040‐4 Servicios Marítimos Patillos S.A. Chilean pesos
Indirect associate
Dividend 754 ‐ ‐ ‐
96.610.780‐4 Portuaria Corral S.A. Chilean pesos
Indirect associate
Services 48 ‐ 45 ‐
90.596.000‐8 Cía. Chilena de Navegación Interoceánica S.A.
Chilean pesos
Indirect Services 727 ‐ 542 ‐
94.627.000 ‐ 8 Parque Arauco S.A. Chilean pesos
Common director
Services 3 ‐ 4 ‐
96.783.150‐6 St. Andrews Smoky Delicacies S.A. Chilean pesos
Common director
Services 105 ‐ 184 ‐
76.068.303‐5 Nativa Eco Wines S.A. Chilean pesos
Common shareholders
Services 4 ‐ 4 ‐
79.862.750‐3 Transportes CCU Ltda. Chilean pesos
Common shareholders
Services 13 ‐ 15 ‐
96.757.010‐9 Vitivinícola del Maipo S.A. Chilean pesos
Common shareholders
Services 1 ‐ 1 ‐
99.503.120‐5 Viña Urmeneta S.A. Chilean pesos
Common shareholders
Services 3 ‐ 3 ‐
96.969.180‐9 Viña Altair S.A. Chilean pesos
Common director
Services 1 ‐ 1 ‐
91.041.000‐8 Viña San Pedro Tarapacá S.A. Chilean pesos
Common shareholders
Services 5 ‐ 5 ‐
96.566.940‐K Agencias Universales S.A. Chilean pesos
Indirect Services 497 ‐ 140 ‐
76.350.651‐7 CSAV Agenciamiento Marítimo SPA Chilean pesos and US dollars
Common shareholders
Services 8,586 ‐ ‐ ‐
89.906.300‐4 Empresa de Transportes Sudamericana Austral Ltda.
Chilean pesos and US dollars
Common shareholders
Services 1,624 ‐ ‐ ‐
88.586.400‐7 Cervecera CCU Chile Ltda. Chilean pesos
Common director
Services 1 ‐ ‐ ‐
95.134.000‐6 Grupo Empresas Navieras S.A. US dollar Partner Dividend 23 ‐ ‐ ‐
97.004.000‐5 Banco de Chile S.A. Chilean pesos
Common director
Services 22 ‐ ‐ ‐
Total domestic companies 17,864 ‐ 18,192 ‐
154
2014 Annual Report
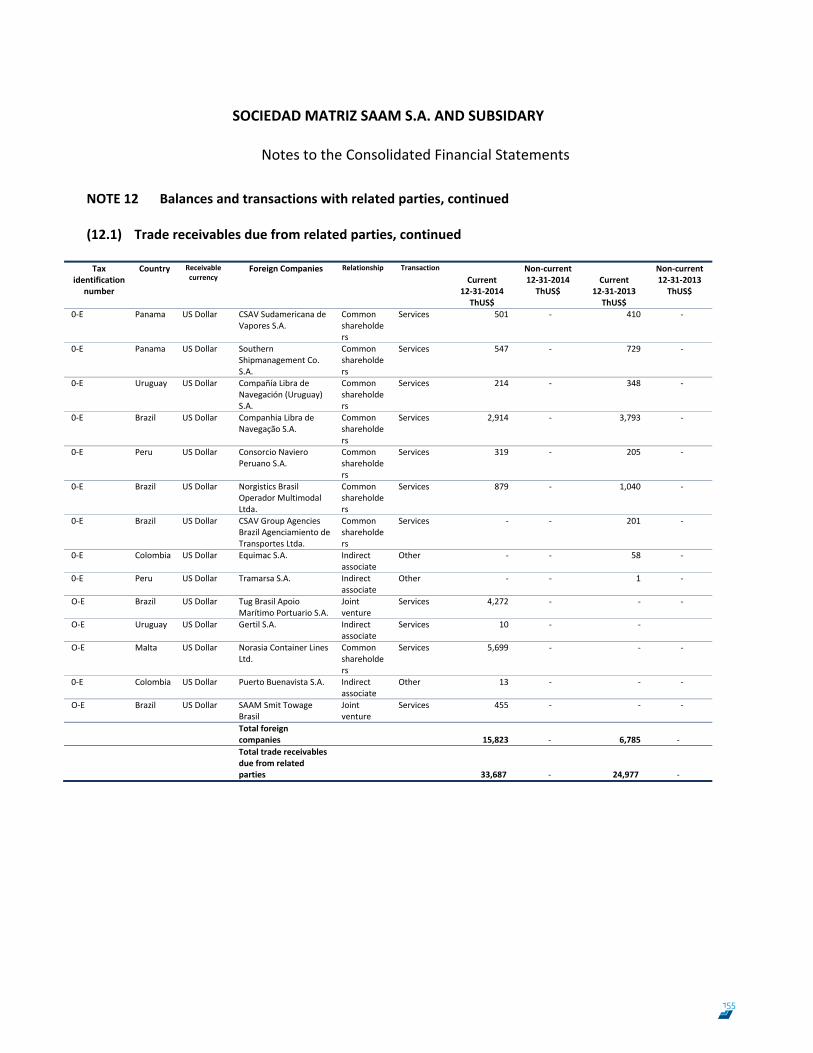
SOCIEDAD MATRIZ SAAM S.A. AND SUBSIDARY
Notes to the Consolidated Financial Statements
64
NOTE 12 Balances and transactions with related parties, continued (12.1) Trade receivables due from related parties, continued
Tax identification
number
Country Receivable currency
Foreign Companies Relationship Transaction Current
12‐31‐2014 ThUS$
Non‐current 12‐31‐2014 ThUS$
Current
12‐31‐2013 ThUS$
Non‐current 12‐31‐2013 ThUS$
0‐E Panama US Dollar CSAV Sudamericana de Vapores S.A.
Common shareholders
Services 501 ‐ 410 ‐
0‐E Panama US Dollar Southern Shipmanagement Co. S.A.
Common shareholders
Services 547 ‐ 729 ‐
0‐E Uruguay US Dollar Compañía Libra de Navegación (Uruguay) S.A.
Common shareholders
Services 214 ‐ 348 ‐
0‐E Brazil US Dollar Companhia Libra de Navegação S.A.
Common shareholders
Services 2,914 ‐ 3,793 ‐
0‐E Peru US Dollar Consorcio Naviero Peruano S.A.
Common shareholders
Services 319 ‐ 205 ‐
0‐E Brazil US Dollar Norgistics Brasil Operador Multimodal Ltda.
Common shareholders
Services 879 ‐ 1,040 ‐
0‐E Brazil US Dollar CSAV Group Agencies Brazil Agenciamiento de Transportes Ltda.
Common shareholders
Services ‐ ‐ 201 ‐
0‐E Colombia US Dollar Equimac S.A. Indirect associate
Other ‐ ‐ 58 ‐
0‐E Peru US Dollar Tramarsa S.A. Indirect associate
Other ‐ ‐ 1 ‐
O‐E Brazil US Dollar Tug Brasil Apoio Marítimo Portuario S.A.
Joint venture
Services 4,272 ‐ ‐ ‐
O‐E Uruguay US Dollar Gertil S.A. Indirect associate
Services 10 ‐ ‐
O‐E Malta US Dollar Norasia Container Lines Ltd.
Common shareholders
Services 5,699 ‐ ‐ ‐
0‐E Colombia US Dollar Puerto Buenavista S.A. Indirect associate
Other 13 ‐ ‐ ‐
O‐E Brazil US Dollar SAAM Smit Towage Brasil
Joint venture
Services 455 ‐ ‐ ‐
Total foreign companies
15,823 ‐ 6,785 ‐
Total trade receivables due from related parties
33,687 ‐ 24,977 ‐
155
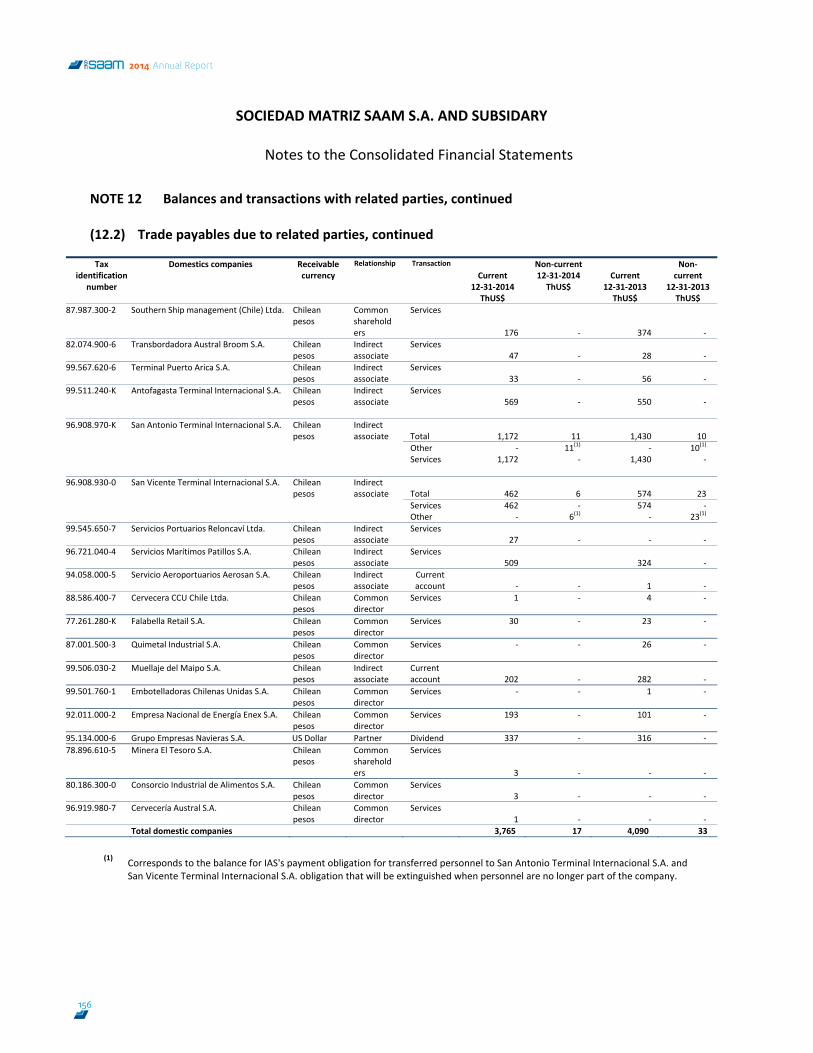
SOCIEDAD MATRIZ SAAM S.A. AND SUBSIDARY
Notes to the Consolidated Financial Statements
65
NOTE 12 Balances and transactions with related parties, continued (12.2) Trade payables due to related parties, continued
(1) Corresponds to the balance for IAS's payment obligation for transferred personnel to San Antonio Terminal Internacional S.A. and
San Vicente Terminal Internacional S.A. obligation that will be extinguished when personnel are no longer part of the company.
Tax identification
number
Domestics companies Receivable currency
Relationship Transaction Current
12‐31‐2014 ThUS$
Non‐current 12‐31‐2014 ThUS$
Current
12‐31‐2013 ThUS$
Non‐current
12‐31‐2013 ThUS$
87.987.300‐2 Southern Ship management (Chile) Ltda. Chilean pesos
Common shareholders
Services
176 ‐ 374 ‐ 82.074.900‐6 Transbordadora Austral Broom S.A. Chilean
pesos Indirect associate
Services47 ‐ 28 ‐
99.567.620‐6 Terminal Puerto Arica S.A. Chilean pesos
Indirect associate
Services33 ‐ 56 ‐
99.511.240‐K Antofagasta Terminal Internacional S.A. Chilean pesos
Indirect associate
Services569 ‐ 550 ‐
96.908.970‐K San Antonio Terminal Internacional S.A. Chilean
pesos Indirect associate Total 1,172 11 1,430 10
Other ‐ 11(1) ‐ 10(1)
Services 1,172 ‐ 1,430 ‐ 96.908.930‐0 San Vicente Terminal Internacional S.A. Chilean
pesos Indirect associate Total 462 6 574 23
Services 462 ‐ 574 ‐ Other ‐ 6(1) ‐ 23(1)
99.545.650‐7 Servicios Portuarios Reloncaví Ltda. Chilean pesos
Indirect associate
Services27 ‐ ‐ ‐
96.721.040‐4 Servicios Marítimos Patillos S.A. Chilean pesos
Indirect associate
Services509 324 ‐
94.058.000‐5 Servicio Aeroportuarios Aerosan S.A. Chilean pesos
Indirect associate
Current account ‐ ‐ 1 ‐
88.586.400‐7 Cervecera CCU Chile Ltda. Chilean pesos
Common director
Services 1 ‐ 4 ‐
77.261.280‐K Falabella Retail S.A. Chilean pesos
Common director
Services 30 ‐ 23 ‐
87.001.500‐3 Quimetal Industrial S.A. Chilean pesos
Common director
Services ‐ ‐ 26 ‐
99.506.030‐2 Muellaje del Maipo S.A. Chilean pesos
Indirect associate
Current account 202 ‐ 282 ‐
99.501.760‐1 Embotelladoras Chilenas Unidas S.A. Chilean pesos
Common director
Services ‐ ‐ 1 ‐
92.011.000‐2 Empresa Nacional de Energía Enex S.A. Chilean pesos
Common director
Services 193 ‐ 101 ‐
95.134.000‐6 Grupo Empresas Navieras S.A. US Dollar Partner Dividend 337 ‐ 316 ‐ 78.896.610‐5 Minera El Tesoro S.A. Chilean
pesos Common shareholders
Services
3 ‐ ‐ ‐ 80.186.300‐0 Consorcio Industrial de Alimentos S.A. Chilean
pesos Common director
Services3 ‐ ‐ ‐
96.919.980‐7 Cervecería Austral S.A. Chilean pesos
Common director
Services1 ‐ ‐ ‐
Total domestic companies 3,765 17 4,090 33
156
2014 Annual Report
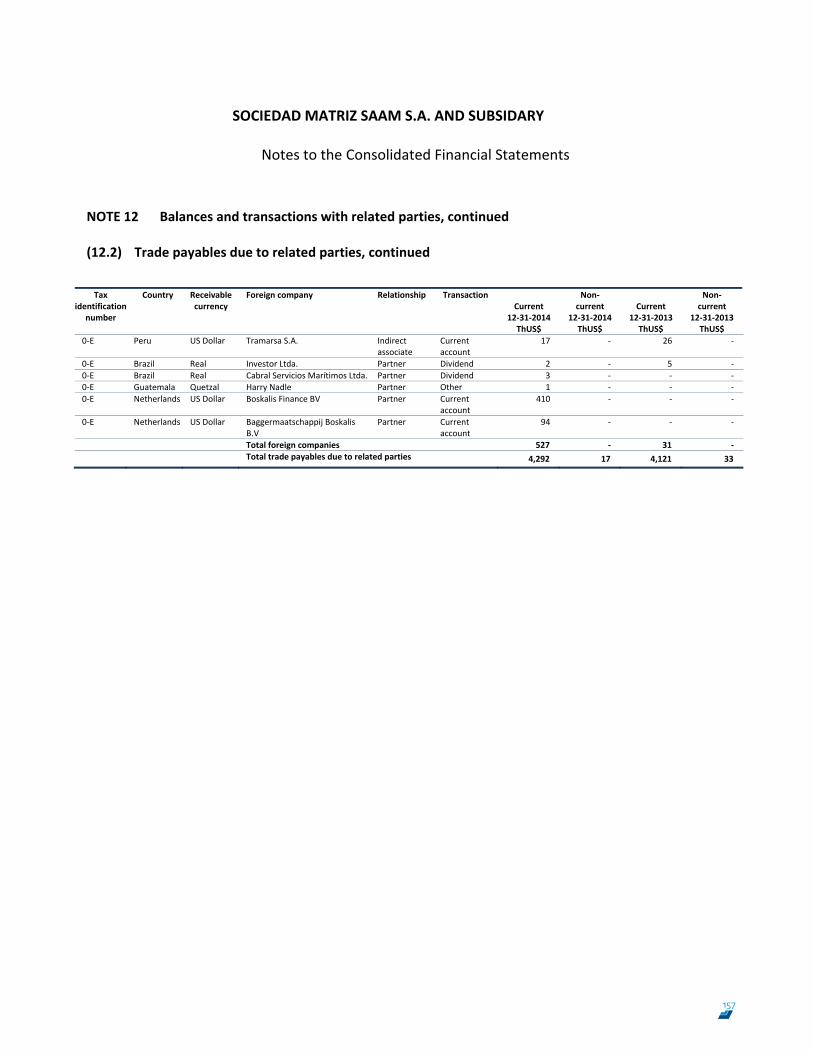
SOCIEDAD MATRIZ SAAM S.A. AND SUBSIDARY
Notes to the Consolidated Financial Statements
66
NOTE 12 Balances and transactions with related parties, continued (12.2) Trade payables due to related parties, continued
Tax identification
number
Country Receivable currency
Foreign company Relationship Transaction Current
12‐31‐2014 ThUS$
Non‐current
12‐31‐2014 ThUS$
Current
12‐31‐2013 ThUS$
Non‐current
12‐31‐2013 ThUS$
0‐E Peru US Dollar Tramarsa S.A. Indirect associate
Current account
17 ‐ 26 ‐
0‐E Brazil Real Investor Ltda. Partner Dividend 2 ‐ 5 ‐ 0‐E Brazil Real Cabral Servicios Marítimos Ltda. Partner Dividend 3 ‐ ‐ ‐ 0‐E Guatemala Quetzal Harry Nadle Partner Other 1 ‐ ‐ ‐ 0‐E Netherlands US Dollar Boskalis Finance BV Partner Current
account 410 ‐ ‐ ‐
0‐E Netherlands US Dollar Baggermaatschappij Boskalis B.V
Partner Current account
94 ‐ ‐ ‐
Total foreign companies 527 ‐ 31 ‐ Total trade payables due to related parties 4,292 17 4,121 33
157
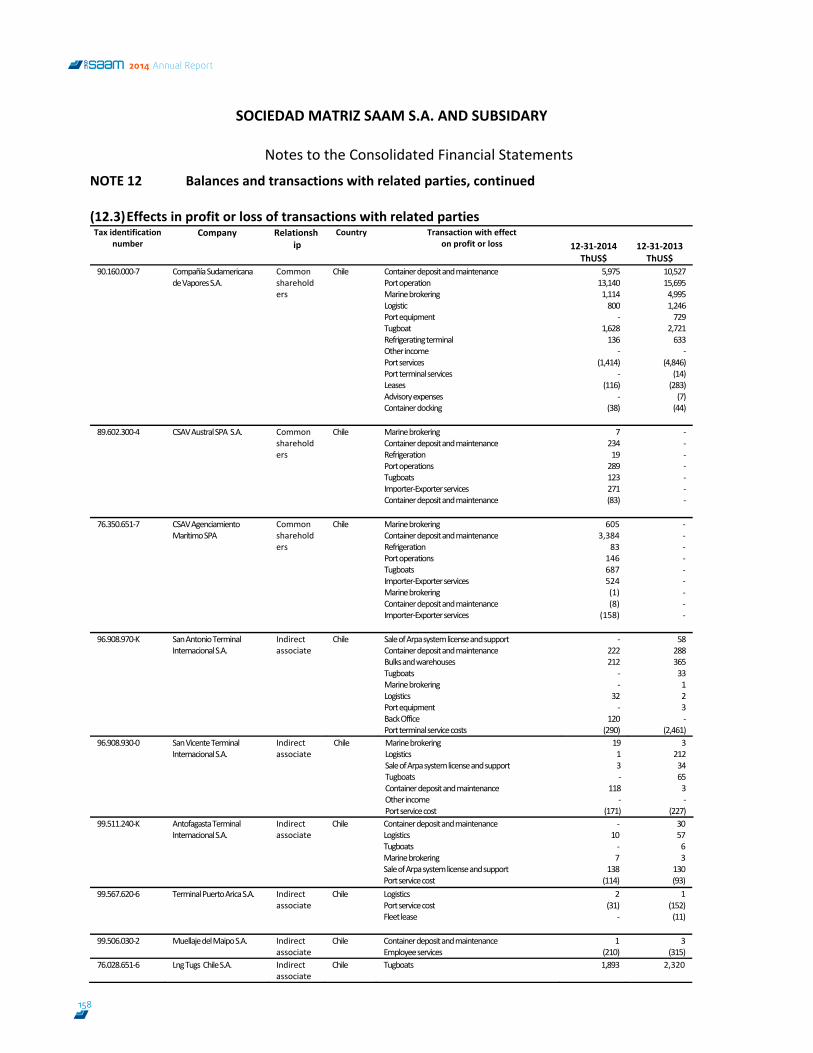
SOCIEDAD MATRIZ SAAM S.A. AND SUBSIDARY
Notes to the Consolidated Financial Statements
67
NOTE 12 Balances and transactions with related parties, continued (12.3) Effects in profit or loss of transactions with related parties Tax identification
number Company Relationsh
ip Country Transaction with effect
on profit or loss
12‐31‐2014 ThUS$
12‐31‐2013ThUS$
90.160.000‐7
Compañía Sudamericana de Vapores S.A.
Common shareholders
Chile Container deposit and maintenance Port operation Marine brokering Logistic Port equipment Tugboat Refrigerating terminal Other income Port services Port terminal services Leases Advisory expenses Container docking
5,975 13,140 1,114 800
‐ 1,628 136
‐ (1,414)
‐ (116)
‐ (38)
10,527 15,695 4,995 1,246 729
2,721 633
‐ (4,846)
(14) (283) (7) (44)
89.602.300‐4 CSAV Austral SPA S.A. Common shareholders
Chile Marine brokering Container deposit and maintenance Refrigeration Port operations Tugboats Importer‐Exporter services Container deposit and maintenance
7 234 19 289 123 271 (83)
‐ ‐ ‐ ‐ ‐ ‐ ‐
76.350.651‐7 CSAV Agenciamiento Marítimo SPA
Common shareholders
Chile Marine brokering Container deposit and maintenance Refrigeration Port operations Tugboats Importer‐Exporter services Marine brokering Container deposit and maintenance Importer‐Exporter services
605 3,384
83 146 687 524 (1) (8)
(158)
‐ ‐ ‐ ‐ ‐ ‐ ‐ ‐ ‐
96.908.970‐K San Antonio Terminal Internacional S.A.
Indirect associate
Chile Sale of Arpa system license and support Container deposit and maintenance Bulks and warehouses Tugboats Marine brokering Logistics Port equipment Back Office Port terminal service costs
‐ 222 212
‐ ‐
32 ‐
120 (290)
58 288 365 33 1 2 3 ‐
(2,461) 96.908.930‐0
San Vicente Terminal Internacional S.A.
Indirect associate
Chile Marine brokering Logistics Sale of Arpa system license and support Tugboats Container deposit and maintenance Other income Port service cost
19 1 3 ‐
118 ‐
(171)
3 212 34 65 3 ‐
(227) 99.511.240‐K
Antofagasta Terminal Internacional S.A.
Indirect associate
Chile Container deposit and maintenance Logistics Tugboats Marine brokering Sale of Arpa system license and support Port service cost
‐ 10 ‐ 7
138 (114)
30 57 6 3
130 (93)
99.567.620‐6 Terminal Puerto Arica S.A. Indirect associate
Chile Logistics Port service cost Fleet lease
2 (31)
‐
1 (152) (11)
99.506.030‐2
Muellaje del Maipo S.A. Indirect associate
Chile Container deposit and maintenance Employee services
1 (210)
3 (315)
76.028.651‐6 Lng Tugs Chile S.A. Indirect associate
Chile Tugboats 1,893 2,320
158
2014 Annual Report
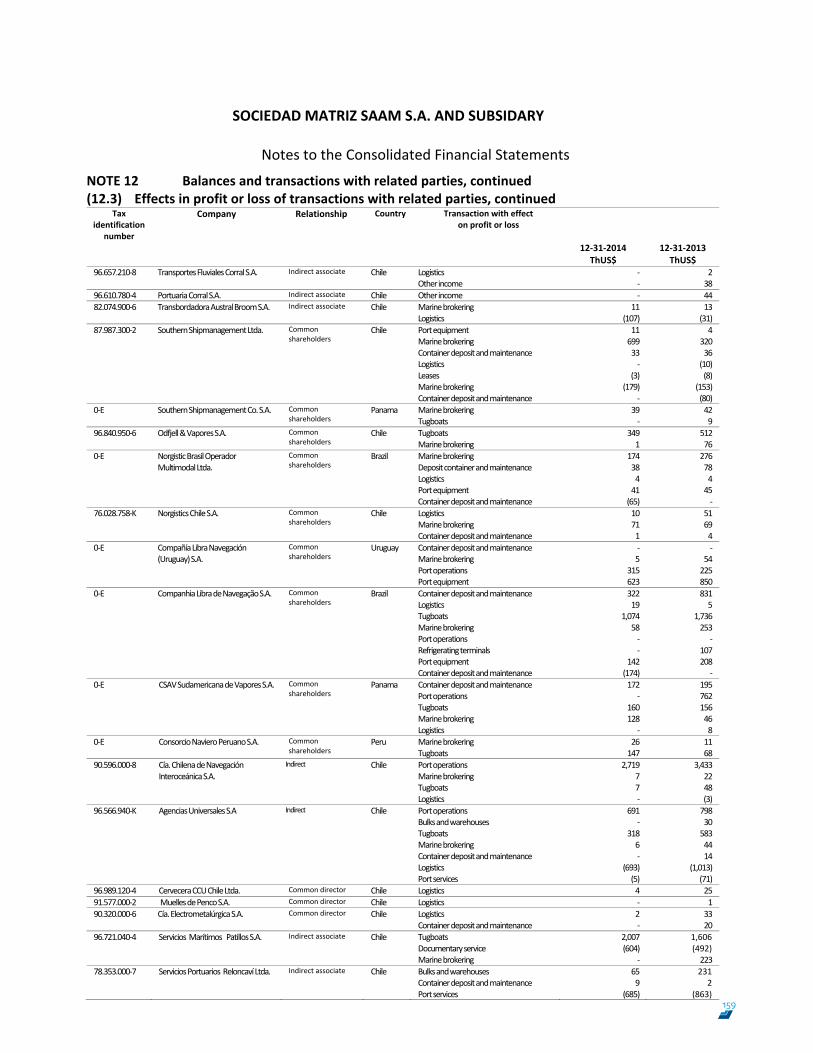
SOCIEDAD MATRIZ SAAM S.A. AND SUBSIDARY
Notes to the Consolidated Financial Statements
68
NOTE 12 Balances and transactions with related parties, continued (12.3) Effects in profit or loss of transactions with related parties, continued
Tax identification
number
Company Relationship Country Transaction with effect on profit or loss
12‐31‐2014 ThUS$
12‐31‐2013ThUS$
96.657.210‐8 Transportes Fluviales Corral S.A. Indirect associate Chile Logistics Other income
‐ ‐
2 38
96.610.780‐4 Portuaria Corral S.A. Indirect associate Chile Other income ‐ 44 82.074.900‐6 Transbordadora Austral Broom S.A. Indirect associate Chile Marine brokering
Logistics 11
(107) 13 (31)
87.987.300‐2 Southern Shipmanagement Ltda. Common shareholders
Chile Port equipment Marine brokering Container deposit and maintenance Logistics Leases Marine brokering Container deposit and maintenance
11 699 33 ‐
(3) (179)
‐
4 320 36 (10) (8)
(153) (80)
0‐E Southern Shipmanagement Co. S.A. Common shareholders
Panama Marine brokering Tugboats
39 ‐
42 9
96.840.950‐6 Odfjell & Vapores S.A.
Common shareholders
Chile Tugboats Marine brokering
349 1
512 76
0‐E Norgistic Brasil Operador Multimodal Ltda.
Common shareholders
Brazil Marine brokering Deposit container and maintenance Logistics Port equipment Container deposit and maintenance
174 174 38 4 41 (65)
276 78 4 45 ‐
76.028.758‐K Norgistics Chile S.A. Common shareholders
Chile Logistics Marine brokering Container deposit and maintenance
10 71 1
51 69 4
0‐E Compañía Libra Navegación (Uruguay) S.A.
Common shareholders
Uruguay Container deposit and maintenance Marine brokering Port operations Port equipment
‐ 5
315 623
‐ 54 225 850
0‐E Companhia Libra de Navegação S.A. Common shareholders
Brazil Container deposit and maintenance Logistics Tugboats Marine brokering Port operations Refrigerating terminals Port equipment Container deposit and maintenance
322 19
1,074 58 ‐ ‐
142 (174)
831 5
1,736 253
‐ 107 208
‐ 0‐E CSAV Sudamericana de Vapores S.A. Common
shareholders Panama Container deposit and maintenance
Port operations Tugboats Marine brokering Logistics
172 ‐
160 128
‐
195 762 156 46 8
0‐E Consorcio Naviero Peruano S.A.
Common shareholders
Peru Marine brokering Tugboats
26 147
11 68
90.596.000‐8 Cía. Chilena de Navegación Interoceánica S.A.
Indirect Chile Port operations Marine brokering Tugboats Logistics
2,719 7 7 ‐
3,433 22 48 (3)
96.566.940‐K Agencias Universales S.A Indirect Chile Port operations Bulks and warehouses Tugboats Marine brokering Container deposit and maintenance Logistics Port services
691 ‐
318 6 ‐
(693) (5)
798 30 583 44 14
(1,013) (71)
96.989.120‐4 Cervecera CCU Chile Ltda. Common director Chile Logistics 4 25 91.577.000‐2 Muelles de Penco S.A. Common director Chile Logistics ‐ 1 90.320.000‐6 Cía. Electrometalúrgica S.A. Common director Chile Logistics
Container deposit and maintenance 2 ‐
33 20
96.721.040‐4 Servicios Marítimos Patillos S.A. Indirect associate Chile Tugboats Documentary service Marine brokering
2,007 (604)
‐
1,606 (492) 223
78.353.000‐7 Servicios Portuarios Reloncaví Ltda. Indirect associate Chile Bulks and warehouses Container deposit and maintenance Port services
65 9
(685)
231 2
(863) 159
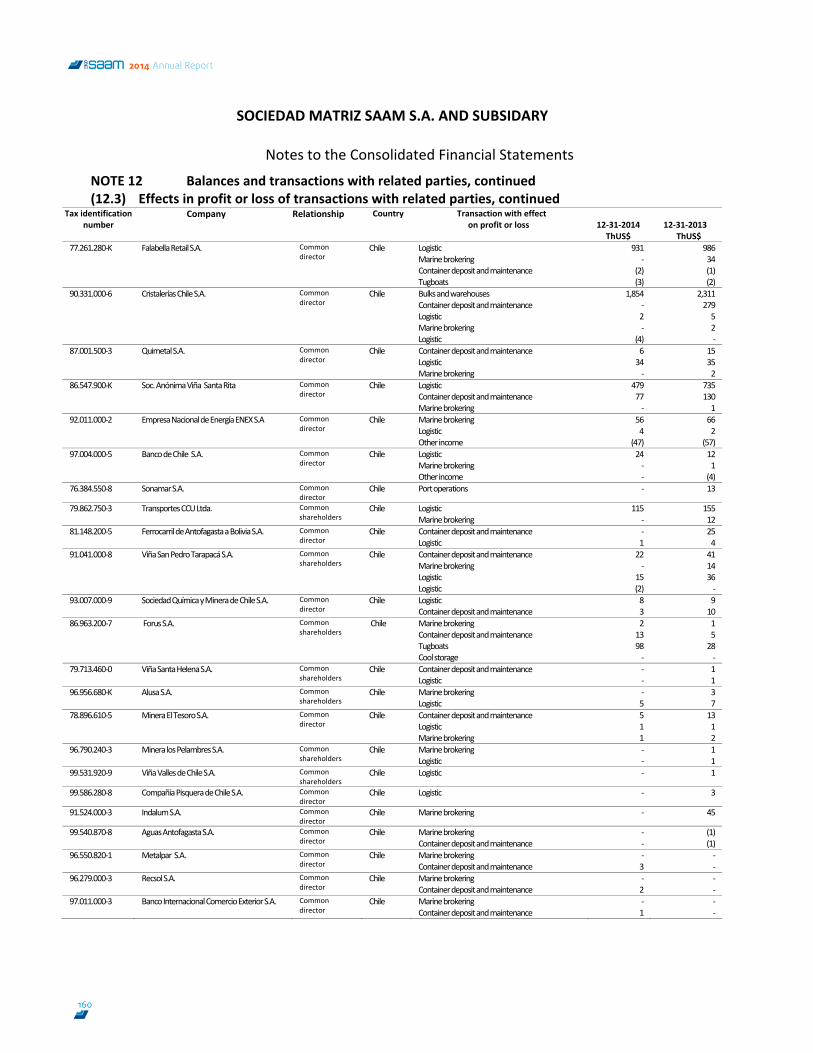
SOCIEDAD MATRIZ SAAM S.A. AND SUBSIDARY
Notes to the Consolidated Financial Statements
69
NOTE 12 Balances and transactions with related parties, continued (12.3) Effects in profit or loss of transactions with related parties, continued
Tax identification number
Company Relationship Country Transaction with effect on profit or loss
12‐31‐2014 ThUS$
12‐31‐2013 ThUS$
77.261.280‐K Falabella Retail S.A. Common director
Chile Logistic Marine brokering Container deposit and maintenance Tugboats
931 ‐
(2) (3)
986 34 (1) (2)
90.331.000‐6
Cristalerías Chile S.A.
Common director
Chile Bulks and warehouses Container deposit and maintenance Logistic Marine brokering Logistic
1,854 ‐ 2 ‐
(4)
2,311 279 5 2 ‐
87.001.500‐3
Quimetal S.A.
Common director
Chile Container deposit and maintenance Logistic Marine brokering
6 34 ‐
15 35 2
86.547.900‐K
Soc. Anónima Viña Santa Rita Common director
Chile Logistic Container deposit and maintenance Marine brokering
479 77 ‐
735 130 1
92.011.000‐2 Empresa Nacional de Energía ENEX S.A Common director
Chile Marine brokering Logistic Other income
56 4
(47)
66 2
(57) 97.004.000‐5 Banco de Chile S.A. Common
director Chile Logistic
Marine brokering Other income
24 ‐ ‐
12 1 (4)
76.384.550‐8 Sonamar S.A. Common director
Chile Port operations ‐ 13
79.862.750‐3 Transportes CCU Ltda. Common shareholders
Chile Logistic Marine brokering
115 ‐
155 12
81.148.200‐5 Ferrocarril de Antofagasta a Bolivia S.A. Common director
Chile Container deposit and maintenance Logistic
‐ 1
25 4
91.041.000‐8 Viña San Pedro Tarapacá S.A. Common shareholders
Chile Container deposit and maintenance Marine brokering Logistic Logistic
22 ‐
15 (2)
41 14 36 ‐
93.007.000‐9 Sociedad Química y Minera de Chile S.A. Common director
Chile Logistic Container deposit and maintenance
8 3
9 10
86.963.200‐7 Forus S.A. Common shareholders
Chile Marine brokering Container deposit and maintenance Tugboats Cool storage
2 13 98 ‐
1 5 28 ‐
79.713.460‐0 Viña Santa Helena S.A. Common shareholders
Chile Container deposit and maintenance Logistic
‐ ‐
1 1
96.956.680‐K Alusa S.A. Common shareholders
Chile Marine brokering Logistic
‐ 5
3 7
78.896.610‐5 Minera El Tesoro S.A. Common director
Chile Container deposit and maintenance Logistic Marine brokering
5 1 1
13 1 2
96.790.240‐3 Minera los Pelambres S.A. Common shareholders
Chile Marine brokering Logistic
‐ ‐
1 1
99.531.920‐9 Viña Valles de Chile S.A. Common shareholders
Chile Logistic ‐ 1
99.586.280‐8 Compañía Pisquera de Chile S.A. Common director
Chile Logistic ‐ 3
91.524.000‐3 Indalum S.A. Common director
Chile Marine brokering ‐ 45
99.540.870‐8 Aguas Antofagasta S.A. Common director
Chile Marine brokering Container deposit and maintenance
‐ ‐
(1) (1)
96.550.820‐1 Metalpar S.A. Common director
Chile Marine brokering Container deposit and maintenance
‐ 3
‐ ‐
96.279.000‐3 Recsol S.A. Common director
Chile Marine brokering Container deposit and maintenance
‐ 2
‐ ‐
97.011.000‐3 Banco Internacional Comercio Exterior S.A. Common director
Chile Marine brokering Container deposit and maintenance
‐ 1
‐ ‐
160
2014 Annual Report
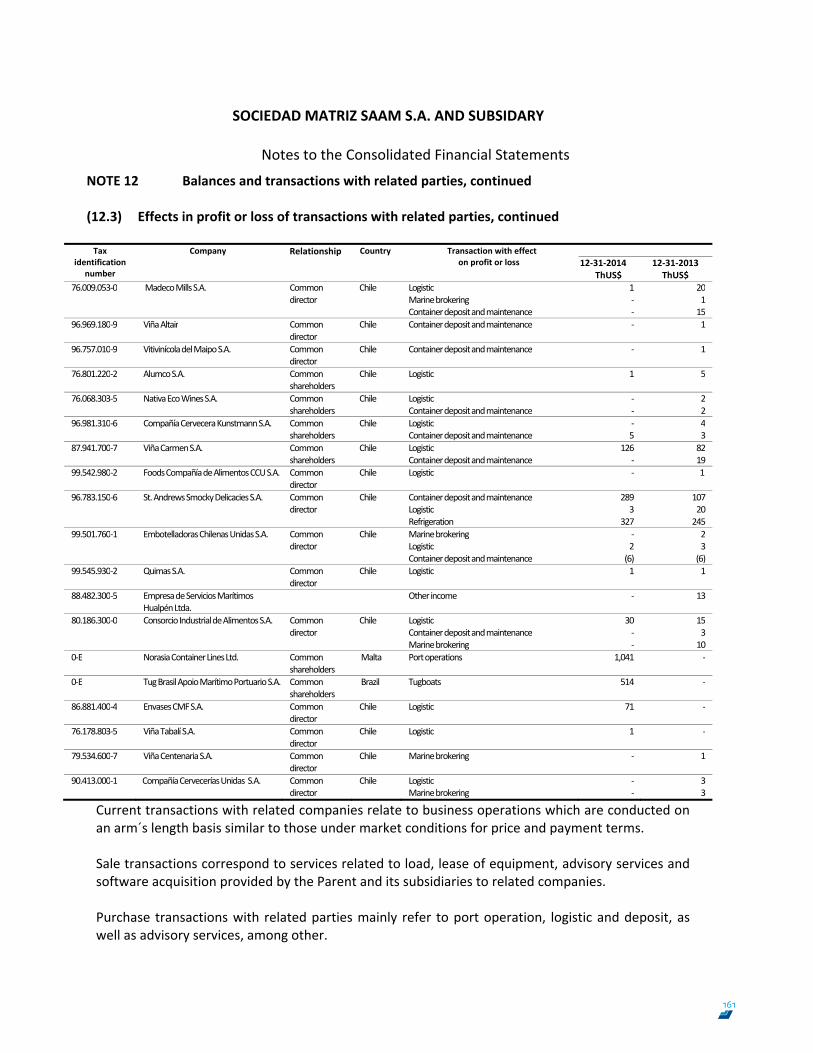
SOCIEDAD MATRIZ SAAM S.A. AND SUBSIDARY
Notes to the Consolidated Financial Statements
70
NOTE 12 Balances and transactions with related parties, continued (12.3) Effects in profit or loss of transactions with related parties, continued
Tax
identification number
Company Relationship Country Transaction with effect on profit or loss
12‐31‐2014
ThUS$ 12‐31‐2013ThUS$
76.009.053‐0 Madeco Mills S.A. Common director
Chile LogisticMarine brokering
1‐
201
Container deposit and maintenance ‐ 1596.969.180‐9 Viña Altair Common
director Chile Container deposit and maintenance ‐ 1
96.757.010‐9 Vitivinícola del Maipo S.A. Common director
Chile Container deposit and maintenance ‐ 1
76.801.220‐2 Alumco S.A. Common shareholders
Chile Logistic 1 5
76.068.303‐5 Nativa Eco Wines S.A. Common shareholders
Chile LogisticContainer deposit and maintenance
‐‐
22
96.981.310‐6 Compañía Cervecera Kunstmann S.A. Common shareholders
Chile LogisticContainer deposit and maintenance
‐5
43
87.941.700‐7 Viña Carmen S.A. Common shareholders
Chile LogisticContainer deposit and maintenance
126‐
8219
99.542.980‐2 Foods Compañía de Alimentos CCU S.A. Common director
Chile Logistic ‐ 1
96.783.150‐6 St. Andrews Smocky Delicacies S.A. Common director
Chile Container deposit and maintenanceLogistic Refrigeration
2893
327
10720 245
99.501.760‐1 Embotelladoras Chilenas Unidas S.A. Common director
Chile Marine brokeringLogistic Container deposit and maintenance
‐2 (6)
23 (6)
99.545.930‐2 Quimas S.A. Common director
Chile Logistic 1 1
88.482.300‐5 Empresa de Servicios Marítimos Hualpén Ltda.
Other income ‐ 13
80.186.300‐0 Consorcio Industrial de Alimentos S.A. Common director
Chile LogisticContainer deposit and maintenance Marine brokering
30‐ ‐
153 10
0‐E Norasia Container Lines Ltd. Common shareholders
Malta Port operations 1,041 ‐
0‐E Tug Brasil Apoio Marítimo Portuario S.A. Common shareholders
Brazil Tugboats 514 ‐
86.881.400‐4 Envases CMF S.A. Common director
Chile Logistic 71 ‐
76.178.803‐5
Viña Tabalí S.A. Common director
Chile Logistic 1 ‐
79.534.600‐7 Viña Centenaria S.A. Common director
Chile Marine brokering ‐ 1
90.413.000‐1 Compañía Cervecerías Unidas S.A. Common director
Chile LogisticMarine brokering
‐‐
33
Current transactions with related companies relate to business operations which are conducted on an arm´s length basis similar to those under market conditions for price and payment terms. Sale transactions correspond to services related to load, lease of equipment, advisory services and software acquisition provided by the Parent and its subsidiaries to related companies. Purchase transactions with related parties mainly refer to port operation, logistic and deposit, as well as advisory services, among other.
161
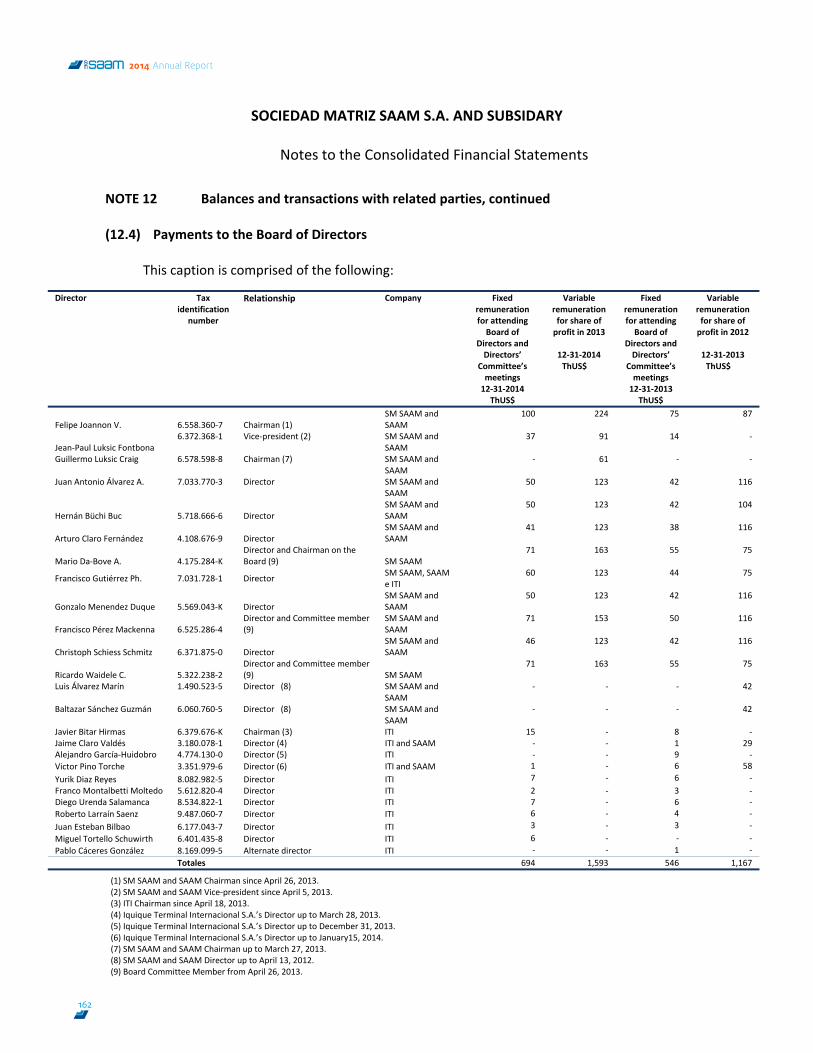
SOCIEDAD MATRIZ SAAM S.A. AND SUBSIDARY
Notes to the Consolidated Financial Statements
71
NOTE 12 Balances and transactions with related parties, continued (12.4) Payments to the Board of Directors
This caption is comprised of the following:
Director Tax
identification number
Relationship Company Fixed remuneration for attending Board of
Directors and Directors’
Committee’s meetings 12‐31‐2014 ThUS$
Variable remuneration for share of profit in 2013
12‐31‐2014 ThUS$
Fixed remuneration for attending Board of
Directors and Directors’
Committee’s meetings 12‐31‐2013 ThUS$
Variable remuneration for share of profit in 2012
12‐31‐2013 ThUS$
Felipe Joannon V. 6.558.360‐7 Chairman (1) SM SAAM and SAAM
100 224 75 87
Jean‐Paul Luksic Fontbona 6.372.368‐1 Vice‐president (2) SM SAAM and
SAAM 37 91 14 ‐
Guillermo Luksic Craig 6.578.598‐8 Chairman (7) SM SAAM and SAAM
‐ 61 ‐ ‐
Juan Antonio Álvarez A. 7.033.770‐3 Director SM SAAM and SAAM
50 123 42 116
Hernán Büchi Buc 5.718.666‐6 Director SM SAAM and SAAM
50 123 42 104
Arturo Claro Fernández 4.108.676‐9 Director SM SAAM and SAAM
41 123 38 116
Mario Da‐Bove A. 4.175.284‐K Director and Chairman on the Board (9) SM SAAM
71 163 55 75
Francisco Gutiérrez Ph. 7.031.728‐1 Director SM SAAM, SAAM e ITI
60 123 44 75
Gonzalo Menendez Duque 5.569.043‐K Director SM SAAM and SAAM
50 123 42 116
Francisco Pérez Mackenna 6.525.286‐4 Director and Committee member (9)
SM SAAM and SAAM
71 153 50 116
Christoph Schiess Schmitz 6.371.875‐0 Director SM SAAM and SAAM
46 123 42 116
Ricardo Waidele C. 5.322.238‐2 Director and Committee member (9) SM SAAM
71 163 55 75
Luis Álvarez Marín 1.490.523‐5 Director (8) SM SAAM and SAAM
‐ ‐ ‐ 42
Baltazar Sánchez Guzmán 6.060.760‐5 Director (8) SM SAAM and SAAM
‐ ‐ ‐ 42
Javier Bitar Hirmas 6.379.676‐K Chairman (3) ITI 15 ‐ 8 ‐Jaime Claro Valdés 3.180.078‐1 Director (4) ITI and SAAM ‐ ‐ 1 29Alejandro García‐Huidobro 4.774.130‐0 Director (5) ITI ‐ ‐ 9 ‐Victor Pino Torche 3.351.979‐6 Director (6) ITI and SAAM 1 ‐ 6 58Yurik Diaz Reyes 8.082.982‐5 Director ITI 7 ‐ 6 ‐Franco Montalbetti Moltedo 5.612.820‐4 Director ITI 2 ‐ 3 ‐ Diego Urenda Salamanca 8.534.822‐1 Director ITI 7 ‐ 6 ‐ Roberto Larraín Saenz 9.487.060‐7 Director ITI 6 ‐ 4 ‐ Juan Esteban Bilbao 6.177.043‐7 Director ITI 3 ‐ 3 ‐ Miguel Tortello Schuwirth 6.401.435‐8 Director ITI 6 ‐ ‐ ‐ Pablo Cáceres González 8.169.099‐5 Alternate director ITI ‐ ‐ 1 ‐ Totales 694 1,593 546 1,167 (1) SM SAAM and SAAM Chairman since April 26, 2013.
(2) SM SAAM and SAAM Vice‐president since April 5, 2013. (3) ITI Chairman since April 18, 2013.
(4) Iquique Terminal Internacional S.A.’s Director up to March 28, 2013. (5) Iquique Terminal Internacional S.A.’s Director up to December 31, 2013. (6) Iquique Terminal Internacional S.A.’s Director up to January15, 2014. (7) SM SAAM and SAAM Chairman up to March 27, 2013. (8) SM SAAM and SAAM Director up to April 13, 2012. (9) Board Committee Member from April 26, 2013.
162
2014 Annual Report
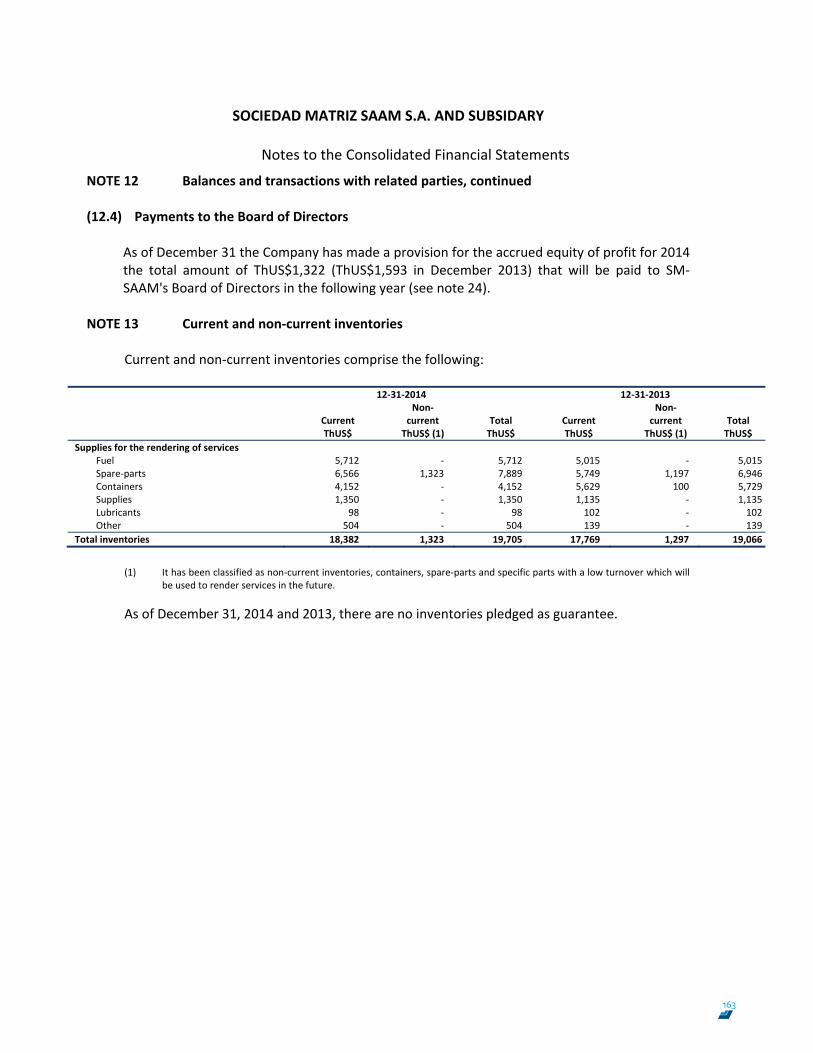
SOCIEDAD MATRIZ SAAM S.A. AND SUBSIDARY
Notes to the Consolidated Financial Statements
72
NOTE 12 Balances and transactions with related parties, continued (12.4) Payments to the Board of Directors
As of December 31 the Company has made a provision for the accrued equity of profit for 2014 the total amount of ThUS$1,322 (ThUS$1,593 in December 2013) that will be paid to SM‐SAAM's Board of Directors in the following year (see note 24).
NOTE 13 Current and non‐current inventories
Current and non‐current inventories comprise the following:
12‐31‐2014 12‐31‐2013
Current ThUS$
Non‐current ThUS$ (1)
Total ThUS$
Current ThUS$
Non‐current ThUS$ (1)
Total ThUS$
Supplies for the rendering of services Fuel 5,712 ‐ 5,712 5,015 ‐ 5,015Spare‐parts 6,566 1,323 7,889 5,749 1,197 6,946Containers 4,152 ‐ 4,152 5,629 100 5,729Supplies 1,350 ‐ 1,350 1,135 ‐ 1,135Lubricants 98 ‐ 98 102 ‐ 102Other 504 ‐ 504 139 ‐ 139
Total inventories 18,382 1,323 19,705 17,769 1,297 19,066
(1) It has been classified as non‐current inventories, containers, spare‐parts and specific parts with a low turnover which will
be used to render services in the future.
As of December 31, 2014 and 2013, there are no inventories pledged as guarantee.
163
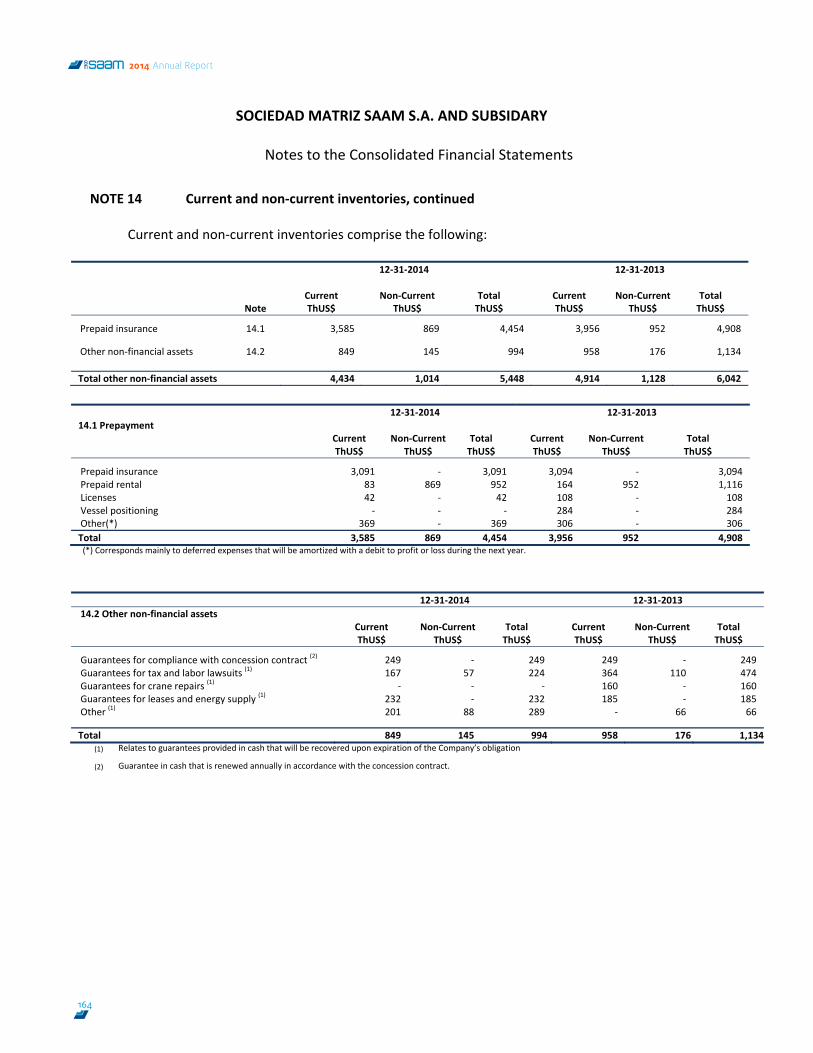
SOCIEDAD MATRIZ SAAM S.A. AND SUBSIDARY
Notes to the Consolidated Financial Statements
73
NOTE 14 Current and non‐current inventories, continued
Current and non‐current inventories comprise the following:
12‐31‐2014 12‐31‐2013
Note
Current ThUS$
Non‐Current ThUS$
Total ThUS$
Current ThUS$
Non‐CurrentThUS$
Total ThUS$
Prepaid insurance 14.1 3,585 869 4,454 3,956 952 4,908
Other non‐financial assets 14.2 849 145 994 958 176 1,134
Total other non‐financial assets 4,434 1,014 5,448 4,914 1,128 6,042
12‐31‐2014 12‐31‐2013
14.1 Prepayment Current ThUS$
Non‐CurrentThUS$
Total ThUS$
Current ThUS$
Non‐Current
ThUS$ Total ThUS$
Prepaid insurance 3,091 ‐ 3,091 3,094 ‐ 3,094Prepaid rental 83 869 952 164 952 1,116Licenses 42 ‐ 42 108 ‐ 108Vessel positioning ‐ ‐ ‐ 284 ‐ 284Other(*) 369 ‐ 369 306 ‐ 306Total 3,585 869 4,454 3,956 952 4,908 (*) Corresponds mainly to deferred expenses that will be amortized with a debit to profit or loss during the next year.
12‐31‐2014 12‐31‐201314.2 Other non‐financial assets
Current ThUS$
Non‐CurrentThUS$
Total ThUS$
Current ThUS$
Non‐CurrentThUS$
Total ThUS$
Guarantees for compliance with concession contract (2) 249 ‐ 249 249 ‐ 249Guarantees for tax and labor lawsuits (1) 167 57 224 364 110 474Guarantees for crane repairs (1) ‐ ‐ ‐ 160 ‐ 160Guarantees for leases and energy supply (1) 232 ‐ 232 185 ‐ 185Other (1) 201 88 289 ‐ 66 66 Total 849 145 994 958 176 1,134
(1) Relates to guarantees provided in cash that will be recovered upon expiration of the Company’s obligation
(2) Guarantee in cash that is renewed annually in accordance with the concession contract.
164
2014 Annual Report
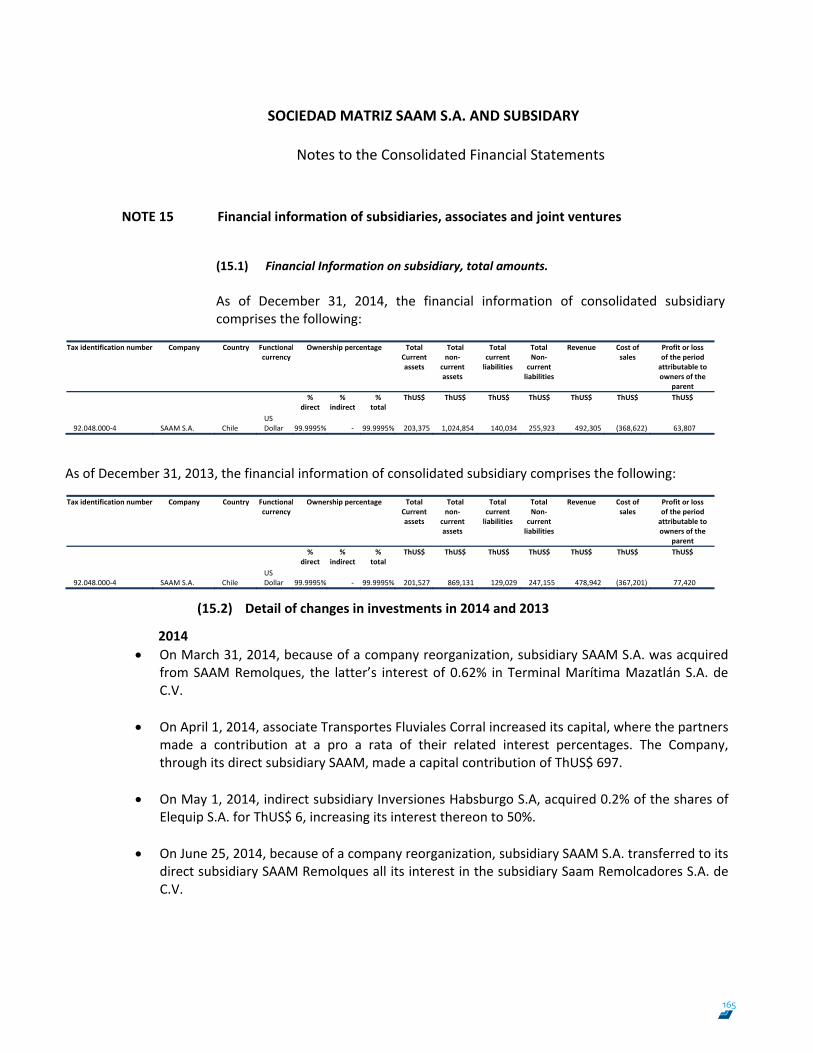
SOCIEDAD MATRIZ SAAM S.A. AND SUBSIDARY
Notes to the Consolidated Financial Statements
74
NOTE 15 Financial information of subsidiaries, associates and joint ventures
(15.1) Financial Information on subsidiary, total amounts.
As of December 31, 2014, the financial information of consolidated subsidiary comprises the following:
Tax identification number Company Country Functional
currency Ownership percentage Total
Current assets
Total non‐
current assets
Total current liabilities
Total Non‐
current liabilities
Revenue Cost of sales
Profit or loss of the period attributable to owners of the
parent %
direct %
indirect %
total ThUS$ ThUS$ ThUS$ ThUS$ ThUS$ ThUS$ ThUS$
92.048.000‐4 SAAM S.A. Chile US Dollar 99.9995% ‐ 99.9995% 203,375 1,024,854 140,034 255,923 492,305 (368,622) 63,807
As of December 31, 2013, the financial information of consolidated subsidiary comprises the following: Tax identification number Company Country Functional
currency Ownership percentage Total
Current assets
Total non‐
current assets
Total current liabilities
Total Non‐
current liabilities
Revenue Cost of sales
Profit or loss of the period attributable to owners of the
parent %
direct %
indirect %
total ThUS$ ThUS$ ThUS$ ThUS$ ThUS$ ThUS$ ThUS$
92.048.000‐4 SAAM S.A. Chile US Dollar 99.9995% ‐ 99.9995% 201,527 869,131 129,029 247,155 478,942 (367,201) 77,420
(15.2) Detail of changes in investments in 2014 and 2013
2014 On March 31, 2014, because of a company reorganization, subsidiary SAAM S.A. was acquired
from SAAM Remolques, the latter’s interest of 0.62% in Terminal Marítima Mazatlán S.A. de C.V.
On April 1, 2014, associate Transportes Fluviales Corral increased its capital, where the partners made a contribution at a pro a rata of their related interest percentages. The Company, through its direct subsidiary SAAM, made a capital contribution of ThUS$ 697.
On May 1, 2014, indirect subsidiary Inversiones Habsburgo S.A, acquired 0.2% of the shares of
Elequip S.A. for ThUS$ 6, increasing its interest thereon to 50%. On June 25, 2014, because of a company reorganization, subsidiary SAAM S.A. transferred to its
direct subsidiary SAAM Remolques all its interest in the subsidiary Saam Remolcadores S.A. de C.V.
165
SOCIEDAD MATRIZ SAAM S.A. AND SUBSIDARY
Notes to the Consolidated Financial Statements
75
NOTE 15 Financial information of subsidiaries, associates and joint ventures, continued
(15.2) Detail of changes in investments in 2014 and 2013, continued
On July 1, 2014, the association agreement entered into between SAAM and Boskalis was formalized resulting in the incorporation of a joint venture in Brazil and a business combination in Mexico. In Brazil, SAAM and Boskalis have contributed all their harbor and marine towage businesses and assets in such country in Rebras – Rebocadores Do Brasil S.A., which change its name to SAAM SMIT Towage Brasil, and in which the SAAM Group and Boskalis own a 50% interest each. In Mexico, Boskalis, through its subsidiary SMIT, contributed all its businesses and assets in Canada and Panama to SAAM Remolques S.A. de C.V., the Parent of the SAAM in Mexico harbor and marine towage business. It will change its name to SAAM SMIT Towage Mexico, and after this association SAAM will maintain 51% of share capital and Boskalis the remaining 49%. The Company has registered the acquisition with the information available to‐date, having determined the allocation of fair values and goodwill and is currently evaluating whether additional information exists with respect to events or circumstances existing at the date of acquisition which may result in a change in the identification and valuation of assets and liabilities. This process will be completed during the valuation period which will not exceed a term of one year from the date of acquisition in accordance with that allowed by IFRS 3.
166
2014 Annual Report
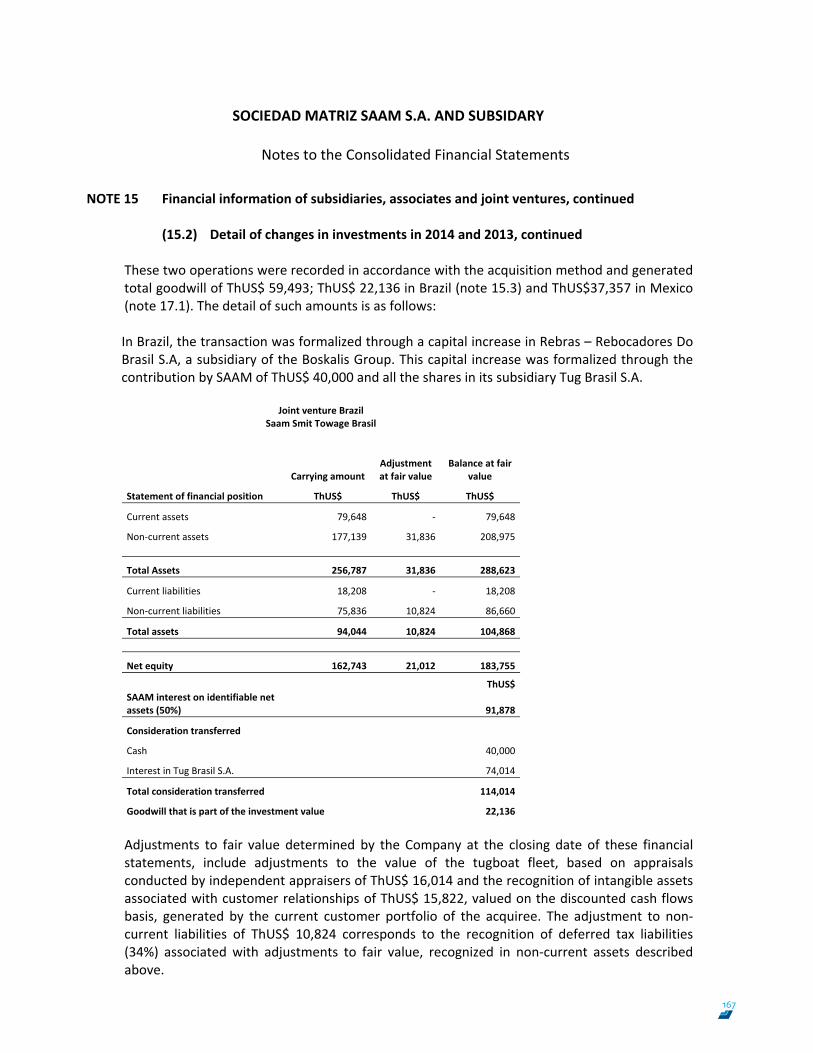
SOCIEDAD MATRIZ SAAM S.A. AND SUBSIDARY
Notes to the Consolidated Financial Statements
76
NOTE 15 Financial information of subsidiaries, associates and joint ventures, continued
(15.2) Detail of changes in investments in 2014 and 2013, continued
These two operations were recorded in accordance with the acquisition method and generated total goodwill of ThUS$ 59,493; ThUS$ 22,136 in Brazil (note 15.3) and ThUS$37,357 in Mexico (note 17.1). The detail of such amounts is as follows: In Brazil, the transaction was formalized through a capital increase in Rebras – Rebocadores Do Brasil S.A, a subsidiary of the Boskalis Group. This capital increase was formalized through the contribution by SAAM of ThUS$ 40,000 and all the shares in its subsidiary Tug Brasil S.A.
Joint venture BrazilSaam Smit Towage Brasil
Carrying amount Adjustment at fair value
Balance at fair value
Statement of financial position ThUS$ ThUS$ ThUS$
Current assets 79,648 ‐ 79,648
Non‐current assets 177,139 31,836 208,975
Total Assets 256,787 31,836 288,623
Current liabilities 18,208 ‐ 18,208
Non‐current liabilities 75,836 10,824 86,660
Total assets 94,044 10,824 104,868
Net equity 162,743 21,012 183,755
ThUS$SAAM interest on identifiable net assets (50%) 91,878
Consideration transferred
Cash 40,000
Interest in Tug Brasil S.A. 74,014
Total consideration transferred 114,014
Goodwill that is part of the investment value 22,136 Adjustments to fair value determined by the Company at the closing date of these financial statements, include adjustments to the value of the tugboat fleet, based on appraisals conducted by independent appraisers of ThUS$ 16,014 and the recognition of intangible assets associated with customer relationships of ThUS$ 15,822, valued on the discounted cash flows basis, generated by the current customer portfolio of the acquiree. The adjustment to non‐current liabilities of ThUS$ 10,824 corresponds to the recognition of deferred tax liabilities (34%) associated with adjustments to fair value, recognized in non‐current assets described above.
167
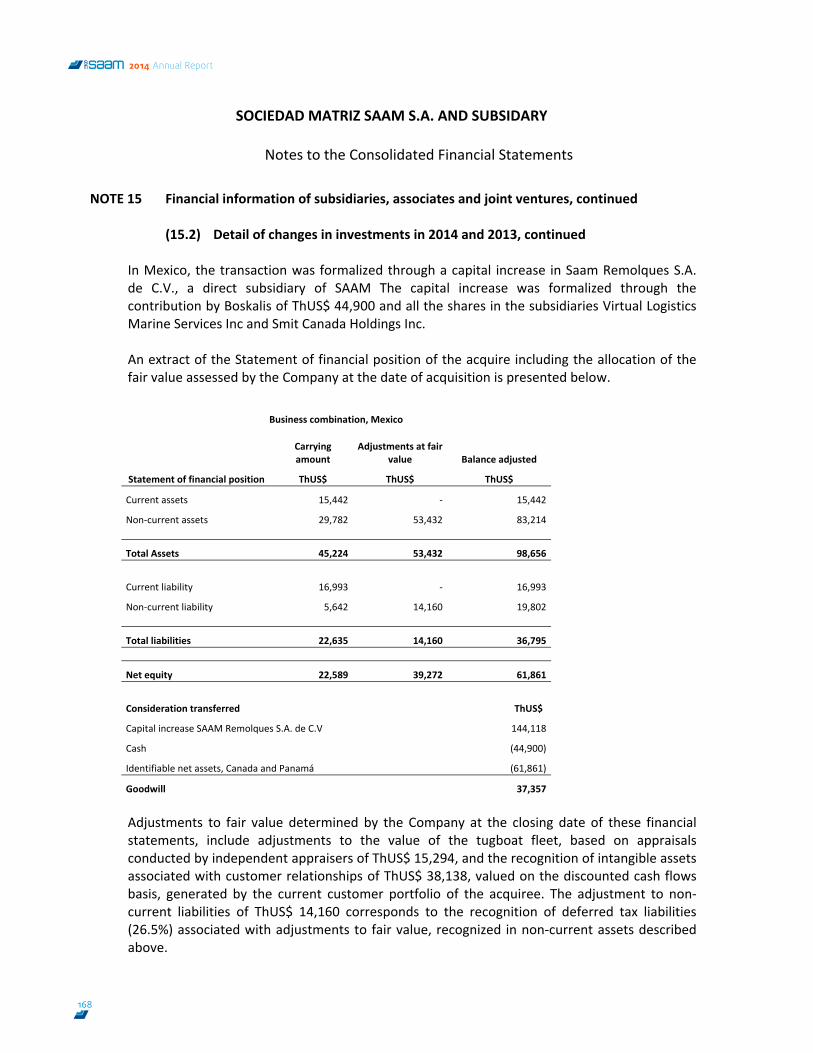
SOCIEDAD MATRIZ SAAM S.A. AND SUBSIDARY
Notes to the Consolidated Financial Statements
77
NOTE 15 Financial information of subsidiaries, associates and joint ventures, continued
(15.2) Detail of changes in investments in 2014 and 2013, continued
In Mexico, the transaction was formalized through a capital increase in Saam Remolques S.A. de C.V., a direct subsidiary of SAAM The capital increase was formalized through the contribution by Boskalis of ThUS$ 44,900 and all the shares in the subsidiaries Virtual Logistics Marine Services Inc and Smit Canada Holdings Inc. An extract of the Statement of financial position of the acquire including the allocation of the fair value assessed by the Company at the date of acquisition is presented below.
Business combination, Mexico
Carrying amount
Adjustments at fair value Balance adjusted
Statement of financial position ThUS$ ThUS$ ThUS$
Current assets 15,442 ‐ 15,442
Non‐current assets 29,782 53,432 83,214
Total Assets 45,224 53,432 98,656
Current liability 16,993 ‐ 16,993
Non‐current liability 5,642 14,160 19,802
Total liabilities 22,635 14,160 36,795
Net equity 22,589 39,272 61,861
Consideration transferred ThUS$
Capital increase SAAM Remolques S.A. de C.V 144,118
Cash (44,900)
Identifiable net assets, Canada and Panamá (61,861)
Goodwill 37,357
Adjustments to fair value determined by the Company at the closing date of these financial statements, include adjustments to the value of the tugboat fleet, based on appraisals conducted by independent appraisers of ThUS$ 15,294, and the recognition of intangible assets associated with customer relationships of ThUS$ 38,138, valued on the discounted cash flows basis, generated by the current customer portfolio of the acquiree. The adjustment to non‐current liabilities of ThUS$ 14,160 corresponds to the recognition of deferred tax liabilities (26.5%) associated with adjustments to fair value, recognized in non‐current assets described above.
168
2014 Annual Report
SOCIEDAD MATRIZ SAAM S.A. AND SUBSIDARY
Notes to the Consolidated Financial Statements
78
NOTE 15 Financial information of subsidiaries, associates and joint ventures, continued
(15.2) Detail of changes in investments in 2014 and 2013, continued
2013 • On March 1, 2013, the subsidiary SAAM S.A. acquires minority interest in Giraldir S.A. of 30% of
this company’s shares, equivalent to 15,000 shares. The amount of the investment was agreed at ThUS$2. Note that this company is included in the consolidation of Inversiones Alaria S.A., which is the owner of interest of 70% in such company.
On July 30, 2013, the Company through its direct subsidiary SAAM S.A. entered as seller a
purchase and sale agreement with Inmobiliaria Cargo Park S.P.A. for all the shares of Cargo Park S.A. where SAAM had interest of 50%. This purchase and sale contract corresponds to the formalization of the promise of purchase and sale entered into on May 7, 2013 originally with Inmobiliaria Renta II S.P.A. As of July 30, 2013, this transaction generated a gain net of adjustments and commissions of ThUS$14,668 (ThUS$ 11,995, net of taxes).
On August 30, 2013, the indirect subsidiary Alaria S.A. records its interest in Luckymontt S.A., the owner of 49% of this company’s shares, equivalent to 14,700 shares.
On October 24, 2013, the Company through its indirect subsidiary Saam Puertos S.A., entered into a purchase and sale agreement with Marítima Valparaíso – Chile S.A. for the sale of all the shares of Puerto Panul S.A. where Saam Puertos had interest of 14.4%. This transaction generated a gain of ThUS$ 210 for the Company.
On November 11, 2013, the Company through its indirect subsidiary Aquasaam S.A., entered
into a purchase and sale agreement with Inversiones “CJV” Limitada for the sale of all the shares of Tecnologías Industriales Buildteck S.A. where Aquasaam had ownership of 50%. This transaction generated a loss of ThUS$ 763 for the Company.
On December 13, 2013, as a result of a company reorganization, the indirect subsidiary
Terminal Marítima Mazatlán S.A de C.V., acquired from Saam Remolques S.A de C.V, all the shares of Saam Florida, Inc.
On December 13, 2013, as a result of a company reorganization, the direct and indirect subsidiary SAAM S.A. and Inversiones Habsburgo S.A., transferred to Saam Remolques S.A. de C.V. and Saam Remolcadores S.A de C.V. 99% and 1%, respectively of the interest in Recursos Portuarios S.A. de C.V.
169
SOCIEDAD MATRIZ SAAM S.A. AND SUBSIDARY
Notes to the Consolidated Financial Statements
79
NOTE 15 Financial information of subsidiaries, associates and joint ventures, continued
(15.2) Detail of changes in investments in 2014 and 2013, continued On December 13, 2013, as a result of the company reorganization, the direct subsidiary SAAM
S.A. acquired from SAAM Remolques interest of 2% in Recursos Portuarios Mazatlán S.A. de C.V.
On November 1, 2013, indirect associate Riluc S.A. increased its share capital through the capitalization of debt resulting in the interest of Inversiones Alaria S.A. decreasing from 26.83% to 17.70%
On December 31, 2013, the Company opted to dissolve indirect associate Jalipa Contenedores
S.R.L de C.V generating an effect on profit or loss of ThUS$ 38.
170
2014 Annual Report
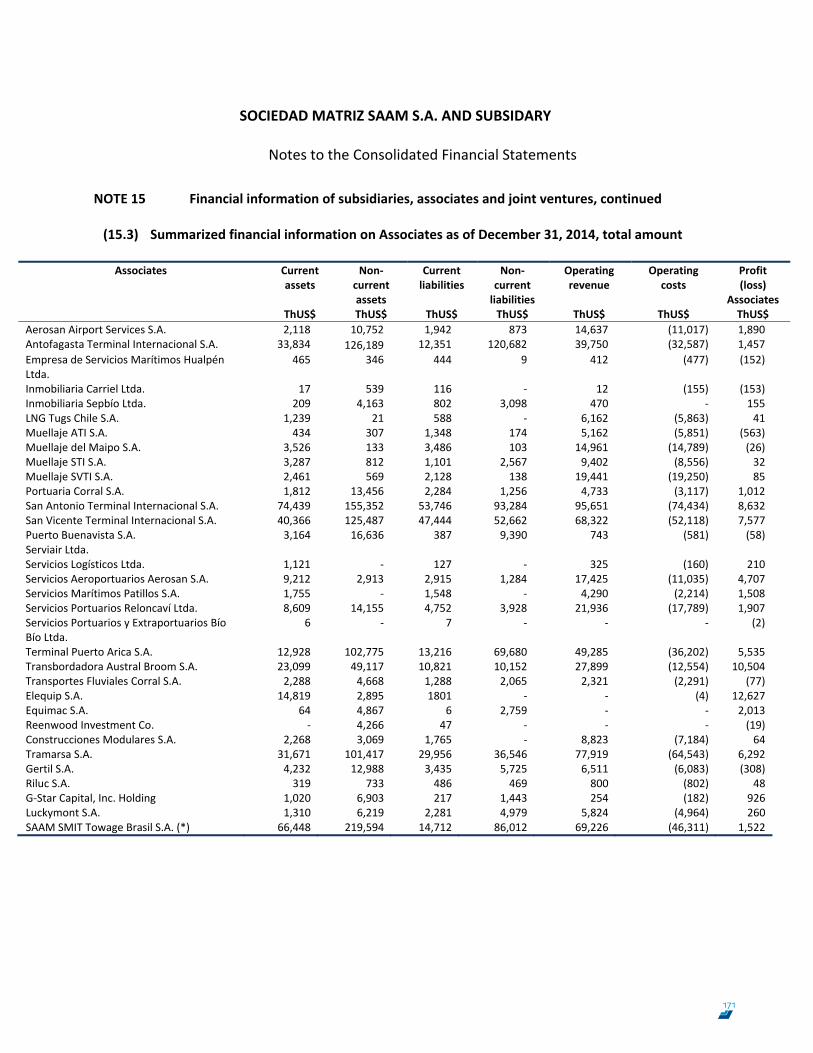
SOCIEDAD MATRIZ SAAM S.A. AND SUBSIDARY
Notes to the Consolidated Financial Statements
80
NOTE 15 Financial information of subsidiaries, associates and joint ventures, continued (15.3) Summarized financial information on Associates as of December 31, 2014, total amount
Associates Current
assets Non‐
current assets
Current liabilities
Non‐current liabilities
Operating revenue
Operating costs
Profit (loss)
Associates ThUS$ ThUS$ ThUS$ ThUS$ ThUS$ ThUS$ ThUS$ Aerosan Airport Services S.A. 2,118 10,752 1,942 873 14,637 (11,017) 1,890 Antofagasta Terminal Internacional S.A. 33,834 126,189 12,351 120,682 39,750 (32,587) 1,457 Empresa de Servicios Marítimos Hualpén Ltda.
465 346 444 9 412 (477) (152)
Inmobiliaria Carriel Ltda. 17 539 116 ‐ 12 (155) (153) Inmobiliaria Sepbío Ltda. 209 4,163 802 3,098 470 ‐ 155 LNG Tugs Chile S.A. 1,239 21 588 ‐ 6,162 (5,863) 41 Muellaje ATI S.A. 434 307 1,348 174 5,162 (5,851) (563) Muellaje del Maipo S.A. 3,526 133 3,486 103 14,961 (14,789) (26) Muellaje STI S.A. 3,287 812 1,101 2,567 9,402 (8,556) 32 Muellaje SVTI S.A. 2,461 569 2,128 138 19,441 (19,250) 85 Portuaria Corral S.A. 1,812 13,456 2,284 1,256 4,733 (3,117) 1,012 San Antonio Terminal Internacional S.A. 74,439 155,352 53,746 93,284 95,651 (74,434) 8,632 San Vicente Terminal Internacional S.A. 40,366 125,487 47,444 52,662 68,322 (52,118) 7,577 Puerto Buenavista S.A. 3,164 16,636 387 9,390 743 (581) (58) Serviair Ltda. Servicios Logísticos Ltda. 1,121 ‐ 127 ‐ 325 (160) 210 Servicios Aeroportuarios Aerosan S.A. 9,212 2,913 2,915 1,284 17,425 (11,035) 4,707 Servicios Marítimos Patillos S.A. 1,755 ‐ 1,548 ‐ 4,290 (2,214) 1,508 Servicios Portuarios Reloncaví Ltda. 8,609 14,155 4,752 3,928 21,936 (17,789) 1,907 Servicios Portuarios y Extraportuarios Bío Bío Ltda.
6 ‐ 7 ‐ ‐ ‐ (2)
Terminal Puerto Arica S.A. 12,928 102,775 13,216 69,680 49,285 (36,202) 5,535 Transbordadora Austral Broom S.A. 23,099 49,117 10,821 10,152 27,899 (12,554) 10,504 Transportes Fluviales Corral S.A. 2,288 4,668 1,288 2,065 2,321 (2,291) (77) Elequip S.A. 14,819 2,895 1801 ‐ ‐ (4) 12,627 Equimac S.A. 64 4,867 6 2,759 ‐ ‐ 2,013 Reenwood Investment Co. ‐ 4,266 47 ‐ ‐ ‐ (19) Construcciones Modulares S.A. 2,268 3,069 1,765 ‐ 8,823 (7,184) 64 Tramarsa S.A. 31,671 101,417 29,956 36,546 77,919 (64,543) 6,292 Gertil S.A. 4,232 12,988 3,435 5,725 6,511 (6,083) (308) Riluc S.A. 319 733 486 469 800 (802) 48 G‐Star Capital, Inc. Holding 1,020 6,903 217 1,443 254 (182) 926 Luckymont S.A. 1,310 6,219 2,281 4,979 5,824 (4,964) 260 SAAM SMIT Towage Brasil S.A. (*) 66,448 219,594 14,712 86,012 69,226 (46,311) 1,522
171
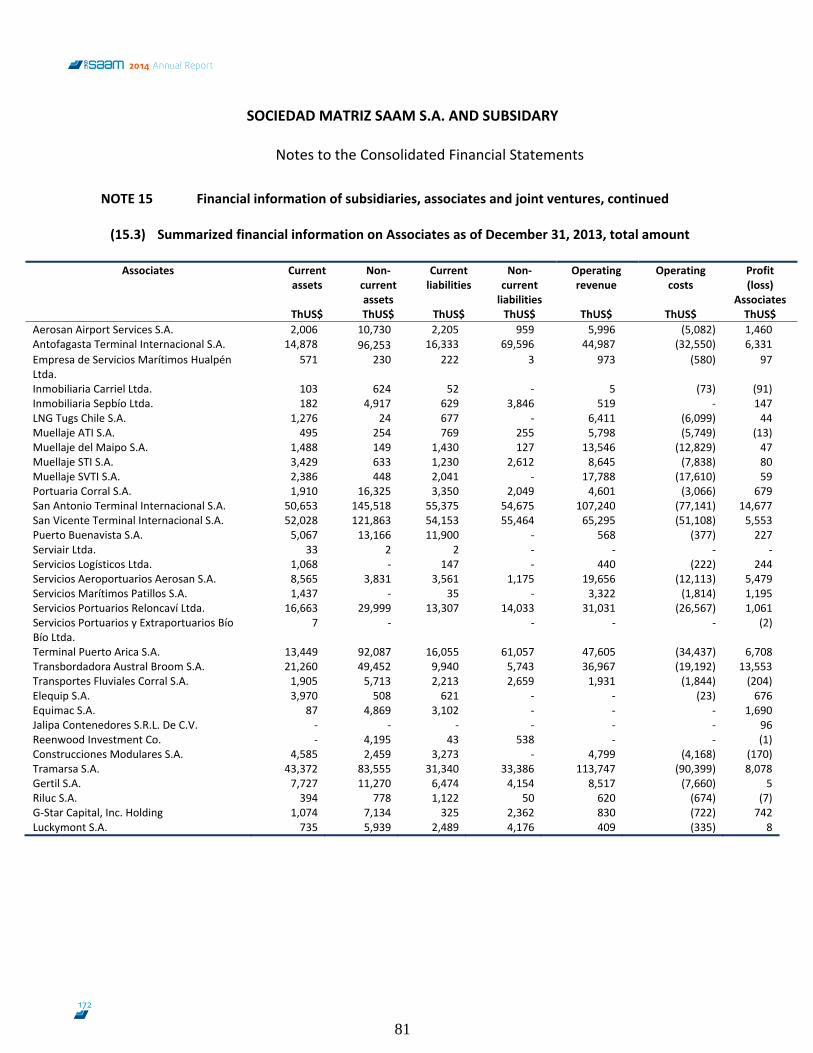
SOCIEDAD MATRIZ SAAM S.A. AND SUBSIDARY
Notes to the Consolidated Financial Statements
81
NOTE 15 Financial information of subsidiaries, associates and joint ventures, continued (15.3) Summarized financial information on Associates as of December 31, 2013, total amount
Associates Current
assets Non‐
current assets
Current liabilities
Non‐current liabilities
Operating revenue
Operating costs
Profit (loss)
Associates ThUS$ ThUS$ ThUS$ ThUS$ ThUS$ ThUS$ ThUS$ Aerosan Airport Services S.A. 2,006 10,730 2,205 959 5,996 (5,082) 1,460 Antofagasta Terminal Internacional S.A. 14,878 96,253 16,333 69,596 44,987 (32,550) 6,331 Empresa de Servicios Marítimos Hualpén Ltda.
571 230 222 3 973 (580) 97
Inmobiliaria Carriel Ltda. 103 624 52 ‐ 5 (73) (91) Inmobiliaria Sepbío Ltda. 182 4,917 629 3,846 519 ‐ 147 LNG Tugs Chile S.A. 1,276 24 677 ‐ 6,411 (6,099) 44 Muellaje ATI S.A. 495 254 769 255 5,798 (5,749) (13) Muellaje del Maipo S.A. 1,488 149 1,430 127 13,546 (12,829) 47 Muellaje STI S.A. 3,429 633 1,230 2,612 8,645 (7,838) 80 Muellaje SVTI S.A. 2,386 448 2,041 ‐ 17,788 (17,610) 59 Portuaria Corral S.A. 1,910 16,325 3,350 2,049 4,601 (3,066) 679 San Antonio Terminal Internacional S.A. 50,653 145,518 55,375 54,675 107,240 (77,141) 14,677 San Vicente Terminal Internacional S.A. 52,028 121,863 54,153 55,464 65,295 (51,108) 5,553 Puerto Buenavista S.A. 5,067 13,166 11,900 ‐ 568 (377) 227 Serviair Ltda. 33 2 2 ‐ ‐ ‐ ‐ Servicios Logísticos Ltda. 1,068 ‐ 147 ‐ 440 (222) 244 Servicios Aeroportuarios Aerosan S.A. 8,565 3,831 3,561 1,175 19,656 (12,113) 5,479 Servicios Marítimos Patillos S.A. 1,437 ‐ 35 ‐ 3,322 (1,814) 1,195 Servicios Portuarios Reloncaví Ltda. 16,663 29,999 13,307 14,033 31,031 (26,567) 1,061 Servicios Portuarios y Extraportuarios Bío Bío Ltda.
7 ‐ ‐ ‐ ‐ (2)
Terminal Puerto Arica S.A. 13,449 92,087 16,055 61,057 47,605 (34,437) 6,708 Transbordadora Austral Broom S.A. 21,260 49,452 9,940 5,743 36,967 (19,192) 13,553 Transportes Fluviales Corral S.A. 1,905 5,713 2,213 2,659 1,931 (1,844) (204) Elequip S.A. 3,970 508 621 ‐ ‐ (23) 676 Equimac S.A. 87 4,869 3,102 ‐ ‐ ‐ 1,690 Jalipa Contenedores S.R.L. De C.V. ‐ ‐ ‐ ‐ ‐ ‐ 96 Reenwood Investment Co. ‐ 4,195 43 538 ‐ ‐ (1) Construcciones Modulares S.A. 4,585 2,459 3,273 ‐ 4,799 (4,168) (170) Tramarsa S.A. 43,372 83,555 31,340 33,386 113,747 (90,399) 8,078 Gertil S.A. 7,727 11,270 6,474 4,154 8,517 (7,660) 5 Riluc S.A. 394 778 1,122 50 620 (674) (7) G‐Star Capital, Inc. Holding 1,074 7,134 325 2,362 830 (722) 742 Luckymont S.A. 735 5,939 2,489 4,176 409 (335) 8
172
2014 Annual Report
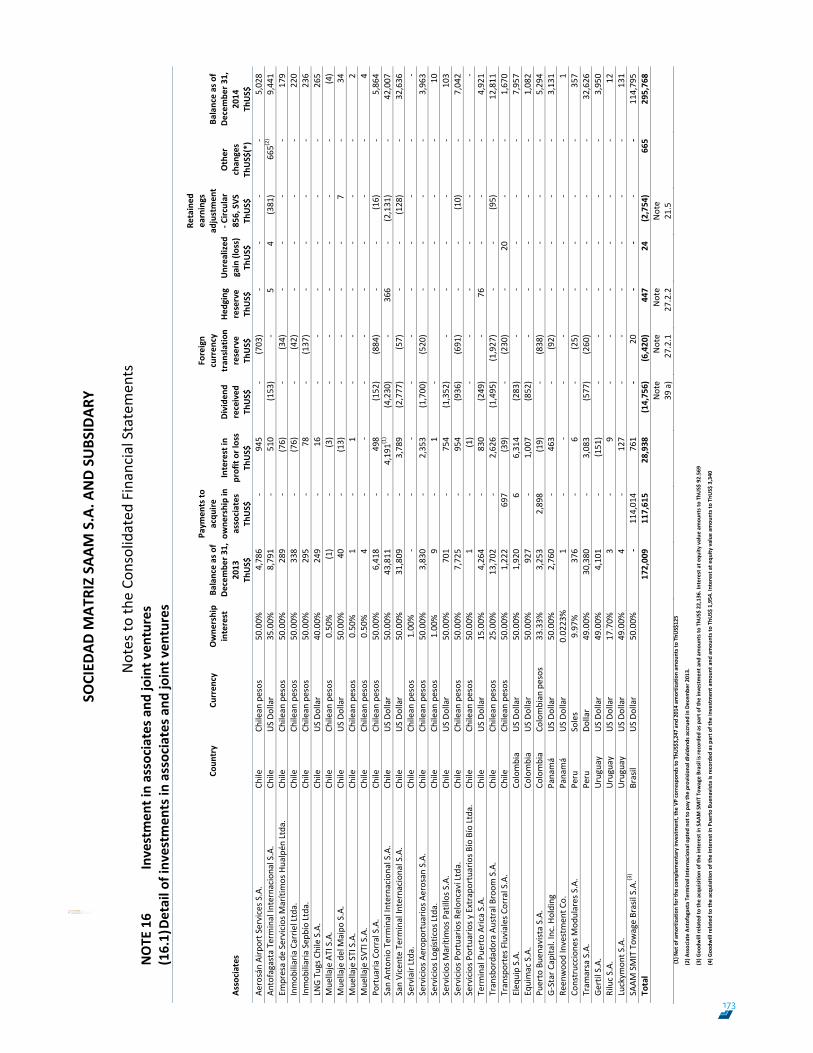
SOCIED
AD M
ATRIZ SA
AM S.A. A
ND SU
BSIDAR
Y
Notes to
the Co
nsolidated
Financial Statemen
ts
82
NOTE
16
Investmen
t in associates and
joint v
entures
(16.1) Detail of investm
ents in
associates a
nd jo
int v
entures
Associates
Co
untry
Cu
rren
cy
Owne
rship
interest
Balance as of
Decembe
r 31,
2013
Pa
ymen
ts to
acqu
ire
owne
rship in
associates
Interest in
profit or loss
Divide
nd
received
Foreign
curren
cy
tran
slation
reserve
Hedging
reserve
Unrealized
gain (loss)
Retained
earnings
adjustmen
t‐ C
ircular
856, SVS
Other
chan
ges
Balance as of
Decembe
r 31,
2014
Th
US$
Th
US$
Th
US$
Th
US$
Th
US$
Th
US$
Th
US$
Th
US$
Th
US$(*)
ThUS$
Ae
rosán Airport S
ervices S
.A.
Chile
Chilean
pesos
50.00%
4,786
‐ 945
‐ (703)
‐ ‐
‐ ‐
5,028
Antofagasta Term
inal Internacional S.A.
Chile
US Do
llar
35.00%
8,791
‐ 510
(153)
‐ 5
4 (381)
665(
2)9,441
Empresa de
Servicios M
arítimos Hualpén
Ltda.
Chile
Chilean
pesos
50.00%
289
‐ (76)
‐ (34)
‐ ‐
‐ ‐
179
Inmob
iliaria Carrie
l Ltda.
Chile
Chilean
pesos
50.00%
338
‐ (76)
‐ (42)
‐ ‐
‐ ‐
220
Inmob
iliaria Sep
bío Ltda.
Chile
Chilean
pesos
50.00%
295
‐ 78
‐
(137)
‐ ‐
‐ ‐
236
LNG Tugs Chile S.A.
Chile
US Do
llar
40.00%
249
‐ 16
‐
‐ ‐
‐ ‐
‐ 265
Mue
llaje ATI S.A.
Chile
Chilean
pesos
0.50%
(1)
‐ (3)
‐ ‐
‐ ‐
‐ ‐
(4)
Mue
llaje del M
aipo
S.A.
Chile
US Do
llar
50.00%
40
‐
(13)
‐ ‐
‐ ‐
7 ‐
34
Mue
llaje STI S.A.
Chile
Chilean
pesos
0.50%
1 ‐
1 ‐
‐ ‐
‐ ‐
‐ 2
Mue
llaje SVT
I S.A.
Chile
Chilean
pesos
0.50%
4 ‐
‐ ‐
‐ ‐
‐ ‐
‐ 4
Portuaria
Corral S.A.
Chile
Chilean
pesos
50.00%
6,418
‐ 498
(152)
(884)
‐ ‐
(16)
‐ 5,864
San An
tonio Term
inal Internacional S.A.
Chile
US Do
llar
50.00%
43,811
‐
4,191(
1)
(4,230)
‐ 366
‐ (2,131)
‐ 42,007
San Vicente Term
inal Internacional S.A.
Chile
US Do
llar
50.00%
31,809
‐
3,789
(2,777)
(57)
‐ ‐
(128)
‐ 32,636
Serviair Ltda.
Chile
Chilean
pesos
1.00%
‐ ‐
‐ ‐
‐ ‐
‐ ‐
‐ ‐
Servicios A
erop
ortuarios A
erosan
S.A.
Chile
Chilean
pesos
50.00%
3,830
‐ 2,353
(1,700)
(520)
‐ ‐
‐ ‐
3,963
Servicios L
ogísticos Ltda.
Chile
Chilean
pesos
1.00%
9 ‐
1 ‐
‐
‐ ‐
‐ 10
Servicios M
arítimos Patillos S.A.
Chile
US Do
llar
50.00%
701
‐ 754
(1,352)
‐ ‐
‐ ‐
‐ 103
Servicios P
ortuarios R
elon
caví Ltda.
Chile
Chilean
pesos
50.00%
7,725
‐ 954
(936)
(691)
‐ ‐
(10)
‐ 7,042
Servicios P
ortuarios y
Extrapo
rtuario
s Bío Bío Ltda.
Chile
Chilean
pesos
50.00%
1
‐ (1)
‐ ‐
‐ ‐
‐ ‐
‐ Term
inal Pue
rto Arica S.A.
Chile
US Do
llar
15.00%
4,264
‐ 830
(249)
‐ 76
‐
‐ ‐
4,921
Transbordado
ra Austral Broom
S.A.
Chile
Chilean
pesos
25.00%
13,702
‐
2,626
(1,495)
(1,927)
‐ ‐
(95)
‐ 12,811
Transportes F
luviales Corral S.A.
Chile
Chilean
pesos
50.00%
1,222
697
(39)
‐ (230)
‐ 20
‐
‐ 1,670
Eleq
uip S.A.
Colombia
US Do
llar
50.00%
1,920
6 6,314
(283)
‐ ‐
‐ ‐
‐ 7,957
Equimac S.A.
Colombia
US Do
llar
50.00%
927
‐ 1,007
(852)
‐ ‐
‐ ‐
‐ 1,082
Puerto Bue
navista S.A.
Colombia
Colombian
pesos
33.33%
3,253
2,898
(19)
‐ (838)
‐ ‐
‐ ‐
5,294
G‐Star Capita
l. Inc. Holding
Panamá
US Do
llar
50.00%
2,760
‐ 463
‐ (92)
‐ ‐
‐ ‐
3,131
Reen
woo
d Investmen
t Co.
Panamá
US Do
llar
0.0223%
1 ‐
‐ ‐
‐ ‐
‐ ‐
‐ 1
Construccion
es M
odulares S.A.
Peru
Soles
9.97%
376
‐ 6
‐ (25)
‐ ‐
‐ ‐
357
Tram
arsa S.A.
Peru
Dollar
49.00%
30,380
‐
3,083
(577)
(260)
‐ ‐
‐ ‐
32,626
Ge
rtil S.A.
Uruguay
US Do
llar
49.00%
4,101
‐ (151)
‐ ‐
‐ ‐
‐ ‐
3,950
Riluc S.A.
Uruguay
US Do
llar
17.70%
3 ‐
9 ‐
‐ ‐
‐ ‐
‐ 12
Luckym
ont S
.A.
Uruguay
US Do
llar
49.00%
4
‐ 127
‐ ‐
‐ ‐
‐ ‐
131
SAAM
SMIT Tow
age Brasil S.A.
(3)
Brasil
US Do
llar
50.00%
‐
114,014
761
‐ 20
‐
‐ ‐
‐ 114,795
Total
172,009
117,615
28,938
(14,756)
(6,420)
447
24
(2,754)
665
295,768
Note
39 a)
Note
27.2.1
Note
27.2.2
Note
21.5
(1) N
et of a
mortization for the
com
plem
entary investmen
t, the VP
correspon
ds to
ThU
S$3,247 an
d 20
14 amortization am
ounts to Th
US$125
(2) A
ssociate Antofagasta Terminal In
ternaciona
l opted
not to
pay th
e provisiona
l dividen
ds accrued
in Decem
ber 2
013.
(3) G
oodw
ill re
lated to th
e acqu
isition
of the
interest in
SAA
M SMIT Tow
age Brasil is re
corded
as p
art o
f the
investmen
t and
amou
nts to Th
US$
22,136. In
terest at e
quity
value
amou
nts to Th
US$
92.56
9
(4) G
oodw
ill re
lated to th
e acqu
isition
of the
interest in
Pue
rto Bu
enavista is re
corded
as p
art o
f the
investmen
t amou
nt and
amou
nts to Th
US$
1,954
. Interest a
t equ
ity value
amou
nts to Th
US$ 3,340
173
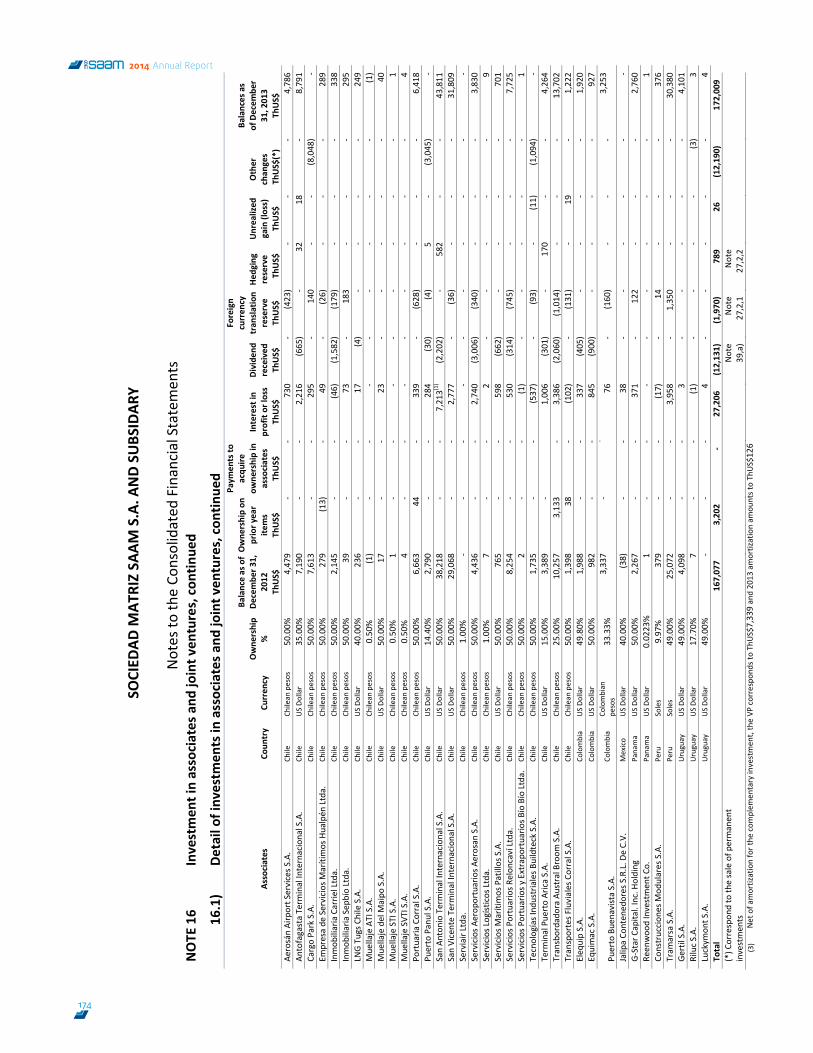
SOCIED
AD M
ATRIZ SA
AM S.A. A
ND SU
BSIDAR
Y
Notes to
the Co
nsolidated
Financial Statemen
ts
83
NOTE
16
Investmen
t in associates and
joint v
entures, con
tinue
d
16.1)
Detail of investmen
ts in
associates a
nd jo
int v
entures, con
tinue
d
Associates
Coun
try
Curren
cy
Owne
rship
%
Balance as of
Decembe
r 31,
2012
Owne
rship on
prior y
ear
items
Paym
ents to
acqu
ire
owne
rship in
associates
Interest in
profit or loss
Divide
nd
received
Foreign
curren
cy
tran
slation
reserve
Hedging
reserve
Unrealized
gain (loss)
Other
chan
ges
Balances as
of Decem
ber
31, 2013
ThUS$
Th
US$
Th
US$
Th
US$
Th
US$
Th
US$
Th
US$
Th
US$
Th
US$(*)
ThUS$
Ae
rosán Airport S
ervices S
.A.
Chile
Chilean
pesos
50.00%
4,479
‐ ‐
730
‐ (423)
‐ ‐
‐ 4,786
Antofagasta Term
inal Internacional S.A.
Chile
US Do
llar
35.00%
7,190
‐ ‐
2,216
(665)
‐ 32
18
‐
8,791
Cargo Park S.A.
Chile
Chilean
pesos
50.00%
7,613
‐ ‐
295
‐ 140
‐ ‐
(8,048)
‐ Em
presa de
Servicios M
arítimos Hualpén
Ltda.
Chile
Chilean
pesos
50.00%
279
(13)
‐ 49
‐
(26)
‐ ‐
‐ 289
Inmob
iliaria Carrie
l Ltda.
Chile
Chilean
pesos
50.00%
2,145
‐ ‐
(46)
(1,582)
(179)
‐ ‐
‐ 338
Inmob
iliaria Sep
bío Ltda.
Chile
Chilean
pesos
50.00%
39
‐
‐ 73
‐
183
‐ ‐
‐ 295
LNG Tugs Chile S.A.
Chile
US Do
llar
40.00%
236
‐ ‐
17
(4)
‐ ‐
‐ ‐
249
Mue
llaje ATI S.A.
Chile
Chilean
pesos
0.50%
(1)
‐ ‐
‐ ‐
‐ ‐
‐ ‐
(1)
Mue
llaje del M
aipo
S.A.
Chile
US Do
llar
50.00%
17
‐
‐ 23
‐
‐ ‐
‐ ‐
40
Mue
llaje STI S.A.
Chile
Chilean
pesos
0.50%
1 ‐
‐ ‐
‐ ‐
‐ ‐
‐ 1
Mue
llaje SVT
I S.A.
Chile
Chilean
pesos
0.50%
4 ‐
‐ ‐
‐ ‐
‐ ‐
‐ 4
Portuaria
Corral S.A.
Chile
Chilean
pesos
50.00%
6,663
44
‐ 339
‐ (628)
‐ ‐
‐ 6,418
Puerto Panul S.A.
Chile
US Do
llar
14.40%
2,790
‐ ‐
284
(30)
(4)
5 ‐
(3,045)
‐ San An
tonio Term
inal Internacional S.A.
Chile
US Do
llar
50.00%
38,218
‐
‐ 7,213(
1)(2,202)
‐ 582
‐ ‐
43,811
San Vicente Term
inal Internacional S.A.
Chile
US Do
llar
50.00%
29,068
‐
‐ 2,777
‐ (36)
‐ ‐
‐ 31,809
Serviair Ltda.
Chile
Chilean
pesos
1.00%
‐ ‐
‐ ‐
‐ ‐
‐ ‐
‐ ‐
Servicios A
erop
ortuarios A
erosan
S.A.
Chile
Chilean
pesos
50.00%
4,436
‐ ‐
2,740
(3,006)
(340)
‐ ‐
‐ 3,830
Servicios L
ogísticos Ltda.
Chile
Chilean
pesos
1.00%
7 ‐
‐ 2
‐ ‐
‐ ‐
‐ 9
Servicios M
arítimos Patillos S.A.
Chile
US Do
llar
50.00%
765
‐ ‐
598
(662)
‐ ‐
‐ ‐
701
Servicios P
ortuarios R
elon
caví Ltda.
Chile
Chilean
pesos
50.00%
8,254
‐ ‐
530
(314)
(745)
‐ ‐
‐ 7,725
Servicios P
ortuarios y
Extrapo
rtuario
s Bío Bío Ltda.
Chile
Chilean
pesos
50.00%
2
‐ ‐
(1)
‐ ‐
‐ ‐
‐ 1
Tecnologías Ind
ustriales B
uildteck S.A.
Chile
Chilean
pesos
50.00%
1,735
‐ ‐
(537)
‐ (93)
‐ (11)
(1,094)
‐ Term
inal Pue
rto Arica S.A.
Chile
US Do
llar
15.00%
3,389
‐
1,006
(301)
‐ 170
‐ ‐
4,264
Transbordado
ra Austral Broom
S.A.
Chile
Chilean
pesos
25.00%
10,257
3,133
‐ 3,386
(2,060)
(1,014)
‐ ‐
‐ 13,702
Transportes F
luviales Corral S.A.
Chile
Chilean
pesos
50.00%
1,398
38
‐ (102)
‐ (131)
‐ 19
‐
1,222
Eleq
uip S.A.
Colombia
US Do
llar
49.80%
1,988
‐ ‐
337
(405)
‐ ‐
‐ ‐
1,920
Equimac S.A.
Colombia
US Do
llar
50.00%
982
‐ ‐
845
(900)
‐ ‐
‐ ‐
927
Puerto Bue
navista S.A.
Colombia
Colombian
pe
sos
33.33%
3,337
‐ ‐
76
‐ (160)
‐ ‐
‐ 3,253
Jalipa Co
nten
edores S.R.L. D
e C.V.
Mexico
US Do
llar
40.00%
(38)
‐ ‐
38
‐ ‐
‐ ‐
‐ ‐
G‐Star Capita
l. Inc. Holding
Panama
US Do
llar
50.00%
2,267
‐ ‐
371
‐ 122
‐ ‐
‐ 2,760
Reen
woo
d Investmen
t Co.
Panama
US Do
llar
0.0223%
1 ‐
‐ ‐
‐ ‐
‐ ‐
‐ 1
Construccion
es M
odulares S.A.
Peru
Soles
9.97%
379
‐ ‐
(17)
‐ 14
‐
‐ ‐
376
Tram
arsa S.A.
Peru
Soles
49.00%
25,072
‐
‐ 3,958
‐ 1,350
‐ ‐
‐ 30,380
Ge
rtil S.A.
Uruguay
US Do
llar
49.00%
4,098
‐ ‐
3 ‐
‐ ‐
‐ ‐
4,101
Riluc S.A.
Uruguay
US Do
llar
17.70%
7
‐ ‐
(1)
‐ ‐
‐ ‐
(3)
3 Luckym
ont S
.A.
Uruguay
US Do
llar
49.00%
‐
‐ ‐
4 ‐
‐ ‐
‐ ‐
4 To
tal
167,077
3,202
‐ 27,206
(12,131)
(1,970)
789
26
(12,190)
172,009
(*) C
orrespon
d to th
e sale of p
ermanen
t investmen
ts
Note
39,a)
Note
27,2,1
Note
27,2,2
(3)
Net of a
mortization for the
com
plem
entary investmen
t, the VP
correspon
ds to
ThU
S$7,33
9 and 20
13 amortization am
ounts to Th
US$12
6
174
2014 Annual Report
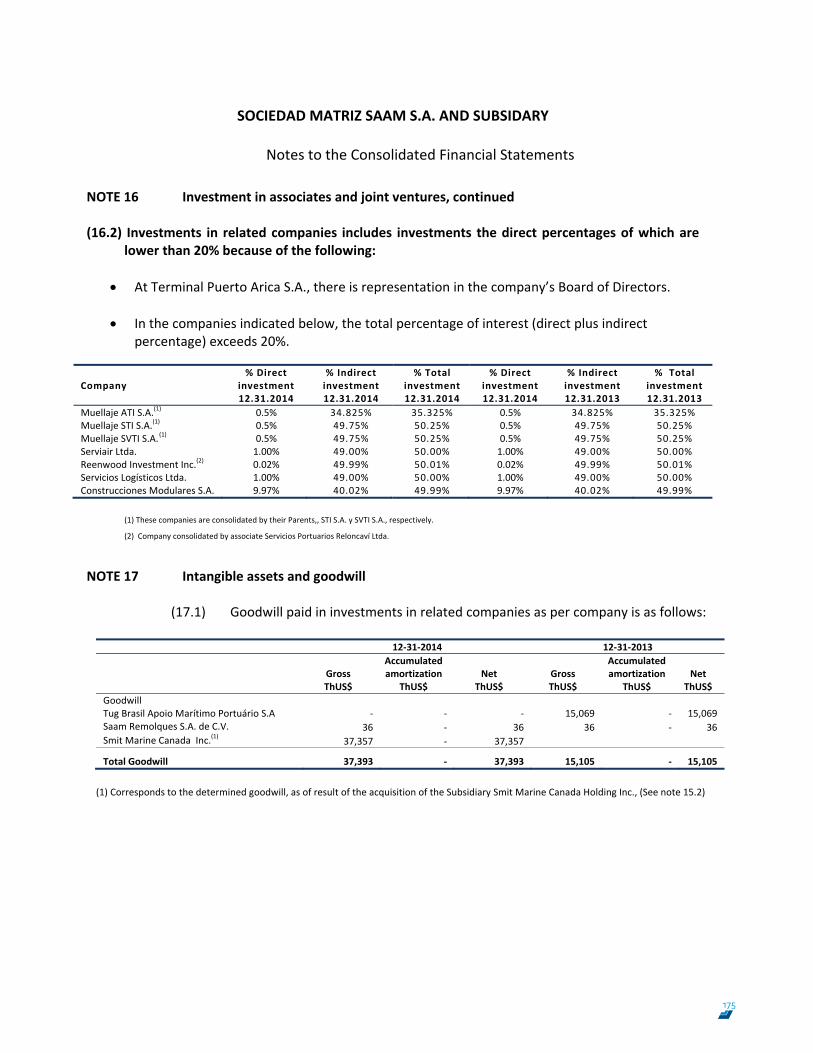
SOCIEDAD MATRIZ SAAM S.A. AND SUBSIDARY
Notes to the Consolidated Financial Statements
84
NOTE 16 Investment in associates and joint ventures, continued (16.2) Investments in related companies includes investments the direct percentages of which are
lower than 20% because of the following:
At Terminal Puerto Arica S.A., there is representation in the company’s Board of Directors.
In the companies indicated below, the total percentage of interest (direct plus indirect percentage) exceeds 20%.
(1) These companies are consolidated by their Parents,, STI S.A. y SVTI S.A., respectively.
(2) Company consolidated by associate Servicios Portuarios Reloncaví Ltda. NOTE 17 Intangible assets and goodwill
(17.1) Goodwill paid in investments in related companies as per company is as follows:
12‐31‐2014 12‐31‐2013
Gross ThUS$
Accumulated amortization
ThUS$ Net
ThUS$
Gross ThUS$
Accumulated amortization
ThUS$ Net
ThUS$ Goodwill Tug Brasil Apoio Marítimo Portuário S.A ‐ ‐ ‐ 15,069 ‐ 15,069Saam Remolques S.A. de C.V. 36 ‐ 36 36 ‐ 36 Smit Marine Canada Inc.(1) 37,357 ‐ 37,357
Total Goodwill 37,393 ‐ 37,393 15,105 ‐ 15,105
(1) Corresponds to the determined goodwill, as of result of the acquisition of the Subsidiary Smit Marine Canada Holding Inc., (See note 15.2)
Company
% Direct investment 12.31.2014
% Indirect investment 12.31.2014
% Total investment 12.31.2014
% Direct investment 12.31.2014
% Indirect investment 12.31.2013
% Total investment 12.31.2013
Muellaje ATI S.A.(1) 0.5% 34.825% 35.325% 0.5% 34.825% 35.325%Muellaje STI S.A.(1) 0.5% 49.75% 50.25% 0.5% 49.75% 50.25%Muellaje SVTI S.A.(1) 0.5% 49.75% 50.25% 0.5% 49.75% 50.25%Serviair Ltda. 1.00% 49.00% 50.00% 1.00% 49.00% 50.00%Reenwood Investment Inc.(2) 0.02% 49.99% 50.01% 0.02% 49.99% 50.01%Servicios Logísticos Ltda. 1.00% 49.00% 50.00% 1.00% 49.00% 50.00%Construcciones Modulares S.A. 9.97% 40.02% 49.99% 9.97% 40.02% 49.99%
175
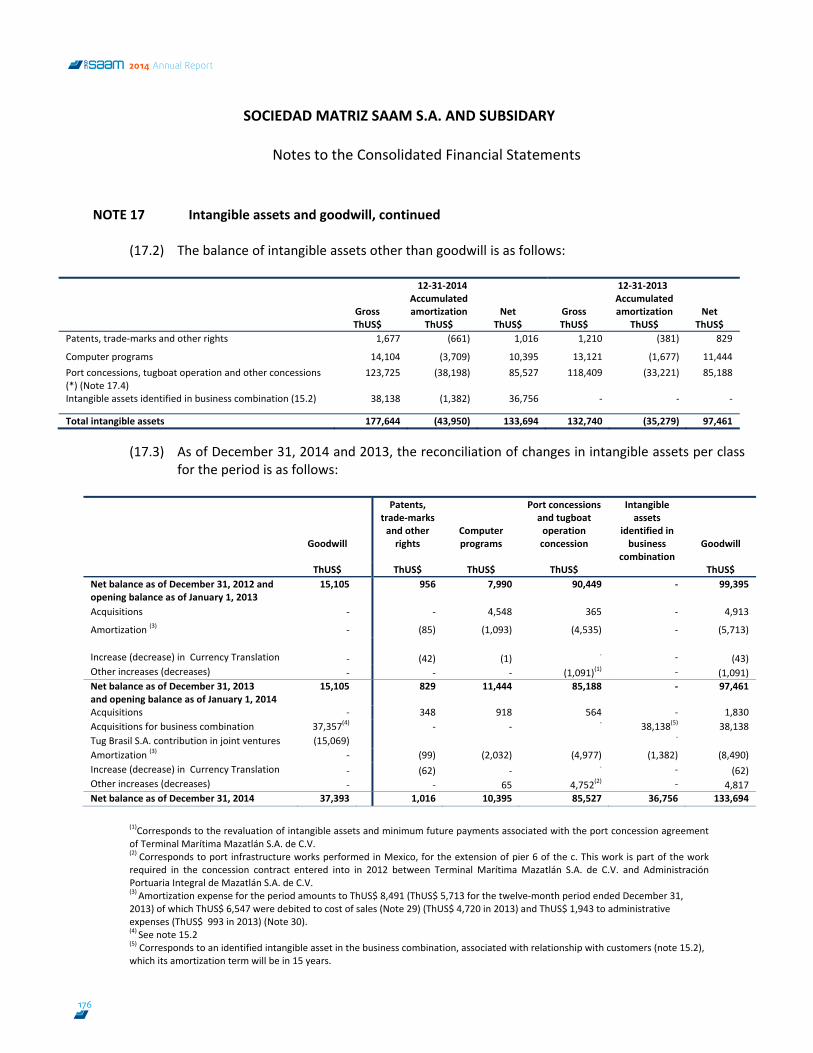
SOCIEDAD MATRIZ SAAM S.A. AND SUBSIDARY
Notes to the Consolidated Financial Statements
85
NOTE 17 Intangible assets and goodwill, continued
(17.2) The balance of intangible assets other than goodwill is as follows:
12‐31‐2014 12‐31‐2013
Gross ThUS$
Accumulated amortization
ThUS$ Net
ThUS$
Gross ThUS$
Accumulated amortization
ThUS$ Net
ThUS$ Patents, trade‐marks and other rights 1,677 (661) 1,016 1,210 (381) 829
Computer programs 14,104 (3,709) 10,395 13,121 (1,677) 11,444Port concessions, tugboat operation and other concessions (*) (Note 17.4)
123,725 (38,198) 85,527 118,409 (33,221) 85,188
Intangible assets identified in business combination (15.2) 38,138 (1,382) 36,756 ‐ ‐ ‐
Total intangible assets 177,644 (43,950) 133,694 132,740 (35,279) 97,461
(17.3) As of December 31, 2014 and 2013, the reconciliation of changes in intangible assets per class for the period is as follows:
Goodwill
Patents, trade‐marks and other rights
Computer programs
Port concessions and tugboat operation concession
Intangible assets
identified in business
combination
Goodwill
ThUS$ ThUS$ ThUS$ ThUS$ ThUS$Net balance as of December 31, 2012 and opening balance as of January 1, 2013
15,105 956 7,990 90,449 ‐ 99,395
Acquisitions ‐ ‐ 4,548 365 ‐ 4,913
Amortization (3) ‐ (85) (1,093) (4,535) ‐ (5,713) Increase (decrease) in Currency Translation ‐ (42) (1) ‐ ‐ (43) Other increases (decreases) ‐ ‐ ‐ (1,091)(1) ‐ (1,091) Net balance as of December 31, 2013 and opening balance as of January 1, 2014
15,105 829 11,444 85,188 ‐ 97,461
Acquisitions ‐ 348 918 564 ‐ 1,830Acquisitions for business combination 37,357(4) ‐ ‐ ‐ 38,138(5) 38,138Tug Brasil S.A. contribution in joint ventures (15,069) ‐
Amortization (3) ‐ (99) (2,032) (4,977) (1,382) (8,490)Increase (decrease) in Currency Translation ‐ (62) ‐ ‐ ‐ (62) Other increases (decreases) ‐ ‐ 65 4,752(2) ‐ 4,817 Net balance as of December 31, 2014 37,393 1,016 10,395 85,527 36,756 133,694
(1)Corresponds to the revaluation of intangible assets and minimum future payments associated with the port concession agreement of Terminal Marítima Mazatlán S.A. de C.V. (2) Corresponds to port infrastructure works performed in Mexico, for the extension of pier 6 of the c. This work is part of the work required in the concession contract entered into in 2012 between Terminal Marítima Mazatlán S.A. de C.V. and Administración Portuaria Integral de Mazatlán S.A. de C.V. (3) Amortization expense for the period amounts to ThUS$ 8,491 (ThUS$ 5,713 for the twelve‐month period ended December 31, 2013) of which ThUS$ 6,547 were debited to cost of sales (Note 29) (ThUS$ 4,720 in 2013) and ThUS$ 1,943 to administrative expenses (ThUS$ 993 in 2013) (Note 30). (4) See note 15.2 (5) Corresponds to an identified intangible asset in the business combination, associated with relationship with customers (note 15.2), which its amortization term will be in 15 years.
176
2014 Annual Report
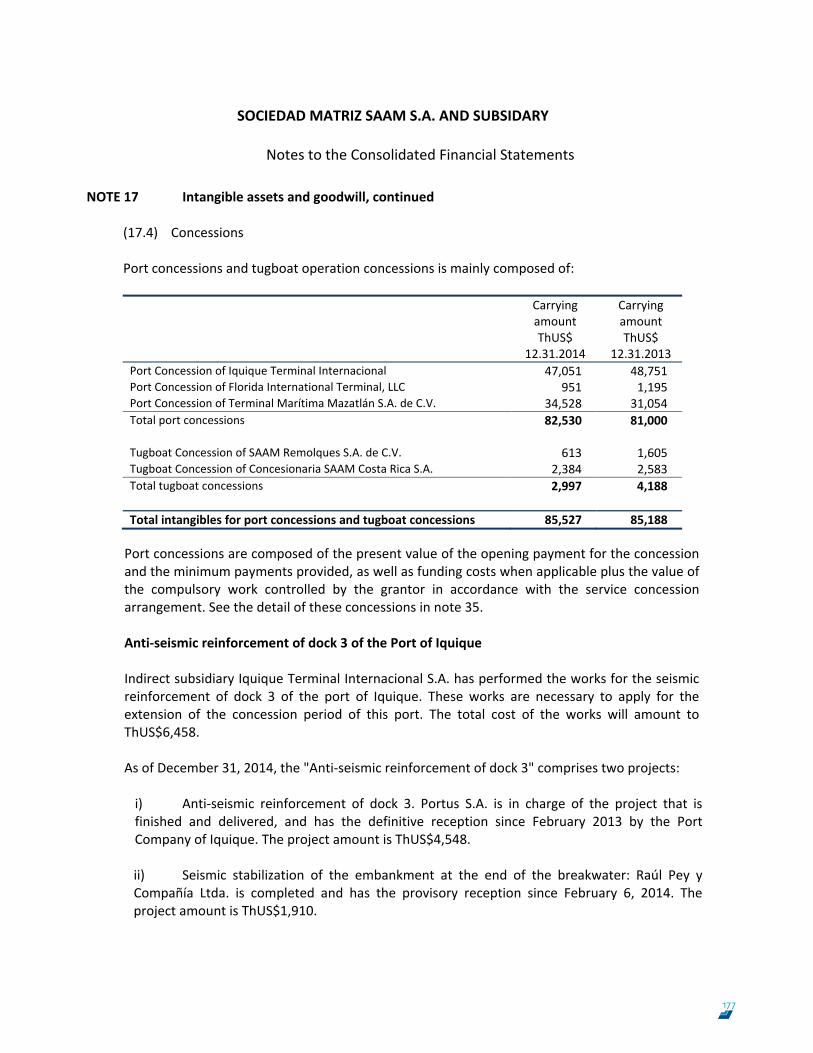
SOCIEDAD MATRIZ SAAM S.A. AND SUBSIDARY
Notes to the Consolidated Financial Statements
86
NOTE 17 Intangible assets and goodwill, continued (17.4) Concessions Port concessions and tugboat operation concessions is mainly composed of: Carrying
amount ThUS$
12.31.2014
Carrying amount ThUS$
12.31.2013 Port Concession of Iquique Terminal Internacional 47,051 48,751Port Concession of Florida International Terminal, LLC 951 1,195Port Concession of Terminal Marítima Mazatlán S.A. de C.V. 34,528 31,054Total port concessions 82,530 81,000 Tugboat Concession of SAAM Remolques S.A. de C.V. 613 1,605Tugboat Concession of Concesionaria SAAM Costa Rica S.A. 2,384 2,583Total tugboat concessions 2,997 4,188 Total intangibles for port concessions and tugboat concessions 85,527 85,188
Port concessions are composed of the present value of the opening payment for the concession and the minimum payments provided, as well as funding costs when applicable plus the value of the compulsory work controlled by the grantor in accordance with the service concession arrangement. See the detail of these concessions in note 35. Anti‐seismic reinforcement of dock 3 of the Port of Iquique Indirect subsidiary Iquique Terminal Internacional S.A. has performed the works for the seismic reinforcement of dock 3 of the port of Iquique. These works are necessary to apply for the extension of the concession period of this port. The total cost of the works will amount to ThUS$6,458. As of December 31, 2014, the "Anti‐seismic reinforcement of dock 3" comprises two projects: i) Anti‐seismic reinforcement of dock 3. Portus S.A. is in charge of the project that is finished and delivered, and has the definitive reception since February 2013 by the Port Company of Iquique. The project amount is ThUS$4,548.
ii) Seismic stabilization of the embankment at the end of the breakwater: Raúl Pey y Compañía Ltda. is completed and has the provisory reception since February 6, 2014. The project amount is ThUS$1,910.
177
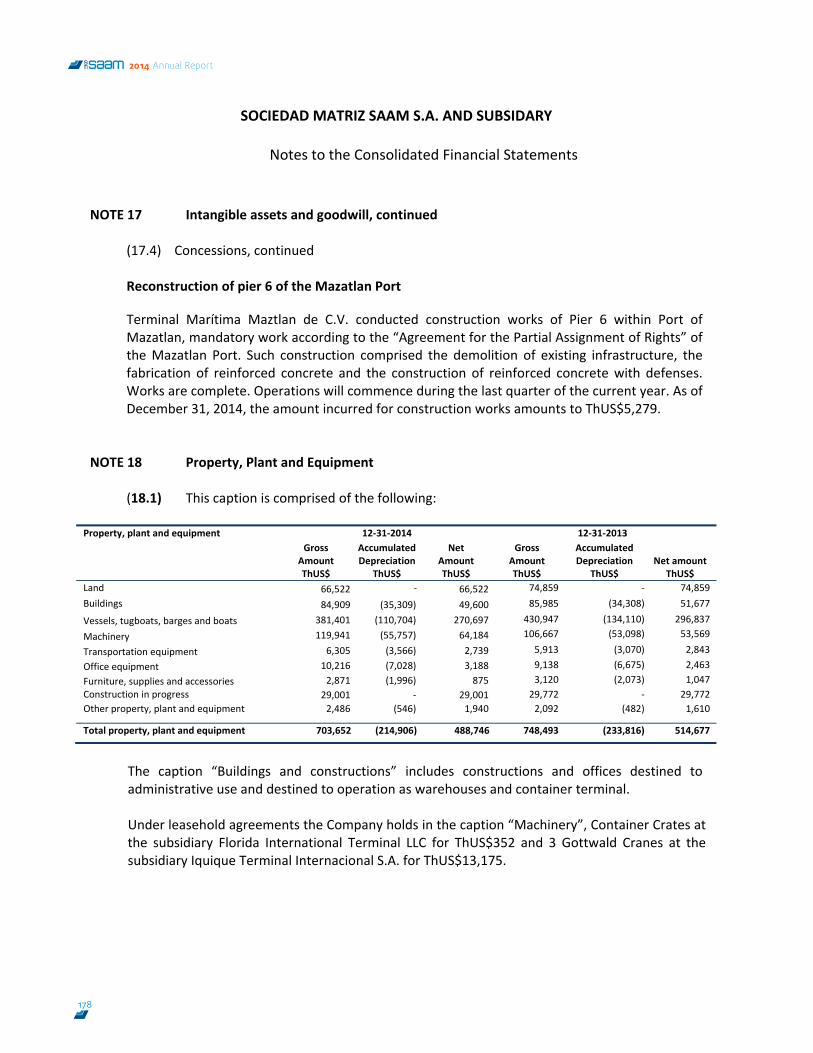
SOCIEDAD MATRIZ SAAM S.A. AND SUBSIDARY
Notes to the Consolidated Financial Statements
87
NOTE 17 Intangible assets and goodwill, continued
(17.4) Concessions, continued
Reconstruction of pier 6 of the Mazatlan Port
Terminal Marítima Maztlan de C.V. conducted construction works of Pier 6 within Port of Mazatlan, mandatory work according to the “Agreement for the Partial Assignment of Rights” of the Mazatlan Port. Such construction comprised the demolition of existing infrastructure, the fabrication of reinforced concrete and the construction of reinforced concrete with defenses. Works are complete. Operations will commence during the last quarter of the current year. As of December 31, 2014, the amount incurred for construction works amounts to ThUS$5,279.
NOTE 18 Property, Plant and Equipment
(18.1) This caption is comprised of the following:
Property, plant and equipment 12‐31‐2014 12‐31‐2013 Gross
Amount ThUS$
Accumulated Depreciation
ThUS$
NetAmount ThUS$
GrossAmount ThUS$
Accumulated Depreciation
ThUS$ Net amount
ThUS$ Land 66,522 ‐ 66,522 74,859 ‐ 74,859Buildings 84,909 (35,309) 49,600 85,985 (34,308) 51,677
Vessels, tugboats, barges and boats 381,401 (110,704) 270,697 430,947 (134,110) 296,837
Machinery 119,941 (55,757) 64,184 106,667 (53,098) 53,569
Transportation equipment 6,305 (3,566) 2,739 5,913 (3,070) 2,843
Office equipment 10,216 (7,028) 3,188 9,138 (6,675) 2,463Furniture, supplies and accessories 2,871 (1,996) 875 3,120 (2,073) 1,047Construction in progress 29,001 ‐ 29,001 29,772 ‐ 29,772Other property, plant and equipment 2,486 (546) 1,940 2,092 (482) 1,610
Total property, plant and equipment 703,652 (214,906) 488,746 748,493 (233,816) 514,677
The caption “Buildings and constructions” includes constructions and offices destined to administrative use and destined to operation as warehouses and container terminal. Under leasehold agreements the Company holds in the caption “Machinery”, Container Crates at the subsidiary Florida International Terminal LLC for ThUS$352 and 3 Gottwald Cranes at the subsidiary Iquique Terminal Internacional S.A. for ThUS$13,175.
178
2014 Annual Report
SOCIEDAD MATRIZ SAAM S.A. AND SUBSIDARY
Notes to the Consolidated Financial Statements
88
NOTE 18 Property, Plant and Equipment, continued
(18.2) Purchase commitments and construction of asset: The item “Construction‐in‐progress” refers to expenditure incurred for tugboats and operating constructions to support operations at container terminals. At the closing date of the financial statements, payments made for the construction of tugboats amounted to ThUS$24,576, projects associated with the Ecuador port of ThUS$1,610, dry‐dock and overhaul in progress for tugboats of ThUS$ 486, barges of ThUS$592 and other minor assets of ThUS$ 1,737. The carrying amount of items of property, plant and equipment that are temporarily out of service, owned by the indirect subsidiary Aquasaam S.A., is ThUS$ 1,209 (net), which at the closing date of the financial statements are measured at their recoverable amount.
a) Inmobiliaria San Marco Ltda.
The company has assets under construction for the development for drinkable water and other improvements in the area of Placilla in the city of Valparaíso for ThUS$193.
b) Tugboats under construction
The direct subsidiary SAAM S.A. has a tugboat under construction in the Bonny Fair Development Limited shipbuilding yard reflecting an investment to‐date of ThUS$2,523. Acquisitions for the period associated with this investment amounted to ThUS$2,523. The indirect subsidiary Habsburgo S.A. has four tugboats under construction in the China Machinery Engineering Wuxi Co., Ltd. Shipbuilding yard reflecting an investment to‐date of ThUS$8,657. Acquisitions for the period associated with such investment amounted to ThUS$8,657. The indirect subsidiary SMIT Marice Canada Inc. S.A. has three tugboats under construction reflecting an investment made to‐date of ThUS$ 13,396. Acquisitions for the period associated with this investment amounted to ThUS$11,834.
179
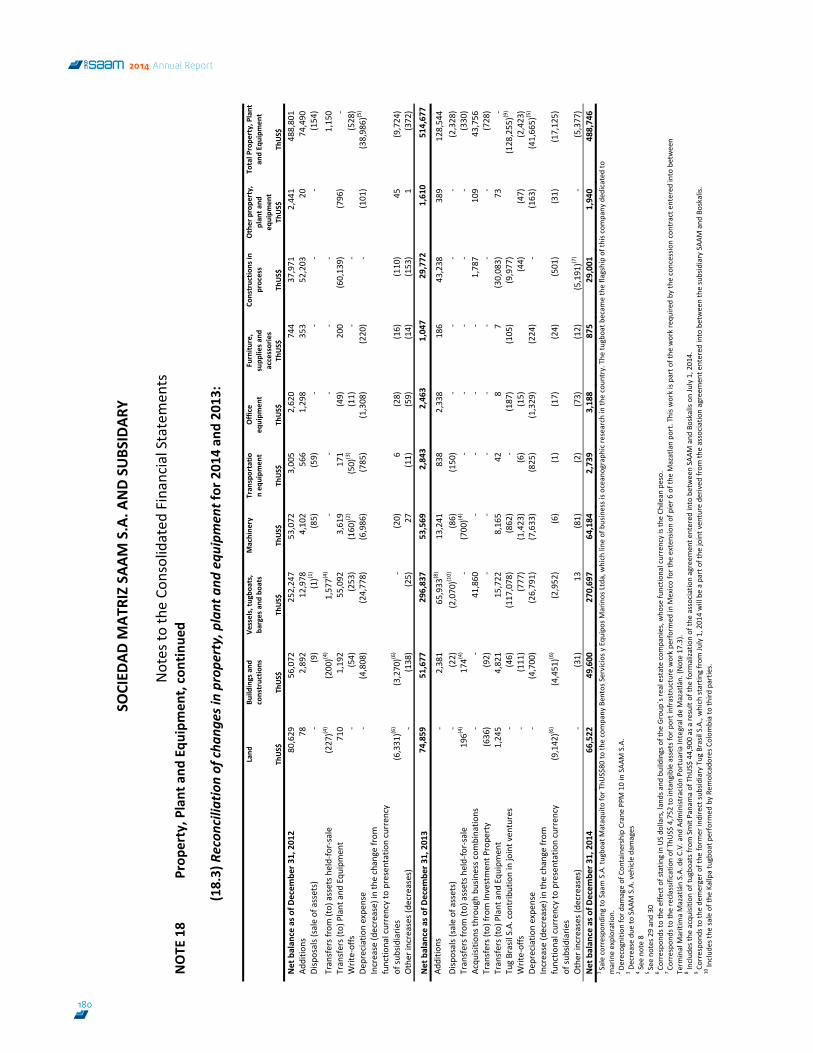
SOCIED
AD M
ATRIZ SA
AM S.A. A
ND SU
BSIDAR
Y
Notes to
the Co
nsolidated
Financial Statemen
ts
89
NOTE
18
Prop
erty, P
lant and
Equ
ipmen
t, continue
d
(18.3) Recon
cilia
tion of cha
nges in
prope
rty, plant and
equ
ipmen
t for 201
4 an
d 20
13:
Land
ThUS$
Build
ings and
constructio
ns
Th
US$
Vessels, tu
gboa
ts,
barges and
boa
ts
Th
US$
Machine
ry
Th
US$
Tran
sportatio
n eq
uipm
ent
Th
US$
Office
equipm
ent
Th
US$
Furnitu
re,
supp
lies a
nd
accessories
ThUS$
Constructio
ns in
process
Th
US$
Other prope
rty,
plan
t and
eq
uipm
ent
ThUS$
Total Prope
rty, Plant
and Eq
uipm
ent
Th
US$
Net balan
ce as o
f Decem
ber 3
1, 2012
80,629
56,072
252,247
53,072
3,005
2,620
744
37,971
2,441
488,801
Additio
ns
78
2,892
12,978
4,102
566
1,298
353
52,203
20
74,490
Disposals (sale of assets)
‐ (9)
(1)(1
)(85)
(59)
‐ ‐
‐ ‐
(154)
Transfers from (to) assets h
eld‐for‐sale
(227)(4
) (200)(4
) 1,577(
4)
‐ ‐
‐ ‐
‐
1,150
Transfers (to) P
lant and
Equ
ipmen
t 710
1,192
55,092
3,619
171
(49)
200
(60,139)
(796)
‐ Write‐offs
‐ (54)
(253)
(160)(2
)(50)
(3)
(11)
‐ ‐
(528)
Depreciatio
n expe
nse
‐ (4,808)
(24,778)
(6,986)
(785)
(1,308)
(220)
‐ (101)
(38,986)
(5)
Increase (d
ecrease) in
the change from
functio
nal currency to presentation curren
cy
of su
bsidiarie
s (6,331)(6
) (3,270)(6
) ‐
(20)
6 (28)
(16)
(110)
45
(9,724)
Other increases (de
creases)
‐ (138)
(25)
27
(11)
(59)
(14)
(153)
1 (372)
Net balan
ce as o
f Decem
ber 3
1, 2013
74,859
51,677
296,837
53,569
2,843
2,463
1,047
29,772
1,610
514,677
Additio
ns
‐ 2,381
65,933
(8)
13,241
838
2,338
186
43,238
389
128,544
Disposals (sale of assets)
‐ (22)
(2,070)(1
0)(86)
(150)
‐ ‐
‐ ‐
(2,328)
Transfers from (to) assets h
eld‐for‐sale
196(
4)174(
4)‐
(700)(4
)‐
‐ ‐
‐ ‐
(330)
Acqu
isitio
ns th
rough bu
siness c
ombinatio
ns
‐ ‐
41,860
‐
‐ ‐
‐ 1,787
109
43,756
Transfers (to) from Investmen
t Prope
rty
(636)
(92)
‐ ‐
‐ ‐
‐ ‐
‐ (728)
Transfers (to) P
lant and
Equ
ipmen
t 1,245
4,821
15,722
8,165
42
8 7
(30,083)
73
‐ Tug Brasil S.A. con
tribution in joint ven
tures
‐ (46)
(117,078
) (862)
‐ (187)
(105)
(9,977)
(128,255
)(9)
Write‐offs
‐ (111)
(777)
(1,423)
(6)
(15)
(44)
(47)
(2,423)
Depreciatio
n expe
nse
‐ (4,700)
(26,791)
(7,633)
(825)
(1,329)
(224)
‐ (163)
(41,665)
(5)
Increase (d
ecrease) in
the change from
functio
nal currency to presentation curren
cy
of su
bsidiarie
s (9,142)(6
) (4,451)(6
) (2,952)
(6)
(1)
(17)
(24)
(501)
(31)
(17,125)
Other increases (de
creases)
‐ (31)
13
(81)
(2)
(73)
(12)
(5,191)(7
)‐
(5,377)
Net balan
ce as o
f Decem
ber 3
1, 2014
66,522
49,600
270,697
64,184
2,739
3,188
875
29,001
1,940
488,746
1 Sale correspon
ding
to Saam S.A. tugbo
at M
ataquito fo
r ThU
S$80
to th
e company Ben
tos S
ervicios y Equ
ipos M
arinos Ltda, which line
of b
usiness is o
ceanograph
ic re
search in
the coun
try. The
tugboat b
ecam
e the flagship of th
is company
ded
icated
to
marine exploration.
2 De
recognition
for d
amage of Con
tainership Crane
PPM
10 in SAA
M S.A.
3 Decrease du
e to SAA
M S.A. veh
icle dam
ages
4 See
note 8
5 See no
tes 2
9 and 30
6 Co
rrespo
nds to the effect of statin
g in US do
llars, lands and
buildings of the
Group
´s re
al estate companies, w
hose fu
nctio
nal currency is the Ch
ilean
peso.
7 Co
rrespo
nds to the reclassification of ThU
S$ 4,752
to intangible assets for port infrastructure work pe
rformed
in M
exico for the
exten
sion of pier 6
of the
Mazatlan po
rt. This w
ork is part of the
work requ
ired by th
e concessio
n contract entered
into between
Term
inal M
arítima Mazatlán S.A. de C.V. and
Adm
inistración
Portuaria Integral de Mazatlán. (N
ote 17
.3).
8 Include
s the
acquisition of tu
gboats from
Smit Panama of ThU
S$ 44,90
0 as a re
sult of th
e form
aliza
tion of th
e association agreem
ent e
ntered
into between SA
AM and
Boskalis on July 1, 201
4.
9 Correspon
ds to
the de
merger o
f the
form
er indirect su
bsidiary Tug
Brasil S.A., which startin
g from
July 1, 201
4 will be a part of the
joint ven
ture derived
from
the association agreem
ent e
ntered
into between the subsidiary SAA
M and
Boskalis.
10 Includ
es th
e sale of the
Kallpa tugboat p
erform
ed by Re
molcado
res C
olom
bia to th
ird partie
s.
180
2014 Annual Report
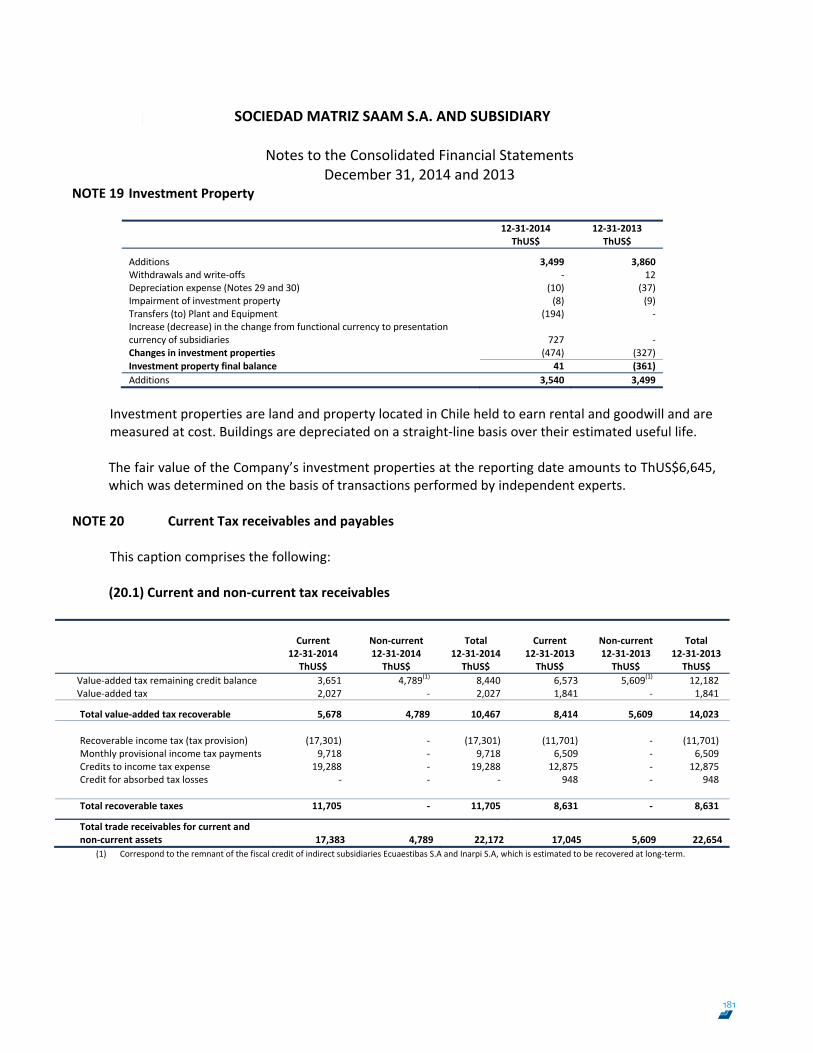
SOCIEDAD MATRIZ SAAM S.A. AND SUBSIDIARY
Notes to the Consolidated Financial Statements December 31, 2014 and 2013
90
NOTE 19 Investment Property
12‐31‐2014 ThUS$
12‐31‐2013ThUS$
Additions 3,499 3,860Withdrawals and write‐offs ‐ 12Depreciation expense (Notes 29 and 30) (10) (37)Impairment of investment property (8) (9)Transfers (to) Plant and Equipment (194) ‐Increase (decrease) in the change from functional currency to presentation currency of subsidiaries 727 ‐ Changes in investment properties (474) (327)Investment property final balance 41 (361)Additions 3,540 3,499
Investment properties are land and property located in Chile held to earn rental and goodwill and are measured at cost. Buildings are depreciated on a straight‐line basis over their estimated useful life. The fair value of the Company’s investment properties at the reporting date amounts to ThUS$6,645, which was determined on the basis of transactions performed by independent experts.
NOTE 20 Current Tax receivables and payables
This caption comprises the following: (20.1) Current and non‐current tax receivables
Current
12‐31‐2014 ThUS$
Non‐current 12‐31‐2014 ThUS$
Total 12‐31‐2014 ThUS$
Current
12‐31‐2013 ThUS$
Non‐current 12‐31‐2013 ThUS$
Total 12‐31‐2013 ThUS$
Value‐added tax remaining credit balance 3,651 4,789(1) 8,440 6,573 5,609(1) 12,182Value‐added tax 2,027 ‐ 2,027 1,841 ‐ 1,841
Total value‐added tax recoverable 5,678 4,789 10,467 8,414 5,609 14,023 Recoverable income tax (tax provision) (17,301) ‐ (17,301) (11,701) ‐ (11,701)Monthly provisional income tax payments 9,718 ‐ 9,718 6,509 ‐ 6,509Credits to income tax expense 19,288 ‐ 19,288 12,875 ‐ 12,875Credit for absorbed tax losses ‐ ‐ ‐ 948 ‐ 948 Total recoverable taxes 11,705 ‐ 11,705 8,631 ‐ 8,631 Total trade receivables for current and non‐current assets 17,383 4,789 22,172 17,045 5,609 22,654
(1) Correspond to the remnant of the fiscal credit of indirect subsidiaries Ecuaestibas S.A and Inarpi S.A, which is estimated to be recovered at long‐term.
181
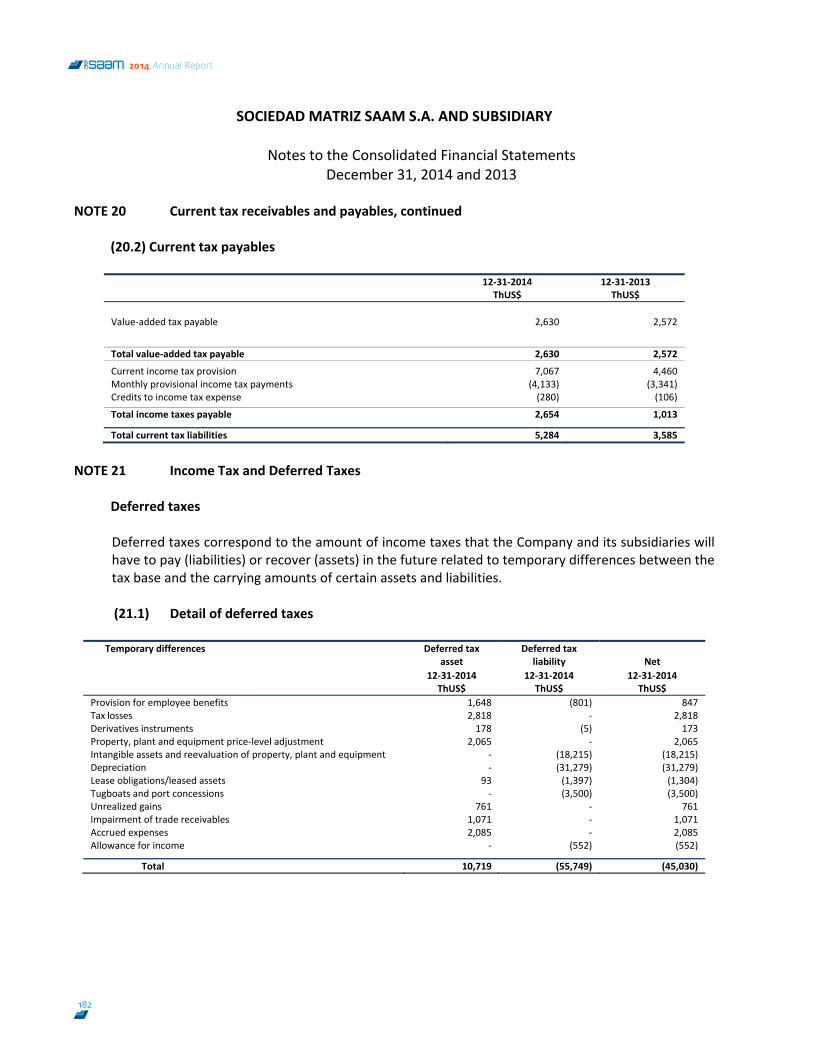
SOCIEDAD MATRIZ SAAM S.A. AND SUBSIDIARY
Notes to the Consolidated Financial Statements December 31, 2014 and 2013
91
NOTE 20 Current tax receivables and payables, continued (20.2) Current tax payables
12‐31‐2014 ThUS$
12‐31‐2013ThUS$
Value‐added tax payable 2,630 2,572
Total value‐added tax payable 2,630 2,572 Current income tax provision 7,067 4,460Monthly provisional income tax payments (4,133) (3,341)Credits to income tax expense (280) (106) Total income taxes payable 2,654 1,013 Total current tax liabilities 5,284 3,585
NOTE 21 Income Tax and Deferred Taxes
Deferred taxes Deferred taxes correspond to the amount of income taxes that the Company and its subsidiaries will have to pay (liabilities) or recover (assets) in the future related to temporary differences between the tax base and the carrying amounts of certain assets and liabilities. (21.1) Detail of deferred taxes
Temporary differences Deferred tax asset
Deferred tax liability Net
12‐31‐2014 12‐31‐2014 12‐31‐2014 ThUS$ ThUS$ ThUS$
Provision for employee benefits 1,648 (801) 847Tax losses 2,818 ‐ 2,818Derivatives instruments 178 (5) 173Property, plant and equipment price‐level adjustment 2,065 ‐ 2,065Intangible assets and reevaluation of property, plant and equipment ‐ (18,215) (18,215)Depreciation ‐ (31,279) (31,279)Lease obligations/leased assets 93 (1,397) (1,304)Tugboats and port concessions ‐ (3,500) (3,500)Unrealized gains 761 ‐ 761Impairment of trade receivables 1,071 ‐ 1,071Accrued expenses 2,085 ‐ 2,085Allowance for income ‐ (552) (552)
Total 10,719 (55,749) (45,030)
182
2014 Annual Report
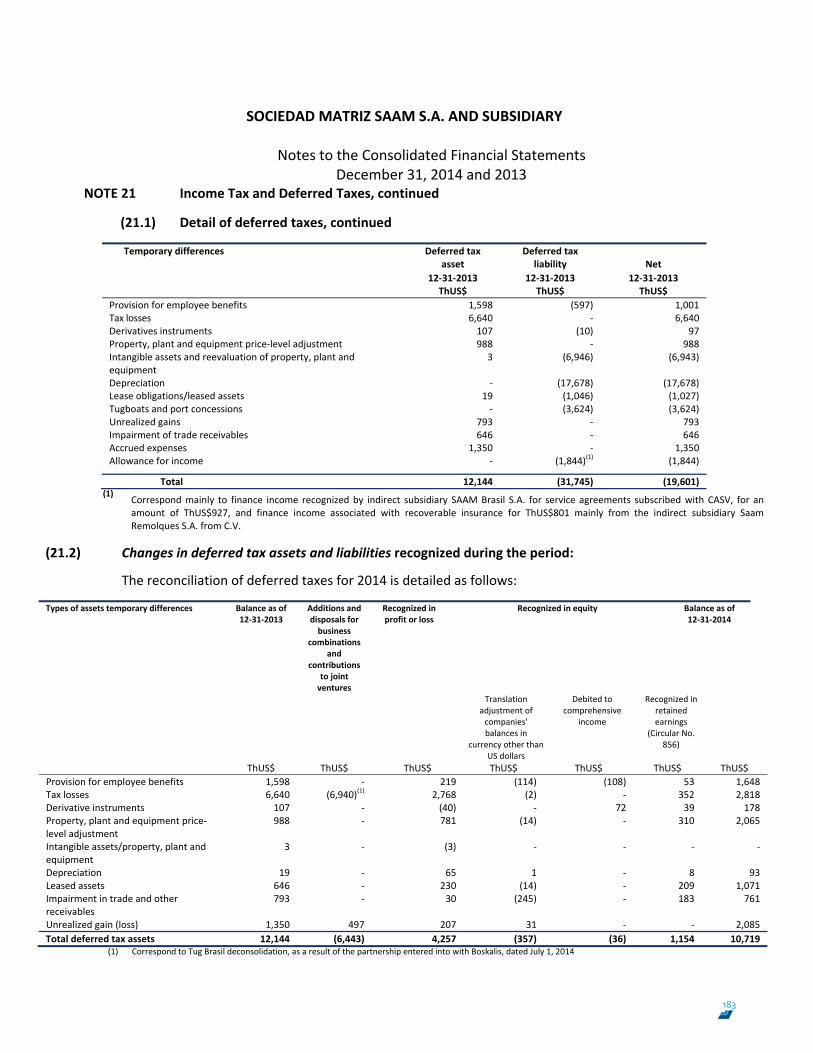
SOCIEDAD MATRIZ SAAM S.A. AND SUBSIDIARY
Notes to the Consolidated Financial Statements December 31, 2014 and 2013
92
NOTE 21 Income Tax and Deferred Taxes, continued
(21.1) Detail of deferred taxes, continued Temporary differences Deferred tax
asset Deferred tax
liability Net 12‐31‐2013 12‐31‐2013 12‐31‐2013
ThUS$ ThUS$ ThUS$Provision for employee benefits 1,598 (597) 1,001Tax losses 6,640 ‐ 6,640Derivatives instruments 107 (10) 97Property, plant and equipment price‐level adjustment 988 ‐ 988Intangible assets and reevaluation of property, plant and equipment
3 (6,946) (6,943)
Depreciation ‐ (17,678) (17,678)Lease obligations/leased assets 19 (1,046) (1,027)Tugboats and port concessions ‐ (3,624) (3,624)Unrealized gains 793 ‐ 793Impairment of trade receivables 646 ‐ 646Accrued expenses 1,350 ‐ 1,350Allowance for income ‐ (1,844)(1) (1,844)
Total 12,144 (31,745) (19,601)(1) Correspond mainly to finance income recognized by indirect subsidiary SAAM Brasil S.A. for service agreements subscribed with CASV, for an
amount of ThUS$927, and finance income associated with recoverable insurance for ThUS$801 mainly from the indirect subsidiary Saam Remolques S.A. from C.V.
(21.2) Changes in deferred tax assets and liabilities recognized during the period:
The reconciliation of deferred taxes for 2014 is detailed as follows:
Types of assets temporary differences Balance as of 12‐31‐2013
Additions and disposals for business
combinations and
contributions to joint ventures
Recognized in profit or loss
Recognized in equity Balance as of 12‐31‐2014
Translation adjustment of companies' balances in
currency other than US dollars
Debited to comprehensive
income
Recognized in retained earnings
(Circular No. 856)
ThUS$ ThUS$ ThUS$ ThUS$ ThUS$ ThUS$ ThUS$Provision for employee benefits 1,598 ‐ 219 (114) (108) 53 1,648Tax losses 6,640 (6,940)(1) 2,768 (2) ‐ 352 2,818Derivative instruments 107 ‐ (40) ‐ 72 39 178Property, plant and equipment price‐level adjustment
988 ‐ 781 (14) ‐ 310 2,065
Intangible assets/property, plant and equipment
3 ‐ (3) ‐ ‐ ‐ ‐
Depreciation 19 ‐ 65 1 ‐ 8 93Leased assets 646 ‐ 230 (14) ‐ 209 1,071Impairment in trade and other receivables
793 ‐ 30 (245) ‐ 183 761
Unrealized gain (loss) 1,350 497 207 31 ‐ ‐ 2,085Total deferred tax assets 12,144 (6,443) 4,257 (357) (36) 1,154 10,719
(1) Correspond to Tug Brasil deconsolidation, as a result of the partnership entered into with Boskalis, dated July 1, 2014
183
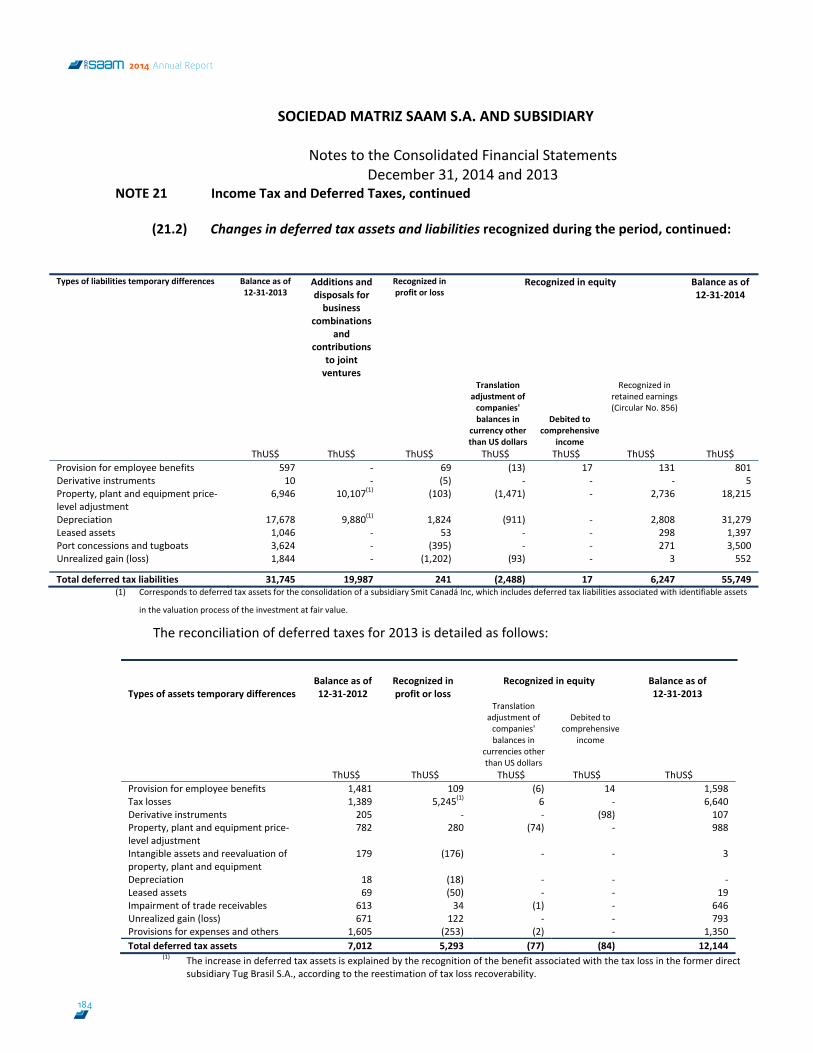
SOCIEDAD MATRIZ SAAM S.A. AND SUBSIDIARY
Notes to the Consolidated Financial Statements December 31, 2014 and 2013
93
NOTE 21 Income Tax and Deferred Taxes, continued (21.2) Changes in deferred tax assets and liabilities recognized during the period, continued:
Types of liabilities temporary differences Balance as of 12‐31‐2013
Additions and disposals for business
combinations and
contributions to joint ventures
Recognized in profit or loss
Recognized in equity Balance as of 12‐31‐2014
Translation adjustment of companies' balances in
currency other than US dollars
Debited to comprehensive
income
Recognized in retained earnings(Circular No. 856)
ThUS$ ThUS$ ThUS$ ThUS$ ThUS$ ThUS$ ThUS$Provision for employee benefits 597 ‐ 69 (13) 17 131 801Derivative instruments 10 ‐ (5) ‐ ‐ ‐ 5Property, plant and equipment price‐level adjustment
6,946 10,107(1) (103) (1,471) ‐ 2,736 18,215
Depreciation 17,678 9,880(1) 1,824 (911) ‐ 2,808 31,279Leased assets 1,046 ‐ 53 ‐ ‐ 298 1,397Port concessions and tugboats 3,624 ‐ (395) ‐ ‐ 271 3,500Unrealized gain (loss) 1,844 ‐ (1,202) (93) ‐ 3 552 Total deferred tax liabilities 31,745 19,987 241 (2,488) 17 6,247 55,749
(1) Corresponds to deferred tax assets for the consolidation of a subsidiary Smit Canadá Inc, which includes deferred tax liabilities associated with identifiable assets
in the valuation process of the investment at fair value.
The reconciliation of deferred taxes for 2013 is detailed as follows:
Types of assets temporary differences
Balance as of 12‐31‐2012
Recognized in profit or loss
Recognized in equity Balance as of 12‐31‐2013
Translation adjustment of companies' balances in
currencies other than US dollars
Debited to
comprehensive income
ThUS$ ThUS$ ThUS$ ThUS$ ThUS$Provision for employee benefits 1,481 109 (6) 14 1,598Tax losses 1,389 5,245(1) 6 ‐ 6,640Derivative instruments 205 ‐ ‐ (98) 107Property, plant and equipment price‐level adjustment
782 280 (74) ‐ 988
Intangible assets and reevaluation of property, plant and equipment
179 (176) ‐ ‐ 3
Depreciation 18 (18) ‐ ‐ ‐Leased assets 69 (50) ‐ ‐ 19Impairment of trade receivables 613 34 (1) ‐ 646Unrealized gain (loss) 671 122 ‐ ‐ 793Provisions for expenses and others 1,605 (253) (2) ‐ 1,350Total deferred tax assets 7,012 5,293 (77) (84) 12,144
(1) The increase in deferred tax assets is explained by the recognition of the benefit associated with the tax loss in the former direct subsidiary Tug Brasil S.A., according to the reestimation of tax loss recoverability.
184
2014 Annual Report
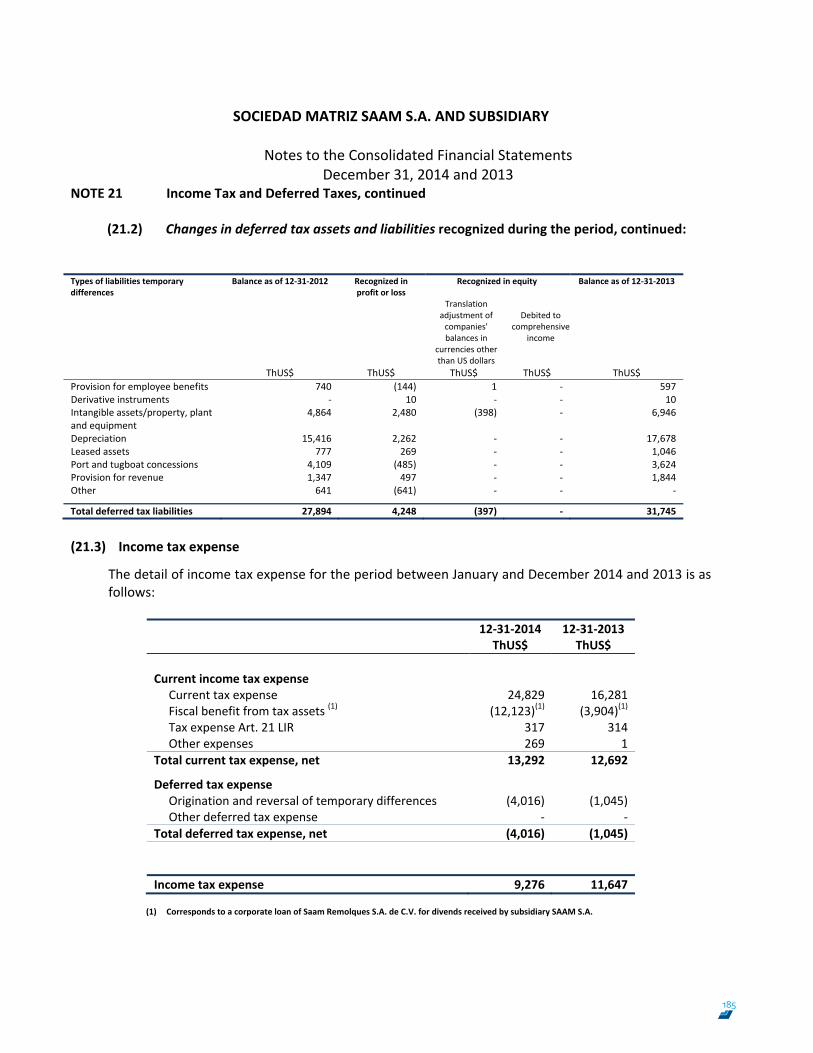
SOCIEDAD MATRIZ SAAM S.A. AND SUBSIDIARY
Notes to the Consolidated Financial Statements December 31, 2014 and 2013
94
NOTE 21 Income Tax and Deferred Taxes, continued (21.2) Changes in deferred tax assets and liabilities recognized during the period, continued:
Types of liabilities temporary differences
Balance as of 12‐31‐2012 Recognized in profit or loss
Recognized in equity Balance as of 12‐31‐2013
Translation adjustment of companies' balances in
currencies other than US dollars
Debited to
comprehensive income
ThUS$ ThUS$ ThUS$ ThUS$ ThUS$Provision for employee benefits 740 (144) 1 ‐ 597Derivative instruments ‐ 10 ‐ ‐ 10Intangible assets/property, plant and equipment
4,864 2,480 (398) ‐ 6,946
Depreciation 15,416 2,262 ‐ ‐ 17,678Leased assets 777 269 ‐ ‐ 1,046Port and tugboat concessions 4,109 (485) ‐ ‐ 3,624Provision for revenue 1,347 497 ‐ ‐ 1,844Other 641 (641) ‐ ‐ ‐ Total deferred tax liabilities 27,894 4,248 (397) ‐ 31,745
(21.3) Income tax expense
The detail of income tax expense for the period between January and December 2014 and 2013 is as follows:
12‐31‐2014 ThUS$
12‐31‐2013ThUS$
Current income tax expense
Current tax expense 24,829 16,281Fiscal benefit from tax assets (1) (12,123)(1) (3,904)(1)
Tax expense Art. 21 LIR 317 314Other expenses 269 1
Total current tax expense, net 13,292 12,692 Deferred tax expense
Origination and reversal of temporary differences (4,016) (1,045)Other deferred tax expense ‐ ‐
Total deferred tax expense, net (4,016) (1,045)
Income tax expense 9,276 11,647
(1) Corresponds to a corporate loan of Saam Remolques S.A. de C.V. for divends received by subsidiary SAAM S.A.
185
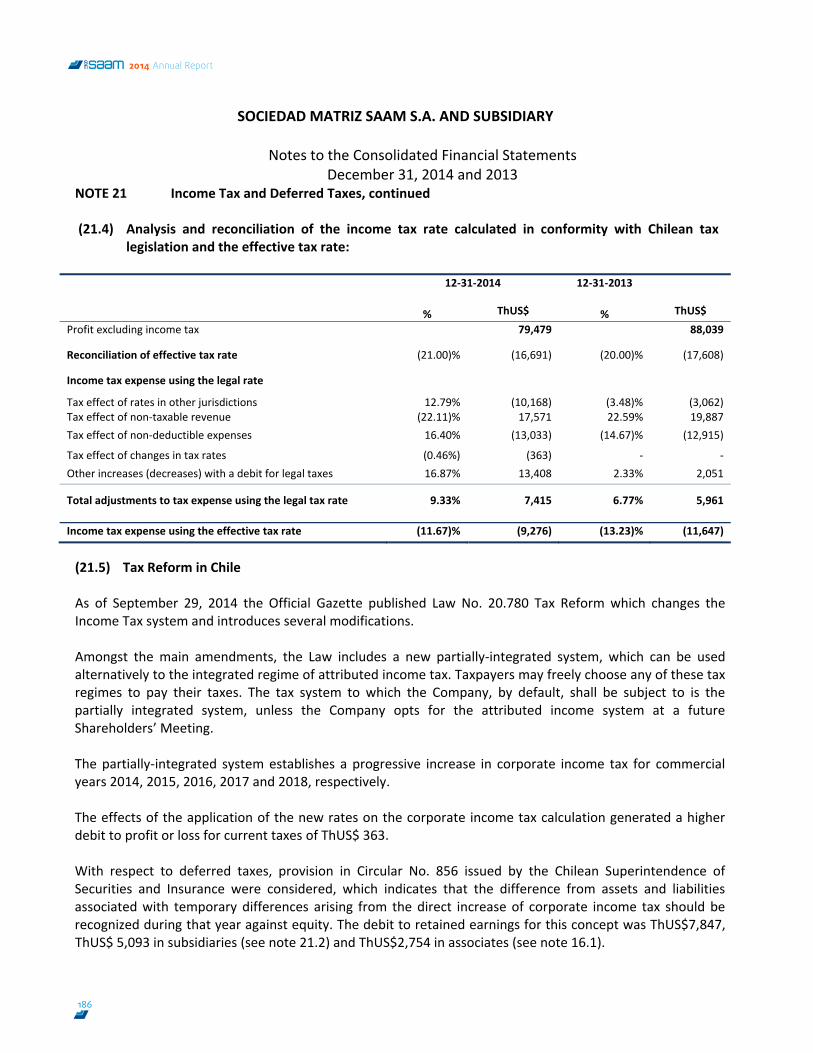
SOCIEDAD MATRIZ SAAM S.A. AND SUBSIDIARY
Notes to the Consolidated Financial Statements December 31, 2014 and 2013
95
NOTE 21 Income Tax and Deferred Taxes, continued (21.4) Analysis and reconciliation of the income tax rate calculated in conformity with Chilean tax
legislation and the effective tax rate:
12‐31‐2014 12‐31‐2013
% ThUS$ % ThUS$ Profit excluding income tax 79,479 88,039
Reconciliation of effective tax rate (21.00)% (16,691) (20.00)% (17,608) Income tax expense using the legal rate Tax effect of rates in other jurisdictions 12.79% (10,168) (3.48)% (3,062) Tax effect of non‐taxable revenue (22.11)% 17,571 22.59% 19,887 Tax effect of non‐deductible expenses 16.40% (13,033) (14.67)% (12,915)
Tax effect of changes in tax rates (0.46%) (363) ‐ ‐ Other increases (decreases) with a debit for legal taxes 16.87% 13,408 2.33% 2,051 Total adjustments to tax expense using the legal tax rate 9.33% 7,415 6.77% 5,961 Income tax expense using the effective tax rate (11.67)% (9,276) (13.23)% (11,647)
(21.5) Tax Reform in Chile As of September 29, 2014 the Official Gazette published Law No. 20.780 Tax Reform which changes the Income Tax system and introduces several modifications. Amongst the main amendments, the Law includes a new partially‐integrated system, which can be used alternatively to the integrated regime of attributed income tax. Taxpayers may freely choose any of these tax regimes to pay their taxes. The tax system to which the Company, by default, shall be subject to is the partially integrated system, unless the Company opts for the attributed income system at a future Shareholders’ Meeting. The partially‐integrated system establishes a progressive increase in corporate income tax for commercial years 2014, 2015, 2016, 2017 and 2018, respectively. The effects of the application of the new rates on the corporate income tax calculation generated a higher debit to profit or loss for current taxes of ThUS$ 363. With respect to deferred taxes, provision in Circular No. 856 issued by the Chilean Superintendence of Securities and Insurance were considered, which indicates that the difference from assets and liabilities associated with temporary differences arising from the direct increase of corporate income tax should be recognized during that year against equity. The debit to retained earnings for this concept was ThUS$7,847, ThUS$ 5,093 in subsidiaries (see note 21.2) and ThUS$2,754 in associates (see note 16.1).
186
2014 Annual Report
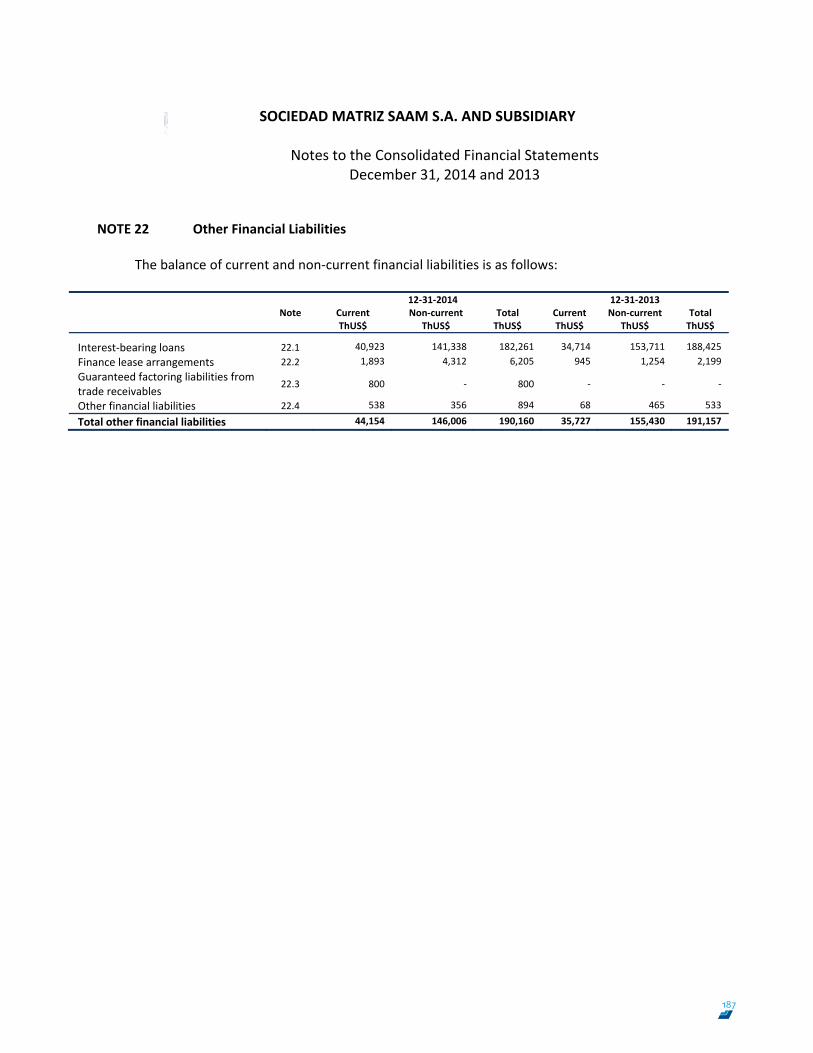
SOCIEDAD MATRIZ SAAM S.A. AND SUBSIDIARY
Notes to the Consolidated Financial Statements December 31, 2014 and 2013
96
NOTE 22 Other Financial Liabilities
The balance of current and non‐current financial liabilities is as follows:
12‐31‐2014 12‐31‐2013 Note Current
ThUS$ Non‐current
ThUS$ TotalThUS$
Current ThUS$
Non‐currentThUS$
TotalThUS$
Interest‐bearing loans 22.1 40,923 141,338 182,261 34,714 153,711 188,425Finance lease arrangements 22.2 1,893 4,312 6,205 945 1,254 2,199Guaranteed factoring liabilities from trade receivables
22.3 800 ‐ 800 ‐ ‐ ‐
Other financial liabilities 22.4 538 356 894 68 465 533
Total other financial liabilities 44,154 146,006 190,160 35,727 155,430 191,157
187
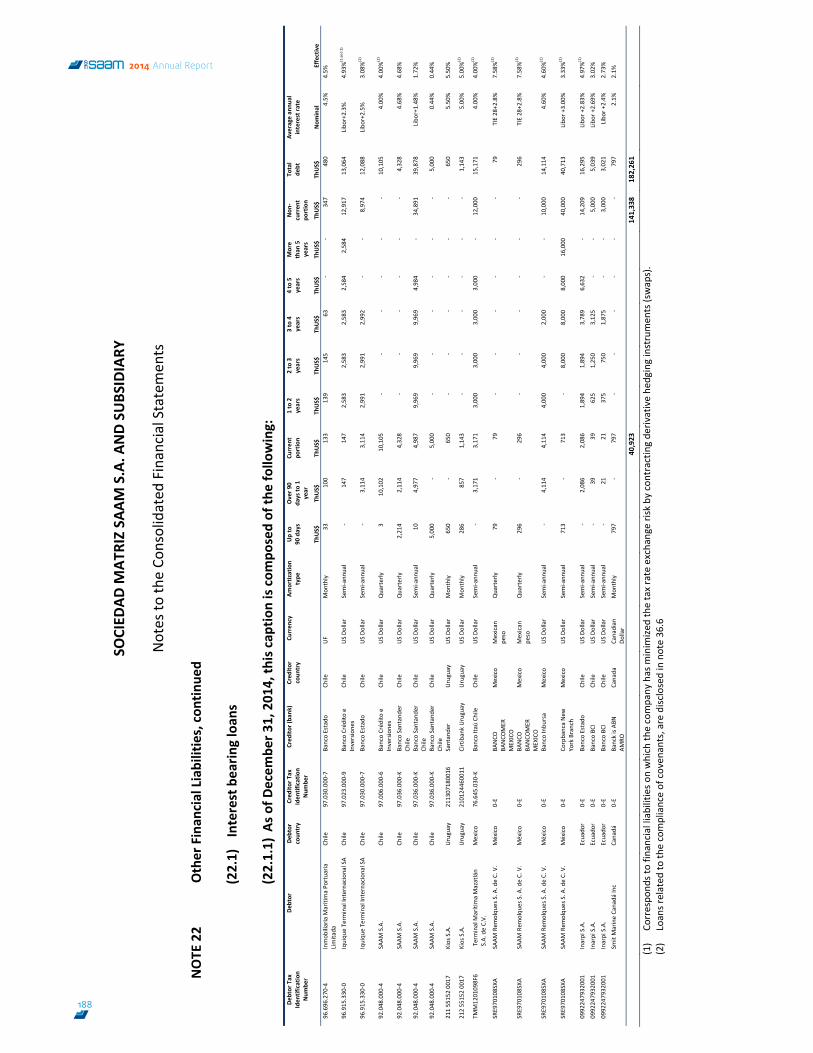
SOCIED
AD M
ATRIZ SA
AM S.A. A
ND SU
BSIDIARY
Notes to
the Co
nsolidated
Financial Statemen
ts
97
NOTE
22
Other Finan
cial Liabilities, con
tinue
d
(22.1) Interest bearin
g loan
s
(22.1.1) A
s of D
ecem
ber 3
1, 201
4, th
is cap
tion is com
posed of th
e follo
wing:
(1)
Correspo
nds to fin
ancial liabilitie
s on which th
e company
has m
inim
ized the tax rate exchange risk by
con
tractin
g de
rivative he
dging instrumen
ts (swaps).
(2)
Loans related
to th
e compliance of coven
ants, are disc
losed in note 36.6
Debtor Tax
Iden
tification
Num
ber
Debtor
Debtor
coun
try
Cred
itor T
ax
Iden
tification
Num
ber
Cred
itor (ba
nk)
Cred
itor
coun
try
Curren
cy
Amortization
type
Up to
90 days
Over 9
0 da
ys to
1
year
Curren
t po
rtion
1 to 2
years
2 to 3
years
3 to 4
years
4 to 5
years
More
than
5
years
Non
‐curren
t po
rtion
Total
debt
Average an
nual
interest ra
te
ThUS$
Th
US$
Th
US$
Th
US$
Th
US$
Th
US$
Th
US$
Th
US$
Th
US$
Th
US$
Nom
inal
Effective
96.696
.270
‐4
Inmob
iliaria M
arítima Po
rtuaria
Limita
da
Chile
97.030
.000
‐7
Banco Estado
Ch
ile
UF
Mon
thly
33
100
133
139
145
63
‐ ‐
347
480
4.5%
4.5%
96.915
.330
‐0
Iquiqu
e Term
inal Internaciona
l SA
Chile
97.023
.000
‐9
Banco Créd
ito e
Inversione
s Ch
ile
US Do
llar
Semi‐a
nnual
‐ 147
147
2,58
3 2,58
3 2,58
3 2,58
4 2,58
4 12
,917
13
,064
Libo
r+2.3%
4.93%
(1 and
2)
96.915
.330
‐0
Iquiqu
e Term
inal Internaciona
l SA
Chile
97.030
.000
‐7
Banco Estado
Ch
ile
US Do
llar
Semi‐a
nnual
‐ 3,11
4 3,11
4 2,99
1 2,99
1 2,99
2 ‐
‐ 8,97
4 12
,088
Libo
r+2.5%
3.08%
(2)
92.048
.000
‐4
SAAM
S.A.
Chile
97.006
.000
‐6
Banco Créd
ito e
Inversione
s Ch
ile
US Do
llar
Quarterly
3 10
,102
10
,105
‐
‐ ‐
‐ ‐
‐ 10
,105
4.00%
4.00%
(2)
92.048
.000
‐4
SAAM
S.A.
Chile
97.036
.000
‐K
Banco Santande
r Ch
ile
Chile
US Do
llar
Quarterly
2,21
4 2,11
4 4,32
8 ‐
‐ ‐
‐ ‐
‐ 4,32
8 4.68%
4.68%
92.048
.000
‐4
SAAM
S.A.
Chile
97.036
.000
‐K
Banco Santande
r Ch
ile
Chile
US Do
llar
Semi‐a
nnual
10
4,97
7 4,98
7 9,96
9 9,96
9 9,96
9 4,98
4 ‐
34,891
39
,878
Libo
r+1.48
%
1.72%
92.048
.000
‐4
SAAM
S.A.
Chile
97.036
.000
‐K
Banco Santande
r Ch
ile
Chile
US Do
llar
Quarterly
5,00
0 ‐
5,00
0 ‐
‐ ‐
‐ ‐
‐ 5,00
0 0.44%
0.44%
211 5515
2 0017
Kios S.A.
Uruguay
211307
1800
16
Santande
r Uruguay
US Do
llar
Mon
thly
650
‐ 650
‐ ‐
‐ ‐
‐ ‐
650
5.50%
5.50%
212 5515
2 0017
Kios S.A.
Uruguay
210124
4600
11
Cirtibank Uruguay
Uruguay
US Do
llar
Mon
thly
286
857
1,14
3 ‐
‐ ‐
‐ ‐
‐ 1,14
3 5.00%
5.00%
(2)
TMM12
0109
8F6
Term
inal M
arítima Mazatlán
S.A. de C.V.
Mexico
76.645
.030
‐K
Banco Ita
ú Ch
ile
Chile
US Do
llar
Semi‐a
nnual
‐ 3,17
1 3,17
1 3,00
0 3,00
0 3,00
0 3,00
0 ‐
12,000
15
,171
4.00%
4.00%
(2)
SRE97010
8SXA
SA
AM Rem
olqu
es S. A
. de C. V.
México
0‐E
BANCO
BA
NCO
MER
MEXICO
Mexico
Mexican
pe
so
Quarterly
79
‐ 79
‐
‐ ‐
‐ ‐
‐ 79
TIE 28+2.8%
7.58%
(2)
SRE97010
8SXA
SA
AM Rem
olqu
es S. A
. de C. V.
México
0‐E
BANCO
BA
NCO
MER
MEXICO
Mexico
Mexican
pe
so
Quarterly
296
‐ 296
‐ ‐
‐ ‐
‐ ‐
296
TIE 28+2.8%
7.58%
(2)
SRE97010
8SXA
SA
AM Rem
olqu
es S. A
. de C. V.
México
0‐E
Banco Inbu
rsa
Mexico
US Do
llar
Semi‐a
nnual
‐ 4,11
4 4,11
4 4,00
0 4,00
0 2,00
0 ‐
‐ 10
,000
14
,114
4.60%
4.60%
(2)
SRE97010
8SXA
SA
AM Rem
olqu
es S. A
. de C. V.
México
0‐E
Corpbanca New
York Branch
Mexico
US Do
llar
Semi‐a
nnual
713
‐ 713
‐ 8,00
0 8,00
0 8,00
0 16
,000
40
,000
40
,713
Libo
r +3.00
%
3.33%
(2)
099224
7932
001
Inarpi S.A.
Ecuado
r 0‐E
Banco Estado
Ch
ile
US Do
llar
Semi‐a
nnual
‐ 2,08
6 2,08
6 1,89
4 1,89
4 3,78
9 6,63
2 ‐
14,209
16
,295
Libo
r +2.83
%
4.97%
(1)
099224
7932
001
Inarpi S.A.
Ecuado
r 0‐E
Banco BC
I Ch
ile
US Do
llar
Semi‐a
nnual
‐ 39
39
625
1,25
0 3,12
5 ‐
‐ 5,00
0 5,03
9 Libo
r +2.69
%
3.02%
099224
7932
001
Inarpi S.A.
Ecuado
r 0‐E
Banco BC
I Ch
ile
US Do
llar
Semi‐a
nnual
‐ 21
21
375
750
1,87
5 ‐
‐ 3,00
0 3,02
1 Libo
r +2.4%
2.73%
Sm
it Marine Canadá
Inc
Canadá
0‐E
Banck is AB
N
AMRO
Canada
Canadian
Do
llar
Mon
thly
797
‐ 797
‐ ‐
‐ ‐
‐ ‐
797
2.1%
2.1%
40,923
141,338
182,261
188
2014 Annual Report
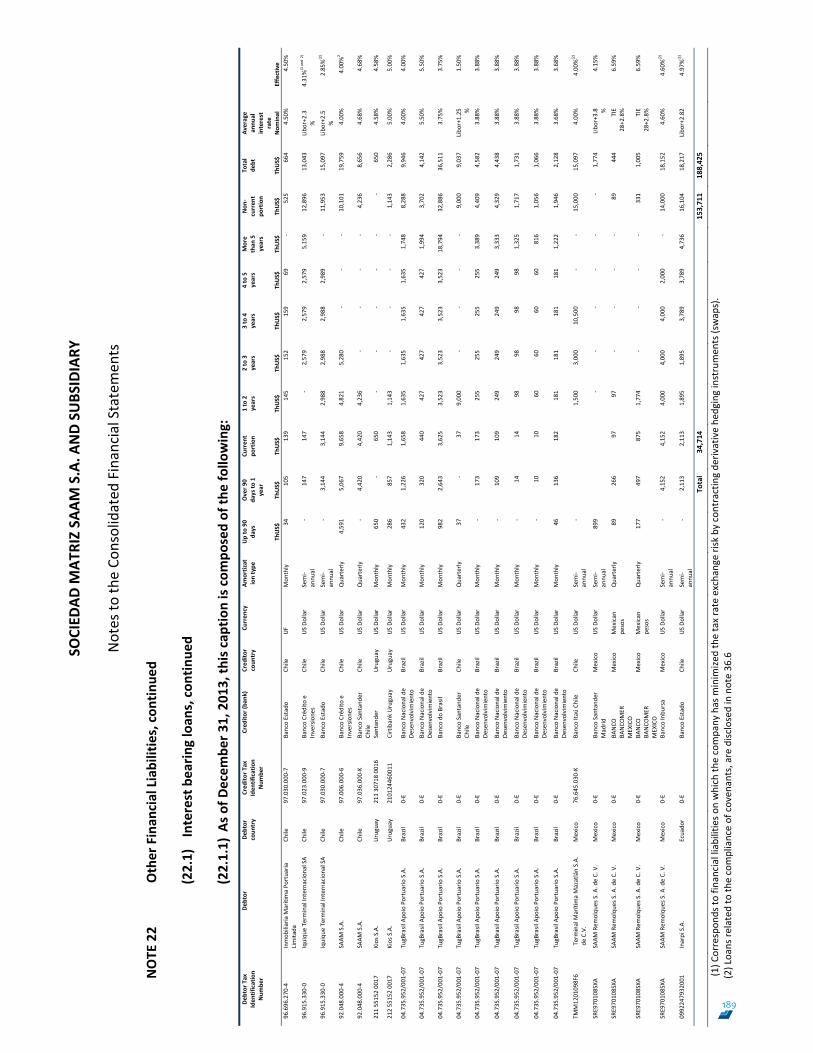
SOCIED
AD M
ATRIZ SA
AM S.A. A
ND SU
BSIDIARY
Notes to
the Co
nsolidated
Financial Statemen
ts
97
NOTE
22
Other Finan
cial Liabilities, con
tinue
d
(22.1) Interest bearin
g loan
s
(22.1.1) A
s of D
ecem
ber 3
1, 201
4, th
is cap
tion is com
posed of th
e follo
wing:
(1)
Correspo
nds to fin
ancial liabilitie
s on which th
e company
has m
inim
ized the tax rate exchange risk by
con
tractin
g de
rivative he
dging instrumen
ts (swaps).
(2)
Loans related
to th
e compliance of coven
ants, are disc
losed in note 36.6
Debtor Tax
Iden
tification
Num
ber
Debtor
Debtor
coun
try
Cred
itor T
ax
Iden
tification
Num
ber
Cred
itor (ba
nk)
Cred
itor
coun
try
Curren
cy
Amortization
type
Up to
90 days
Over 9
0 da
ys to
1
year
Curren
t po
rtion
1 to 2
years
2 to 3
years
3 to 4
years
4 to 5
years
More
than
5
years
Non
‐curren
t po
rtion
Total
debt
Average an
nual
interest ra
te
ThUS$
Th
US$
Th
US$
Th
US$
Th
US$
Th
US$
Th
US$
Th
US$
Th
US$
Th
US$
Nom
inal
Effective
96.696
.270
‐4
Inmob
iliaria M
arítima Po
rtuaria
Limita
da
Chile
97.030
.000
‐7
Banco Estado
Ch
ile
UF
Mon
thly
33
100
133
139
145
63
‐ ‐
347
480
4.5%
4.5%
96.915
.330
‐0
Iquiqu
e Term
inal Internaciona
l SA
Chile
97.023
.000
‐9
Banco Créd
ito e
Inversione
s Ch
ile
US Do
llar
Semi‐a
nnual
‐ 147
147
2,58
3 2,58
3 2,58
3 2,58
4 2,58
4 12
,917
13
,064
Libo
r+2.3%
4.93%
(1 and
2)
96.915
.330
‐0
Iquiqu
e Term
inal Internaciona
l SA
Chile
97.030
.000
‐7
Banco Estado
Ch
ile
US Do
llar
Semi‐a
nnual
‐ 3,11
4 3,11
4 2,99
1 2,99
1 2,99
2 ‐
‐ 8,97
4 12
,088
Libo
r+2.5%
3.08%
(2)
92.048
.000
‐4
SAAM
S.A.
Chile
97.006
.000
‐6
Banco Créd
ito e
Inversione
s Ch
ile
US Do
llar
Quarterly
3 10
,102
10
,105
‐
‐ ‐
‐ ‐
‐ 10
,105
4.00%
4.00%
(2)
92.048
.000
‐4
SAAM
S.A.
Chile
97.036
.000
‐K
Banco Santande
r Ch
ile
Chile
US Do
llar
Quarterly
2,21
4 2,11
4 4,32
8 ‐
‐ ‐
‐ ‐
‐ 4,32
8 4.68%
4.68%
92.048
.000
‐4
SAAM
S.A.
Chile
97.036
.000
‐K
Banco Santande
r Ch
ile
Chile
US Do
llar
Semi‐a
nnual
10
4,97
7 4,98
7 9,96
9 9,96
9 9,96
9 4,98
4 ‐
34,891
39
,878
Libo
r+1.48
%
1.72%
92.048
.000
‐4
SAAM
S.A.
Chile
97.036
.000
‐K
Banco Santande
r Ch
ile
Chile
US Do
llar
Quarterly
5,00
0 ‐
5,00
0 ‐
‐ ‐
‐ ‐
‐ 5,00
0 0.44%
0.44%
211 5515
2 0017
Kios S.A.
Uruguay
211307
1800
16
Santande
r Uruguay
US Do
llar
Mon
thly
650
‐ 650
‐ ‐
‐ ‐
‐ ‐
650
5.50%
5.50%
212 5515
2 0017
Kios S.A.
Uruguay
210124
4600
11
Cirtibank Uruguay
Uruguay
US Do
llar
Mon
thly
286
857
1,14
3 ‐
‐ ‐
‐ ‐
‐ 1,14
3 5.00%
5.00%
(2)
TMM12
0109
8F6
Term
inal M
arítima Mazatlán
S.A. de C.V.
Mexico
76.645
.030
‐K
Banco Ita
ú Ch
ile
Chile
US Do
llar
Semi‐a
nnual
‐ 3,17
1 3,17
1 3,00
0 3,00
0 3,00
0 3,00
0 ‐
12,000
15
,171
4.00%
4.00%
(2)
SRE97010
8SXA
SA
AM Rem
olqu
es S. A
. de C. V.
México
0‐E
BANCO
BA
NCO
MER
MEXICO
Mexico
Mexican
pe
so
Quarterly
79
‐ 79
‐
‐ ‐
‐ ‐
‐ 79
TIE 28+2.8%
7.58%
(2)
SRE97010
8SXA
SA
AM Rem
olqu
es S. A
. de C. V.
México
0‐E
BANCO
BA
NCO
MER
MEXICO
Mexico
Mexican
pe
so
Quarterly
296
‐ 296
‐ ‐
‐ ‐
‐ ‐
296
TIE 28+2.8%
7.58%
(2)
SRE97010
8SXA
SA
AM Rem
olqu
es S. A
. de C. V.
México
0‐E
Banco Inbu
rsa
Mexico
US Do
llar
Semi‐a
nnual
‐ 4,11
4 4,11
4 4,00
0 4,00
0 2,00
0 ‐
‐ 10
,000
14
,114
4.60%
4.60%
(2)
SRE97010
8SXA
SA
AM Rem
olqu
es S. A
. de C. V.
México
0‐E
Corpbanca New
York Branch
Mexico
US Do
llar
Semi‐a
nnual
713
‐ 713
‐ 8,00
0 8,00
0 8,00
0 16
,000
40
,000
40
,713
Libo
r +3.00
%
3.33%
(2)
099224
7932
001
Inarpi S.A.
Ecuado
r 0‐E
Banco Estado
Ch
ile
US Do
llar
Semi‐a
nnual
‐ 2,08
6 2,08
6 1,89
4 1,89
4 3,78
9 6,63
2 ‐
14,209
16
,295
Libo
r +2.83
%
4.97%
(1)
099224
7932
001
Inarpi S.A.
Ecuado
r 0‐E
Banco BC
I Ch
ile
US Do
llar
Semi‐a
nnual
‐ 39
39
625
1,25
0 3,12
5 ‐
‐ 5,00
0 5,03
9 Libo
r +2.69
%
3.02%
099224
7932
001
Inarpi S.A.
Ecuado
r 0‐E
Banco BC
I Ch
ile
US Do
llar
Semi‐a
nnual
‐ 21
21
375
750
1,87
5 ‐
‐ 3,00
0 3,02
1 Libo
r +2.4%
2.73%
Sm
it Marine Canadá
Inc
Canadá
0‐E
Banck is AB
N
AMRO
Canada
Canadian
Do
llar
Mon
thly
797
‐ 797
‐ ‐
‐ ‐
‐ ‐
797
2.1%
2.1%
40,923
141,338
182,261
SOCIED
AD M
ATRIZ SA
AM S.A. A
ND SU
BSIDIARY
Notes to
the Co
nsolidated
Financial Statemen
ts
98
NOTE
22
Other Finan
cial Liabilities, con
tinue
d
(22.1) Interest bearin
g loan
s, con
tinue
d
(22.1.1) A
s of D
ecem
ber 3
1, 201
3, th
is cap
tion is com
posed of th
e follo
wing:
(1) C
orrespon
ds to
financial liabilities o
n which th
e company
has m
inim
ized the tax rate exchange risk by
con
tractin
g de
rivative he
dging instrumen
ts (swaps).
(2) Loans re
lated to th
e compliance of coven
ants, are disc
losed in note 36
.6
Debtor Tax
Iden
tification
Num
ber
Debtor
Debtor
coun
try
Cred
itor T
ax
Iden
tification
Num
ber
Cred
itor (ba
nk)
Cred
itor
coun
try
Curren
cy
Amortizat
ion type
Up to 90
days
Over 9
0 da
ys to
1
year
Curren
t po
rtion
1 to 2
years
2 to 3
years
3 to 4
years
4 to 5
years
More
than
5
years
Non
‐curren
t po
rtion
Total
debt
Average
annu
al
interest
rate
ThUS$
Th
US$
Th
US$
Th
US$
Th
US$
Th
US$
Th
US$
Th
US$
Th
US$
Th
US$
Nom
inal
Effective
96.696
.270
‐4
Inmob
iliaria M
arítima Po
rtuaria
Limita
da
Chile
97.030
.000
‐7
Banco Estado
Ch
ile
UF
Mon
thly
34
105
139
145
152
159
69
‐ 525
664
4.50%
4.50%
96.915
.330
‐0
Iquiqu
e Term
inal Internaciona
l SA
Chile
97.023
.000
‐9
Banco Créd
ito e
Inversione
s Ch
ile
US Do
llar
Semi‐
annu
al
‐ 147
147
‐ 2,57
9 2,57
9 2,57
9 5,15
9 12
,896
13
,043
Libo
r+2.3
%
4.31%
(1 and
2)
96.915
.330
‐0
Iquiqu
e Term
inal Internaciona
l SA
Chile
97.030
.000
‐7
Banco Estado
Ch
ile
US Do
llar
Semi‐
annu
al
‐ 3,14
4 3,14
4 2,98
8 2,98
8 2,98
8 2,98
9 ‐
11,953
15
,097
Libo
r+2.5
%
2.85%
(2)
92.048
.000
‐4
SAAM
S.A.
Chile
97.006
.000
‐6
Banco Créd
ito e
Inversione
s Ch
ile
US Do
llar
Quarterly
4,59
1 5,06
7 9,65
8 4,82
1 5,28
0 ‐
‐ ‐
10,101
19
,759
4.00%
4.00%
2
92.048
.000
‐4
SAAM
S.A.
Chile
97.036
.000
‐K
Banco Santande
r Ch
ile
Chile
US Do
llar
Quarterly
‐ 4,42
0 4,42
0 4,23
6 ‐
‐ ‐
‐ 4,23
6 8,65
6 4.68%
4.68%
211 5515
2 0017
Kios S.A.
Uruguay
211 3071
8 0016
Santande
r Uruguay
US Do
llar
Mon
thly
650
‐ 650
‐ ‐
‐ ‐
‐ ‐
650
4.58%
4.58%
212 5515
2 0017
Kios S.A.
Uruguay
210124
4600
11
Cirtibank Uruguay
Uruguay
US Do
llar
Mon
thly
286
857
1,14
3 1,14
3 ‐
‐ ‐
‐ 1,14
3 2,28
6 5.00%
5.00%
04.735.952/001
‐07
TugBrasil Apo
io Portuario S.A.
Brazil
0‐E
Banco Nacional de
Desenvolvimiento
Brazil
US Do
llar
Mon
thly
432
1,22
6 1,65
8 1,63
5 1,63
5 1,63
5 1,63
5 1,74
8 8,28
8 9,94
6 4.00%
4.00%
04.735.952/001
‐07
TugBrasil Apo
io Portuario S.A.
Brazil
0‐E
Banco Nacional de
Desenvolvimiento
Brazil
US Do
llar
Mon
thly
120
320
440
427
427
427
427
1,99
4 3,70
2 4,14
2 5.50%
5.50%
04.735.952/001
‐07
TugBrasil Apo
io Portuario S.A.
Brazil
0‐E
Banco do
Brasil
Brazil
US Do
llar
Mon
thly
982
2,64
3 3,62
5 3,52
3 3,52
3 3,52
3 3,52
3 18
,794
32
,886
36
,511
3.75%
3.75%
04.735.952/001
‐07
TugBrasil Apo
io Portuario S.A.
Brazil
0‐E
Banco Santande
r Ch
ile
Chile
US Do
llar
Quarterly
37
‐ 37
9,00
0 ‐
‐ ‐
‐ 9,00
0 9,03
7 Libo
r+1.25 %
1.50%
04.735.952/001
‐07
TugBrasil Apo
io Portuario S.A.
Brazil
0‐E
Banco Nacional de
Desenvolvimiento
Brazil
US Do
llar
Mon
thly
‐ 173
173
255
255
255
255
3,38
9 4,40
9 4,58
2 3.88%
3.88%
04.735.952/001
‐07
TugBrasil Apo
io Portuario S.A.
Brazil
0‐E
Banco Nacional de
Desenvolvimiento
Brazil
US Do
llar
Mon
thly
‐ 109
109
249
249
249
249
3,33
3 4,32
9 4,43
8 3.88%
3.88%
04.735.952/001
‐07
TugBrasil Apo
io Portuario S.A.
Brazil
0‐E
Banco Nacional de
Desenvolvimiento
Brazil
US Do
llar
Mon
thly
‐ 14
14
98
98
98
98
1,32
5 1,71
7 1,73
1 3.88%
3.88%
04.735.952/001
‐07
TugBrasil Apo
io Portuario S.A.
Brazil
0‐E
Banco Nacional de
Desenvolvimiento
Brazil
US Do
llar
Mon
thly
‐ 10
10
60
60
60
60
816
1,05
6 1,06
6 3.88%
3.88%
04.735.952/001
‐07
TugBrasil Apo
io Portuario S.A.
Brazil
0‐E
Banco Nacional de
Desenvolvimiento
Brazil
US Do
llar
Mon
thly
46
136
182
181
181
181
181
1,22
2 1,94
6 2,12
8 3.68%
3.68%
TMM12
0109
8F6
Term
inal M
arítima Mazatlán S.A.
de C.V.
Mexico
76.645
.030
‐K
Banco Ita
ú Ch
ile
Chile
US Do
llar
Semi‐
annu
al
‐
1,50
0 3,00
0 10
,500
‐
‐ 15
,000
15
,097
4.00%
4.00%
(2)
SRE97010
8SXA
SA
AM Rem
olqu
es S. A
. de C. V.
Mexico
0‐E
Banco Santande
r Madrid
Mexico
US Do
llar
Semi‐
annu
al
899
‐ ‐
‐ ‐
‐ ‐
1,77
4 Libo
r+3.8 %
4.15%
SRE97010
8SXA
SA
AM Rem
olqu
es S. A
. de C. V.
Mexico
0‐E
BANCO
BA
NCO
MER
MEXICO
Mexico
Mexican
pe
sos
Quarterly
89
266
97
97
‐ ‐
‐ ‐
89
444
TIE
28+2.8%
6.59%
SRE97010
8SXA
SA
AM Rem
olqu
es S. A
. de C. V.
Mexico
0‐E
BANCO
BA
NCO
MER
MEXICO
Mexico
Mexican
pe
sos
Quarterly
177
497
875
1,77
4 ‐
‐ ‐
‐ 331
1,00
5 TIE
28+2.8%
6.59%
SRE97010
8SXA
SA
AM Rem
olqu
es S. A
. de C. V.
Mexico
0‐E
Banco Inbu
rsa
Mexico
US Do
llar
Semi‐
annu
al
‐ 4,15
2 4,15
2 4,00
0 4,00
0 4,00
0 2,00
0 ‐
14,000
18
,152
4.60%
4.60%
(2)
099224
7932
001
Inarpi S.A.
Ecuado
r 0‐E
Banco Estado
Ch
ile
US Do
llar
Semi‐
annu
al
‐ 2,11
3 2,11
3 1,89
5 1,89
5 3,78
9 3,78
9 4,73
6 16
,104
18
,217
Libo
r+2.82
4.97%
(1)
To
tal
34,714
153,711
188,425
189
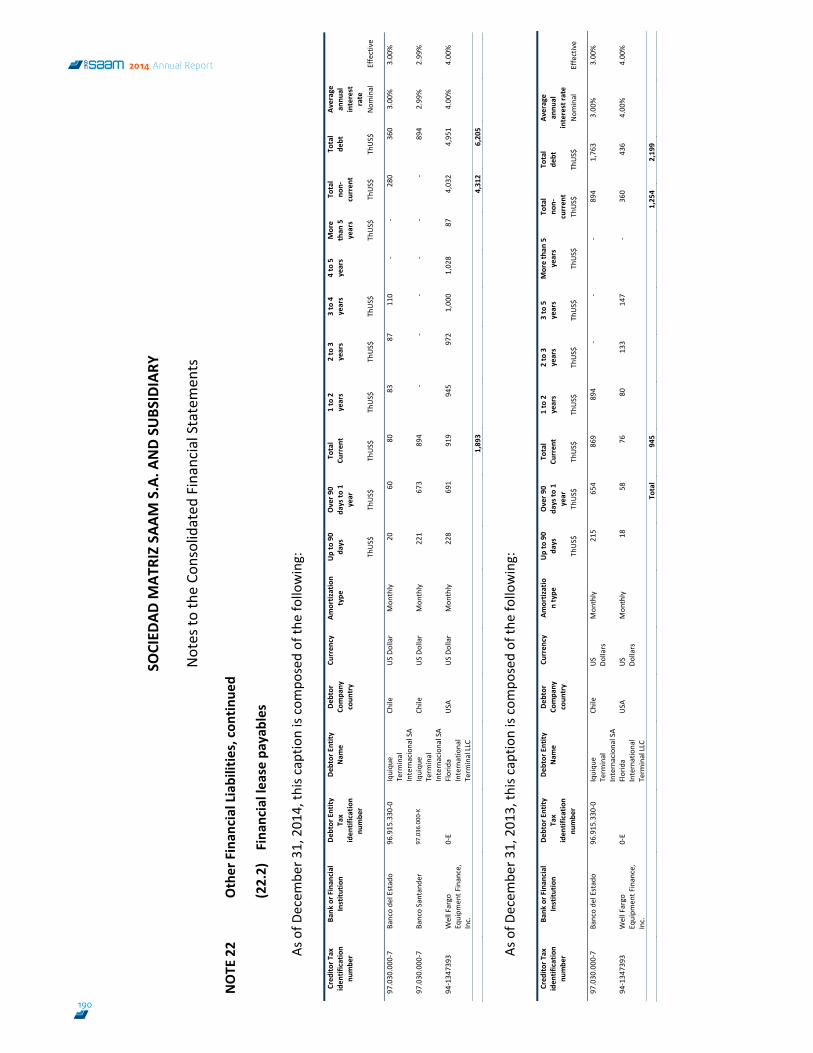
SOCIED
AD M
ATRIZ SA
AM S.A. A
ND SU
BSIDIARY
Notes to
the Co
nsolidated
Financial Statemen
ts
99
NOTE
22
Other Finan
cial Liabilities, con
tinue
d
(22.2) Fina
ncial lease payab
les
As of D
ecem
ber 3
1, 201
4, th
is caption is compo
sed of th
e following:
Cred
itor T
ax
iden
tification
numbe
r
Bank
or F
inan
cial
Institu
tion
Debtor Entity
Tax
iden
tification
numbe
r
Debtor Entity
Nam
e
Debtor
Compa
ny
coun
try
Curren
cy
Am
ortization
type
Up to 90
days
Over 9
0 da
ys to
1
year
Total
Curren
t 1 to 2
years
2 to 3
years
3 to 4
years
4 to 5
years
More
than
5
years
Total
non‐
curren
t
Total
debt
Average
annu
al
interest
rate
ThUS$
ThUS$
ThUS$
ThUS$
ThUS$
ThUS$
Th
US$
ThUS$
ThUS$
Nom
inal
Effe
ctive
97.030
.000
‐7
Banco de
l Estado
96.915
.330
‐0
Iquiqu
e Term
inal
Internacional SA
Chile
US Do
llar
Mon
thly
20
60
80
83
87
110
‐ ‐
280
360
3.00
%
3.00
%
97.030
.000
‐7
Banco Santande
r 97
.036
.000
‐K
Iquiqu
e Term
inal
Internacional SA
Chile
US Do
llar
Mon
thly
221
673
894
‐ ‐
‐ ‐
‐ ‐
894
2.99
%
2.99
%
94‐134
7393
Well Fargo
Eq
uipm
ent F
inance,
Inc.
0‐E
Florida
International
Term
inal LLC
USA
US Do
llar
Mon
thly
228
691
919
945
972
1,00
0 1,02
8 87
4,03
2 4,95
1 4.00
%
4.00
%
1,89
3
4,31
2 6,20
5
As of D
ecem
ber 3
1, 201
3, th
is caption is compo
sed of th
e following:
Cred
itor T
ax
iden
tification
numbe
r
Bank
or F
inan
cial
Institu
tion
Debtor Entity
Tax
iden
tification
numbe
r
Debtor Entity
Nam
e
Debtor
Compa
ny
coun
try
Curren
cy
Am
ortizatio
n type
Up to 90
days
Over 9
0 da
ys to
1
year
Total
Curren
t 1 to 2
years
2 to 3
years
3 to 5
years
More than
5
years
Total
non‐
curren
t
Total
debt
Average
annu
al
interest ra
te
ThUS$
ThUS$
ThUS$
ThUS$
ThUS$
ThUS$
ThUS$
ThUS$
ThUS$
Nom
inal
Effective
97.030
.000
‐7
Banco de
l Estado
96.915
.330
‐0
Iquiqu
e Term
inal
Internacional SA
Chile
US
Dollars
Mon
thly
215
654
869
894
‐ ‐
‐ 89
4 1,76
3 3.00
%
3.00
%
94‐134
7393
Well Fargo
Eq
uipm
ent F
inance,
Inc.
0‐E
Florida
International
Term
inal LLC
USA
US
Dollars
Mon
thly
18
58
76
80
133
147
‐ 36
0 43
6 4.00
%
4.00
%
Total
945
1,25
4 2,19
9
190
2014 Annual Report
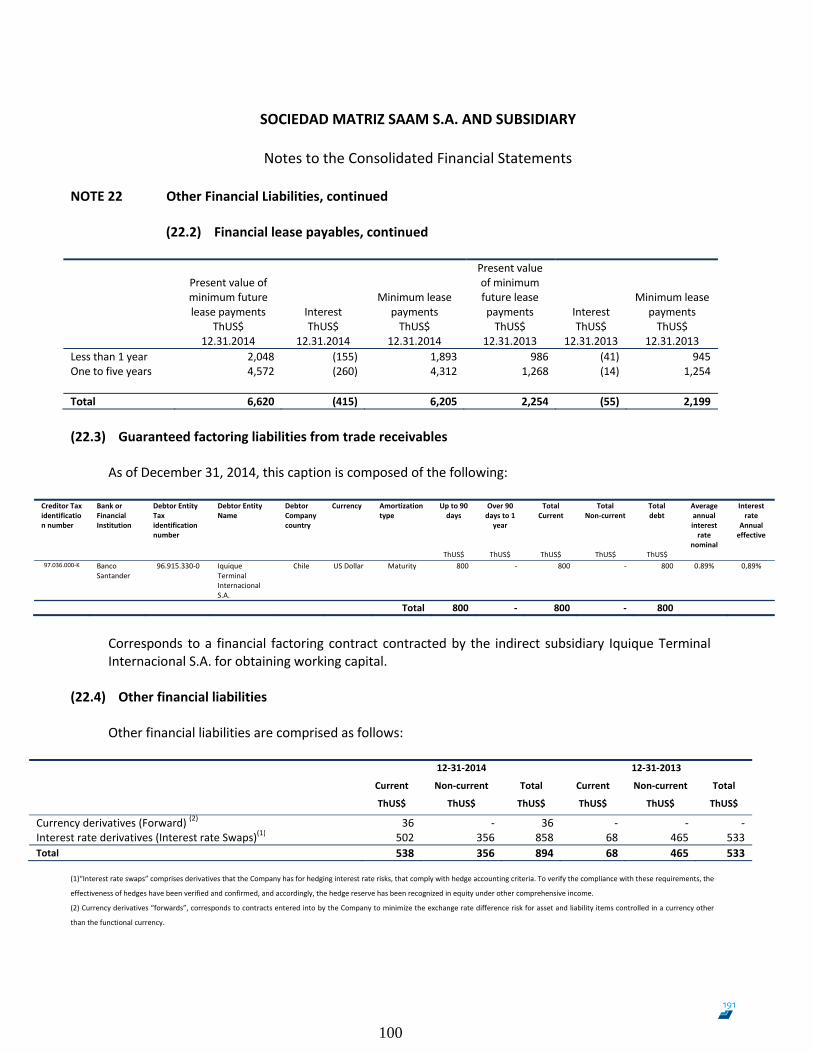
SOCIEDAD MATRIZ SAAM S.A. AND SUBSIDIARY
Notes to the Consolidated Financial Statements
100
NOTE 22 Other Financial Liabilities, continued
(22.2) Financial lease payables, continued
Present value of minimum future lease payments
ThUS$ 12.31.2014
Interest ThUS$
12.31.2014
Minimum lease payments ThUS$
12.31.2014
Present value of minimum future lease payments ThUS$
12.31.2013
Interest ThUS$
12.31.2013
Minimum lease payments ThUS$
12.31.2013 Less than 1 year 2,048 (155) 1,893 986 (41) 945 One to five years 4,572 (260) 4,312 1,268 (14) 1,254 Total 6,620 (415) 6,205 2,254 (55) 2,199 (22.3) Guaranteed factoring liabilities from trade receivables
As of December 31, 2014, this caption is composed of the following:
Creditor Tax identification number
Bank or Financial Institution
Debtor Entity Tax identification number
Debtor Entity Name
Debtor Company country
Currency Amortization type
Up to 90 days
Over 90 days to 1 year
Total Current
Total Non‐current
Total debt
Average annual interest rate
nominal
Interest rate
Annual effective
ThUS$ ThUS$ ThUS$ ThUS$ ThUS$ 97.036.000‐K Banco
Santander 96.915.330‐0 Iquique
Terminal Internacional S.A.
Chile US Dollar Maturity 800 ‐ 800 ‐ 800 0.89% 0,89%
Total 800 ‐ 800 ‐ 800
Corresponds to a financial factoring contract contracted by the indirect subsidiary Iquique Terminal Internacional S.A. for obtaining working capital.
(22.4) Other financial liabilities
Other financial liabilities are comprised as follows:
12‐31‐2014 12‐31‐2013
Current Non‐current Total Current Non‐current Total
ThUS$ ThUS$ ThUS$ ThUS$ ThUS$ ThUS$
Currency derivatives (Forward) (2) 36 ‐ 36 ‐ ‐ ‐ Interest rate derivatives (Interest rate Swaps)(1) 502 356 858 68 465 533 Total 538 356 894 68 465 533
(1)“Interest rate swaps” comprises derivatives that the Company has for hedging interest rate risks, that comply with hedge accounting criteria. To verify the compliance with these requirements, the
effectiveness of hedges have been verified and confirmed, and accordingly, the hedge reserve has been recognized in equity under other comprehensive income.
(2) Currency derivatives “forwards”, corresponds to contracts entered into by the Company to minimize the exchange rate difference risk for asset and liability items controlled in a currency other
than the functional currency.
191
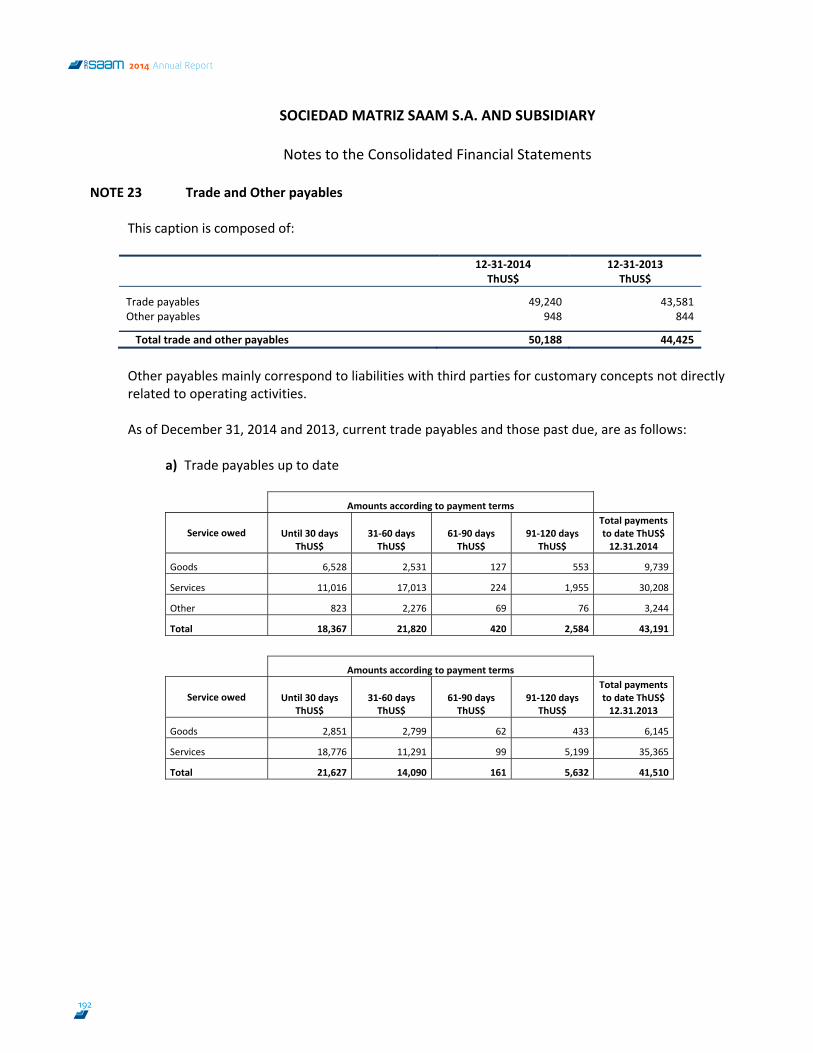
SOCIEDAD MATRIZ SAAM S.A. AND SUBSIDIARY
Notes to the Consolidated Financial Statements
101
NOTE 23 Trade and Other payables
This caption is composed of:
Other payables mainly correspond to liabilities with third parties for customary concepts not directly related to operating activities. As of December 31, 2014 and 2013, current trade payables and those past due, are as follows:
a) Trade payables up to date
Amounts according to payment terms
Service owed Until 30 days ThUS$
31‐60 days ThUS$
61‐90 days ThUS$
91‐120 days ThUS$
Total payments to date ThUS$ 12.31.2014
Goods 6,528 2,531 127 553 9,739
Services 11,016 17,013 224 1,955 30,208
Other 823 2,276 69 76 3,244
Total 18,367 21,820 420 2,584 43,191
Amounts according to payment terms
Service owed Until 30 days ThUS$
31‐60 days ThUS$
61‐90 days ThUS$
91‐120 days ThUS$
Total payments to date ThUS$ 12.31.2013
Goods 2,851 2,799 62 433 6,145
Services 18,776 11,291 99 5,199 35,365
Total 21,627 14,090 161 5,632 41,510
12‐31‐2014 ThUS$
12‐31‐2013 ThUS$
Trade payables 49,240 43,581 Other payables 948 844 Total trade and other payables 50,188 44,425
192
2014 Annual Report
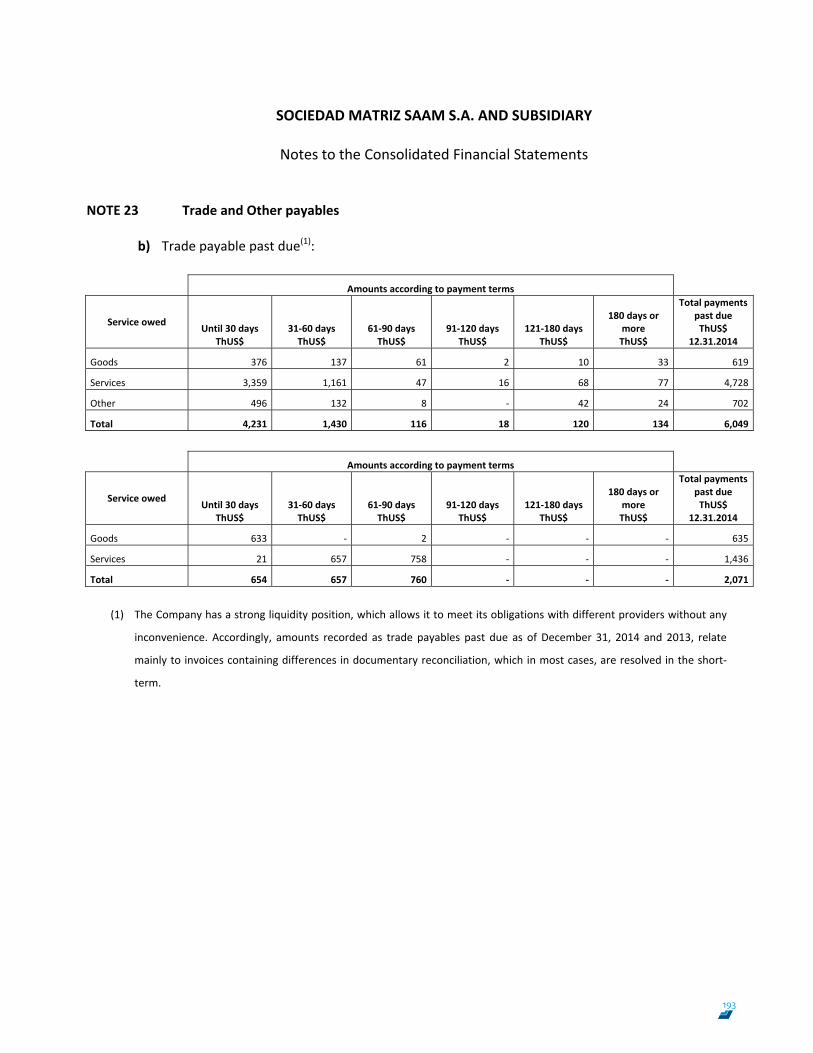
SOCIEDAD MATRIZ SAAM S.A. AND SUBSIDIARY
Notes to the Consolidated Financial Statements
102
NOTE 23 Trade and Other payables
b) Trade payable past due(1):
Amounts according to payment terms
Service owed Until 30 days ThUS$
31‐60 days ThUS$
61‐90 days ThUS$
91‐120 days ThUS$
121‐180 days ThUS$
180 days or more ThUS$
Total payments past due ThUS$
12.31.2014
Goods 376 137 61 2 10 33 619
Services 3,359 1,161 47 16 68 77 4,728
Other 496 132 8 ‐ 42 24 702
Total 4,231 1,430 116 18 120 134 6,049
Amounts according to payment terms
Service owed Until 30 days ThUS$
31‐60 days ThUS$
61‐90 days ThUS$
91‐120 days ThUS$
121‐180 days ThUS$
180 days or more ThUS$
Total payments past due ThUS$
12.31.2014
Goods 633 ‐ 2 ‐ ‐ ‐ 635
Services 21 657 758 ‐ ‐ ‐ 1,436
Total 654 657 760 ‐ ‐ ‐ 2,071
(1) The Company has a strong liquidity position, which allows it to meet its obligations with different providers without any
inconvenience. Accordingly, amounts recorded as trade payables past due as of December 31, 2014 and 2013, relate
mainly to invoices containing differences in documentary reconciliation, which in most cases, are resolved in the short‐
term.
193
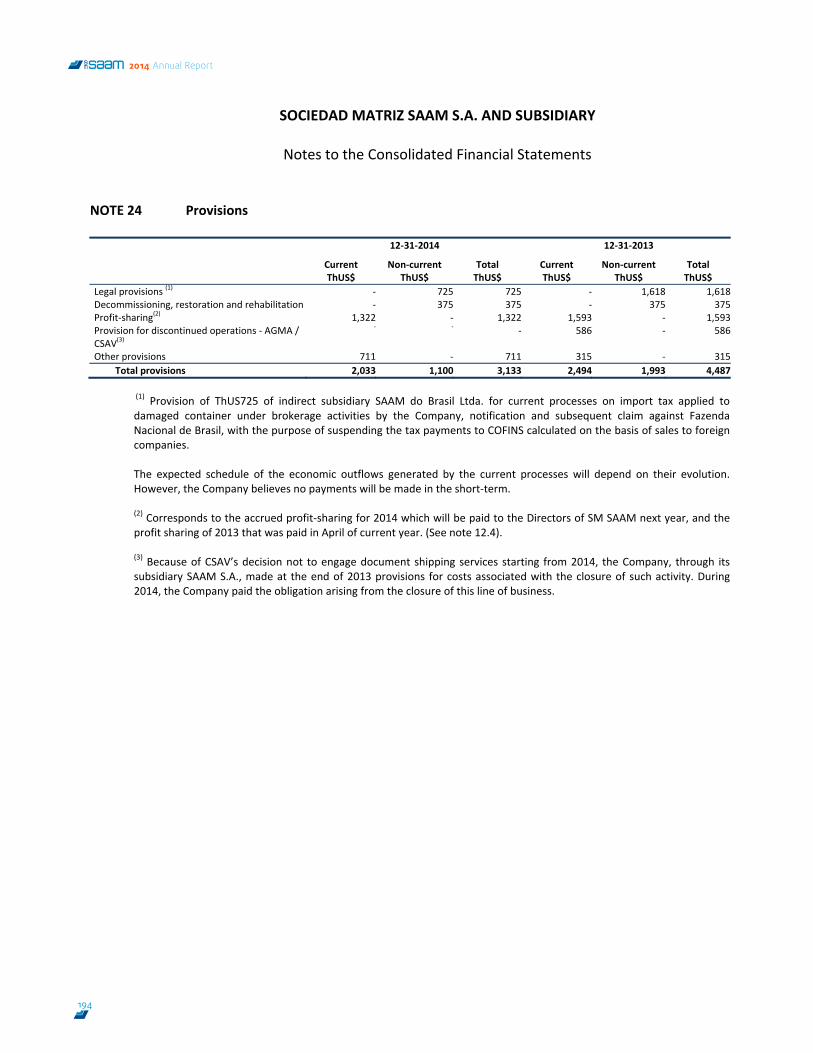
SOCIEDAD MATRIZ SAAM S.A. AND SUBSIDIARY
Notes to the Consolidated Financial Statements
103
NOTE 24 Provisions
12‐31‐2014 12‐31‐2013
CurrentThUS$
Non‐currentThUS$
TotalThUS$
Current ThUS$
Non‐currentThUS$
TotalThUS$
Legal provisions (1) ‐ 725 725 ‐ 1,618 1,618Decommissioning, restoration and rehabilitation ‐ 375 375 ‐ 375 375Profit‐sharing(2) 1,322 ‐ 1,322 1,593 ‐ 1,593Provision for discontinued operations ‐ AGMA / CSAV(3)
‐ ‐ ‐ 586 ‐ 586
Other provisions 711 ‐ 711 315 ‐ 315Total provisions 2,033 1,100 3,133 2,494 1,993 4,487
(1) Provision of ThUS725 of indirect subsidiary SAAM do Brasil Ltda. for current processes on import tax applied to damaged container under brokerage activities by the Company, notification and subsequent claim against Fazenda Nacional de Brasil, with the purpose of suspending the tax payments to COFINS calculated on the basis of sales to foreign companies. The expected schedule of the economic outflows generated by the current processes will depend on their evolution. However, the Company believes no payments will be made in the short‐term.
(2) Corresponds to the accrued profit‐sharing for 2014 which will be paid to the Directors of SM SAAM next year, and the profit sharing of 2013 that was paid in April of current year. (See note 12.4). (3) Because of CSAV’s decision not to engage document shipping services starting from 2014, the Company, through its subsidiary SAAM S.A., made at the end of 2013 provisions for costs associated with the closure of such activity. During 2014, the Company paid the obligation arising from the closure of this line of business.
194
2014 Annual Report
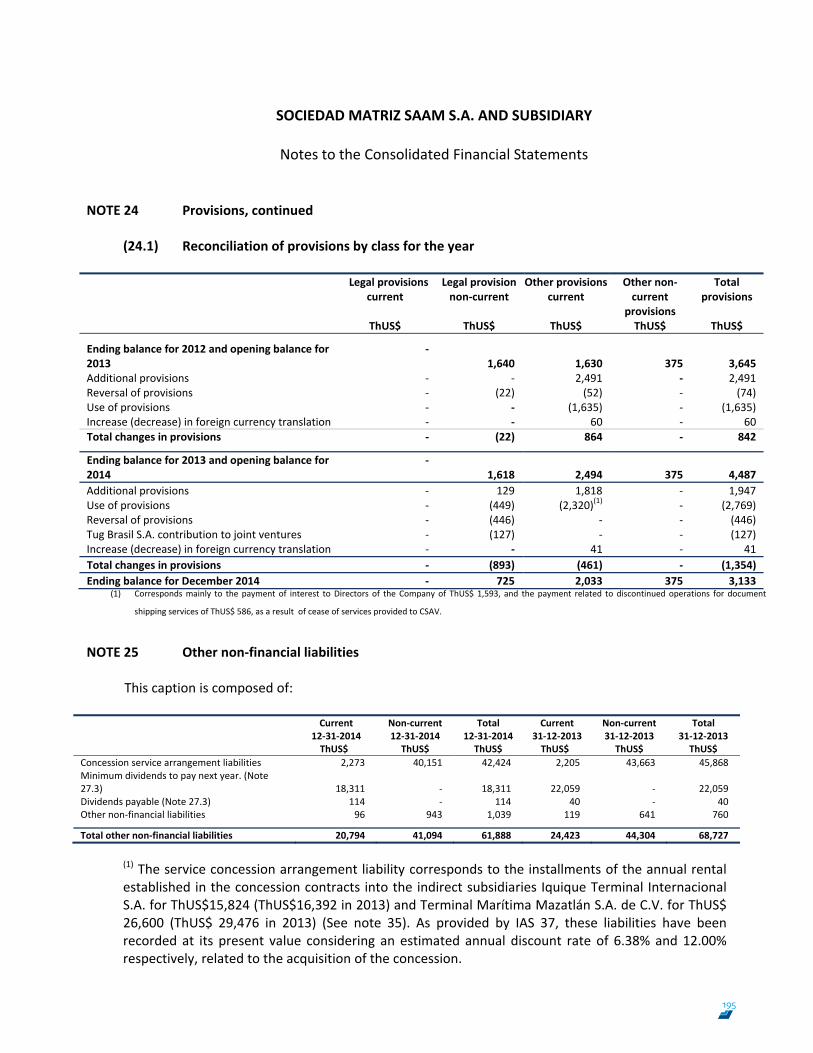
SOCIEDAD MATRIZ SAAM S.A. AND SUBSIDIARY
Notes to the Consolidated Financial Statements
104
NOTE 24 Provisions, continued
(24.1) Reconciliation of provisions by class for the year
Legal provisions current
ThUS$
Legal provision non‐current
ThUS$
Other provisions current
ThUS$
Other non‐current
provisions ThUS$
Total provisions
ThUS$
Ending balance for 2012 and opening balance for 2013
‐ 1,640 1,630 375 3,645
Additional provisions ‐ ‐ 2,491 ‐ 2,491 Reversal of provisions ‐ (22) (52) ‐ (74) Use of provisions ‐ ‐ (1,635) ‐ (1,635) Increase (decrease) in foreign currency translation ‐ ‐ 60 ‐ 60 Total changes in provisions ‐ (22) 864 ‐ 842 Ending balance for 2013 and opening balance for 2014
‐ 1,618 2,494 375 4,487
Additional provisions ‐ 129 1,818 ‐ 1,947 Use of provisions ‐ (449) (2,320)(1) ‐ (2,769) Reversal of provisions ‐ (446) ‐ ‐ (446) Tug Brasil S.A. contribution to joint ventures ‐ (127) ‐ ‐ (127) Increase (decrease) in foreign currency translation ‐ ‐ 41 ‐ 41 Total changes in provisions ‐ (893) (461) ‐ (1,354) Ending balance for December 2014 ‐ 725 2,033 375 3,133
(1) Corresponds mainly to the payment of interest to Directors of the Company of ThUS$ 1,593, and the payment related to discontinued operations for document
shipping services of ThUS$ 586, as a result of cease of services provided to CSAV.
NOTE 25 Other non‐financial liabilities
This caption is composed of:
Current Non‐current Total Current Non‐current Total 12‐31‐2014 12‐31‐2014 12‐31‐2014 31‐12‐2013 31‐12‐2013 31‐12‐2013
ThUS$ ThUS$ ThUS$ ThUS$ ThUS$ ThUS$Concession service arrangement liabilities 2,273 40,151 42,424 2,205 43,663 45,868Minimum dividends to pay next year. (Note 27.3) 18,311 ‐ 18,311 22,059 ‐ 22,059 Dividends payable (Note 27.3) 114 ‐ 114 40 ‐ 40Other non‐financial liabilities 96 943 1,039 119 641 760 Total other non‐financial liabilities 20,794 41,094 61,888 24,423 44,304 68,727
(1) The service concession arrangement liability corresponds to the installments of the annual rental established in the concession contracts into the indirect subsidiaries Iquique Terminal Internacional S.A. for ThUS$15,824 (ThUS$16,392 in 2013) and Terminal Marítima Mazatlán S.A. de C.V. for ThUS$ 26,600 (ThUS$ 29,476 in 2013) (See note 35). As provided by IAS 37, these liabilities have been recorded at its present value considering an estimated annual discount rate of 6.38% and 12.00% respectively, related to the acquisition of the concession.
195
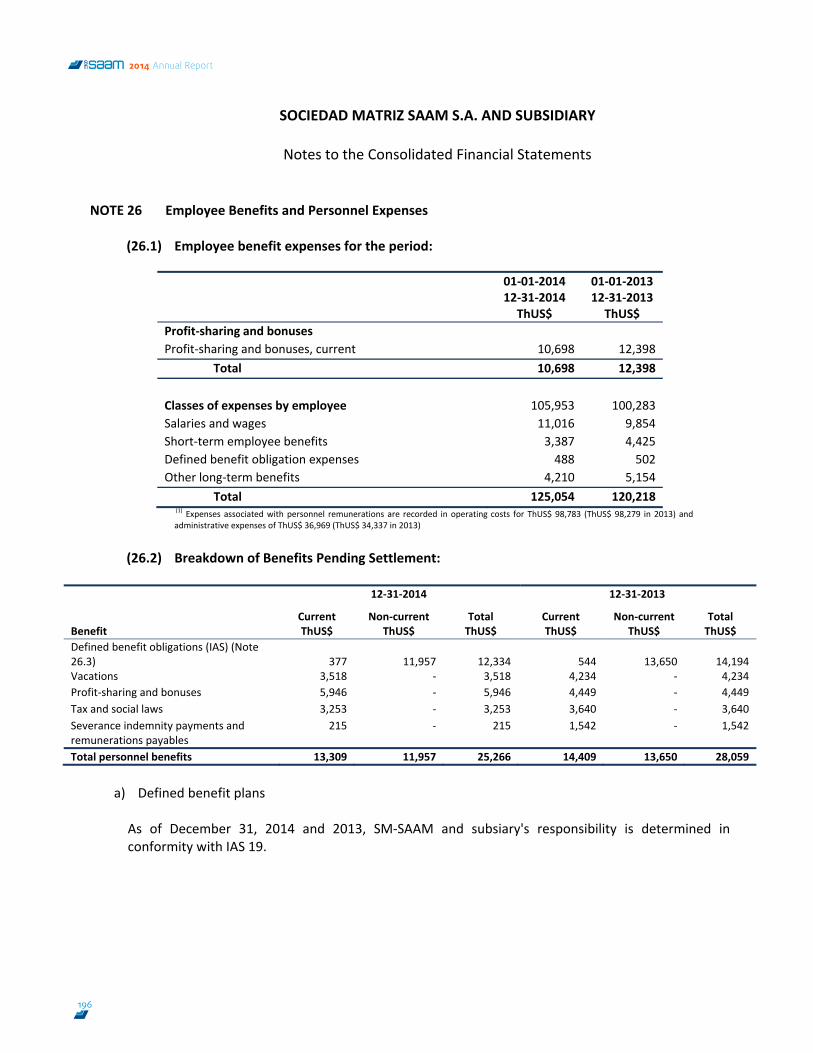
SOCIEDAD MATRIZ SAAM S.A. AND SUBSIDIARY
Notes to the Consolidated Financial Statements
105
NOTE 26 Employee Benefits and Personnel Expenses
(26.1) Employee benefit expenses for the period:
01‐01‐2014 12‐31‐2014 ThUS$
01‐01‐201312‐31‐2013 ThUS$
Profit‐sharing and bonuses Profit‐sharing and bonuses, current 10,698 12,398
Total 10,698 12,398 Classes of expenses by employee 105,953 100,283Salaries and wages 11,016 9,854Short‐term employee benefits 3,387 4,425Defined benefit obligation expenses 488 502Other long‐term benefits 4,210 5,154
Total 125,054 120,218 (1) Expenses associated with personnel remunerations are recorded in operating costs for ThUS$ 98,783 (ThUS$ 98,279 in 2013) and administrative expenses of ThUS$ 36,969 (ThUS$ 34,337 in 2013)
(26.2) Breakdown of Benefits Pending Settlement:
12‐31‐2014 12‐31‐2013
Current Non‐current Total Current Non‐current Total Benefit ThUS$ ThUS$ ThUS$ ThUS$ ThUS$ ThUS$ Defined benefit obligations (IAS) (Note 26.3) 377 11,957 12,334 544 13,650 14,194 Vacations 3,518 ‐ 3,518 4,234 ‐ 4,234 Profit‐sharing and bonuses 5,946 ‐ 5,946 4,449 ‐ 4,449 Tax and social laws 3,253 ‐ 3,253 3,640 ‐ 3,640 Severance indemnity payments and remunerations payables
215 ‐ 215 1,542 ‐ 1,542
Total personnel benefits 13,309 11,957 25,266 14,409 13,650 28,059
a) Defined benefit plans As of December 31, 2014 and 2013, SM‐SAAM and subsiary's responsibility is determined in conformity with IAS 19.
196
2014 Annual Report
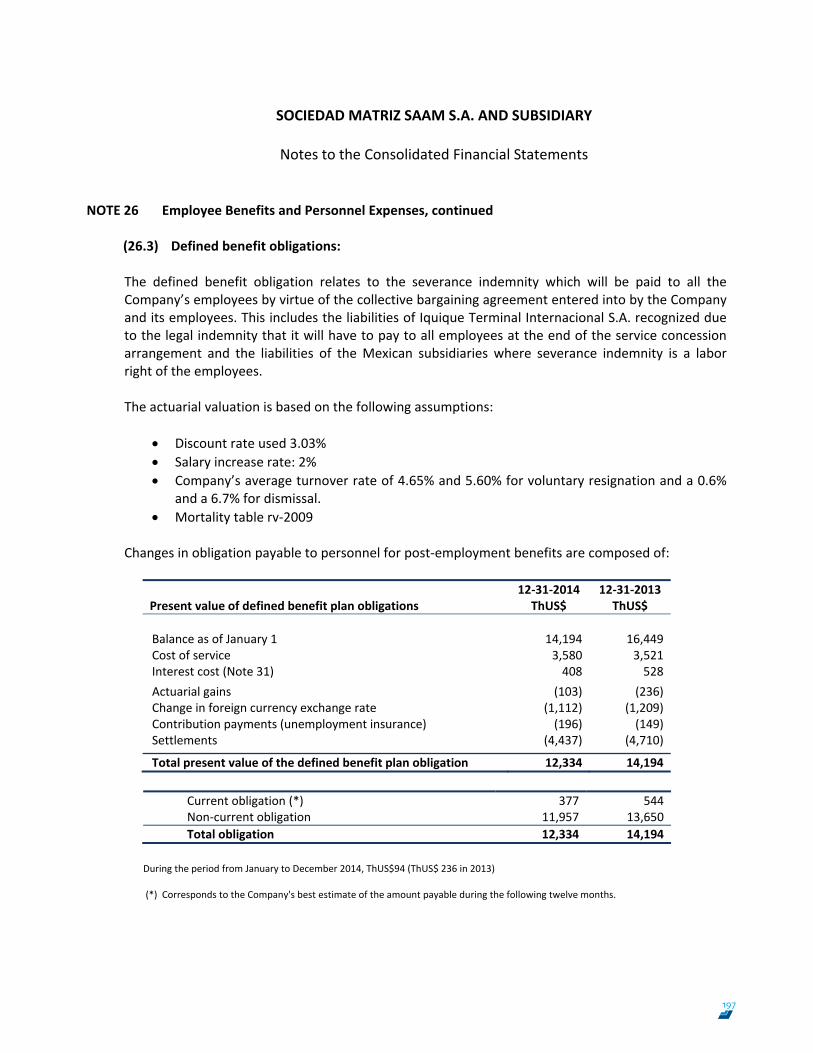
SOCIEDAD MATRIZ SAAM S.A. AND SUBSIDIARY
Notes to the Consolidated Financial Statements
106
NOTE 26 Employee Benefits and Personnel Expenses, continued
(26.3) Defined benefit obligations: The defined benefit obligation relates to the severance indemnity which will be paid to all the Company’s employees by virtue of the collective bargaining agreement entered into by the Company and its employees. This includes the liabilities of Iquique Terminal Internacional S.A. recognized due to the legal indemnity that it will have to pay to all employees at the end of the service concession arrangement and the liabilities of the Mexican subsidiaries where severance indemnity is a labor right of the employees. The actuarial valuation is based on the following assumptions:
Discount rate used 3.03% Salary increase rate: 2% Company’s average turnover rate of 4.65% and 5.60% for voluntary resignation and a 0.6%
and a 6.7% for dismissal. Mortality table rv‐2009
Changes in obligation payable to personnel for post‐employment benefits are composed of:
12‐31‐2014 12‐31‐2013Present value of defined benefit plan obligations ThUS$ ThUS$ Balance as of January 1 14,194 16,449Cost of service 3,580 3,521Interest cost (Note 31) 408 528Actuarial gains (103) (236)Change in foreign currency exchange rate (1,112) (1,209)Contribution payments (unemployment insurance) (196) (149)Settlements (4,437) (4,710)
Total present value of the defined benefit plan obligation 12,334 14,194
Current obligation (*) 377 544Non‐current obligation 11,957 13,650Total obligation 12,334 14,194
During the period from January to December 2014, ThUS$94 (ThUS$ 236 in 2013) (*) Corresponds to the Company's best estimate of the amount payable during the following twelve months.
197
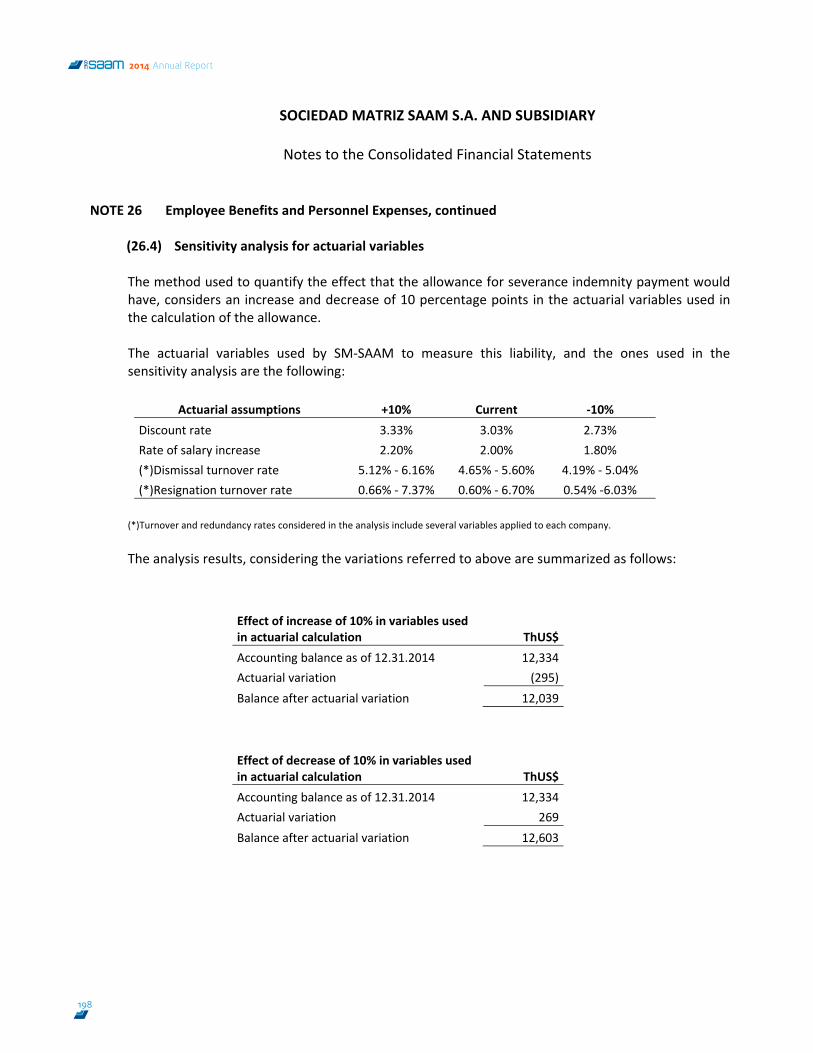
SOCIEDAD MATRIZ SAAM S.A. AND SUBSIDIARY
Notes to the Consolidated Financial Statements
107
NOTE 26 Employee Benefits and Personnel Expenses, continued
(26.4) Sensitivity analysis for actuarial variables
The method used to quantify the effect that the allowance for severance indemnity payment would have, considers an increase and decrease of 10 percentage points in the actuarial variables used in the calculation of the allowance. The actuarial variables used by SM‐SAAM to measure this liability, and the ones used in the sensitivity analysis are the following:
Actuarial assumptions +10% Current ‐10% Discount rate 3.33% 3.03% 2.73% Rate of salary increase 2.20% 2.00% 1.80% (*)Dismissal turnover rate 5.12% ‐ 6.16% 4.65% ‐ 5.60% 4.19% ‐ 5.04% (*)Resignation turnover rate 0.66% ‐ 7.37% 0.60% ‐ 6.70% 0.54% ‐6.03%
(*)Turnover and redundancy rates considered in the analysis include several variables applied to each company. The analysis results, considering the variations referred to above are summarized as follows:
Effect of increase of 10% in variables used in actuarial calculation ThUS$Accounting balance as of 12.31.2014 12,334Actuarial variation (295)Balance after actuarial variation 12,039
Effect of decrease of 10% in variables used in actuarial calculation ThUS$Accounting balance as of 12.31.2014 12,334Actuarial variation 269Balance after actuarial variation 12,603
198
2014 Annual Report
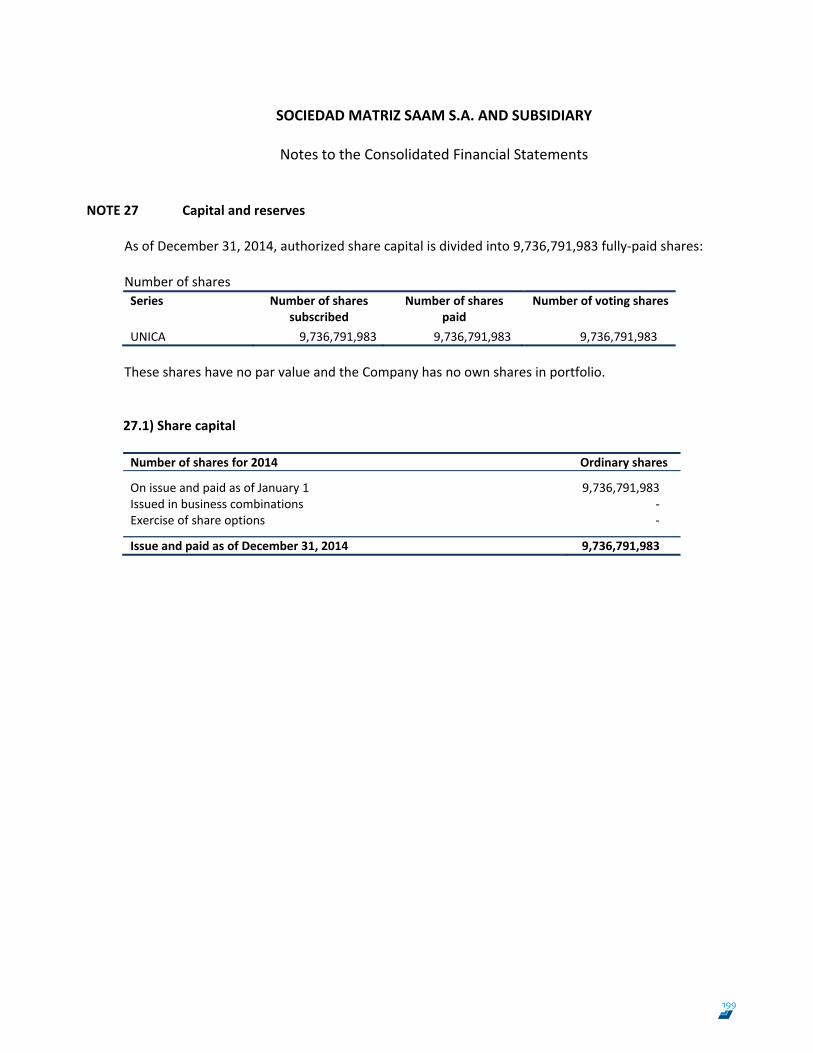
SOCIEDAD MATRIZ SAAM S.A. AND SUBSIDIARY
Notes to the Consolidated Financial Statements
108
NOTE 27 Capital and reserves
As of December 31, 2014, authorized share capital is divided into 9,736,791,983 fully‐paid shares:
Number of shares Series Number of shares
subscribed Number of shares
paid Number of voting shares
UNICA 9,736,791,983 9,736,791,983 9,736,791,983
These shares have no par value and the Company has no own shares in portfolio. 27.1) Share capital Number of shares for 2014 Ordinary shares On issue and paid as of January 1 9,736,791,983Issued in business combinations ‐Exercise of share options ‐ Issue and paid as of December 31, 2014 9,736,791,983
199
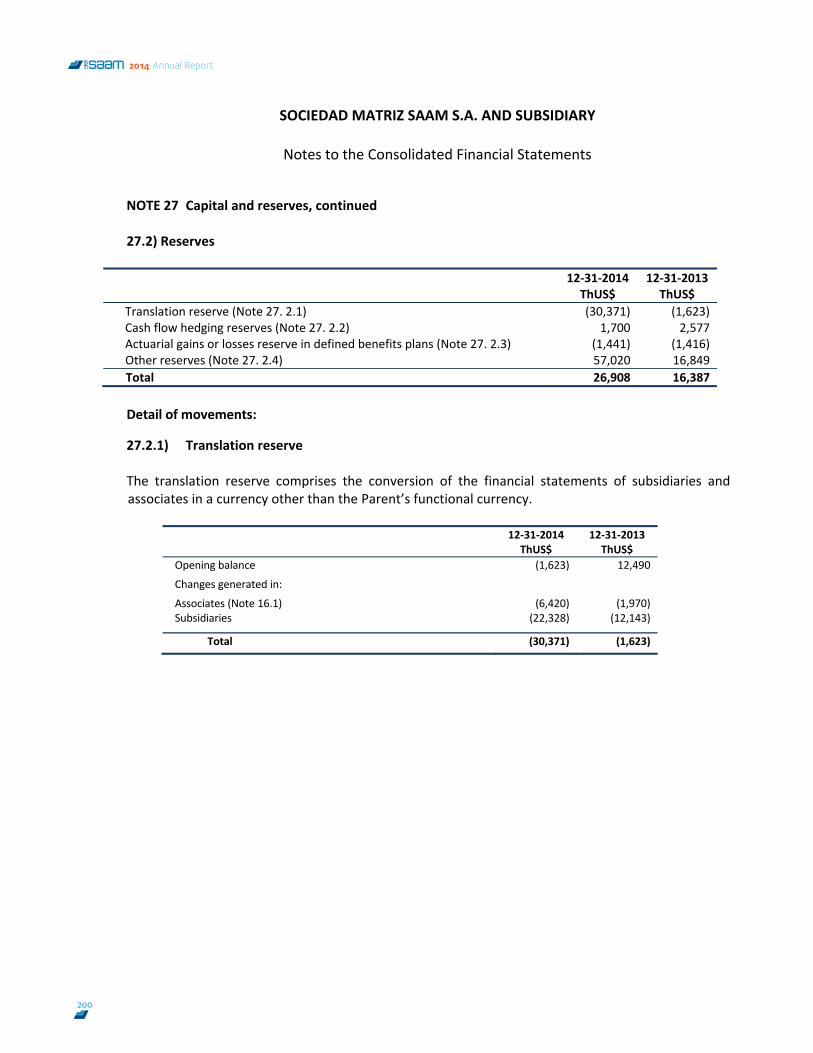
SOCIEDAD MATRIZ SAAM S.A. AND SUBSIDIARY
Notes to the Consolidated Financial Statements
109
NOTE 27 Capital and reserves, continued 27.2) Reserves
12‐31‐2014 ThUS$
12‐31‐2013ThUS$
Translation reserve (Note 27. 2.1) (30,371) (1,623)Cash flow hedging reserves (Note 27. 2.2) 1,700 2,577Actuarial gains or losses reserve in defined benefits plans (Note 27. 2.3) (1,441) (1,416)Other reserves (Note 27. 2.4) 57,020 16,849Total 26,908 16,387 Detail of movements: 27.2.1) Translation reserve The translation reserve comprises the conversion of the financial statements of subsidiaries and associates in a currency other than the Parent’s functional currency.
12‐31‐2014 ThUS$
12‐31‐2013 ThUS$
Opening balance (1,623) 12,490
Changes generated in:
Associates (Note 16.1) (6,420) (1,970) Subsidiaries (22,328) (12,143)
Total (30,371) (1,623)
200
2014 Annual Report
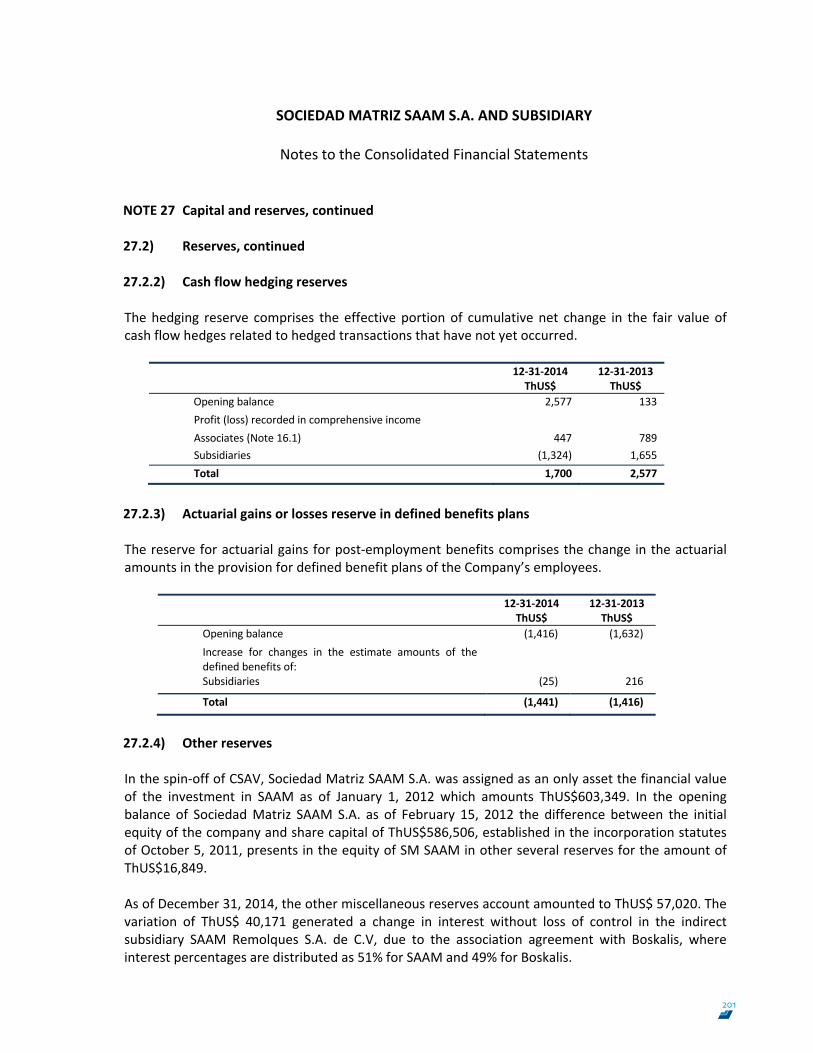
SOCIEDAD MATRIZ SAAM S.A. AND SUBSIDIARY
Notes to the Consolidated Financial Statements
110
NOTE 27 Capital and reserves, continued 27.2) Reserves, continued 27.2.2) Cash flow hedging reserves The hedging reserve comprises the effective portion of cumulative net change in the fair value of cash flow hedges related to hedged transactions that have not yet occurred.
12‐31‐2014
ThUS$ 12‐31‐2013 ThUS$
Opening balance 2,577 133 Profit (loss) recorded in comprehensive income Associates (Note 16.1) 447 789 Subsidiaries (1,324) 1,655 Total 1,700 2,577
27.2.3) Actuarial gains or losses reserve in defined benefits plans The reserve for actuarial gains for post‐employment benefits comprises the change in the actuarial amounts in the provision for defined benefit plans of the Company’s employees.
12‐31‐2014 ThUS$
12‐31‐2013 ThUS$
Opening balance (1,416) (1,632) Increase for changes in the estimate amounts of the defined benefits of:
Subsidiaries (25) 216
Total (1,441) (1,416)
27.2.4) Other reserves In the spin‐off of CSAV, Sociedad Matriz SAAM S.A. was assigned as an only asset the financial value of the investment in SAAM as of January 1, 2012 which amounts ThUS$603,349. In the opening balance of Sociedad Matriz SAAM S.A. as of February 15, 2012 the difference between the initial equity of the company and share capital of ThUS$586,506, established in the incorporation statutes of October 5, 2011, presents in the equity of SM SAAM in other several reserves for the amount of ThUS$16,849. As of December 31, 2014, the other miscellaneous reserves account amounted to ThUS$ 57,020. The variation of ThUS$ 40,171 generated a change in interest without loss of control in the indirect subsidiary SAAM Remolques S.A. de C.V, due to the association agreement with Boskalis, where interest percentages are distributed as 51% for SAAM and 49% for Boskalis.
201
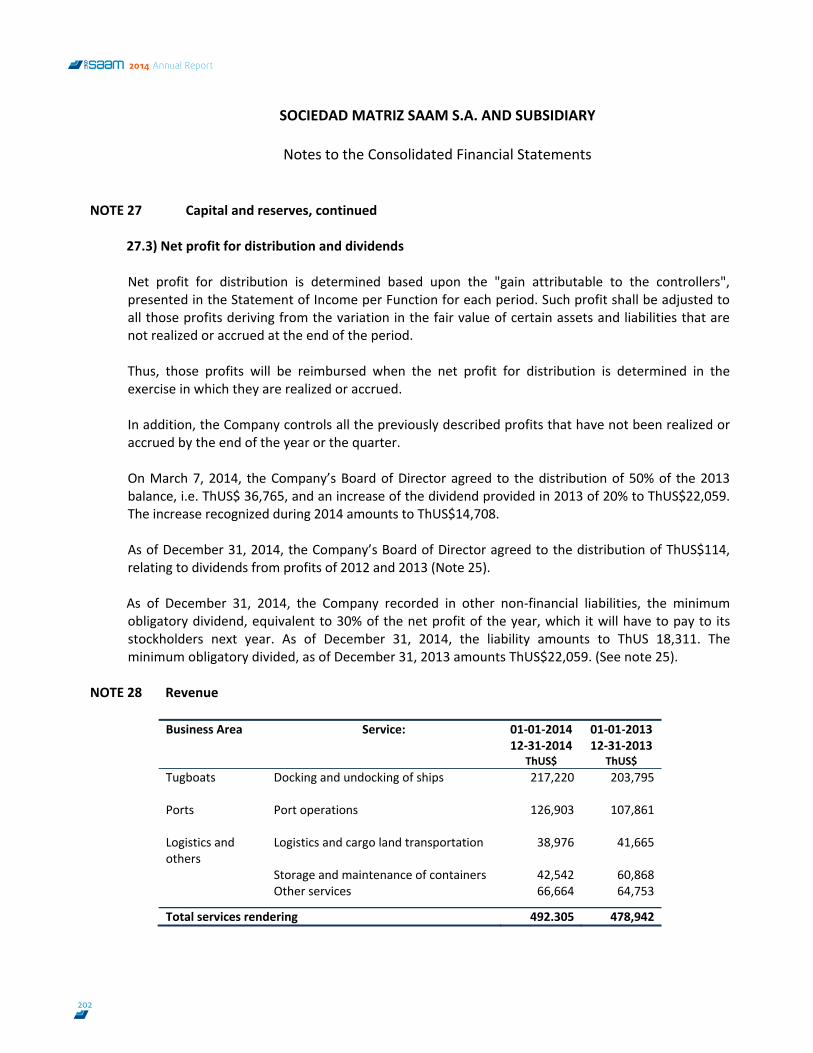
SOCIEDAD MATRIZ SAAM S.A. AND SUBSIDIARY
Notes to the Consolidated Financial Statements
111
NOTE 27 Capital and reserves, continued
27.3) Net profit for distribution and dividends Net profit for distribution is determined based upon the "gain attributable to the controllers", presented in the Statement of Income per Function for each period. Such profit shall be adjusted to all those profits deriving from the variation in the fair value of certain assets and liabilities that are not realized or accrued at the end of the period. Thus, those profits will be reimbursed when the net profit for distribution is determined in the exercise in which they are realized or accrued. In addition, the Company controls all the previously described profits that have not been realized or accrued by the end of the year or the quarter. On March 7, 2014, the Company’s Board of Director agreed to the distribution of 50% of the 2013 balance, i.e. ThUS$ 36,765, and an increase of the dividend provided in 2013 of 20% to ThUS$22,059. The increase recognized during 2014 amounts to ThUS$14,708. As of December 31, 2014, the Company’s Board of Director agreed to the distribution of ThUS$114, relating to dividends from profits of 2012 and 2013 (Note 25). As of December 31, 2014, the Company recorded in other non‐financial liabilities, the minimum obligatory dividend, equivalent to 30% of the net profit of the year, which it will have to pay to its stockholders next year. As of December 31, 2014, the liability amounts to ThUS 18,311. The minimum obligatory divided, as of December 31, 2013 amounts ThUS$22,059. (See note 25).
NOTE 28 Revenue
Business Area Service: 01‐01‐2014 12‐31‐2014
ThUS$
01‐01‐201312‐31‐2013
ThUS$ Tugboats Docking and undocking of ships 217,220 203,795
Ports Port operations 126,903 107,861
Logistics and others
Logistics and cargo land transportation 38,976 41,665
Storage and maintenance of containers 42,542 60,868 Other services 66,664 64,753
Total services rendering 492.305 478,942
202
2014 Annual Report
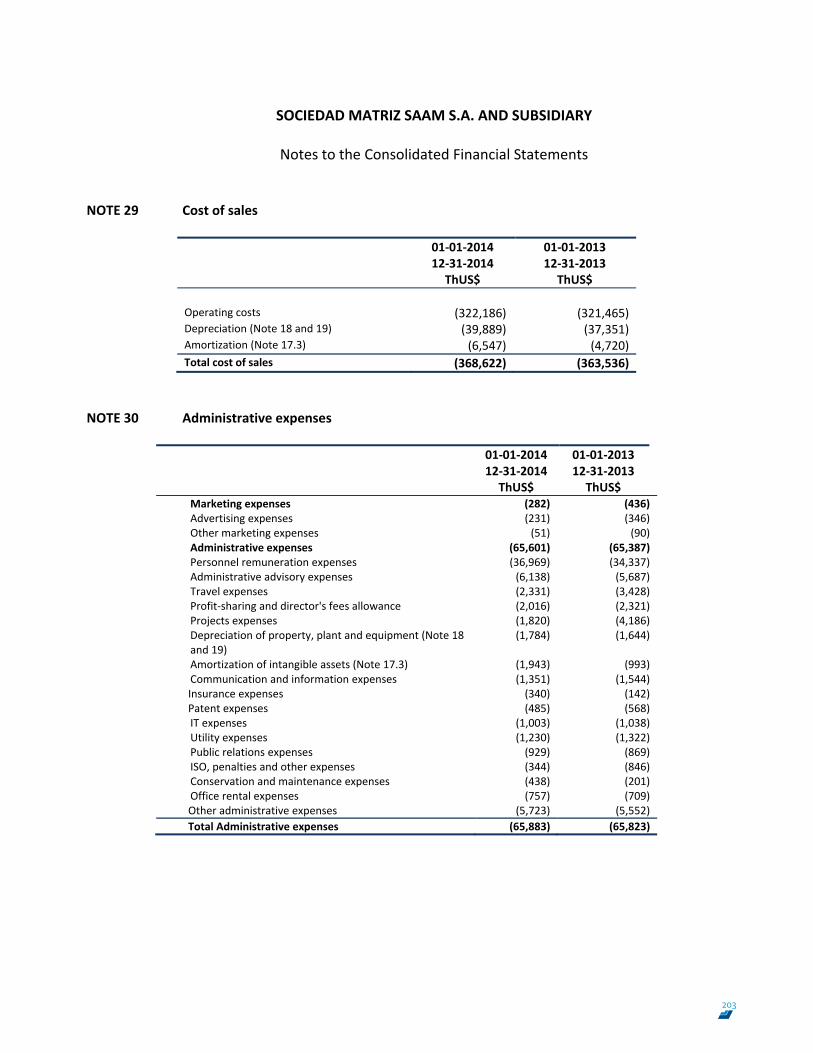
SOCIEDAD MATRIZ SAAM S.A. AND SUBSIDIARY
Notes to the Consolidated Financial Statements
112
NOTE 29 Cost of sales
01‐01‐201412‐31‐2014 ThUS$
01‐01‐2013 12‐31‐2013 ThUS$
Operating costs (322,186) (321,465) Depreciation (Note 18 and 19) (39,889) (37,351) Amortization (Note 17.3) (6,547) (4,720) Total cost of sales (368,622) (363,536)
NOTE 30 Administrative expenses
01‐01‐201412‐31‐2014 ThUS$
01‐01‐2013 12‐31‐2013 ThUS$
Marketing expenses (282) (436) Advertising expenses (231) (346) Other marketing expenses (51) (90) Administrative expenses (65,601) (65,387) Personnel remuneration expenses (36,969) (34,337) Administrative advisory expenses (6,138) (5,687) Travel expenses (2,331) (3,428) Profit‐sharing and director's fees allowance (2,016) (2,321) Projects expenses (1,820) (4,186) Depreciation of property, plant and equipment (Note 18 and 19)
(1,784) (1,644)
Amortization of intangible assets (Note 17.3) (1,943) (993) Communication and information expenses (1,351) (1,544) Insurance expenses (340) (142) Patent expenses (485) (568) IT expenses (1,003) (1,038) Utility expenses (1,230) (1,322) Public relations expenses (929) (869) ISO, penalties and other expenses (344) (846) Conservation and maintenance expenses (438) (201) Office rental expenses (757) (709) Other administrative expenses (5,723) (5,552) Total Administrative expenses (65,883) (65,823)
203
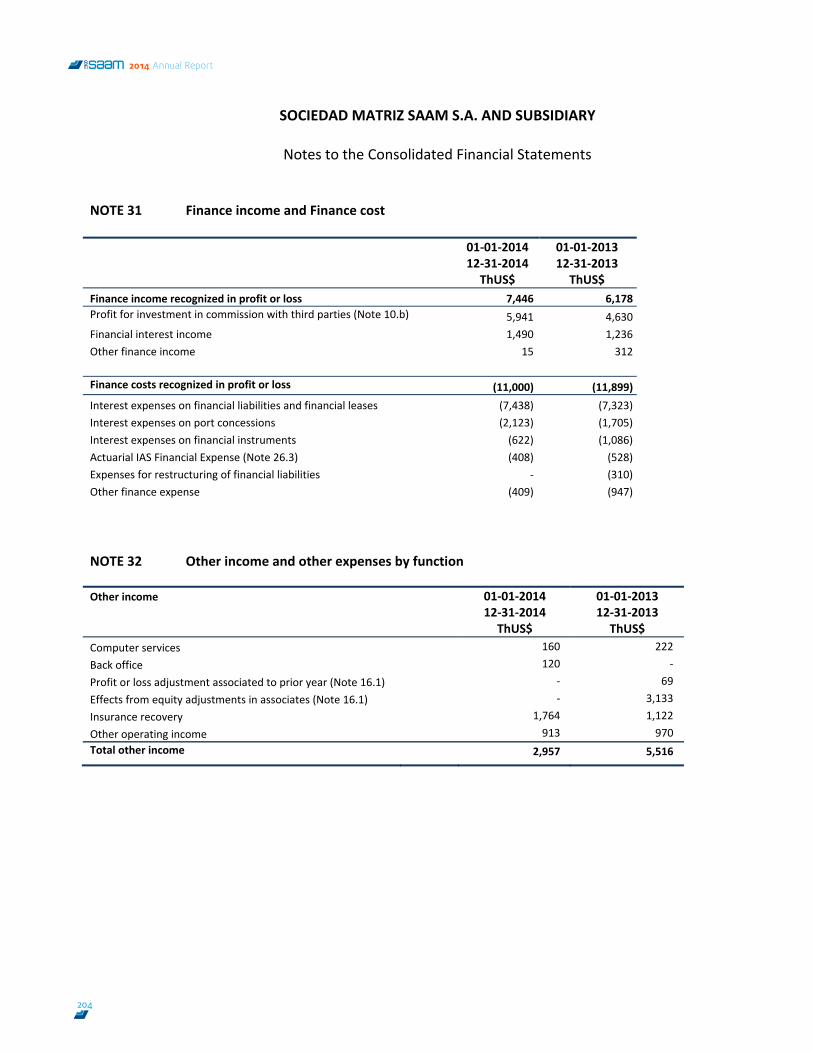
SOCIEDAD MATRIZ SAAM S.A. AND SUBSIDIARY
Notes to the Consolidated Financial Statements
113
NOTE 31 Finance income and Finance cost
01‐01‐2014
12‐31‐2014 ThUS$
01‐01‐2013 12‐31‐2013 ThUS$
Finance income recognized in profit or loss 7,446 6,178 Profit for investment in commission with third parties (Note 10.b) 5,941 4,630 Financial interest income 1,490 1,236 Other finance income 15 312 Finance costs recognized in profit or loss (11,000) (11,899) Interest expenses on financial liabilities and financial leases (7,438) (7,323) Interest expenses on port concessions (2,123) (1,705) Interest expenses on financial instruments (622) (1,086) Actuarial IAS Financial Expense (Note 26.3) (408) (528) Expenses for restructuring of financial liabilities ‐ (310) Other finance expense (409) (947) NOTE 32 Other income and other expenses by function Other income 01‐01‐2014
12‐31‐2014 ThUS$
01‐01‐201312‐31‐2013 ThUS$
Computer services 160 222 Back office 120 ‐ Profit or loss adjustment associated to prior year (Note 16.1) ‐ 69 Effects from equity adjustments in associates (Note 16.1) ‐ 3,133 Insurance recovery 1,764 1,122 Other operating income 913 970 Total other income 2,957 5,516
204
2014 Annual Report
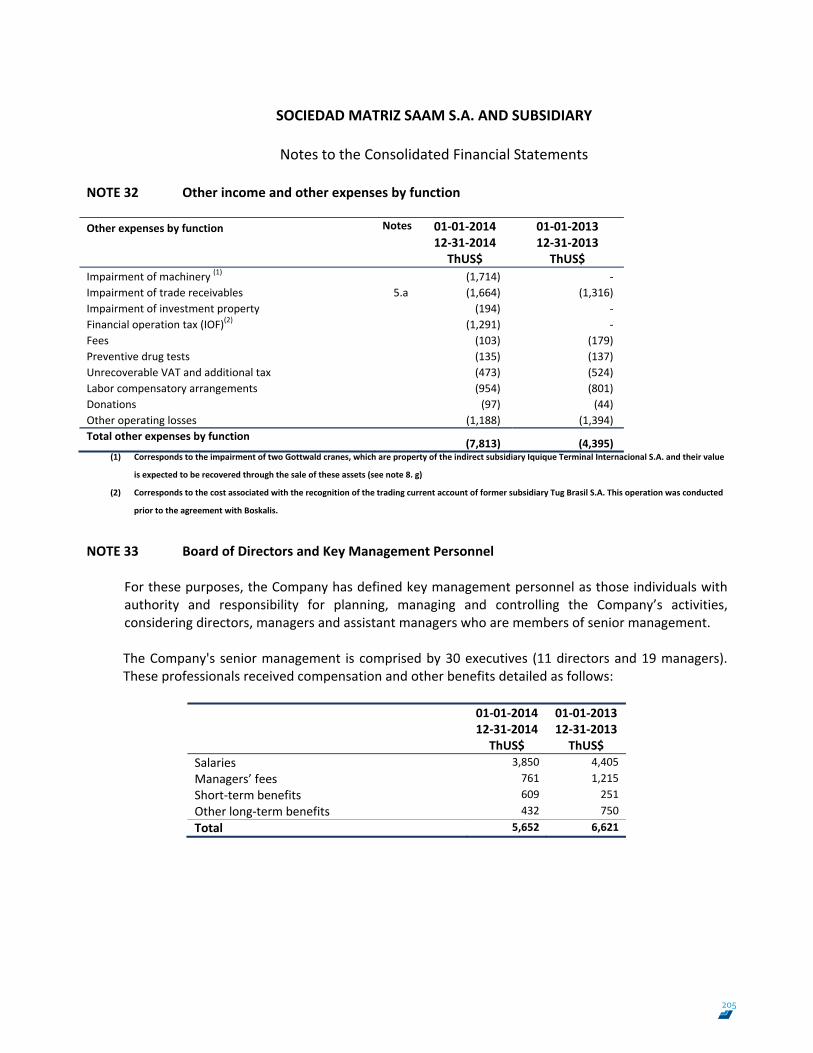
SOCIEDAD MATRIZ SAAM S.A. AND SUBSIDIARY
Notes to the Consolidated Financial Statements
114
NOTE 32 Other income and other expenses by function
Other expenses by function Notes 01‐01‐201412‐31‐2014 ThUS$
01‐01‐2013 12‐31‐2013 ThUS$
Impairment of machinery (1) (1,714) ‐ Impairment of trade receivables 5.a (1,664) (1,316) Impairment of investment property (194) ‐ Financial operation tax (IOF)(2) (1,291) ‐ Fees (103) (179) Preventive drug tests (135) (137) Unrecoverable VAT and additional tax (473) (524) Labor compensatory arrangements (954) (801) Donations (97) (44) Other operating losses (1,188) (1,394) Total other expenses by function (7,813) (4,395)
(1) Corresponds to the impairment of two Gottwald cranes, which are property of the indirect subsidiary Iquique Terminal Internacional S.A. and their value
is expected to be recovered through the sale of these assets (see note 8. g)
(2) Corresponds to the cost associated with the recognition of the trading current account of former subsidiary Tug Brasil S.A. This operation was conducted
prior to the agreement with Boskalis.
NOTE 33 Board of Directors and Key Management Personnel
For these purposes, the Company has defined key management personnel as those individuals with authority and responsibility for planning, managing and controlling the Company’s activities, considering directors, managers and assistant managers who are members of senior management. The Company's senior management is comprised by 30 executives (11 directors and 19 managers). These professionals received compensation and other benefits detailed as follows:
01‐01‐201412‐31‐2014 ThUS$
01‐01‐2013 12‐31‐2013 ThUS$
Salaries 3,850 4,405 Managers’ fees 761 1,215 Short‐term benefits 609 251 Other long‐term benefits 432 750 Total 5,652 6,621
205
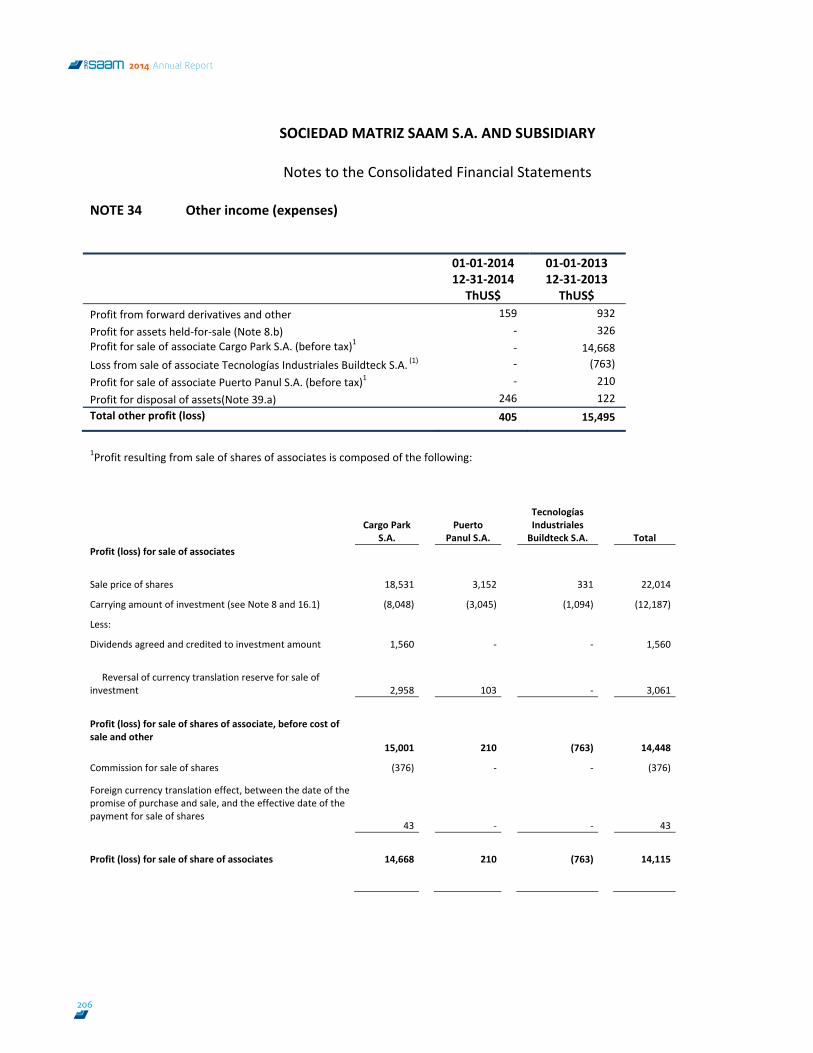
SOCIEDAD MATRIZ SAAM S.A. AND SUBSIDIARY
Notes to the Consolidated Financial Statements
115
NOTE 34 Other income (expenses)
01‐01‐2014
12‐31‐2014 ThUS$
01‐01‐2013 12‐31‐2013 ThUS$
Profit from forward derivatives and other 159 932 Profit for assets held‐for‐sale (Note 8.b) ‐ 326 Profit for sale of associate Cargo Park S.A. (before tax)1 ‐ 14,668 Loss from sale of associate Tecnologías Industriales Buildteck S.A. (1) ‐ (763) Profit for sale of associate Puerto Panul S.A. (before tax)1 ‐ 210 Profit for disposal of assets(Note 39.a) 246 122 Total other profit (loss) 405 15,495
1Profit resulting from sale of shares of associates is composed of the following:
Cargo Park
S.A. Puerto
Panul S.A.
Tecnologías Industriales Buildteck S.A. Total
Profit (loss) for sale of associates
Sale price of shares 18,531 3,152 331 22,014
Carrying amount of investment (see Note 8 and 16.1) (8,048) (3,045) (1,094) (12,187)
Less:
Dividends agreed and credited to investment amount 1,560 ‐ ‐ 1,560
Reversal of currency translation reserve for sale of investment 2,958 103 ‐ 3,061
Profit (loss) for sale of shares of associate, before cost of sale and other
15,001 210 (763) 14,448
Commission for sale of shares (376) ‐ ‐ (376)
Foreign currency translation effect, between the date of the promise of purchase and sale, and the effective date of the payment for sale of shares
43 ‐ ‐ 43
Profit (loss) for sale of share of associates 14,668 210 (763) 14,115
206
2014 Annual Report
SOCIEDAD MATRIZ SAAM S.A. AND SUBSIDIARY
Notes to the Consolidated Financial Statements
116
NOTE 35 Service Concession and other agreements
Iquique Terminal Internacional S.A. (Chile) Empresa Portuaria de Iquique (EPI) by means of the "Service Concession Arrangement for dockings front No.2 of the Iquique Port", on May 3, 2000 granted to the indirect subsidiary Iquique Terminal Internacional S.A. (ITI) an exclusive concession to develop, maintain and operate the docking front, including the right to collect basic rates for utility services and special rates for special services rendered in the docking front. The original contract validity is for 20 years, starting from the date of delivery of the docking front, paid on July 1, 2000. There is an option for extending the term for a period of 10 years if it performs the infrastructure projects indicated in the concession contract. At the end of the concession, the docking front, all the assets included in the concession contract, necessary or useful for the continuous operation of the docking front or rendering of services will be immediately transferred to EPI, in good operating conditions and unencumbered.
Terminal Marítima Mazatlán S.A. de C.V (Mexico) Administración Portuaria Integral de Mazatlán (API) by means of the "Agreement for the Partial Assignment of Rights", on April 16, 2012, assigned to the indirect subsidiary Terminal Marítima Mazatlan S.A. de C.V. (concessionaire) the exclusive right for exploitation and use of an area of water and lands located in the port premises of Mazatlán de Sinaloa, the construction of buildings in such area and the rendering of port services. The term of the concession contract is for 20 years, and can be extended until July 26, 2044. At the end of the concession period, the area and all the projects and improvements permanently attached to the area, made by the concessionaire, for exploiting the area, will be transferred to API, unencumbered and with no charges The concessionaire shall perform, on its own account, the repairing required at the moment of its return, or it will pay an indemnity to API for the flaws suffered by the area or by the assets involved due to the inappropriate handling or as a consequence of an inappropriate maintenance.
207
SOCIEDAD MATRIZ SAAM S.A. AND SUBSIDIARY
Notes to the Consolidated Financial Statements
117
NOTE 35 Service Concession and other agreements, continued
Florida International Terminal (FIT), LLC (USA)
On April 18, 2005, the indirect subsidiary was awarded the concession of operation of the Port Everglade Florida USA containers terminal, for an initial period of 10 years, renewable for 2 periods of 5 years each. The operations commenced on July 7, 2005. The terminal has 15 hectares and the capacity to store and move up to 170,000 containers per year. For the stowage and unstowage operation, FIT's clients will have the docking priority in a special port with guaranteed use of container‐carry cranes.
SAAM Remolques S.A. de C.V. (México) The subsidiary Saam Remolques S.A. de C.V. has entered into agreements for the partial assignment of rights and obligations through which Administración Portuaria Integral of Lázaro Cárdenas, Veracruz, Tampico, Altamira, and Tuxpan assign to the Company the rights and obligations with respect to the port tugboat and offshore services in ports, unencumbered and without limitations to their exercise. These concessions have a validity period up to February 17, 2015 in the case of Lázaro Cárdenas; up to November 20, 2015 in the case of Veracruz; up to May 11, 2016 in the case of Tampico; up to January 29, 2016 in the case of Altamira; and up to April 1, 2013 in the case of Tuxpan, extendable for an additional 6‐year period.
Concesionaria SAAM Costa Rica S.A. (Costa Rica)
On August 11, 2006, the indirect subsidiary, Concesionaria SAAM Costa Rica S.A. won the International Public Bidding No.03‐2001, “Concession of Tugboats Public Service Management for the Pacific Side”, contract countersigned by the Comptroller General of the Republic through oficial document No.10711, which allow it to commence operations on December 12, 2006. The period of validity of the concession is for 20 years, renewable for 5 additional years. Inarpi S.A. (Ecuador) On December 25, 2003, the indirect subsidiary Inarpi S.A. signed an agreement for "Commercialization, operation and administration Services for the Multi‐purpose terminal" with the company Fertilizantes Granulados Fertigran S.A., which grants an exclusive right to commercialization, operation and administration o the Multi‐purpose Terminal, in the port of Guayaquil, Ecuador. The term of the contract is for 40 years, and at the end of that period all the investments and improvements made by a common agreement with Fertilizantes Granulados Fertigran S.A. will be attached to the Multi‐purpose Terminal.
208
2014 Annual Report
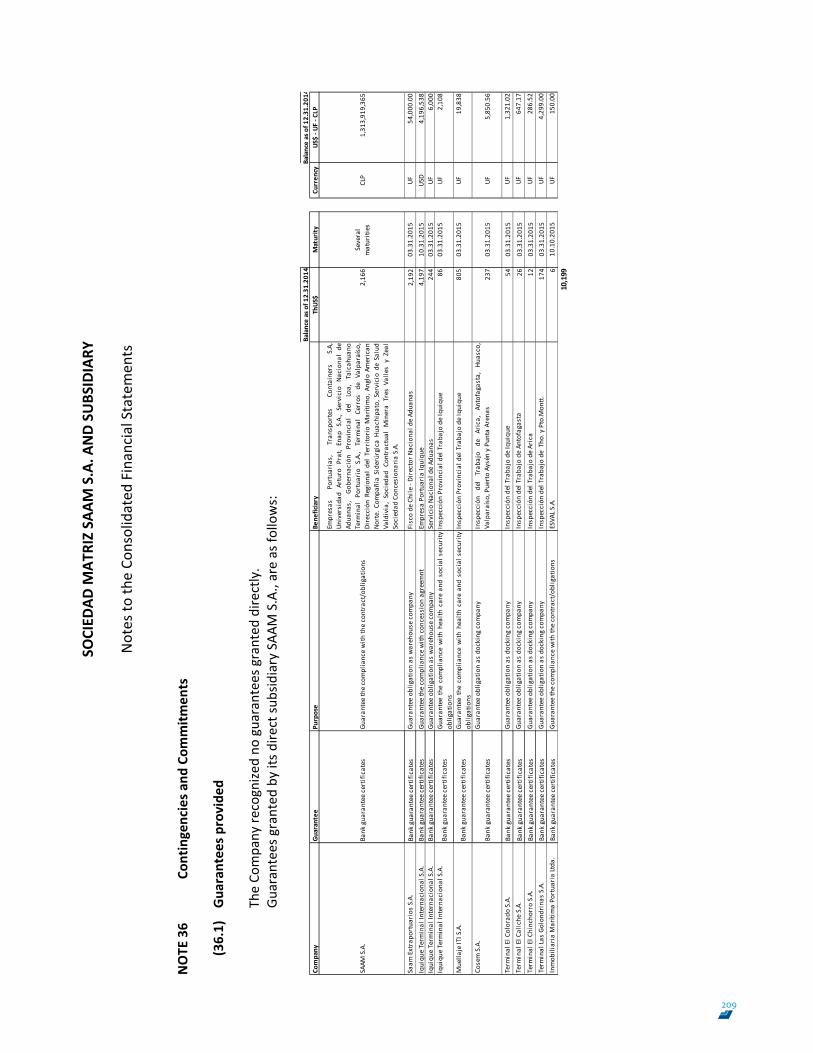
SOCIED
AD M
ATRIZ SA
AM S.A. A
ND SU
BSIDIARY
Notes to
the Co
nsolidated
Financial Statemen
ts
118
NOTE
36
Contingencies a
nd Com
mitm
ents
(36.1)
Guaran
tees provide
d The Co
mpany
recognize
d no
guarantees g
ranted
dire
ctly.
Guarantees granted
by its dire
ct su
bsidiary SAA
M S.A., are as fo
llows:
Balance as of 1
2.31
.201
4Balance as of 1
2.31
.201
4Co
mpany
Guarantee
Purpose
Bene
ficiary
ThUS
$Maturity
Curren
cyUS
$ ‐ U
F ‐ C
LP
SAAM
S.A.
Bank
gua
rantee certificates
Guaran
tee the compliance with
the contract/obligations
Empresas
Portua
rias,
Tran
sportes
Containers
S.A,
Universida
dArturo
Prat,Enap
S.A.,Servicio
Nacion
alde
Adua
nas,
Gobernación
Provincial
del
Loa,
Talcah
uano
Term
inal
Portua
rio
S.A.,
Term
inal
Cerros
deVa
lparaíso,
DirecciónRegion
aldelTerrito
rioMarítimo,
AngloAm
erican
Norte.
Compa
ñiaSiderúrgicaHu
achipa
to,S
erviciode
Salud
Valdivia,Sociedad
Contractua
lMinera
Tres
Valle
syZeal
Sociedad
Con
cesion
aria S.A.
2,16
6Several
maturities
CLP
1,31
3,91
9,36
5
Saam
Extrapo
rtua
rios
S.A.
Bank
gua
rantee certificates
Guaran
tee ob
ligation as
warehou
se com
pany
Fisco de
Chile ‐ Director Naciona
l de Ad
uana
s2,19
203
.31.20
15UF
54,000
.00
Iquiqu
e Term
inal In
ternaciona
l S.A.
Bank
gua
rantee certificates
Guaran
tee the compliance with
con
cession agreem
ntEm
presa Po
rtua
ria Iquiqu
e4,19
710
.31.20
15US
D4,19
6,53
8Iquiqu
e Term
inal In
ternaciona
l S.A.
Bank
gua
rantee certificates
Guaran
tee ob
ligation as
warehou
se com
pany
Servicio Naciona
l de Ad
uana
s24
403
.31.20
15UF
6,00
0Iquiqu
e Term
inal In
ternaciona
l S.A.
Bank
gua
rantee certificates
Guaran
teethecompliancewith
health
care
andsocial
security
oblig
ations
Inspección
Provincial d
el Traba
jo de Iquiqu
e86
03.31.20
15UF
2,10
8
Muella
je ITI S.A.
Bank
gua
rantee certificates
Guaran
teethecompliancewith
health
care
andsocial
security
oblig
ations
Inspección
Provincial d
el Traba
jo de Iquiqu
e80
503
.31.20
15UF
19,838
Cosem S.A.
Bank
gua
rantee certificates
Guaran
tee ob
ligation as
docking
com
pany
Inspección
del
Trab
ajo
deArica,
Antofagasta,
Huasco,
Valparaíso, Puerto Aysén y Pu
nta Arenas
237
03.31.20
15UF
5,85
0.56
Term
inal El C
olorad
o S.A.
Bank
gua
rantee certificates
Guaran
tee ob
ligation as
docking
com
pany
Inspección
del Traba
jo de Iquiqu
e54
03.31.20
15UF
1,32
1.02
Term
inal El C
aliche
S.A.
Bank
gua
rantee certificates
Guaran
tee ob
ligation as
docking
com
pany
Inspección
del Traba
jo de An
tofagasta
2603
.31.20
15UF
647.17
Term
inal El C
hincho
rro S.A.
Bank
gua
rantee certificates
Guaran
tee ob
ligation as
docking
com
pany
Inspección
del Traba
jo de Arica
1203
.31.20
15UF
286.52
Term
inal La
s Go
lond
rina
s S.A.
Bank
gua
rantee certificates
Guaran
tee ob
ligation as
docking
com
pany
Inspección
del Traba
jo de Tho
. y Pto.M
ontt.
174
03.31.20
15UF
4,29
9.00
Inmob
iliaria M
arítima Po
rtua
ria Ltda
.Ba
nk gua
rantee certificates
Guaran
tee the compliance with
the contract/obligations
ESVA
L S.A.
610
.10.20
15UF
150.00
10,199
209
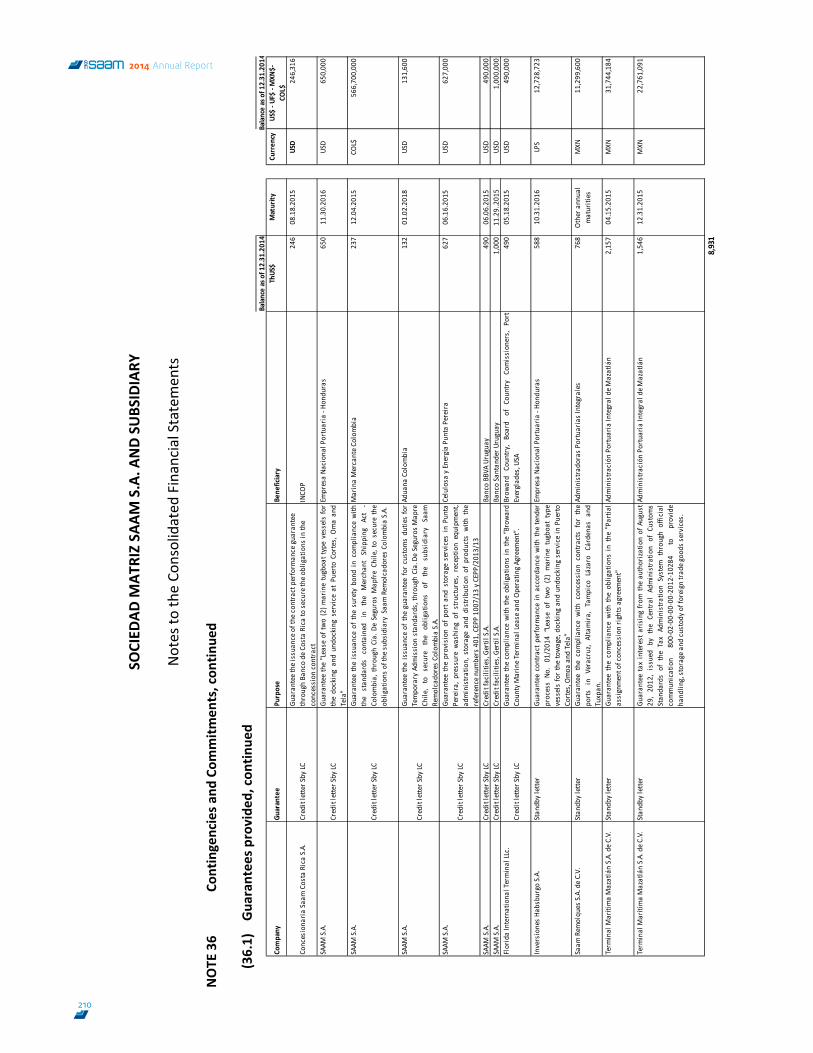
SOCIED
AD M
ATRIZ SA
AM S.A. A
ND SU
BSIDIARY
Notes to
the Co
nsolidated
Financial Statemen
ts
119
NOTE
36
Contingencies a
nd Com
mitm
ents, con
tinue
d
(36.1)
Guaran
tees provide
d, con
tinue
d Balance as of 1
2.31
.201
4Balance as of 1
2.31
.201
4
Company
Guarantee
Purpose
Bene
ficiary
ThUS
$Maturity
Curren
cyUS
$ ‐ U
F$ ‐ MXN
$‐
COL$
Concesiona
ria Saam
Costa Rica S.A.
Credit lette
r Sby
LCGu
aran
tee the issuan
ce of the
con
tract p
erform
ance gua
rantee
through Ba
nco de
Costa Rica to secure the ob
ligations
in th
e concession
con
tract
INCO
P24
608
.18.20
15US
D24
6,31
6
SAAM
S.A.
Credit lette
r Sby
LCGu
aran
teethe"Lease
oftwo(2)m
arinetugboa
ttypevesselsfor
thedo
ckingan
dun
dockingserviceat
Puerto
Cortes,Omaan
dTela"
Empresa Na
cion
al Portuaria ‐ Ho
nduras
650
11.30.20
16US
D65
0,00
0
SAAM
S.A.
Credit lette
r Sby
LC
Guaran
teetheissuan
ceof
thesurety
bond
incompliancewith
the
stan
dards
contained
inthe
Merchan
tShipping
Act
‐Co
lombia,
throughCía.
DeSegurosMap
freCh
ile,tosecure
the
oblig
ations
of the
sub
sidiary Saa
m Rem
olcado
res Co
lombia S.A.
Marina Mercante Co
lombia
237
12.04.20
15CO
L$56
6,70
0,00
0
SAAM
S.A.
Credit lette
r Sby
LC
Guaran
teetheissuan
ceof
theguaran
teeforcustom
sdu
tiesfor
Tempo
rary
Admission
stan
dards,throughCía.De
SegurosMap
reCh
ile,to
secure
the
oblig
ations
ofthe
subsidiary
Saam
Remolcado
res Co
lombia S.A.
Adua
na Colom
bia
132
01.02.20
18US
D13
1,60
0
SAAM
S.A.
Credit lette
r Sby
LC
Guaran
teetheprovisionof
port
andstorageservices
inPu
nta
Pereira,
pressure
washing
ofstructures,receptionequipm
ent,
administration,
storagean
ddistribu
tionof
prod
ucts
with
the
reference nu
mbers 401
, CEPP 10
07/13 y CEPP
/201
3/13
Celulosa
y Energía Pun
ta Pereira
627
06.16.20
15US
D62
7,00
0
SAAM
S.A.
Credit lette
r Sby
LCCredit facilities, Gertil S.A.
Banco BB
VA Uruguay
490
06.06.20
15US
D49
0,00
0SAAM
S.A.
Credit lette
r Sby
LCCredit facilities, Gertil S.A.
Banco Santan
der U
ruguay
1,00
011
.29..201
5US
D1,00
0,00
0Florida Internationa
l Terminal LLc.
Credit lette
r Sby
LCGu
aran
teethecompliancewith
theob
ligations
inthe“Broward
Coun
ty M
arine Term
inal Le
ase an
d Operatin
g Agreem
ent”.
Brow
ard
Coun
try,
Board
ofCo
untry
Comission
ers,
Port
Everglad
es, U
SA49
005
.18.20
15US
D49
0,00
0
Inversiones Ha
bsbu
rgo S.A.
Stan
dby lette
rGu
aran
teecontract
performan
cein
accordan
cewith
thetend
erprocessNo
.01
/201
4“Lease
oftwo
(2)marinetugboa
ttype
vesselsforthetowage,do
ckingan
dun
dockingservicein
Puerto
Cortes, O
moa
and
Tela”
Empresa Na
cion
al Portuaria ‐ Ho
nduras
588
10.31.20
16LPS
12,728
,723
Saam
Rem
olqu
es S.A. de C.V.
Stan
dby lette
rGu
aran
teethecompliancewith
concession
contractsforthe
ports
inVeracruz,Altamira,
Tampico
Lázaro
Cárdenas
and
Tuxpan
.
Administrad
oras
Portuarias Integrales
768
Other ann
ual
maturities
MXN
11,299
,600
Term
inal M
arítima Mazatlán S.A. de C.V.
Stan
dby lette
rGu
aran
teethecompliancewith
theob
ligations
inthe"Partia
lassignment o
f con
cession rights agreement"
Administración Po
rtua
ria Integral de Mazatlán
2,15
704
.15.20
15MXN
31,744
,184
Term
inal M
arítima Mazatlán S.A. de C.V.
Stan
dby lette
rGu
aran
teetaxinterest
arisingfrom
theau
thorizationof
August
29,20
12,issued
bythe
CentralAd
ministration
ofCu
stom
sStan
dardsof
theTax
Administration
System
through
offic
ial
commun
ication
800‐02
‐00‐00
‐00‐20
12‐102
84to
provide
hand
ling, storage and
custody
of foreign
trad
e good
s services.
Administración Po
rtua
ria Integral de Mazatlán
1,54
612
.31.20
15MXN
22,761
,091
8,931
210
2014 Annual Report
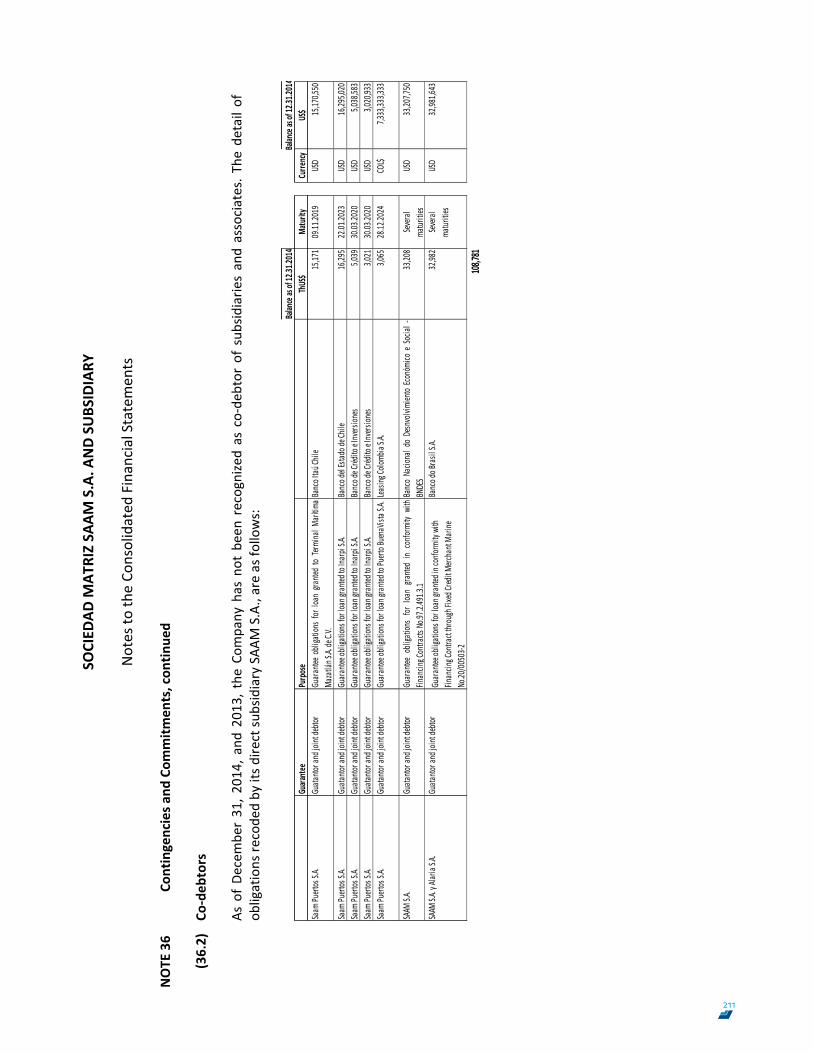
SOCIED
AD M
ATRIZ SA
AM S.A. A
ND SU
BSIDIARY
Notes to
the Co
nsolidated
Financial Statemen
ts
120
NOTE
36
Contingencies a
nd Com
mitm
ents, con
tinue
d
(36.2)
Co‐deb
tors
As of De
cembe
r 31
, 201
4, and
201
3, the
Com
pany
has not been recognize
d as co‐de
btor of subsidiarie
s and associates. T
he detail o
f ob
ligations re
code
d by
its d
irect su
bsidiary SAA
M S.A., are as fo
llows:
Balan
ce as
of 12
.31.20
14Balan
ce as
of 12
.31.20
14Gu
arante
ePu
rpose
ThUS
$Ma
turity
Curre
ncyUS
$Saam
Puert
os S.A
.Gu
atanto
r and
joint
debto
rGu
arante
eobli
gatio
nsfor
loan
grante
dto
Termi
nalM
arítim
aMa
zatlán
S.A. de C
.V.Ba
nco I
taú Ch
ile15
,171
09.11
.2019
USD
15,17
0,550
Saam
Puert
os S.A
.Gu
atanto
r and
joint
debto
rGu
arante
e obli
gatio
ns fo
r loan
gran
ted to
Inarp
i S.A.
Banco d
el Est
ado d
e Chil
e16
,295
22.01
.2023
USD
16,29
5,020
Saam
Puert
os S.A
.Gu
atanto
r and
joint
debto
rGu
arante
e obli
gatio
ns fo
r loan
gran
ted to
Inarp
i S.A.
Banco d
e Créd
ito e I
nvers
iones
5,039
30.03
.2020
USD
5,038
,583
Saam
Puert
os S.A
.Gu
atanto
r and
joint
debto
rGu
arante
e obli
gatio
ns fo
r loan
gran
ted to
Inarp
i S.A.
Banco d
e Créd
ito e I
nvers
iones
3,021
30.03
.2020
USD
3,020
,933
Saam
Puert
os S.A
.Gu
atanto
r and
joint
debto
rGu
arante
e obli
gatio
ns fo
r loan
gran
ted to
Puert
o Buena
Vista
S.A. L
easin
g Colo
mbia
S.A.
3,065
28.12
.2024
COL$
7,333
,333,3
33
SAAM
S.A.
Guata
ntor a
nd jo
int de
btor
Guara
ntee
oblig
ation
sfor
loan
grante
din
confo
rmity
with
Finan
cing C
ontra
cts No
.97.2.49
1.3.1
BancoNa
ciona
ldoDe
snvolvi
miento
Econó
mico
eSocia
l‐BN
DES
33,20
8Sev
eral
matur
ities
USD
33,20
7,750
SAAM
S.A. y
Alaria
S.A.
Guata
ntor a
nd jo
int de
btor
Guara
ntee o
bligatio
ns fo
r loan
gran
ted in
confo
rmity
with
Finan
cing C
ontra
ct thr
ough
Fixed
Credit M
ercha
nt Ma
rine
No.20
/0050
3‐2
Banco d
o Bras
il S.A.
32,98
2Sev
eral
matur
ities
USD
32,98
1,643
108,78
1
211
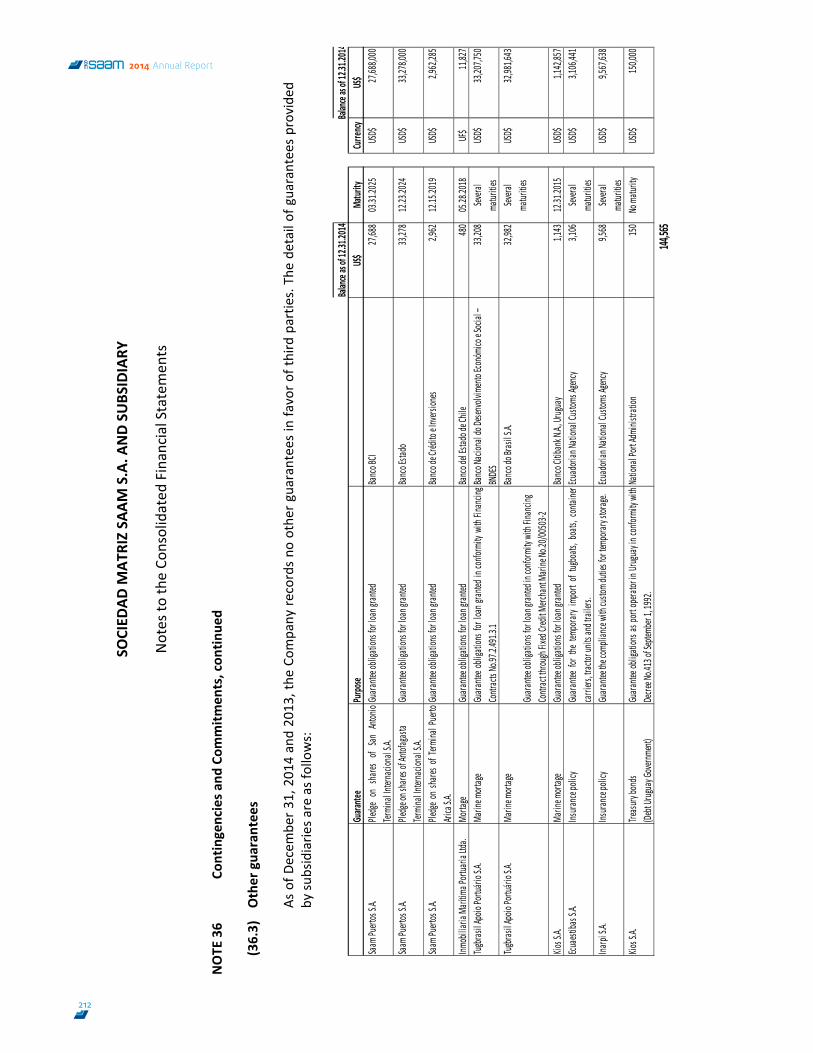
SOCIED
AD M
ATRIZ SA
AM S.A. A
ND SU
BSIDIARY
Notes to
the Co
nsolidated
Financial Statemen
ts
121
NOTE
36
Contingencies a
nd Com
mitm
ents, con
tinue
d
(36.3)
Other gua
rantees
As of D
ecem
ber 3
1, 201
4 and 20
13, the
Com
pany
records no
other guarantees in fa
vor o
f third partie
s. The
detail o
f guarantees provided
by
subsidiarie
s are as follows:
Bal
ance a
s of 1
2.31.2
014
Balanc
e as o
f 12.3
1.201
4Gu
arante
ePu
rpose
US$
Matur
ityCu
rrency
US$
Saam P
uertos
S.A.
Pledge
onsha
resof
SanAn
tonio
Termi
nal In
terna
ciona
l S.A.
Guara
ntee o
bligat
ions fo
r loan
gran
tedBa
nco BC
I27
,688
03.31
.2025
USD$
27,68
8,000
Saam P
uertos
S.A.
Pledge
on sh
ares o
f Anto
fagast
a Ter
mina
l Inter
nacio
nal S.
A.Gu
arante
e obli
gation
s for lo
an gr
anted
Banco
Estad
o33
,278
12.23
.2024
USD$
33,27
8,000
Saam P
uertos
S.A.
Pledge
onsha
resof
Termi
nalP
uerto
Arica
S.A.
Guara
ntee o
bligat
ions fo
r loan
gran
tedBa
nco de
Crédi
to e In
versio
nes
2,962
12.15
.2019
USD$
2,962
,285
Inmob
iliaria
Marí
tima P
ortua
ria Ltd
a.Mo
rtage
Guara
ntee o
bligat
ions fo
r loan
gran
tedBa
nco de
l Estad
o de C
hile
480
05.28
.2018
UF$
11,82
7Tug
brasil
Apoio
Portu
ário S
.A.Ma
rine m
ortage
Guara
nteeo
bligat
ionsf
orloa
ngran
tedin
confor
mity
withF
inanci
ngCo
ntract
s No.9
7.2.49
1.3.1
Banco
Nacio
nal d
o Dese
nvolvi
mento
Econ
ómico
e Soci
al –
BNDE
S33
,208
Severa
l ma
turitie
sUS
D$33
,207,7
50
Tugbra
sil Ap
oio Po
rtuári
o S.A.
Marin
e mort
age
Guara
ntee o
bligat
ions fo
r loan
gran
ted in
confo
rmity
with
Finan
cing
Contr
act th
rough
Fixed
Credit
Merc
hant
Marin
e No.2
0/005
03‐2
Banco
do Br
asil S.
A.32
,982
Severa
l ma
turitie
sUS
D$32
,981,6
43
Kios S
.A.Ma
rine m
ortage
Guara
ntee o
bligat
ions fo
r loan
gran
tedBa
nco Ci
tiban
k N.A.,
Urugu
ay1,1
4312
.31.20
15US
D$1,1
42,85
7Ecu
aestib
as S.A
.Ins
urance
polic
yGu
arante
efor
thetem
porar
yimp
ortof
tugbo
ats,b
oats,
contai
nercar
riers,
tracto
r unit
s and
traile
rs.Ecu
adori
an Na
tiona
l Cust
oms A
gency
3,106
Severa
l ma
turitie
sUS
D$3,1
06,44
1
Inarpi
S.A.
Insura
nce po
licy
Guara
ntee th
e com
plian
ce wit
h cust
om du
ties fo
r temp
orary
storag
e.Ecu
adori
an Na
tiona
l Cust
oms A
gency
9,568
Severa
l ma
turitie
sUS
D$9,5
67,63
8
Kios S
.A.Tre
asury
bond
s(De
bt Uru
guay G
overnm
ent)
Guara
nteeo
bligat
ionsa
sport
opera
torin
Urugua
yincon
formi
tywith
Decre
e No.4
13 of
Septe
mber
1, 199
2.Na
tiona
l Port
Admi
nistra
tion
150
No ma
turity
USD$
150,0
00
144,56
5
212
2014 Annual Report
SOCIEDAD MATRIZ SAAM S.A. AND SUBSIDIARY
Notes to the Consolidated Financial Statements
122
NOTE 36 Contingencies and Commitments, continued (36.4) Mutual guarantee
Guarantee of the absolute compliance of the liabilities contained in the stockholders' agreements entered into between Saam Puertos S.A. and SSAHI‐Chile on December 26, 2007, related to shares of San Antonio Terminal Internacional S.A. and San Vicente Terminal Internacional S.A., by virtue of which SAAM and Carrix Inc., mutually guarantee to indemnity its subsidiaries SSAHI‐Chile and Saam Puertos S.A., respectively. These guarantees will be held during the valid period of the contract.
(36.5) Lawsuits
The Company has some pending litigation and lawsuits for compensation for damages from its operating activity. Amounts below the deductible have been provisioned and the Company also has insurance policies as hedging for possible loss contingencies.
213
SOCIEDAD MATRIZ SAAM S.A. AND SUBSIDIARY
Notes to the Consolidated Financial Statements
123
NOTE 36 Contingencies and Commitments, continued
(36.6) Restrictions to management or financial indicators
The Parent and its subsidiaries have complied with all the contractual provisions regulating their management activities and financial ratios.
a) Revolving credit facility agreement with Banco de Crédito e Inversiones (BCI), obtained by the subsidiary SAAM S.A. granted in December 2009.
As long as the payment of any loans granted under the credit contract is pending, SAAM is obliged to maintain the following financial ratio in its consolidated financial statements as of June 30 and December 31 of each year: 1. Net financial debt ratio divided by EBITDA (last 12 months) equal to or lower than three times (<=3)
b) Revolving credit facility agreement with Banco Crédito e Inversiones and Banco Estado, obtained by
the indirect subsidiary Iquique Terminal Internacional S.A. (ITI). As long as the payment of any loans granted under the credit contract is pending, ITI is obliged to maintain the following financial ratios in its consolidated financial statements as of December 31 of each year: 1. Financial indebtedness ratio on EBITDA should not be higher than 3.5 in 2013, 4.5 in 2014, 4.0
in 2015 and 3.5 from 2016 onwards. 2. Minimum debt service hedging ratio of one time (>=1). 3. Financial debt on equity (<=3).
c) Revolving credit facility agreement with Banco Estado, obtained by the indirect subsidiary Iquique Terminal Internacional S.A. (ITI). As long as the payment of any loans granted under the credit contract is pending, ITI is obliged to maintain the following financial ratios in its consolidated financial statements as of December 31 of each year: 1. Financial Indebtedness ratio on EBITDA (<=3) 2. Debt service hedging ratio (>=1). 3. Maintain in the financial statements as of December 31 of each year equity not lower than
ThUS$ 10,000
214
2014 Annual Report
SOCIEDAD MATRIZ SAAM S.A. AND SUBSIDIARY
Notes to the Consolidated Financial Statements
124
NOTE 36 Contingencies and Commitments, continued (36.6) Restrictions to management or financial indicators
d) Revolving credit facility agreement with Banco Inbursa, obtained by indirect subsidiary Saam Remolques S.A. de C.V. As long as the payment of any loans granted under the credit contract is pending, Saam Remolques, is obliged to maintain the following financial ratios in its consolidated financial statements for each quarter: 1. Financial indebtedness ratio on, maximum two point five times (<=2.5) 2. Interest rate hedging ratio(>3). 3. Minimum equity MX$ 600,000.
e) Revolving credit facility agreement with Banco Bancomer, obtained by indirect subsidiary Saam Remolques S.A. de C.V. As long the payment of any loans granted under the credit contract is pending, Saam Remolques is obliged to maintain the following financial ratios in Saam Remolques’s financial statements under local accounting principles (Mexico) as of December 31 of each year:
1. Liquidity (>=1) 2. Total liability/equity (<=1) 3. Interest rate hedging (3 times)
f) Revolving credit facility agreement with Banco Corpbanca NY, obtained by indirect subsidiary Saam Remolques S.A. de C.V.
As long the payment of any loans granted under the credit contract is pending, Saam Remolques is obliged to maintain the following financial ratio in Saam Remolques’s financial statements under local accounting principles (Mexico) as of December 31 of each year:
1. Net debt/EBITDA (<=3)
g) Revolving credit facility agreement with Banco Citibank Uruguay, obtained by indirect subsidiary Kios S.A.
As long the payment of any loans granted under the credit contract is pending, Kios S.A. is obliged to maintain the following financial ratios under local accounting principles (Uruguay) as of December 31 of each year: 1. Current ratio (>=1.3) 2. Total indentedness ratio (<=1) 3. Debt service hedging ratio (>1.4) 4. Financial debt ratio to EBITDA (<=2)
215
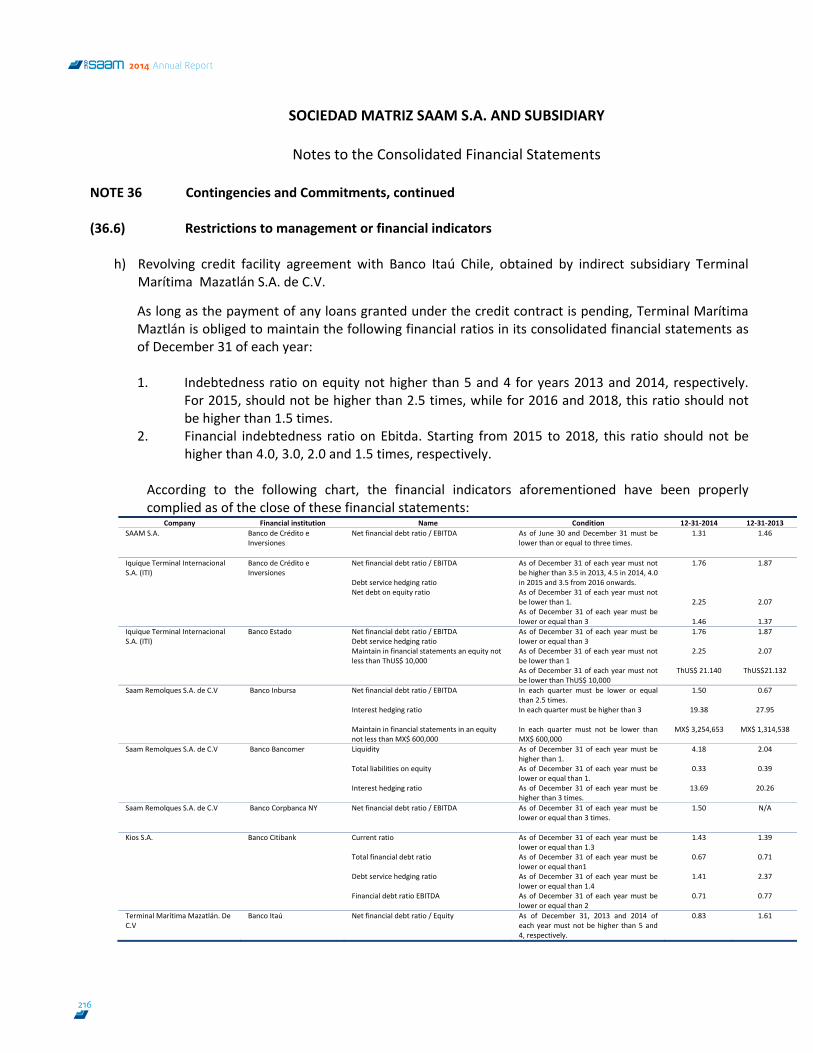
SOCIEDAD MATRIZ SAAM S.A. AND SUBSIDIARY
Notes to the Consolidated Financial Statements
125
NOTE 36 Contingencies and Commitments, continued (36.6) Restrictions to management or financial indicators
h) Revolving credit facility agreement with Banco Itaú Chile, obtained by indirect subsidiary Terminal
Marítima Mazatlán S.A. de C.V.
As long as the payment of any loans granted under the credit contract is pending, Terminal Marítima Maztlán is obliged to maintain the following financial ratios in its consolidated financial statements as of December 31 of each year: 1. Indebtedness ratio on equity not higher than 5 and 4 for years 2013 and 2014, respectively.
For 2015, should not be higher than 2.5 times, while for 2016 and 2018, this ratio should not be higher than 1.5 times.
2. Financial indebtedness ratio on Ebitda. Starting from 2015 to 2018, this ratio should not be higher than 4.0, 3.0, 2.0 and 1.5 times, respectively.
According to the following chart, the financial indicators aforementioned have been properly complied as of the close of these financial statements:
Company Financial institution Name Condition 12‐31‐2014 12‐31‐2013 SAAM S.A. Banco de Crédito e
Inversiones Net financial debt ratio / EBITDA
As of June 30 and December 31 must be lower than or equal to three times.
1.31 1.46
Iquique Terminal Internacional S.A. (ITI)
Banco de Crédito e Inversiones
Net financial debt ratio / EBITDA Debt service hedging ratio Net debt on equity ratio
As of December 31 of each year must not be higher than 3.5 in 2013, 4.5 in 2014, 4.0 in 2015 and 3.5 from 2016 onwards. As of December 31 of each year must not be lower than 1. As of December 31 of each year must be lower or equal than 3
1.76
2.25
1.46
1.87
2.07
1.37 Iquique Terminal Internacional S.A. (ITI)
Banco Estado
Net financial debt ratio / EBITDA Debt service hedging ratio Maintain in financial statements an equity not less than ThUS$ 10,000
As of December 31 of each year must be lower or equal than 3 As of December 31 of each year must not be lower than 1 As of December 31 of each year must not be lower than ThUS$ 10,000
1.76
2.25
ThUS$ 21.140
1.87
2.07
ThUS$21.132
Saam Remolques S.A. de C.V Banco Inbursa
Net financial debt ratio / EBITDA Interest hedging ratio Maintain in financial statements in an equity not less than MX$ 600,000
In each quarter must be lower or equal than 2.5 times. In each quarter must be higher than 3 In each quarter must not be lower than MX$ 600,000
1.50
19.38
MX$ 3,254,653
0.67
27.95
MX$ 1,314,538
Saam Remolques S.A. de C.V Banco Bancomer
Liquidity Total liabilities on equity Interest hedging ratio
As of December 31 of each year must be higher than 1. As of December 31 of each year must be lower or equal than 1. As of December 31 of each year must be higher than 3 times.
4.18
0.33
13.69
2.04
0.39
20.26
Saam Remolques S.A. de C.V Banco Corpbanca NY
Net financial debt ratio / EBITDA
As of December 31 of each year must be lower or equal than 3 times.
1.50 N/A
Kios S.A. Banco Citibank Current ratio Total financial debt ratio Debt service hedging ratio Financial debt ratio EBITDA
As of December 31 of each year must be lower or equal than 1.3 As of December 31 of each year must be lower or equal than1 As of December 31 of each year must be lower or equal than 1.4 As of December 31 of each year must be lower or equal than 2
1.43
0.67
1.41
0.71
1.39
0.71
2.37
0.77
Terminal Marítima Mazatlán. De C.V
Banco Itaú
Net financial debt ratio / Equity As of December 31, 2013 and 2014 of each year must not be higher than 5 and 4, respectively.
0.83
1.61
216
2014 Annual Report
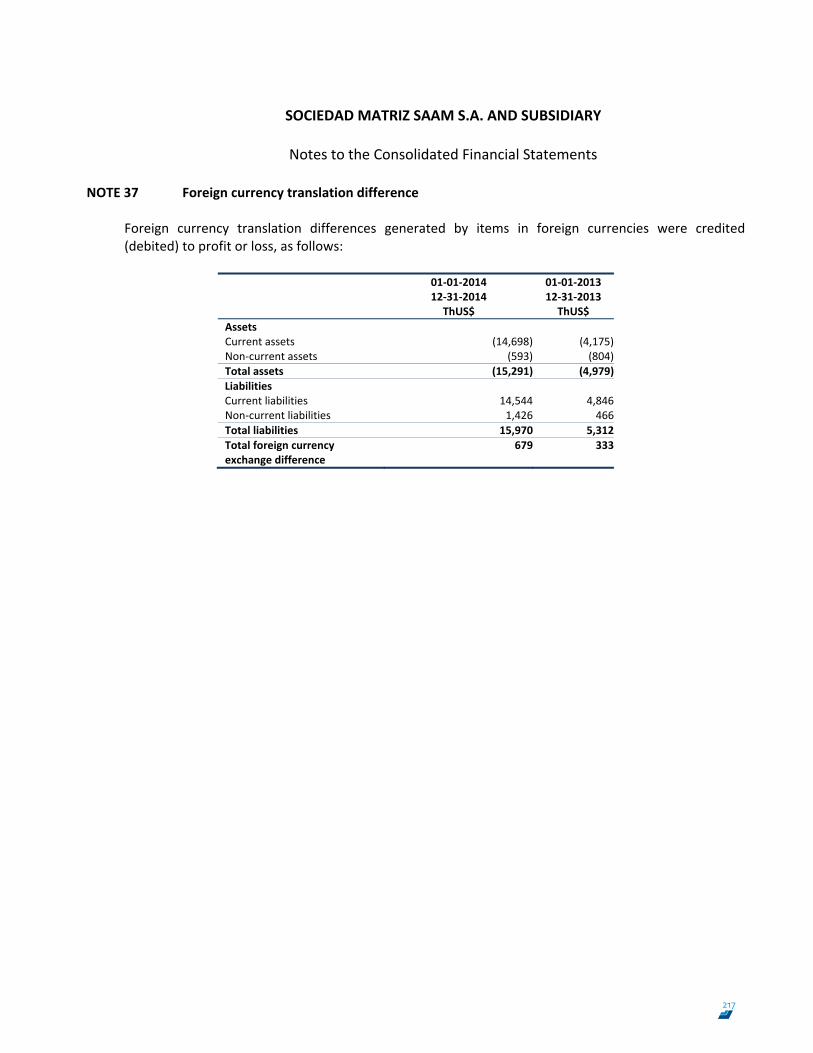
SOCIEDAD MATRIZ SAAM S.A. AND SUBSIDIARY
Notes to the Consolidated Financial Statements
126
NOTE 37 Foreign currency translation difference Foreign currency translation differences generated by items in foreign currencies were credited (debited) to profit or loss, as follows:
01‐01‐2014 12‐31‐2014 ThUS$
01‐01‐2013 12‐31‐2013 ThUS$
Assets Current assets (14,698) (4,175)Non‐current assets (593) (804)Total assets (15,291) (4,979)Liabilities Current liabilities 14,544 4,846Non‐current liabilities 1,426 466Total liabilities 15,970 5,312Total foreign currency exchange difference
679 333
217
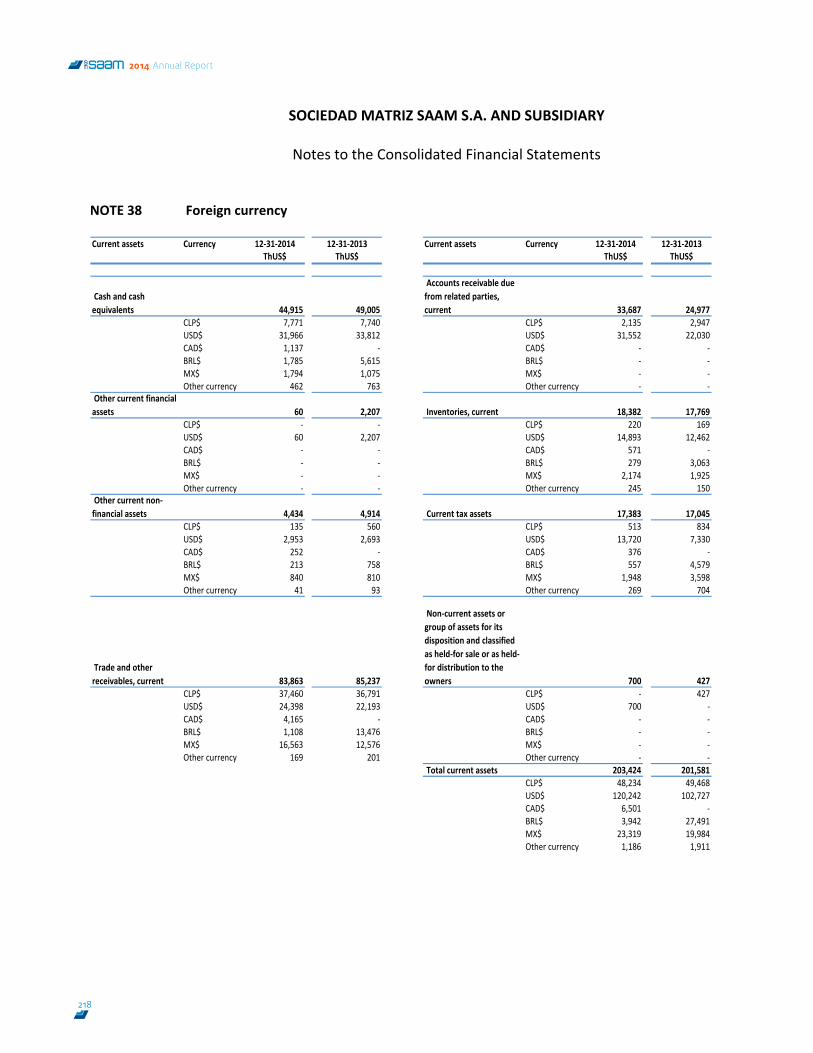
SOCIEDAD MATRIZ SAAM S.A. AND SUBSIDIARY
Notes to the Consolidated Financial Statements
127
NOTE 38 Foreign currency Current assets Currency 12‐31‐2014 12‐31‐2013 Current assets Currency 12‐31‐2014 12‐31‐2013
ThUS$ ThUS$ ThUS$ ThUS$
Cash and cash equivalents 44,915 49,005
Accounts receivable due from related parties, current 33,687 24,977
CLP$ 7,771 7,740 CLP$ 2,135 2,947USD$ 31,966 33,812 USD$ 31,552 22,030CAD$ 1,137 ‐ CAD$ ‐ ‐BRL$ 1,785 5,615 BRL$ ‐ ‐MX$ 1,794 1,075 MX$ ‐ ‐Other currency 462 763 Other currency ‐ ‐
Other current financial assets 60 2,207 Inventories, current 18,382 17,769
CLP$ ‐ ‐ CLP$ 220 169USD$ 60 2,207 USD$ 14,893 12,462CAD$ ‐ ‐ CAD$ 571 ‐BRL$ ‐ ‐ BRL$ 279 3,063MX$ ‐ ‐ MX$ 2,174 1,925Other currency ‐ ‐ Other currency 245 150
Other current non‐financial assets 4,434 4,914 Current tax assets 17,383 17,045
CLP$ 135 560 CLP$ 513 834USD$ 2,953 2,693 USD$ 13,720 7,330CAD$ 252 ‐ CAD$ 376 ‐BRL$ 213 758 BRL$ 557 4,579MX$ 840 810 MX$ 1,948 3,598Other currency 41 93 Other currency 269 704
Trade and other receivables, current 83,863 85,237
Non‐current assets or group of assets for its disposition and classified as held‐for sale or as held‐for distribution to the owners 700 427
CLP$ 37,460 36,791 CLP$ ‐ 427USD$ 24,398 22,193 USD$ 700 ‐CAD$ 4,165 ‐ CAD$ ‐ ‐BRL$ 1,108 13,476 BRL$ ‐ ‐MX$ 16,563 12,576 MX$ ‐ ‐Other currency 169 201 Other currency ‐ ‐
Total current assets 203,424 201,581CLP$ 48,234 49,468USD$ 120,242 102,727CAD$ 6,501 ‐BRL$ 3,942 27,491MX$ 23,319 19,984Other currency 1,186 1,911
218
2014 Annual Report
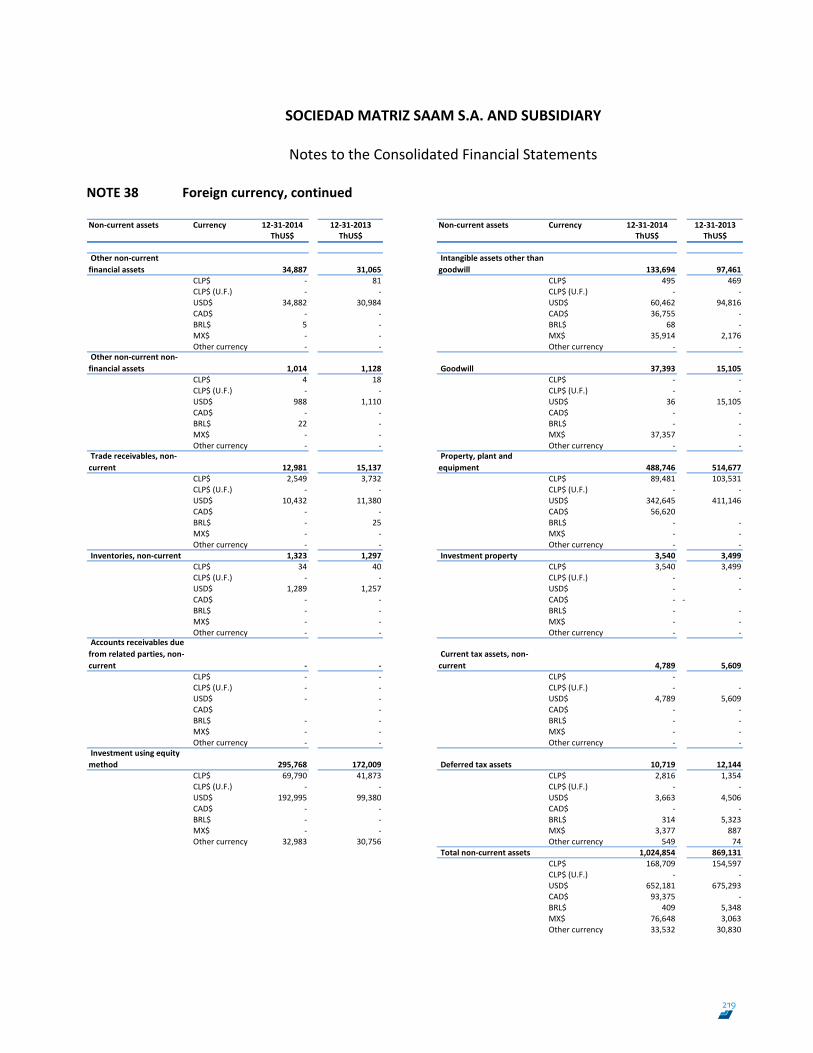
SOCIEDAD MATRIZ SAAM S.A. AND SUBSIDIARY
Notes to the Consolidated Financial Statements
128
NOTE 38 Foreign currency, continued Non‐current assets Currency 12‐31‐2014 12‐31‐2013 Non‐current assets Currency 12‐31‐2014 12‐31‐2013
ThUS$ ThUS$ ThUS$ ThUS$
Other non‐current financial assets 34,887 31,065
Intangible assets other than goodwill 133,694 97,461
CLP$ ‐ 81 CLP$ 495 469CLP$ (U.F.) ‐ ‐ CLP$ (U.F.) ‐ ‐USD$ 34,882 30,984 USD$ 60,462 94,816CAD$ ‐ ‐ CAD$ 36,755 ‐BRL$ 5 ‐ BRL$ 68 ‐MX$ ‐ ‐ MX$ 35,914 2,176Other currency ‐ ‐ Other currency ‐ ‐
Other non‐current non‐financial assets 1,014 1,128 Goodwill 37,393 15,105
CLP$ 4 18 CLP$ ‐ ‐CLP$ (U.F.) ‐ ‐ CLP$ (U.F.) ‐ ‐USD$ 988 1,110 USD$ 36 15,105CAD$ ‐ ‐ CAD$ ‐ ‐BRL$ 22 ‐ BRL$ ‐ ‐MX$ ‐ ‐ MX$ 37,357 ‐Other currency ‐ ‐ Other currency ‐ ‐
Trade receivables, non‐current 12,981 15,137
Property, plant and equipment 488,746 514,677
CLP$ 2,549 3,732 CLP$ 89,481 103,531CLP$ (U.F.) ‐ ‐ CLP$ (U.F.) ‐ ‐USD$ 10,432 11,380 USD$ 342,645 411,146CAD$ ‐ ‐ CAD$ 56,620BRL$ ‐ 25 BRL$ ‐ ‐MX$ ‐ ‐ MX$ ‐ ‐Other currency ‐ ‐ Other currency ‐ ‐
Inventories, non‐current 1,323 1,297 Investment property 3,540 3,499CLP$ 34 40 CLP$ 3,540 3,499CLP$ (U.F.) ‐ ‐ CLP$ (U.F.) ‐ ‐USD$ 1,289 1,257 USD$ ‐ ‐CAD$ ‐ ‐ CAD$ ‐ ‐BRL$ ‐ ‐ BRL$ ‐ ‐MX$ ‐ ‐ MX$ ‐ ‐Other currency ‐ ‐ Other currency ‐ ‐
Accounts receivables due from related parties, non‐current ‐ ‐
Current tax assets, non‐current 4,789 5,609
CLP$ ‐ ‐ CLP$ ‐CLP$ (U.F.) ‐ ‐ CLP$ (U.F.) ‐ ‐USD$ ‐ ‐ USD$ 4,789 5,609CAD$ ‐ CAD$ ‐ ‐BRL$ ‐ ‐ BRL$ ‐ ‐MX$ ‐ ‐ MX$ ‐ ‐Other currency ‐ ‐ Other currency ‐ ‐
Investment using equity method 295,768 172,009 Deferred tax assets 10,719 12,144
CLP$ 69,790 41,873 CLP$ 2,816 1,354CLP$ (U.F.) ‐ ‐ CLP$ (U.F.) ‐ ‐USD$ 192,995 99,380 USD$ 3,663 4,506CAD$ ‐ ‐ CAD$ ‐ ‐BRL$ ‐ ‐ BRL$ 314 5,323MX$ ‐ ‐ MX$ 3,377 887Other currency 32,983 30,756 Other currency 549 74
Total non‐current assets 1,024,854 869,131CLP$ 168,709 154,597CLP$ (U.F.) ‐ ‐USD$ 652,181 675,293CAD$ 93,375 ‐BRL$ 409 5,348MX$ 76,648 3,063Other currency 33,532 30,830
219
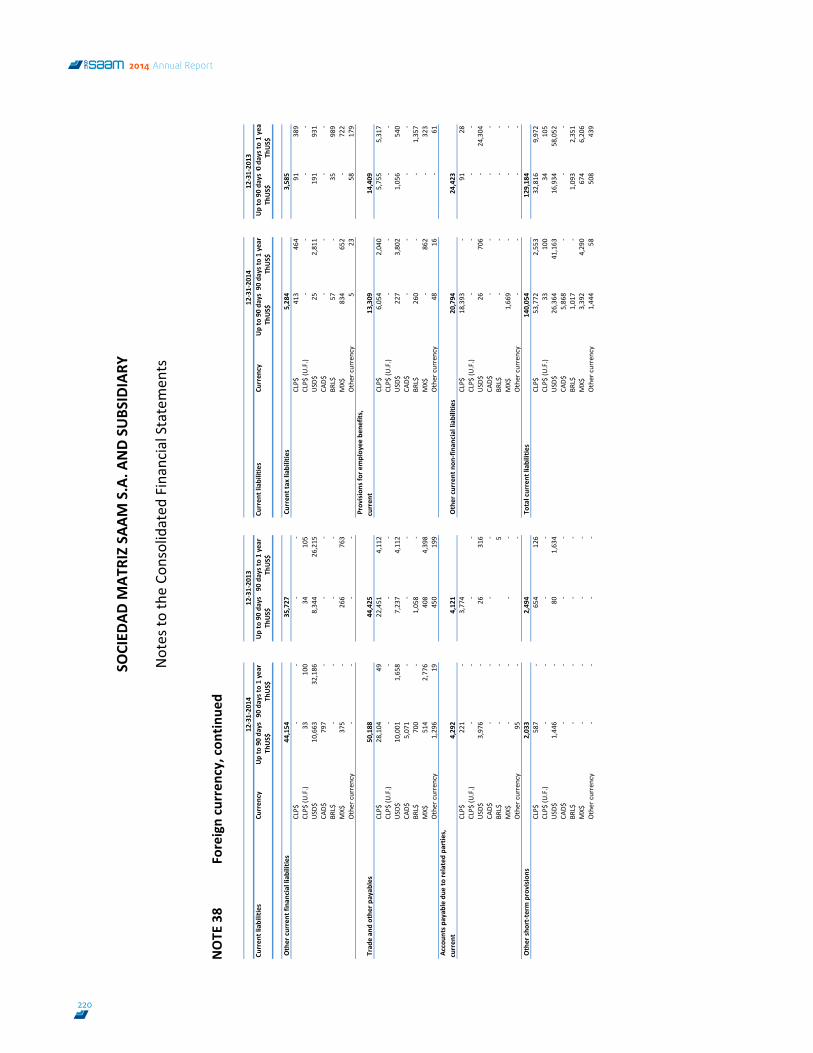
SOCIED
AD M
ATRIZ SA
AM S.A. A
ND SU
BSIDIARY
Notes to
the Co
nsolidated
Financial Statemen
ts
129
NOTE
38
Foreign curren
cy, con
tinue
d Cu
rren
t liabilities
Curren
cyUp to 90 da
ys90
days to 1 year
Up to 90 da
ys90
days to 1 year
Curren
t liabilities
Curren
cyUp to 90 da
ys90
days to 1 year
Up to 90 da
ys90
days to 1 yea
ThUS$
ThUS$
ThUS$
ThUS$
ThUS$
ThUS$
ThUS$
ThUS$
Other current fina
ncial liabilities
44,154
35,727
Curren
t tax liab
ilitie
s 5,28
43,58
5CLP$
‐‐
‐‐
CLP$
413
464
91389
CLP$
(U.F.)
3310
034
105
CLP$
(U.F.)
‐‐
‐‐
USD$
10,663
32,186
8,344
26,215
USD
$25
2,81
119
1931
CAD$
797
‐‐
‐CA
D$‐
‐‐
‐BR
L$‐
‐‐
‐BR
L$57
‐35
989
MX$
375
‐266
763
MX$
834
652
‐722
Other currency
‐‐
‐‐
Other currency
523
58179
Trade
and
other payab
les
50,188
44,425
Prov
ision
s for employ
ee ben
efits,
curren
t 13
,309
14,409
CLP$
28,104
4922,451
4,11
2CLP$
6,05
42,04
05,75
55,317
CLP$
(U.F.)
‐‐
‐‐
CLP$
(U.F.)
‐‐
‐‐
USD$
10,001
1,65
87,237
4,11
2USD
$22
73,80
21,05
6540
CAD$
5,071
‐‐
‐CA
D$‐
‐‐
‐BR
L$700
‐1,058
‐BR
L$26
0‐
‐1,357
MX$
514
2,77
6408
4,39
8MX$
‐86
2‐
323
Other currency
1,296
19450
199
Other currency
4816
‐61
Accou
nts p
ayab
le due
to re
lated pa
rties,
curren
t 4,292
4,121
Other current non
‐fina
ncial liabilities
20,794
24,423
CLP$
221
‐3,774
CLP$
18,393
‐91
28CLP$
(U.F.)
‐‐
‐‐
CLP$
(U.F.)
‐‐
‐‐
USD$
3,976
‐26
316
USD
$26
706
‐24,304
CAD$
‐‐
‐‐
CAD$
‐‐
‐‐
BRL$
‐‐
5BR
L$‐
‐‐
‐MX$
‐‐
‐‐
MX$
1,66
9‐
‐‐
Other currency
95‐
‐Other currency
‐‐
‐‐
Other sh
ort‐term
provision
s 2,033
2,494
Total current liab
ilitie
s 14
0,05
4129,18
4CLP$
587
‐654
126
CLP$
53,772
2,55
332
,816
9,972
CLP$
(U.F.)
‐‐
‐‐
CLP$
(U.F.)
3310
034
105
USD$
1,446
‐80
1,63
4USD
$26
,364
41,163
16,934
58,052
CAD$
‐‐
‐‐
CAD$
5,86
8‐
‐‐
BRL$
‐‐
‐‐
BRL$
1,01
7‐
1,09
32,351
MX$
‐‐
‐‐
MX$
3,39
24,29
067
46,206
Other currency
‐‐
‐‐
Other currency
1,44
458
508
439
12‐31‐2014
12‐31‐2013
12‐31‐2014
12‐31‐20
13
220
2014 Annual Report
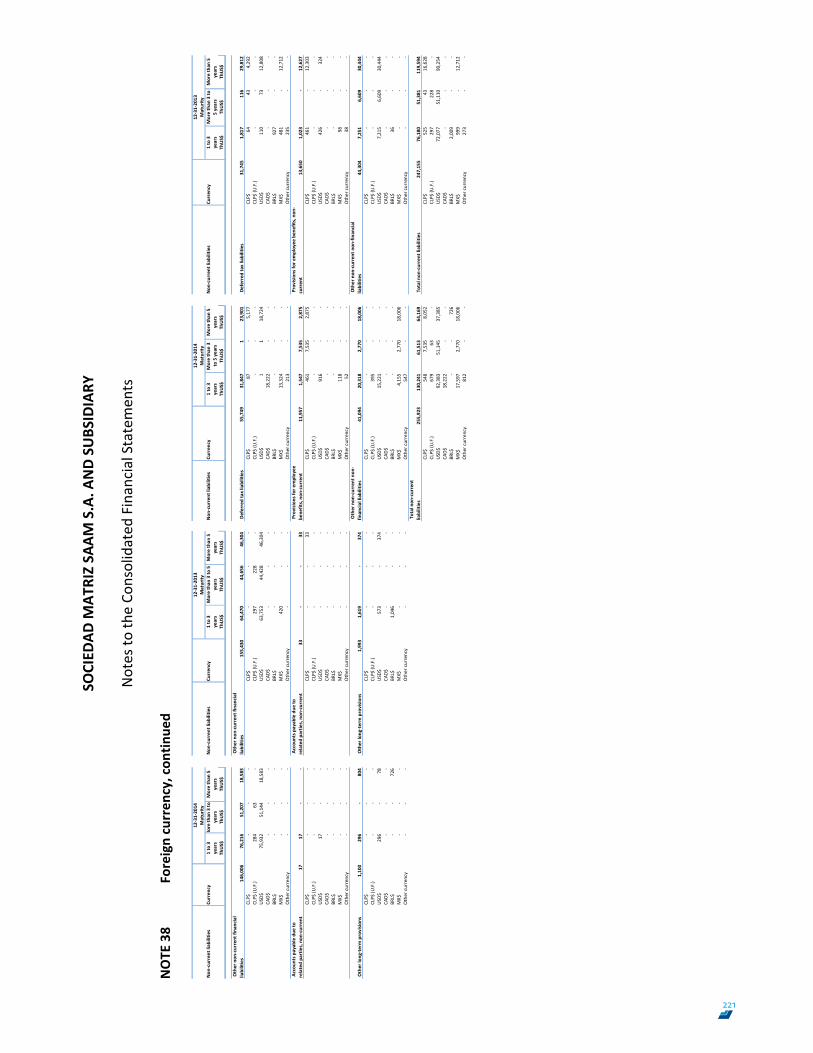
SOCIED
AD M
ATRIZ SA
AM S.A. A
ND SU
BSIDIARY
Notes to
the Co
nsolidated
Financial Statemen
ts
130
NOTE
38
Foreign curren
cy, con
tinue
d Non
‐current liab
ilitie
sCu
rren
cy1 to 3
More than
3 to
More than
5Non
‐current liab
ilitie
sCu
rren
cy1 to 3
More than
3 to
5More than
5Non
‐current liab
ilitie
sCu
rren
cy1 to 3
More than
3
More than
5Non
‐current liab
ilitie
sCu
rren
cy1 to 3
More than
3 to
More than
5years
years
years
years
years
years
years
to 5 years
years
years
5 years
years
ThUS$
ThUS$
ThUS$
ThUS$
ThUS$
ThUS$
ThUS$
ThUS$
ThUS$
ThUS$
ThUS$
ThUS$
Other non
‐current fina
ncial
liabilities
146,00
676
,216
51,207
18,583
Other non
‐current fina
ncial
liabilities
155,43
064
,470
44,656
46,304
Deferred
tax liabilities
55,749
31,847
123
,901
Deferred
tax liabilities
31,745
1,81
711
629
,812
CLP$
‐‐
‐CLP$
‐‐
‐CLP$
87‐
5,17
7CLP$
6443
4,29
2CLP$
(U.F.)
284
63‐
CLP$
(U.F.)
297
228
‐CLP$
(U.F.)
‐‐
‐CLP$
(U.F.)
‐‐
‐US
D$75
,932
51,144
18,583
USD
$63
,753
44,428
46,304
USD$
11
18,724
USD$
110
7312
,808
CAD$
‐‐
‐CA
D$‐
‐‐
CAD$
18,222
‐‐
CAD$
‐‐
‐BR
L$‐
‐‐
BRL$
‐‐
‐BR
L$‐
‐‐
BRL$
927
‐‐
MX$
‐‐
‐MX$
420
‐‐
MX$
13,324
‐‐
MX$
481
‐12
,712
Other currency
‐‐
‐Other currency
‐‐
‐Other currency
213
‐‐
Other currency
235
‐‐
Accou
nts p
ayab
le due
to
related pa
rties, non
‐current
1717
‐‐
Accou
nts p
ayab
le due
to
related pa
rties, non
‐current
33‐
‐33
Prov
ision
s for employ
ee
bene
fits, non
‐current
11,957
1,54
77,53
52,87
5Prov
ision
s for employ
ee ben
efits, n
on‐
curren
t 13
,650
1,02
3‐
12,627
CLP$
‐‐
‐CLP$
‐‐
33CLP$
461
7,53
52,87
5CLP$
461
‐12
,303
CLP$
(U.F.)
‐‐
‐CLP$
(U.F.)
‐‐
‐CLP$
(U.F.)
‐‐
‐CLP$
(U.F.)
‐‐
‐US
D$17
‐‐
USD
$‐
‐‐
USD$
916
‐‐
USD$
426
‐32
4CA
D$‐
‐‐
CAD$
‐‐
‐CA
D$‐
‐‐
CAD$
‐‐
‐BR
L$‐
‐‐
BRL$
‐‐
‐BR
L$‐
‐‐
BRL$
‐‐
‐MX$
‐‐
‐MX$
‐‐
‐MX$
118
‐‐
MX$
98‐
‐Other currency
‐‐
‐Other currency
‐‐
‐Other currency
52‐
‐Other currency
38‐
‐
Other lo
ng‐term provisio
ns
1,10
029
6‐
804
Other lo
ng‐term provisio
ns
1,99
31,61
9‐
374
Other non
‐current non
‐fin
ancial liab
ilitie
s 41,094
20,318
2,77
018
,006
Other non
‐current non
‐fina
ncial
liabilities
44,304
7,25
16,60
930
,444
CLP$
‐‐
‐CLP$
‐‐
‐CLP$
‐‐
‐CLP$
‐‐
‐CLP$
(U.F.)
‐‐
‐CLP$
(U.F.)
‐‐
‐CLP$
(U.F.)
395
‐‐
CLP$
(U.F.)
‐‐
‐US
D$29
6‐
78USD
$57
3‐
374
USD$
15,221
‐‐
USD$
7,21
56,60
930
,444
CAD$
‐‐
‐CA
D$‐
‐‐
CAD$
‐‐
‐CA
D$‐
‐‐
BRL$
‐‐
726
BRL$
1,04
6‐
‐BR
L$‐
‐‐
BRL$
36‐
‐MX$
‐‐
‐MX$
‐‐
‐MX$
4,15
52,77
018
,006
MX$
‐‐
‐Other currency
‐‐
‐Other currency
‐‐
‐Other currency
547
‐‐
Other currency
‐‐
‐To
tal n
on‐current
liabilities
255,92
313
0,241
61,513
64,169
Total non
‐current liab
ilitie
s 24
7,15
576
,180
51,381
119,59
4CLP$
548
7,53
58,05
2CLP$
525
4316
,628
CLP$
(U.F.)
679
63‐
CLP$
(U.F.)
297
228
‐US
D$92
,383
51,145
37,385
USD$
72,077
51,110
90,254
CAD$
18,222
‐‐
CAD$
‐‐
‐BR
L$‐
‐72
6BR
L$2,00
9‐
‐MX$
17,597
2,77
018
,006
MX$
999
‐12
,712
Other currency
812
‐‐
Other currency
273
‐‐
12‐31‐20
1412
‐31‐20
13Maturity
Maturity
12‐31‐20
1412
‐31‐20
13Maturity
Maturity
221
SOCIEDAD MATRIZ SAAM S.A. AND SUBSIDIARY
Notes to the Consolidated Financial Statements
131
NOTE 39 Statements of Cash Flows 2014
a) Cash flows from investing activities
As of December 31, 2014, disbursements for the acquisition of property, plant and equipment amounted to ThCh$ 127,280, including value‐added tax of ThUS$ 2,352. Note 18.3 details the additions of ThUS$ 128,544. This difference is explained by the acquisition of a crane from indirect subsidiary Iquique Terminal Internacional S.A., which at the reporting date is outstanding for ThUS$ 2,974 and other acquisitions for ThUS$ 642. As of December 31, 2014, disbursements for the acquisition of intangible assets amounted to ThUS$ 1,961, including value‐added tax of ThUS$ 200. Note 17.3 details the additions of ThUS$1,830. This difference is explained by internal development costs capitalized to intangible assets of ThUS$69. Disbursements for the payment of non‐controlling interest of ThUS$ 3,601 correspond to the recurring increase in capital of indirect associate Transporte Fluviales Corral S.A. of ThUS$ 697, according to the interest percentage, acquisition of 0.2% of Elequip S.A. for ThUS$ 6. Accordingly, the interest percentage increased by 50%, and capital contribution in indirect associate Puerto Buenavista S.A. of ThUS$2,898 (See note 16.1). As of December 31, 2014, sale proceeds for property, plant and equipment amounted to ThUS$ 2,574. The cost of sale of these assets amounted to ThUS$ 2,328 (Note 18.3), generating a profit of ThUS$ 246 (Note 34). As of December 2014, cash flows from dividends received amounted to ThUS$14,763. In note 16.1, dividends distributed by associates amount to ThUS$14,756. The difference of ThUS$ 7 is reconciled as follows:
i) Less, dividends agreed in 2013 and paid in 2014, for a total of ThUS$ 2,504, from Terminal
Portuario Arica S.A. of ThUS$ 302, and San Antonio Terminal Internacional S.A. of ThUS$ 2,202.
ii) Plus, dividends agreed during the current period and pending payment as of December 31, 2014, for a total of ThUS$ 2,459 of San Antonio Terminal Internacional S.A., of ThUS$ 1,295, Sermapat S.A. of ThUS$754, Terminal Puerto Arica S.A. of ThUS$ 249, Antofagasta Terminal Internacional S.A. of ThUS$ 158, and LNG Tug of ThUS$ 3.
iii) Plus, ThUS$38 due to exchange rate fluctuations between the agreement and payment dates.
Other cash inflows of ThUS$ 5,928 relate to cash and cash equivalents acquired in a business combination by Panama and Canada of ThUS$ 6,403, less cash and cash equivalents divested from Tug Brasil S.A. of ThUS$ 475.
222
2014 Annual Report
SOCIEDAD MATRIZ SAAM S.A. AND SUBSIDIARY
Notes to the Consolidated Financial Statements
132
NOTE 39 Statements of Cash Flows, continued
2014
b) Cash flows from financing activities As of December 31, 2014, dividends paid and/or profit distributions amounted to ThUS$ 46,523, which corresponds to a dividend paid by Sociedad Matriz SAAM S.A. of ThUS$ 36,690, and dividends and profit distribution paid to non‐controlling interests of ThUS$ 9,833 (paid by the indirect subsidiaries Saam Remolcadores S.A. de C.V. of ThUS$ 43, Florida International Terminal, Llc of ThUS$ 1,386, Iquique Terminal Internacional S.A. of ThUS$ 1,052 Marsud Servicios Marítimos y Portuarios Ltda. of ThUS$ 38, Marsud Armazens Gerais Ltda. of ThUS$ 131, Saam Guatemala S.A. of ThUS$ 33, Smit Canadá Inc. of ThUS$ 7,146, and Inversiones San Marco Ltda. of ThUS$ 4). Dividends in the statement of changes in equity amounted to ThUS$ 35,899. The difference of ThUS$ 10,624 is explained by dividends accrued and agreed during the current period of ThUS$ 18,767, and those at reporting date that are pending payment, less dividends agreed in the previous period and paid during the current period of ThUS$ 22,380, less dividends paid by indirect subsidiary Smit Canadá Inc. of ThUS$ 7,146, plus ThUS$ 135 for exchange rate fluctuation between the payment date and the date agreed for the payment.
Cash flows arising from long‐term financing are explained by loans obtained by subsidiary SAAM S.A. of ThUS$ 40,000 with Banco Santander Chile, indirect subsidiary Inarpi S.A. of ThUS$ 8,000 with Banco BCI Chile, and indirect subsidiary Saam Remolques S.A. of ThUS$ 40,000 with Banco Corpbanca N.Y. The Company has obtained short‐term financing of ThUS$ 58,994, mainly for the use of revolving credit facilities and trade receivable factoring operations.
2013
a) Cash flows from investment activities
The disbursements for the acquisition of property, plant and equipment as of December 31, 2013 amounted ThUS$76,634, which includes the value‐added tax backed in the investment, for ThUS$2,747. In note 18.3 additions are informed, which corresponds to the same period for ThUS$74,490. This difference is explained by the acquisitions for the period of ThUS$ 139, which at the reporting are pending payment, and the acquisition through finance lease agreements of a crane of ThUS$ 464 by the subsidiary Florida International Terminal Llc.
Disbursements for the acquisition of intangible assets as of December 31, 2013 amounted to ThUS$ 5,702, which includes the value‐added tax in the investment of ThUS$ 878. Note 17.3 details the additions of ThUS$ 4,913. The difference is explained by acquisitions for the period of ThUS$ 89, which at the reporting date are pending payment.
223
SOCIEDAD MATRIZ SAAM S.A. AND SUBSIDIARY
Notes to the Consolidated Financial Statements
133
NOTE 39 Statements of Cash Flows, continued 2013
a) Cash flows from investment activities, continued
The disbursements for the acquisition of property, plant and equipment as of December 31, 2013 amounted ThUS$871, and it is composed of a) ThUS$595 corresponding to the sale price of the real state located in Antofagasta, that generated a profit of ThUS$326 and b) ThUS$276 corresponding to the sale of property, plant and equipment, that generated a profit of ThUS $122 (See note 34).
As of December 2013, cash flows from dividends received for ThUS$11,878 reconcile with the amount presented in the detail of investment in associates for ThUS$12,131 (Note 16.1), as follows:
iv) Less dividends agreed on in 2012 and paid in 2013, for an amount of ThUS$1,380, from Cargo
Park S.A.
v) Less dividends paid by Cargo Park, after its reclassification as non‐current asset held‐for‐sale for ThUS$1,467.
vi) Plus dividends receivables from the direct associates San Antonio Terminal Internacional S.A., Antofagasta Terminal Internacional S.A., Terminal Puerto Arica S.A. y LNG Tug S.A. for ThUS$2,202; ThUS$665; ThUS$301 and ThUS$5 respectively.
vii) Menos ThUS$ 73, efecto tipo cambio entre la fecha de acuerdo y fecha de pago de los dividendos.
b) Cash flows from financing activities
As of December 31, 2013, dividends paid amount to ThUS$31,965, corresponding to a dividend paid by Sociedad Matriz SAAM S.A. for ThUS$29,716 and dividends paid to minority interest for ThUS$2,249 (paid by the indirect subsidiaries Saam Guatemala S.A for ThUS$63, Marsud Servicios Marítimos y Portuarios Ltda. for ThUS$32, Marsud Armazens Gerais Ltda. for ThUS$147, Iquique Terminal Internacional S.A. for ThUS$600, Saam Remolcadores S.A. de C.V. for ThUS$ 216 and Florida International Terminal LLC for ThUS$1.191). In the statement of changes in equity, dividends amount to ThUS$36,308, both figures reconcile by adding dividends agreed on during the previous year and paid during this year for ThUS$18,096, less dividends provided and agreed on during the current year, and that at the reporting date are outstanding for ThUS$22,420, more ThUS$19 due to Exchange rate differential from the payment date and the date when the dividend payment was agreed.
224
2014 Annual Report
SOCIEDAD MATRIZ SAAM S.A. AND SUBSIDIARY
Notes to the Consolidated Financial Statements
134
NOTE 40 Environment The Parent is not affected by this concept, because SM‐SAAM is an investment company. At the closing date of the financial statements, the subsidiary SAAM S.A. and subsidiaries have written civil liability insurance policies in favor of third parties against pollution damages and/or fines resulting from pollution associated with its tugboat fleet up to a limit of ThUS$500,000 as annual aggregated amount.
NOTE 41 Subsequent Events
Between January 1, 2015, and the date of issuance of these financial statements there have been no financial or other events that could significantly affect their adequate presentation and/or interpretation.
225