and how it works how guided-wave radar · pdf fileensuring successful use of guided-wave radar...
TRANSCRIPT
Ensuring Successful Use of Guided-Wave Radar Level Measurement Technology
By Joseph D. Lewis
GGuided-wave radar and time domain reflectometry (TDR) have become increasingly popular for mea-suring the level of powders and bulk solids in bins and silos. Its use is growing at an estimated rate of 12–15% per year, and the size of the worldwide mar-ket for guided-wave radar level measurement devices is estimated to be nearly $65 million, with about $25 million being in solids measurement. This means that more than 13,000 units are sold for use in powder and bulk solids applications every year, and that number is growing.1 There is a good reason for the technology’s increasing use and popularity: it works. However, a few tips will enable users to start up and apply the instrument successfully.
How Guided-Wave Radar Beganand How It WorksGuided-wave-radar continuous-level sensors typically use TDR technology. This technology was pioneered in the first half of the 20th century for use in geologi-cal applications and later was used to detect cable breaks. In the 1990s, TDR was applied as a means for measuring the level of material in a vessel. In less than two decades, TDR and guided-wave radar have become
mainstays for mea-suring the levels of solids and liquids.
In order to iden-tify and explain the key issues that must be properly addressed to ensure successful use of a guided-wave-radar level sensor in a bulk solids applica-tion, it is necessary to illustrate how the technology works.
The level sensor consists of a set of electronics and a probe element. The probe element is called the wave-guide. The electronics continuously generate micro-wave/radar pulses that are transmitted down the probe. The frequency of the pulses is on the low-end of the radar or microwave spectrum—about 1 GHz. These low-power electromagnetic pulses are 1 ns in width.
Because the radar energy is guided to the material surface by the waveguide, the energy is focused and not dispersed into the air, unlike open-air (radar or sonic-type) devices. The size of the energy field sur-
28
Ap
ril
20
07
TechnicalExclusive
53.3 ft (16.2 m):cement surface
reflection
Reflection offtop of
counterweight
Reflection offend of counterweight
Signal initiated(in hatched area)
5.00 v
2.50 v1.04
0.00 v
t
Application:56-ft (17-m) silowith cementpowder
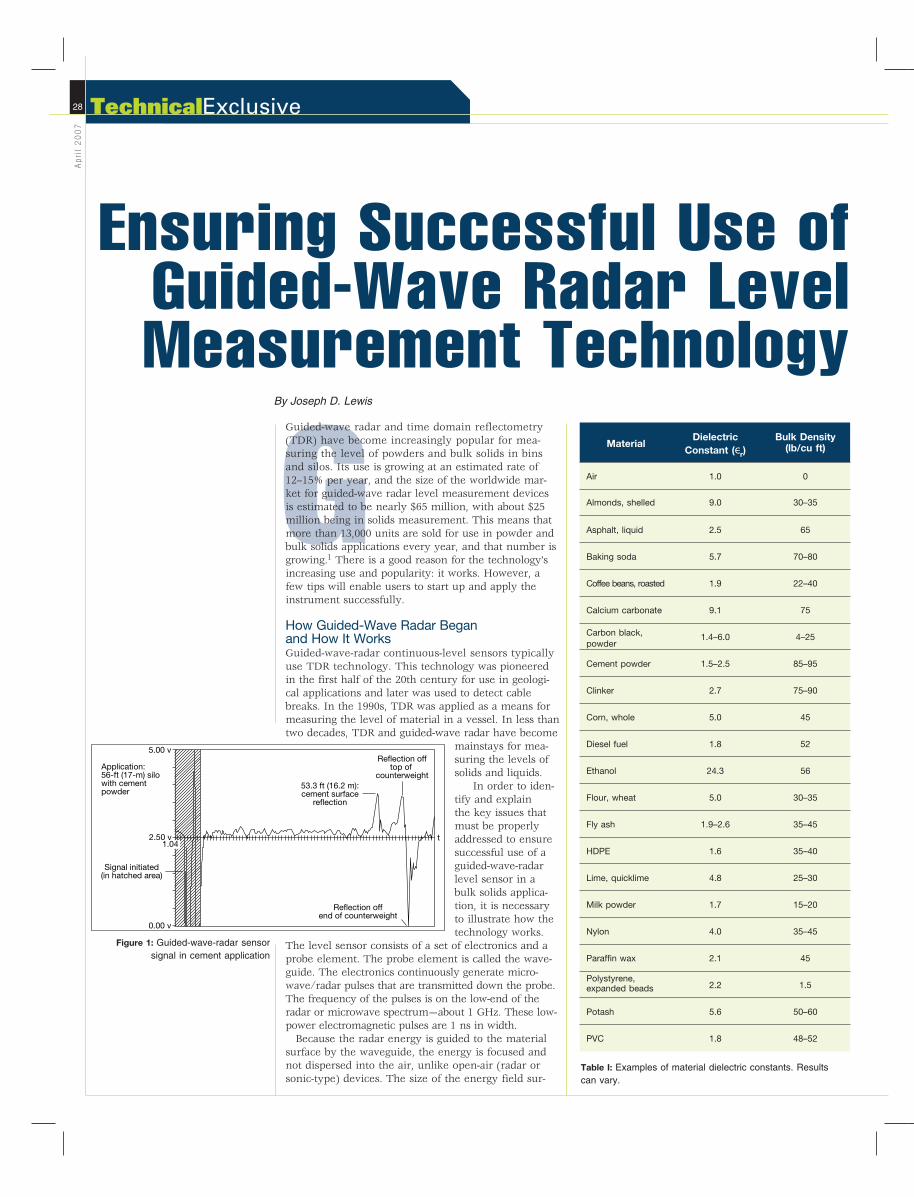
Figure 1: Guided-wave-radar sensor signal in cement application
MaterialDielectric
Constant ( r)Bulk Density
(lb/cu ft)
Air 1.0 0
Almonds, shelled 9.0 30–35
Asphalt, liquid 2.5 65
Baking soda 5.7 70–80
Coffee beans, roasted 1.9 22–40
Calcium carbonate 9.1 75
Carbon black,powder
1.4–6.0 4–25
Cement powder 1.5–2.5 85–95
Clinker 2.7 75–90
Corn, whole 5.0 45
Diesel fuel 1.8 52
Ethanol 24.3 56
Flour, wheat 5.0 30–35
Fly ash 1.9–2.6 35–45
HDPE 1.6 35–40
Lime, quicklime 4.8 25–30
Milk powder 1.7 15–20
Nylon 4.0 35–45
Paraffin wax 2.1 45
Polystyrene,expanded beads 2.2 1.5
Potash 5.6 50–60
PVC 1.8 48–52
Table I: Examples of material dielectric constants. Results can vary.
Ensuring Successful Use of Guided-Wave Radar Level Measurement Technology
By Joseph D. Lewis
GGuided-wave radar and time domain reflectometry (TDR) have become increasingly popular for mea-suring the level of powders and bulk solids in bins and silos. Its use is growing at an estimated rate of 12–15% per year, and the size of the worldwide mar-ket for guided-wave radar level measurement devices is estimated to be nearly $65 million, with about $25 million being in solids measurement. This means that more than 13,000 units are sold for use in powder and bulk solids applications every year, and that number is growing.1 There is a good reason for the technology’s increasing use and popularity: it works. However, a few tips will enable users to start up and apply the instrument successfully.
How Guided-Wave Radar Beganand How It WorksGuided-wave-radar continuous-level sensors typically use TDR technology. This technology was pioneered in the first half of the 20th century for use in geologi-cal applications and later was used to detect cable breaks. In the 1990s, TDR was applied as a means for measuring the level of material in a vessel. In less than two decades, TDR and guided-wave radar have become
mainstays for mea-suring the levels of solids and liquids.
In order to iden-tify and explain the key issues that must be properly addressed to ensure successful use of a guided-wave-radar level sensor in a bulk solids applica-tion, it is necessary to illustrate how the technology works.
The level sensor consists of a set of electronics and a probe element. The probe element is called the wave-guide. The electronics continuously generate micro-wave/radar pulses that are transmitted down the probe. The frequency of the pulses is on the low-end of the radar or microwave spectrum—about 1 GHz. These low-power electromagnetic pulses are 1 ns in width.
Because the radar energy is guided to the material surface by the waveguide, the energy is focused and not dispersed into the air, unlike open-air (radar or sonic-type) devices. The size of the energy field sur-
28
Ap
ril
20
07
TechnicalExclusive
53.3 ft (16.2 m):cement surface
reflection
Reflection offtop of
counterweight
Reflection offend of counterweight
Signal initiated(in hatched area)
5.00 v
2.50 v1.04
0.00 v
t
Application:56-ft (17-m) silowith cementpowder
Figure 1: Guided-wave-radar sensor signal in cement application
MaterialDielectric
Constant ( r)Bulk Density
(lb/cu ft)
Air 1.0 0
Almonds, shelled 9.0 30–35
Asphalt, liquid 2.5 65
Baking soda 5.7 70–80
Coffee beans, roasted 1.9 22–40
Calcium carbonate 9.1 75
Carbon black,powder
1.4–6.0 4–25
Cement powder 1.5–2.5 85–95
Clinker 2.7 75–90
Corn, whole 5.0 45
Diesel fuel 1.8 52
Ethanol 24.3 56
Flour, wheat 5.0 30–35
Fly ash 1.9–2.6 35–45
HDPE 1.6 35–40
Lime, quicklime 4.8 25–30
Milk powder 1.7 15–20
Nylon 4.0 35–45
Paraffin wax 2.1 45
Polystyrene,expanded beads 2.2 1.5
Potash 5.6 50–60
PVC 1.8 48–52
Table I: Examples of material dielectric constants. Results can vary.

rounding the waveguide or probe depends on the type of waveguide used, which is based on the specific application. This energy field can be as small as 1 in. in diameter or up to about 24 in. in diameter around the probe waveguide. In applications involving powders and granular materials, a single heavy-duty stainless-steel cable is typically used as the waveguide. These cable probes are as large as 0.31 in. in diameter and can handle traction loads up to nearly 4 tons, which is important for solids applications.
Figure 1 illustrates the level of cement pow-der in a silo measured using a 56-ft cable probe with a 0.31-in. diameter. The installation was good and the signal clean. Radar energy pulses travel at the speed of light along the waveguide. Upon reaching the material surface, the pulses are reflected back with an intensity that depends on the dielectric constant, r, of the material being measured. If the material r is 2.0, ap-proximately 2.0% of the energy will be reflected. While approximately 80% of the energy is re-flected from the surface of water ( r = 80),
granular plastics with dielectrics of 1.6 reflect only 1.6% of the energy. Dielectric constant values for some typical bulk solids are shown in Table I.
When the reflected pulses return, the guided-wave-radar sensor measures the time of flight between the emission and reception of the pulse signals. Half of the time measured is related to the distance of the instru-ment mounting point to the material surface. The differ-ence between the vessel height and the measured distance is the level of the ma-terial in the vessel.
Measurements using TDR are not influ-enced by dust. This is a particularly impor-tant feature of the technology when powders are measured, especially during filling with
pneumatic conveying systems, In addition, TDR is not influenced by temperature, pres-sure, or density variations.
Ensuring SuccessIn addition to following supplier recommenda-tions, users of guided-wave-radar technology
The Smartest DistanceBetween Two Points.
VAC-U-MAX is a premier manufacturer ofcustom pneumatic systems and supportequipment for conveying, batching, andweighing materials.
Count on us for:• Decades of engineering and conveying
expertise.• Customized solutions that meet your
specific needs. Because our systems arenot “off the shelf,” they are always onthe mark.
• Reliable equipment that’s proudly madein America.
• Our Airtight Performance Guarantee™. Westand behind every system we engineer.And we say it in writing.
For more information about our custom-engineered pneumatic systems andsolutions, call:
Air-driven solutions.
Belleville, New [email protected]
1-866-239-8449or visit online at:
www.vac-u-max.com/convey
Pneumatic Conveying Systems from VAC-U-MAX.
www.PowderBulkSolids.com 29
Ap
ril2
00
7
Figure 2: Guided-wave-radar signal in feed application.
Counterweight in contactwith vessel floor(no negative pulse fromcounterweight).Use of TBF mode notpossible, but not neededin this application
30.2 ft (9.2 m):empty vessel
Possible anomalyin flange area(did not affect abilityto measure in this application)
Application:31-ft (9.4-m) silowith feed pellet
Signal initiation(in hatched area)
0.00 v
2.50 v1.04
5.00 v
See us at Powder/Bulk Solids Southeast, Booth 1842 See us at Powder/Bulk Solids Southeast, Booth 1705
should consider the following four topics to ensure its successful use in measuring powder or bulk solid materials.
Dielectric Constant/Measuring Range.Dielectric constant and measuring range are interdependent. The lower the r of the target material, the more challenging the application becomes. The higher the measuring range, the more challenging. The exact relationship depends on the brand and implementation of TDR technology in the level sensor. Therefore, users should consult with a reliable supplier.
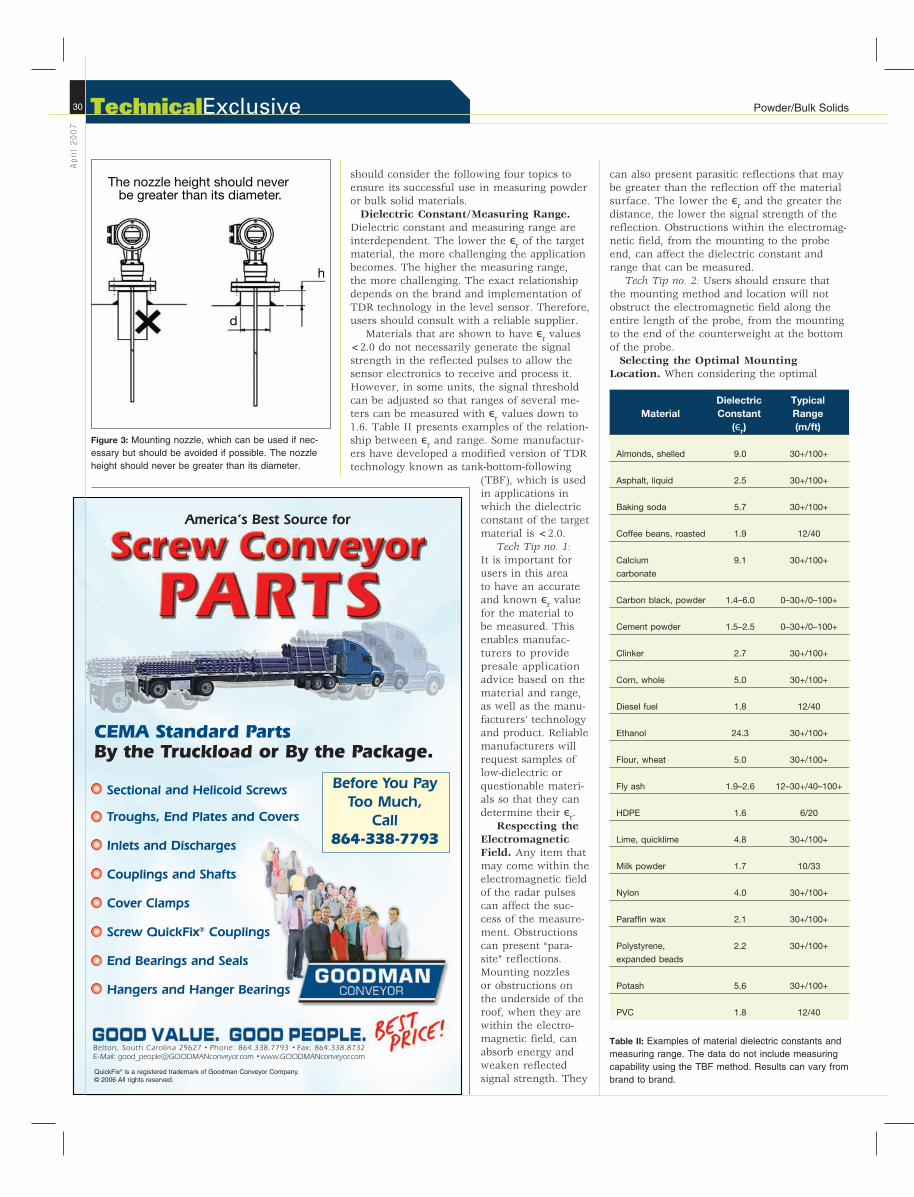
Materials that are shown to have r values <2.0 do not necessarily generate the signal strength in the reflected pulses to allow the sensor electronics to receive and process it. However, in some units, the signal threshold can be adjusted so that ranges of several me-ters can be measured with r values down to 1.6. Table II presents examples of the relation-ship between r and range. Some manufactur-ers have developed a modified version of TDR technology known as tank-bottom-following
(TBF), which is used in applications in which the dielectric constant of the target material is <2.0.
Tech Tip no. 1:It is important for users in this area to have an accurate and known r value for the material to be measured. This enables manufac-turers to provide presale application advice based on the material and range, as well as the manu-facturers’ technology and product. Reliable manufacturers will request samples of low-dielectric or questionable materi-als so that they can determine their r.
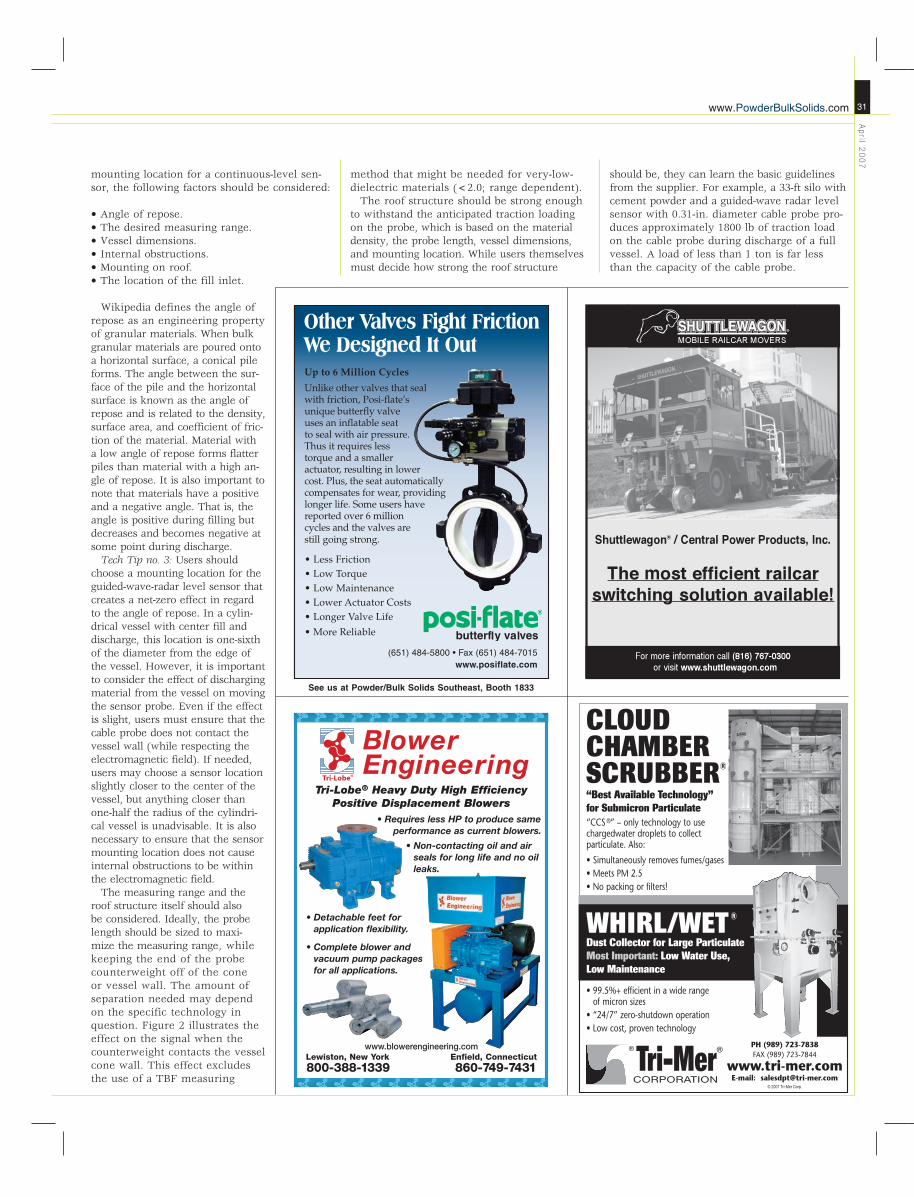
Respecting the Electromagnetic Field. Any item that may come within the electromagnetic field of the radar pulses can affect the suc-cess of the measure-ment. Obstructions can present “para-site” reflections. Mounting nozzles or obstructions on the underside of the roof, when they are within the electro-magnetic field, can absorb energy and weaken reflected signal strength. They
can also present parasitic reflections that may be greater than the reflection off the material surface. The lower the r and the greater the distance, the lower the signal strength of the reflection. Obstructions within the electromag-netic field, from the mounting to the probe end, can affect the dielectric constant and range that can be measured.
Tech Tip no. 2: Users should ensure that the mounting method and location will not obstruct the electromagnetic field along the entire length of the probe, from the mounting to the end of the counterweight at the bottom of the probe.
Selecting the Optimal Mounting Location. When considering the optimal
America’s Best Source for
CEMA Standard PartsBy the Truckload or By the Package.
Before You Pay
Too Much,
Call
864-338-7793
Sectional and Helicoid Screws
Troughs, End Plates and Covers
Inlets and Discharges
Couplings and Shafts
Cover Clamps
Screw QuickFix® Couplings
End Bearings and Seals
Hangers and Hanger Bearings
Belton, South Carolina 29627 Phone: 864.338.7793 Fax: 864.338.8732E-Mail: [email protected] www.GOODMANconveyor.com
QuickFix® is a registered trademark of Goodman Conveyor Company.© 2006 All rights reserved.
MaterialDielectric Constant
( r)
Typical Range (m/ft)
Almonds, shelled 9.0 30+/100+
Asphalt, liquid 2.5 30+/100+
Baking soda 5.7 30+/100+
Coffee beans, roasted 1.9 12/40
Calcium
carbonate
9.1 30+/100+
Carbon black, powder 1.4–6.0 0–30+/0–100+
Cement powder 1.5–2.5 0–30+/0–100+
Clinker 2.7 30+/100+
Corn, whole 5.0 30+/100+
Diesel fuel 1.8 12/40
Ethanol 24.3 30+/100+
Flour, wheat 5.0 30+/100+
Fly ash 1.9–2.6 12–30+/40–100+
HDPE 1.6 6/20
Lime, quicklime 4.8 30+/100+
Milk powder 1.7 10/33
Nylon 4.0 30+/100+
Paraffin wax 2.1 30+/100+
Polystyrene,
expanded beads
2.2 30+/100+
Potash 5.6 30+/100+
PVC 1.8 12/40
Table II: Examples of material dielectric constants and measuring range. The data do not include measuring capability using the TBF method. Results can vary from brand to brand.
Powder/Bulk Solids30
Ap
ril
20
07
TechnicalExclusive
Figure 3: Mounting nozzle, which can be used if nec-essary but should be avoided if possible. The nozzle height should never be greater than its diameter.
should consider the following four topics to ensure its successful use in measuring powder or bulk solid materials.
Dielectric Constant/Measuring Range.Dielectric constant and measuring range are interdependent. The lower the r of the target material, the more challenging the application becomes. The higher the measuring range, the more challenging. The exact relationship depends on the brand and implementation of TDR technology in the level sensor. Therefore, users should consult with a reliable supplier.
Materials that are shown to have r values <2.0 do not necessarily generate the signal strength in the reflected pulses to allow the sensor electronics to receive and process it. However, in some units, the signal threshold can be adjusted so that ranges of several me-ters can be measured with r values down to 1.6. Table II presents examples of the relation-ship between r and range. Some manufactur-ers have developed a modified version of TDR technology known as tank-bottom-following
(TBF), which is used in applications in which the dielectric constant of the target material is <2.0.
Tech Tip no. 1:It is important for users in this area to have an accurate and known r value for the material to be measured. This enables manufac-turers to provide presale application advice based on the material and range, as well as the manu-facturers’ technology and product. Reliable manufacturers will request samples of low-dielectric or questionable materi-als so that they can determine their r.
Respecting the Electromagnetic Field. Any item that may come within the electromagnetic field of the radar pulses can affect the suc-cess of the measure-ment. Obstructions can present “para-site” reflections. Mounting nozzles or obstructions on the underside of the roof, when they are within the electro-magnetic field, can absorb energy and weaken reflected signal strength. They
can also present parasitic reflections that may be greater than the reflection off the material surface. The lower the r and the greater the distance, the lower the signal strength of the reflection. Obstructions within the electromag-netic field, from the mounting to the probe end, can affect the dielectric constant and range that can be measured.
Tech Tip no. 2: Users should ensure that the mounting method and location will not obstruct the electromagnetic field along the entire length of the probe, from the mounting to the end of the counterweight at the bottom of the probe.
Selecting the Optimal Mounting Location. When considering the optimal
America’s Best Source for
CEMA Standard PartsBy the Truckload or By the Package.
Before You Pay
Too Much,
Call
864-338-7793
Sectional and Helicoid Screws
Troughs, End Plates and Covers
Inlets and Discharges
Couplings and Shafts
Cover Clamps
Screw QuickFix® Couplings
End Bearings and Seals
Hangers and Hanger Bearings
Belton, South Carolina 29627 Phone: 864.338.7793 Fax: 864.338.8732E-Mail: [email protected] www.GOODMANconveyor.com
QuickFix® is a registered trademark of Goodman Conveyor Company.© 2006 All rights reserved.
MaterialDielectric Constant
( r)
Typical Range (m/ft)
Almonds, shelled 9.0 30+/100+
Asphalt, liquid 2.5 30+/100+
Baking soda 5.7 30+/100+
Coffee beans, roasted 1.9 12/40
Calcium
carbonate
9.1 30+/100+
Carbon black, powder 1.4–6.0 0–30+/0–100+
Cement powder 1.5–2.5 0–30+/0–100+
Clinker 2.7 30+/100+
Corn, whole 5.0 30+/100+
Diesel fuel 1.8 12/40
Ethanol 24.3 30+/100+
Flour, wheat 5.0 30+/100+
Fly ash 1.9–2.6 12–30+/40–100+
HDPE 1.6 6/20
Lime, quicklime 4.8 30+/100+
Milk powder 1.7 10/33
Nylon 4.0 30+/100+
Paraffin wax 2.1 30+/100+
Polystyrene,
expanded beads
2.2 30+/100+
Potash 5.6 30+/100+
PVC 1.8 12/40
Table II: Examples of material dielectric constants and measuring range. The data do not include measuring capability using the TBF method. Results can vary from brand to brand.
Powder/Bulk Solids30
Ap
ril
20
07
TechnicalExclusive
Figure 3: Mounting nozzle, which can be used if nec-essary but should be avoided if possible. The nozzle height should never be greater than its diameter.
mounting location for a continuous-level sen-sor, the following factors should be considered:
• Angle of repose.• The desired measuring range.• Vessel dimensions.• Internal obstructions.• Mounting on roof.• The location of the fill inlet.
Wikipedia defines the angle of repose as an engineering property of granular materials. When bulk granular materials are poured onto a horizontal surface, a conical pile forms. The angle between the sur-face of the pile and the horizontal surface is known as the angle of repose and is related to the density, surface area, and coefficient of fric-tion of the material. Material with a low angle of repose forms flatter piles than material with a high an-gle of repose. It is also important to note that materials have a positive and a negative angle. That is, the angle is positive during filling but decreases and becomes negative at some point during discharge.
Tech Tip no. 3: Users should choose a mounting location for the guided-wave-radar level sensor that creates a net-zero effect in regard to the angle of repose. In a cylin-drical vessel with center fill and discharge, this location is one-sixth of the diameter from the edge of the vessel. However, it is important to consider the effect of discharging material from the vessel on moving the sensor probe. Even if the effect is slight, users must ensure that the cable probe does not contact the vessel wall (while respecting the electromagnetic field). If needed, users may choose a sensor location slightly closer to the center of the vessel, but anything closer than one-half the radius of the cylindri-cal vessel is unadvisable. It is also necessary to ensure that the sensor mounting location does not cause internal obstructions to be within the electromagnetic field.
The measuring range and the roof structure itself should also be considered. Ideally, the probe length should be sized to maxi-mize the measuring range, while keeping the end of the probe counterweight off of the cone or vessel wall. The amount of separation needed may depend on the specific technology in question. Figure 2 illustrates the effect on the signal when the counterweight contacts the vessel cone wall. This effect excludes the use of a TBF measuring
method that might be needed for very-low-dielectric materials (<2.0; range dependent).
The roof structure should be strong enough to withstand the anticipated traction loading on the probe, which is based on the material density, the probe length, vessel dimensions, and mounting location. While users themselves must decide how strong the roof structure
should be, they can learn the basic guidelines from the supplier. For example, a 33-ft silo with cement powder and a guided-wave radar level sensor with 0.31-in. diameter cable probe pro-duces approximately 1800 lb of traction load on the cable probe during discharge of a full vessel. A load of less than 1 ton is far less than the capacity of the cable probe.
www.blowerengineering.comLewiston, New York Enfield, Connecticut800-388-1339 860-749-7431
• Requires less HP to produce sameperformance as current blowers.
• Non-contacting oil and airseals for long life and no oilleaks.
• Detachable feet for application flexibility.
• Complete blower and vacuum pump packages for all applications.
Tri-Lobe® Heavy Duty High EfficiencyPositive Displacement Blowers
Other Valves Fight FrictionWe Designed It OutUp to 6 Million Cycles
Unlike other valves that sealwith friction, Posi-flate’sunique butterfly valveuses an inflatable seatto seal with air pressure.Thus it requires lesstorque and a smalleractuator, resulting in lowercost. Plus, the seat automaticallycompensates for wear, providinglonger life. Some users havereported over 6 millioncycles and the valves arestill going strong.
• Less Friction• Low Torque• Low Maintenance• Lower Actuator Costs• Longer Valve Life
• More Reliable
(651) 484-5800 • Fax (651) 484-7015www.posiflate.com
MOBILE RAILCAR MOVERS
For more information call or visit
www.PowderBulkSolids.com 31
Ap
ril2
00
7
See us at Powder/Bulk Solids Southeast, Booth 1833

�������� �� � �� ��������� � �������� ��� �����
��� ���������� ����� � ����� ��� ��������� � ������� ����������� �� �� �������! ��������
Tech Tip no. 4: The sensor mounting loca-tion will be affected by the fill stream, which is based on the fill inlet location. The sen-sor should not be installed so that the sensor probe will be in the path of the incoming ma-terial. A location as far from the fill inlet as possible should be chosen, although the other sensor location issues should be optimized.
Sensor Mounting. The method for mount-ing the sensor to the roof of the vessel can
determine the difference between success and failure. Users should pay careful attention to this issue in the supplier’s installation and operation manual.
Tech Tip no. 5: Whenever possible users should avoid employing mounting nozzles. Figures 3 and 4 present examples of typi-cal mounting-nozzle installations. The ideal mounting method is to mount guided-wave radar sensors plumb, directly inserting them into a welded coupling on top of the silo. Alternatively, an angled or flat mounting flange can be directly mounted to the vessel roof without a nozzle.
If a mounting nozzle of some type must be used (as in the case of a domed roof), the internal diameter of the nozzle must be greater than the height of the nozzle. For a given nozzle height, the greater the diameter, the better. The sensor probe must always be mounted in the center of the nozzle, which eliminates the possibility that the cable probe will become shorted on the nozzle edge during filling or discharge.
The vast majority of guided-wave radar instal-lations are completed without any problem. Eliminating the mounting nozzle or ensuring that it is appropriately sized can resolve 80% of the installation and start-up problems that arise with guided-wave radar units. The remaining in-stallation issues can be addressed by eliminating
obstructions within the electromagnetic field or by selecting the proper mounting location.
ConclusionThe demand for guided-wave radar devices has never been higher, and it is growing rapidly. The reasons are simple. The sensors are accurate, reli-able under heavy dust conditions (even during filling), and cost-effective (approximately $1800–$2000 on average).
When manufacturers’ installation guides and the tips offered in this article are followed, most pow-der and bulk solids applications will benefit from the use of these sensors. Guided-wave radar tech-nologies have fast become plug-and-play devices, offering greater reliability than other technologies, especially in powders with dielectric constants of
2.0. However, even lower-dielectric materialscan be measured. For more information, search the Level Measurement blog at www.monitortech.typepad.com.
1Market data based on research performed in 2000 by Venture Development Corp. (Natick, MA) for the U.S. Process Level Measurement market.
Joseph D. Lewis is vice president of marketing and sales at Monitor Technologies (Elburn, IL). The company specializes in level measurement and inventory management. For information about guided-wave radar or the company’s offerings, call 800-601-6319 or visit www.monitortech.com.
Figure 4: View of mounting nozzle
xMount sensorat center of nozzle
Nozzle diameter must be greater thannozzle height
Powder/Bulk Solids32
Ap
ril
20
07
TechnicalExclusive
See us at Powder/Bulk Solids Southeast
Booth 1905
�������� �� � �� ��������� � �������� ��� �����
��� ���������� ����� � ����� ��� ��������� � ������� ����������� �� �� �������! ��������
Tech Tip no. 4: The sensor mounting loca-tion will be affected by the fill stream, which is based on the fill inlet location. The sen-sor should not be installed so that the sensor probe will be in the path of the incoming ma-terial. A location as far from the fill inlet as possible should be chosen, although the other sensor location issues should be optimized.
Sensor Mounting. The method for mount-ing the sensor to the roof of the vessel can
determine the difference between success and failure. Users should pay careful attention to this issue in the supplier’s installation and operation manual.
Tech Tip no. 5: Whenever possible users should avoid employing mounting nozzles. Figures 3 and 4 present examples of typi-cal mounting-nozzle installations. The ideal mounting method is to mount guided-wave radar sensors plumb, directly inserting them into a welded coupling on top of the silo. Alternatively, an angled or flat mounting flange can be directly mounted to the vessel roof without a nozzle.
If a mounting nozzle of some type must be used (as in the case of a domed roof), the internal diameter of the nozzle must be greater than the height of the nozzle. For a given nozzle height, the greater the diameter, the better. The sensor probe must always be mounted in the center of the nozzle, which eliminates the possibility that the cable probe will become shorted on the nozzle edge during filling or discharge.
The vast majority of guided-wave radar instal-lations are completed without any problem. Eliminating the mounting nozzle or ensuring that it is appropriately sized can resolve 80% of the installation and start-up problems that arise with guided-wave radar units. The remaining in-stallation issues can be addressed by eliminating
obstructions within the electromagnetic field or by selecting the proper mounting location.
ConclusionThe demand for guided-wave radar devices has never been higher, and it is growing rapidly. The reasons are simple. The sensors are accurate, reli-able under heavy dust conditions (even during filling), and cost-effective (approximately $1800–$2000 on average).
When manufacturers’ installation guides and the tips offered in this article are followed, most pow-der and bulk solids applications will benefit from the use of these sensors. Guided-wave radar tech-nologies have fast become plug-and-play devices, offering greater reliability than other technologies, especially in powders with dielectric constants of
2.0. However, even lower-dielectric materials can be measured. For more information, search the Level Measurement blog at www.monitortech.typepad.com.
1Market data based on research performed in 2000 by Venture Development Corp. (Natick, MA) for the U.S. Process Level Measurement market.
Joseph D. Lewis is vice president of marketing and sales at Monitor Technologies (Elburn, IL). The company specializes in level measurement and inventory management. For information about guided-wave radar or the company’s offerings, call 800-601-6302 or visit www.monitortech.com.
Figure 4: View of mounting nozzle
xMount sensorat center of nozzle
Nozzle diameter must be greater thannozzle height
Powder/Bulk Solids32
Ap
ril
20
07
TechnicalExclusive
See us at Powder/Bulk Solids Southeast
Booth 1905
For five decades we’ve pioneeredlevel measurement and indication forbulk solids.
Exemplifying our products today:
• SafePoint®, the safest bin levelindicator available for yourprocess. “Truly” fail-safe anduse of self-validating patentedtechnology make the SafePointthe only choice for safe andreliable bin level indication.
• FlexarFlexar™, guided wave radarcontinuous level sensor isstate-of-the-art and offeredwith a choice of output/inter-face. FlexarFlexar is the best choicefor reliable continuous levelmeasurement, especially foruse with powders.
PIONEERINGLEVEL MEASUREMENT
For more information and products visit
wwwwww.monitortech.com/BIOFUELS.monitortech.com/BIOFUELS800-601-3232 � 630-365-9403 � www.monitortech.com/BIOFUELS � www.flexar.info
For five decades we’ve pioneeredlevel measurement and indication forbulk solids.
Exemplifying our products today:
• SafePoint®, the safest bin level indicator available for your process. “Truly” fail-safe and use of self-validating patented technology make the SafePoint the only choice for safe and reliable bin level indication.
• FlexarFlexar™, guided wave radar continuous level sensor is state-of-the-art and offered with a choice of output/inter-face. FlexarFlexar is the best choice for reliable continuous level measurement, especially for use with powders.
PIONEERINGLEVEL MEASUREMENT
For more information and products visit
wwwwww.monitortech.com/BIOFUELS.monitortech.com/BIOFUELS800-601-3232 � 630-365-9403 � www.monitortech.com/BIOFUELS � www.flexar.info

44W320 Keslinger Road � P.O. Box 8048 � Elburn, IL 60119-8048 � 800-766-6486 � 630-365-9403 � Fax 630-365-5646www.flexar.info � www.monitortech.com � [email protected]
44W320 Keslinger Road � P.O. Box 8048 � Elburn, IL 60119-8048 � 800-766-6486 � 630-365-9403 � Fax 630-365-5646www.flexar.info � www.monitortech.com � [email protected]