analyzing the impact of service accessibility enhancement
TRANSCRIPT
159
Armanshahr Architecture & Urban Development, 7(12), 159-175, Spring Summer 2014
ISSN: 2008-5079
* Corresponding author email: [email protected]
Analyzing the Impact of Service Accessibility Enhancement on Urban Energy Efficiency Based on GIS Network Analysis
Peyman Khodabakhsh1, Samira Mashayekhi2 and Behzad Malekpour Asl3*
1PhD. Candidate of Urban and Regional Planning in Technical University of Berlin (TU-Berlin), Institute for Urban and Uegional Planning, Berlin, Germany.2PhD. Candidate of Urban and Regional Planning in Technical University of Berlin (TU-Berlin), Institute for Urban and Regional Planning, Berlin, Germany.3PhD. Candidate of Urban and Regional Planning in Shahid Beheshti University, Tehran, Iran.
Received 5 January 2014; Revised 16 April 2014; Accepted 29 June 2014
ABSTRACT: Cities are a focal point of energy consumption. Accessibility to public services has a significant impact on the balance of public and private energy uses, which are two sectors that are directly affected by urban planning (the third is industrial). This paper establishes the relative magnitudes of service accessibility enhancement on urban energy efficiency in comparison to other factors, and also points out the interrelationships between the two in the context of the cities and services. The main part of this paper assesses the energy trends, with a particular reference to the effect of service accessibility, and presents strategic findings. It seeks for continued research and development, particularly in the field of modelling the public service accessibility as a function of planning. In fact energy system change is the key for addressing and resolving these challenges. Transformative change in the energy system may not be internally generated; due to institutional inertia, incumbency and lack of capacity and agility of existing organizations to respond effectively in changing conditions. In such situations, clear and consistent external policy signals may be required to initiate and sustain the transformative change needed to meet the sustainability challenges of the 21st century. As one of the most important energy end-users, especially in developing countries, transportation consumes approximately 30 percent of the whole energy productions in the world. One important part of transportation is urban transport system in order to make accessibility to products and services which is one of the main factors of energy consumption and climate changes. Therefore analyzing the tools and policies through enhancing the accessibility and modeling a more optimized access system are the main aims of this research. The case of the research is a new town located within 70 km far from Tehran (the capital of Iran). Considering the population horizon for this city and a high dependency on private vehicles, it is an important concern to optimize the energy consumption in service accessibility. This also provides a basis for a more viable and more attractive urban settlement.
Keywords: Energy Efficiency, Accessibility, Urban Planning, Urban Transportation.
INTRODUCTION AND RESEARCH METHODOLOGY
Broad accessibility to services, people, and goods is an essential and basic human need and a precondition to economic well-being in modern societies. At the
close of the 20th century, the world witnessed both unprecedented urbanization in the developing world and the suburbanization of many cities in the developed world. Motorized forms of mobility, particularly auto-mobility, were favored as the principal means for personal and social accessibility in urban areas. Along with technological shifts and economic development, transport activities scaled up in distance and participants. This growth, and the reliance on individual motorized forms
160
Khodabakhsh, P. et al.
of urban transport, has resulted in many local social and environmental consequences, including congestion, air pollution, noise, olfactory and visual intrusion, disruption of ecosystems and landscapes, water and soil degradation, ozone depletion, social and urban fragmentation, road deaths and injuries, asthma, and obesity (Rothengatter, 2003; Whitelegg & Haq, 2003; Gilbert & Pearl, 2007; Schafer et al., 2009). As an economic growth, transport activity continues to increase around the world. In many areas of the developing world where globalization is expanding, trade flows and personal incomes are rising, leading to an increased demand for enhanced personal mobility. Mobility of people and goods has significant global economic benefits. Within this context, urban transportation and specifically transportation and accessibility to services play a critical role in energy consumption level. In fact, because of low fuel price at the moment and lack of convenient and proper public transportation and even the exiting culture and behavior
of citizens, a high volume of urban mobility is based on private automobile, as a consequence of a high energy loss and climate impacts.
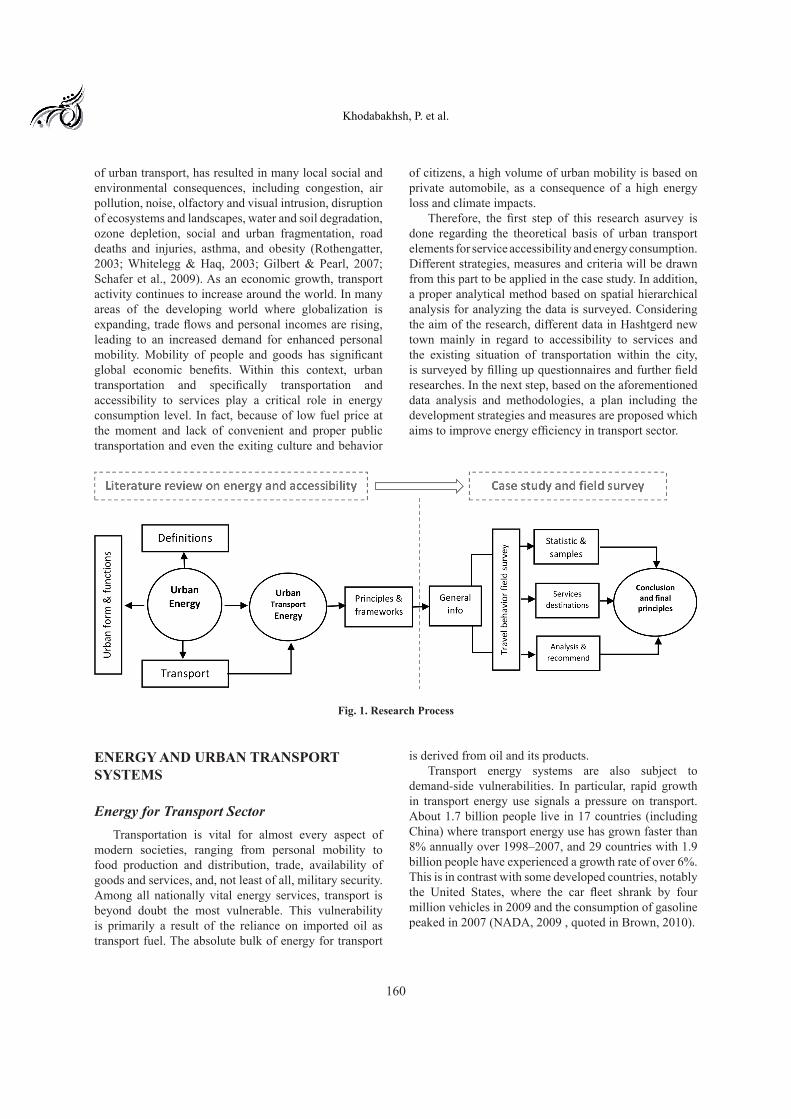
Therefore, the first step of this research asurvey is done regarding the theoretical basis of urban transport elements for service accessibility and energy consumption. Different strategies, measures and criteria will be drawn from this part to be applied in the case study. In addition, a proper analytical method based on spatial hierarchical analysis for analyzing the data is surveyed. Considering the aim of the research, different data in Hashtgerd new town mainly in regard to accessibility to services and the existing situation of transportation within the city, is surveyed by filling up questionnaires and further field researches. In the next step, based on the aforementioned data analysis and methodologies, a plan including the development strategies and measures are proposed which aims to improve energy efficiency in transport sector.
Fig. 1. Research Process
ENERGY AND URBAN TRANSPORT SYSTEMS
Energy for Transport SectorTransportation is vital for almost every aspect of
modern societies, ranging from personal mobility to food production and distribution, trade, availability of goods and services, and, not least of all, military security. Among all nationally vital energy services, transport is beyond doubt the most vulnerable. This vulnerability is primarily a result of the reliance on imported oil as transport fuel. The absolute bulk of energy for transport
is derived from oil and its products.Transport energy systems are also subject to
demand-side vulnerabilities. In particular, rapid growth in transport energy use signals a pressure on transport. About 1.7 billion people live in 17 countries (including China) where transport energy use has grown faster than 8% annually over 1998–2007, and 29 countries with 1.9 billion people have experienced a growth rate of over 6%. This is in contrast with some developed countries, notably the United States, where the car fleet shrank by four million vehicles in 2009 and the consumption of gasoline peaked in 2007 (NADA, 2009 , quoted in Brown, 2010).
161
Armanshahr Architecture & Urban Development, 7(12), 159-175, Spring Summer 2014
Key Elements for Promoting Public Acceptability for a Transport Transition
Globally, transportation policy makers, technicians, and manufacturers must purposefully participate in climate change mitigation and actively contribute to reduce energy security concerns. Locally, the livability of human settlements, environmental pollution, health, and spatial equity can be dramatically improved by sustainable transport practices. Achieving this vital transition requires extensive investment in high quality public transportation and non-motorized transport that encourages a shift to these modes from private automobiles. There needs to be an overall reduction in VMT (Vehicle-Miles Traveled), a radical shift in urban development from car-centric to people-centric models that prioritize walkable, dense, mixed-use urban spaces. Also the de-carbonization of transportation fuels, mainstreaming of near-zero GHG (Green House Gas) emissions of vehicle technologies, such as plug-in hybrid vehicles, full battery electric vehicles, and hydrogen fuel cell vehicles are required. Altogether, this comprehensive set of policies will affect not only transport use but also societal interaction, e.g., via land-use patterns and personal choices and preferences
(Lutsey & Sperling, 2007). Achieving a multitude of local transitions for sustainable urban transport is a key challenge as cities for some additional 3 billion urban dwellers will need to be constructed by 2050. This represents a window of opportunity to use many of the approaches, in particular, for giving a renewed focus on addressing issues of accessibility, density, land use and urban design to favor walking and bicycling, public transport service affordability, local equity and environmental concerns.
It is necessary to immediately start intelligently designing low-carbon transportation systems in developing countries that can also bring co-benefits, such as clean air or a reduction of congestion, that are necessary for sustainable development (Bongardt et al., 2010). Moreover, it is imperative that local governments gain experience and expertise even before national and global initiatives are in place. Lower-level government policy structures need not preclude – and can even advance – multiple goals toward transforming transportation and sustainability, integrating policy measures across goals while differentiating between geographic settings (Lutsey & Sperling, 2008; Creutzig & Kammen, 2009b).
162
The Impact of Service Accessibility Enhancement on Urban Energy Efficiency
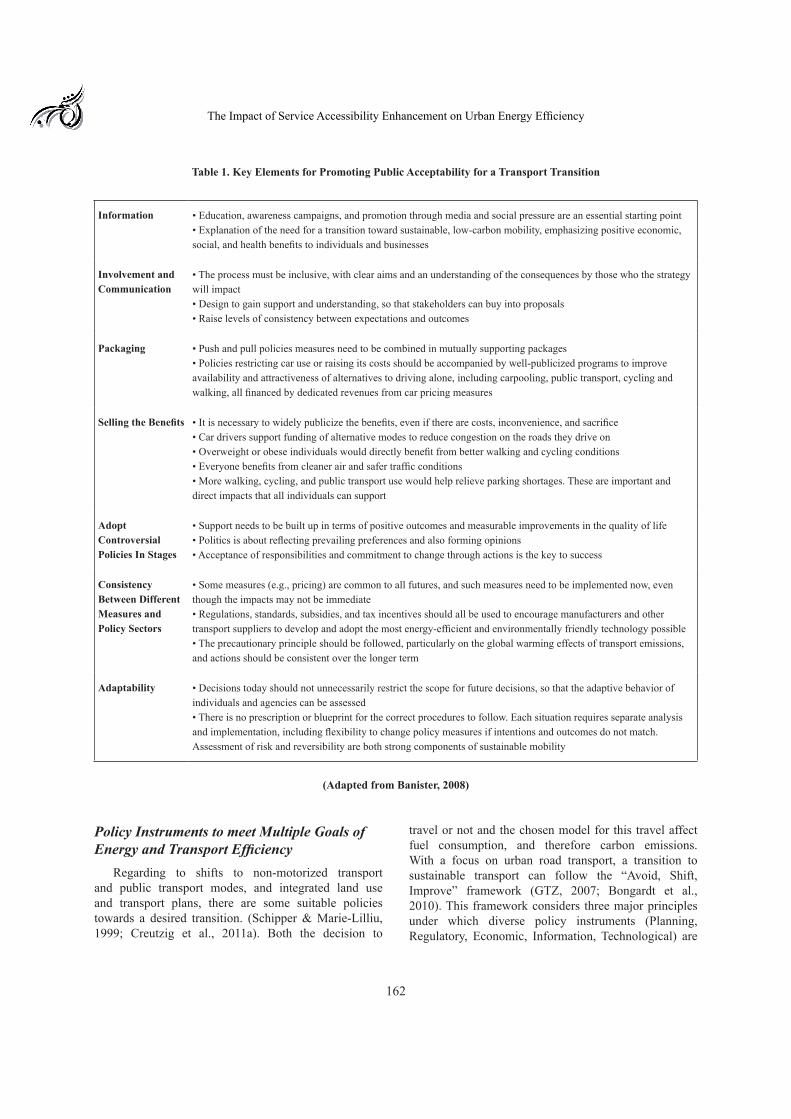
Table 1. Key Elements for Promoting Public Acceptability for a Transport Transition
Information • Education, awareness campaigns, and promotion through media and social pressure are an essential starting point• Explanation of the need for a transition toward sustainable, low-carbon mobility, emphasizing positive economic, social, and health benefits to individuals and businesses
Involvement and Communication
• The process must be inclusive, with clear aims and an understanding of the consequences by those who the strategy will impact• Design to gain support and understanding, so that stakeholders can buy into proposals• Raise levels of consistency between expectations and outcomes
Packaging • Push and pull policies measures need to be combined in mutually supporting packages• Policies restricting car use or raising its costs should be accompanied by well-publicized programs to improve availability and attractiveness of alternatives to driving alone, including carpooling, public transport, cycling and walking, all financed by dedicated revenues from car pricing measures
Selling the Benefits • It is necessary to widely publicize the benefits, even if there are costs, inconvenience, and sacrifice• Car drivers support funding of alternative modes to reduce congestion on the roads they drive on• Overweight or obese individuals would directly benefit from better walking and cycling conditions• Everyone benefits from cleaner air and safer traffic conditions• More walking, cycling, and public transport use would help relieve parking shortages. These are important and direct impacts that all individuals can support
Adopt Controversial Policies In Stages
• Support needs to be built up in terms of positive outcomes and measurable improvements in the quality of life• Politics is about reflecting prevailing preferences and also forming opinions• Acceptance of responsibilities and commitment to change through actions is the key to success
Consistency Between DifferentMeasures and Policy Sectors
• Some measures (e.g., pricing) are common to all futures, and such measures need to be implemented now, even though the impacts may not be immediate• Regulations, standards, subsidies, and tax incentives should all be used to encourage manufacturers and other transport suppliers to develop and adopt the most energy-efficient and environmentally friendly technology possible• The precautionary principle should be followed, particularly on the global warming effects of transport emissions, and actions should be consistent over the longer term
Adaptability • Decisions today should not unnecessarily restrict the scope for future decisions, so that the adaptive behavior of individuals and agencies can be assessed• There is no prescription or blueprint for the correct procedures to follow. Each situation requires separate analysis and implementation, including flexibility to change policy measures if intentions and outcomes do not match. Assessment of risk and reversibility are both strong components of sustainable mobility
(Adapted from Banister, 2008)
Policy Instruments to meet Multiple Goals of Energy and Transport Efficiency
Regarding to shifts to non-motorized transport and public transport modes, and integrated land use and transport plans, there are some suitable policies towards a desired transition. (Schipper & Marie-Lilliu, 1999; Creutzig et al., 2011a). Both the decision to
travel or not and the chosen model for this travel affect fuel consumption, and therefore carbon emissions. With a focus on urban road transport, a transition to sustainable transport can follow the “Avoid, Shift, Improve” framework (GTZ, 2007; Bongardt et al., 2010). This framework considers three major principles under which diverse policy instruments (Planning, Regulatory, Economic, Information, Technological) are
163
Armanshahr Architecture & Urban Development, 7(12), 159-175, Spring Summer 2014
grouped interventions to mitigate GHG emissions from transport, assuming different emphases for developed and developing countries (Dalkmann & Brannigan, 2009). “Avoid” and “Shift” influence the level of activity and structural components that link transport to carbon emissions. “Improve” focuses on technological options, not only with respect to climate mitigation but also taking local environmental conditions and social concerns into account.
A transition toward sustainable transport goes beyond technology. In fact, the quality of transport can be improved in a broader sense by a multitude of individual measures and combined policy packages, particularly in urban areas. Reducing or avoiding the need to travel can be achieved through encouragement of greater use of transit systems and non-motorized transport.
A. Enhancing Accessibility: Enhancing accessibility for transport users often reduces overall transport demand in terms of distance while improving the quality of movements. The analysis focuses on aspects of mixed land use and density, modal interconnectedness, and transit-oriented development.
B. Enhancing Modal Interconnectedness: Smart Growth (also called New Community Design) is a general term for policies that integrate transportation and land use decisions, as an alternative to urban sprawl. Smart growth and mixed land use is closely related by multimodal interconnectivity. For example, public transit ridership crucially depends on design of pedestrian facilities, enabling smooth and rapid access to stations. (Cervero, 1994).
C. Enhancing Transit-Oriented Developments: The most consistent approach, which is by now state-of-the art in progressive cities, is to integrate land use and transportation planning to achieve a low-carbon infrastructure, reduce travel distances and travel time and increase accessibility to jobs, shops, and leisure facilities (Bongardt et al., 2010).
D. Enhancing Mobility Management: The main aims of mobility management are:
• improve accessibility for all users and the conditions (social attractiveness, safety, economic efficiency) for an effective use of sustainable travel modes;
• improve the integration of activities and new land uses with sustainable travel modes and services covering the entire urban transport system;
• reduce traffic growth by limiting the number, length, and need for motorized vehicle trips; and
• improve interchange between transport modes and facilitate the interconnection of existing transport networks.
SERVICES ACCESSIBILITY IN A SUPPLY AND DEMAND PROCESS
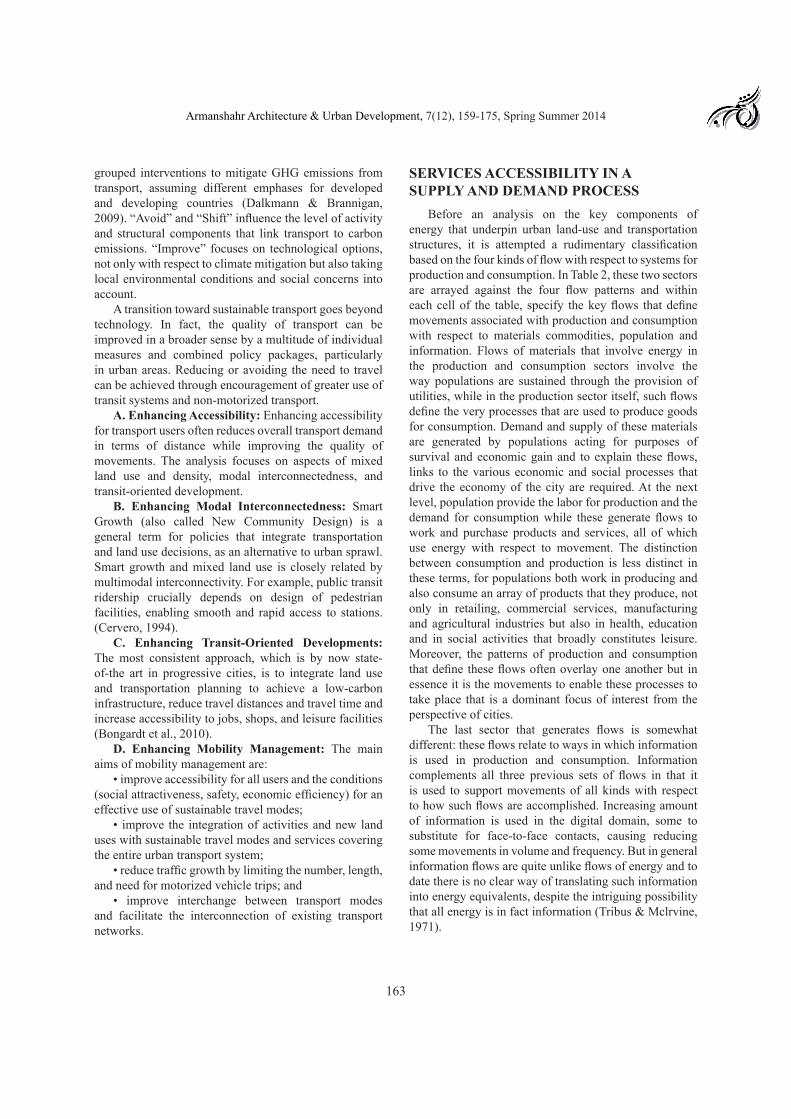
Before an analysis on the key components of energy that underpin urban land-use and transportation structures, it is attempted a rudimentary classification based on the four kinds of flow with respect to systems for production and consumption. In Table 2, these two sectors are arrayed against the four flow patterns and within each cell of the table, specify the key flows that define movements associated with production and consumption with respect to materials commodities, population and information. Flows of materials that involve energy in the production and consumption sectors involve the way populations are sustained through the provision of utilities, while in the production sector itself, such flows define the very processes that are used to produce goods for consumption. Demand and supply of these materials are generated by populations acting for purposes of survival and economic gain and to explain these flows, links to the various economic and social processes that drive the economy of the city are required. At the next level, population provide the labor for production and the demand for consumption while these generate flows to work and purchase products and services, all of which use energy with respect to movement. The distinction between consumption and production is less distinct in these terms, for populations both work in producing and also consume an array of products that they produce, not only in retailing, commercial services, manufacturing and agricultural industries but also in health, education and in social activities that broadly constitutes leisure. Moreover, the patterns of production and consumption that define these flows often overlay one another but in essence it is the movements to enable these processes to take place that is a dominant focus of interest from the perspective of cities.
The last sector that generates flows is somewhat different: these flows relate to ways in which information is used in production and consumption. Information complements all three previous sets of flows in that it is used to support movements of all kinds with respect to how such flows are accomplished. Increasing amount of information is used in the digital domain, some to substitute for face-to-face contacts, causing reducing some movements in volume and frequency. But in general information flows are quite unlike flows of energy and to date there is no clear way of translating such information into energy equivalents, despite the intriguing possibility that all energy is in fact information (Tribus & Mclrvine, 1971).
164
Khodabakhsh, P. et al.
Table 2. Types of Flow Associated with Production and Consumption
Flows Activity Materials Commodities People Information
Production All sectors Inter-industry linkages, exports, imports
Journeys to work, school, health and related
commercial sectors
Working from home, online learning, inter-industry
flows
Consumption All Sectors Retailing, Commercial Services
Journeys to Retail, Commercial, Health, Leisure
Leisure, Entertainment, Health, Financial Services
Demand and supply for the resources that drive production and consumption provide another perspective on this mix of energy flows. It is too simplistic to associate demands with consumption and supply production which ignores demand and supply that is internal to production and consumption, internal to the industrial and related sectors, and to the consumption sector associated with population. Moreover, in cities these sectors are more associated with human activities that reveal themselves in land use in different locations.
Accordingly, to make possible classifications, we conceive cities as being composed of distinct land-use activities that we define broadly as industrial (and possibly agricultural), retailing, commercial services, health, education, related social/welfare services and leisure services (which include social activities). These are all classes of production and to complete the structure, we
identify residential land use that is composed of housing and relate services as constituting the activity focus of all populations when they are not engaging in production in any of the previous categories. In the context of the city, demand for the products and services produced by these sectors is driven by the population, largely associated with locations where populations reside (although demand is also generated from places where the population works), while supplies are generated from the places where people work, except for internal services that the population provides for itself, usually in residential locations. The products and services that generate significant flows of energy are those that are formally produced and supplied to places where they are consumed. Thus the activities that have distinct locations and generate spatial demand and supply involving energy flows are classified in table 3.
Table 3. Traffic Flows Between Urban Activities that Use Energy Resources
Activity W R S C H E L
W Intermediate Production
Journey to Work
Work to Shop Work to Commerce
Work to Health
Work to Education
Work to Leisure
R Internal Services
Journey to Shop
Journey to Commerce
Journey to Health
Journey to Education
Journey to Leisure
S Internal Retailing
Retail to Commerce
Retail to Health
Retail to Education
Retail to Leisure
C Internal Commerce
Commerce to Health
Commerce to Education
Commerce to Leisure
H Internal Health Flows
Health to Education
Health to Leisure
E Internal Education
Education to Leisure
L Internal Leisure
165
Armanshahr Architecture & Urban Development, 7(12), 159-175, Spring Summer 2014
Table 3 is a matrix of linkage between these seven distinct sectors – Work (W), Residential (R), Shopping (S), Commercial (C), Health (H), Education (E) and Leisure (L). All of these are defined by specific land uses and associated activities, all of which comprise different patterns of demand and supply which manifest themselves through movement patterns that link these activities together with the provision of labor and capital that drives production and consumption. How these sectors are configured relative to one another defines urban spatial structure as well as the transportation patterns that sustain these structures at any point in time. These structures change as patterns of demand and supply change, as populations grow and decline and as migration into and out of cities changes this balance. These changes are determined by the interaction of demand and supply through various markets. It could be argued that what we require for a comprehensive theory of how energy enters this picture is a fully fledged urban theory that enables us to see how cities develop in terms of the way energy is used as urban spatial structure changes in time. In fact, most theories are extremely partial in energy area that is not to the fore in any of them. Urban theories that have been developed usually focus on specific sectors and markets such as housing to the exclusion of many others, using micro-economic theories of how individuals locate in cities. These are quite different in style and type from explanations of production that depend on macro-
economic structures or on location theories of individual firms that do not scale to entire urban structures.
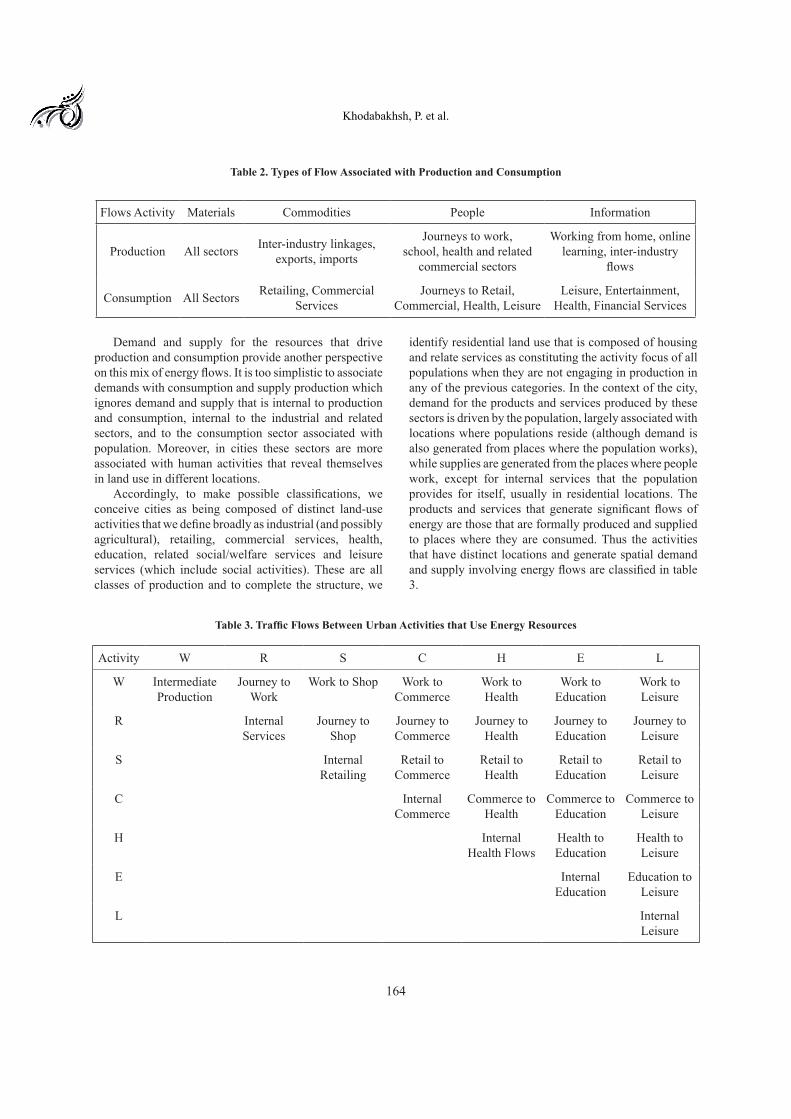
CASE STUDYIn 1993, the New Town of Hashtgerd was founded
by the approval of the High Council of Architecture and Urban Planning of the Islamic Republic of Iran. Today it has approximately 45.000 inhabitants; according to the New Towns Development Corporation in 2016 the estimated maximum number of residents will add up to approximately 500.000. Hashtgerd new town is located in the southern part of Alborz Mountain, west of Tehran (the capital of Iran) on the freeway of Tehran-Qazvin. The distance with neighbor cities is approximately 25 km to Karaj, 60 km to Tehran and 75 km to Qazvin. The case of the research is a neighborhood with approximately 8000 inhabitants located in the southern part of Hashtgerd new town. Enhancement of the accessibility to services for this neighborhood in order to achieve more energy efficient settlement is the main aim of the research. Considering the fore mentioned aim, a field research has been done to focus more deeply on inhabitant’s services needs and their travel-behaviors. Considering the general high demand for transportation within the city and also the access to the neighbor cities, increasing trend of fuel prices in the country and the least and the most the high impact on local climate, it is crucial to plan for a more efficient and climate responsive settlement in this area.
Fig. 2. Location of the Hashtgerd New Town Fig. 3. Case Study Neighborhood Unit
166
The Impact of Service Accessibility Enhancement on Urban Energy Efficiency
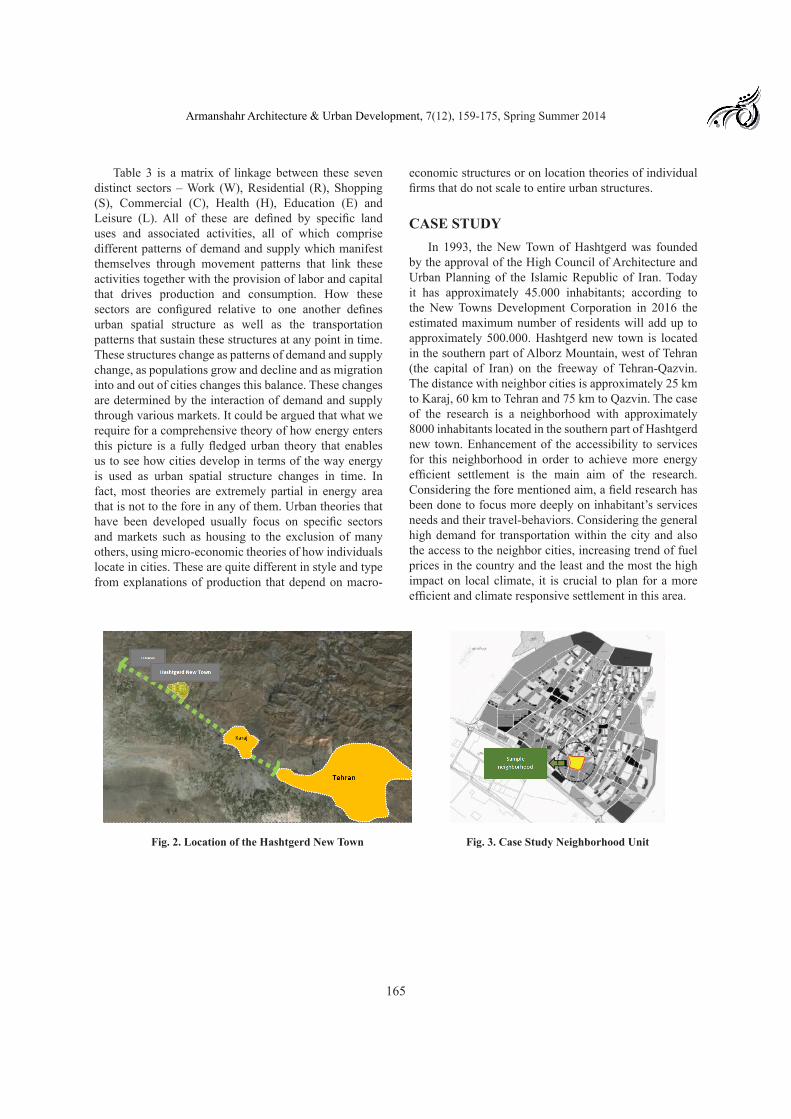
Probability Distributions of StatisticsThe statistic sample of the research is calculated based
on the ‘Cochran General formula’ in order to achieve the heights reliability of the results. In addition, the spatial
distribution of the survey and statistics were precisely surveyed aiming to the partnership of a wide range of inhabitants. Concerning the planned 8000 inhabitants of the neighborhood, 322 households were surveyed (Fig. 4).
N=Household Number= 2000p=Participation Possibility= (0.5)q=Possibility of No Participation= (0.5)t2=Accuracy Percentage=3.82d2=Accepted Error Degree=0.0025n=Sample Volume=322
Fig. 4. Cochran’s Formula for Sample Volume
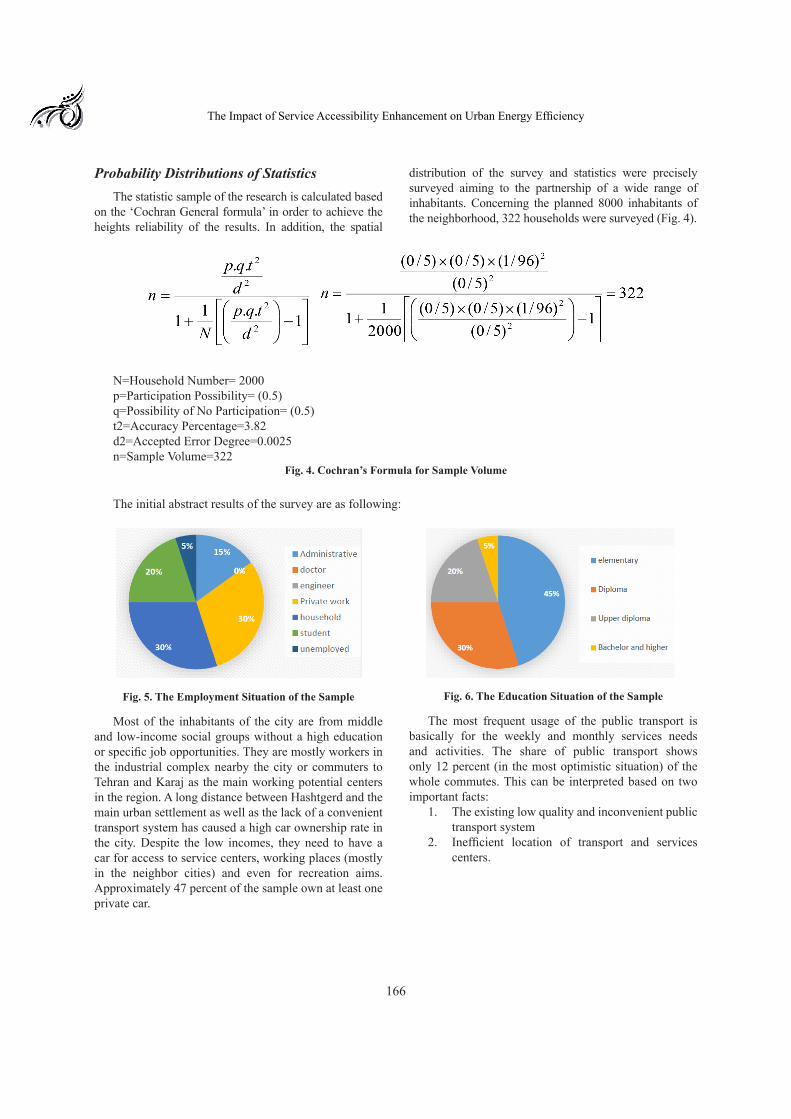
The initial abstract results of the survey are as following:
Fig. 5. The Employment Situation of the Sample
Most of the inhabitants of the city are from middle and low-income social groups without a high education or specific job opportunities. They are mostly workers in the industrial complex nearby the city or commuters to Tehran and Karaj as the main working potential centers in the region. A long distance between Hashtgerd and the main urban settlement as well as the lack of a convenient transport system has caused a high car ownership rate in the city. Despite the low incomes, they need to have a car for access to service centers, working places (mostly in the neighbor cities) and even for recreation aims. Approximately 47 percent of the sample own at least one private car.
Fig. 6. The Education Situation of the Sample
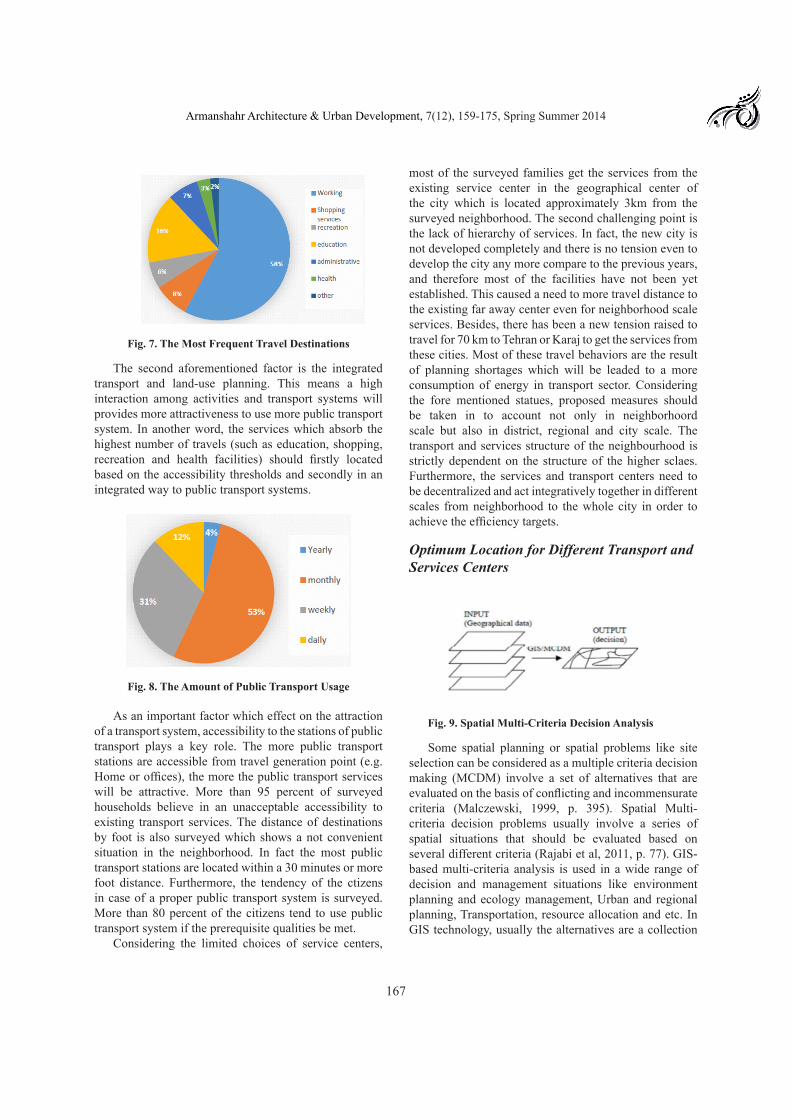
The most frequent usage of the public transport is basically for the weekly and monthly services needs and activities. The share of public transport shows only 12 percent (in the most optimistic situation) of the whole commutes. This can be interpreted based on two important facts:
1. The existing low quality and inconvenient public transport system
2. Inefficient location of transport and services centers.
167
Armanshahr Architecture & Urban Development, 7(12), 159-175, Spring Summer 2014
Fig. 7. The Most Frequent Travel Destinations
The second aforementioned factor is the integrated transport and land-use planning. This means a high interaction among activities and transport systems will provides more attractiveness to use more public transport system. In another word, the services which absorb the highest number of travels (such as education, shopping, recreation and health facilities) should firstly located based on the accessibility thresholds and secondly in an integrated way to public transport systems.
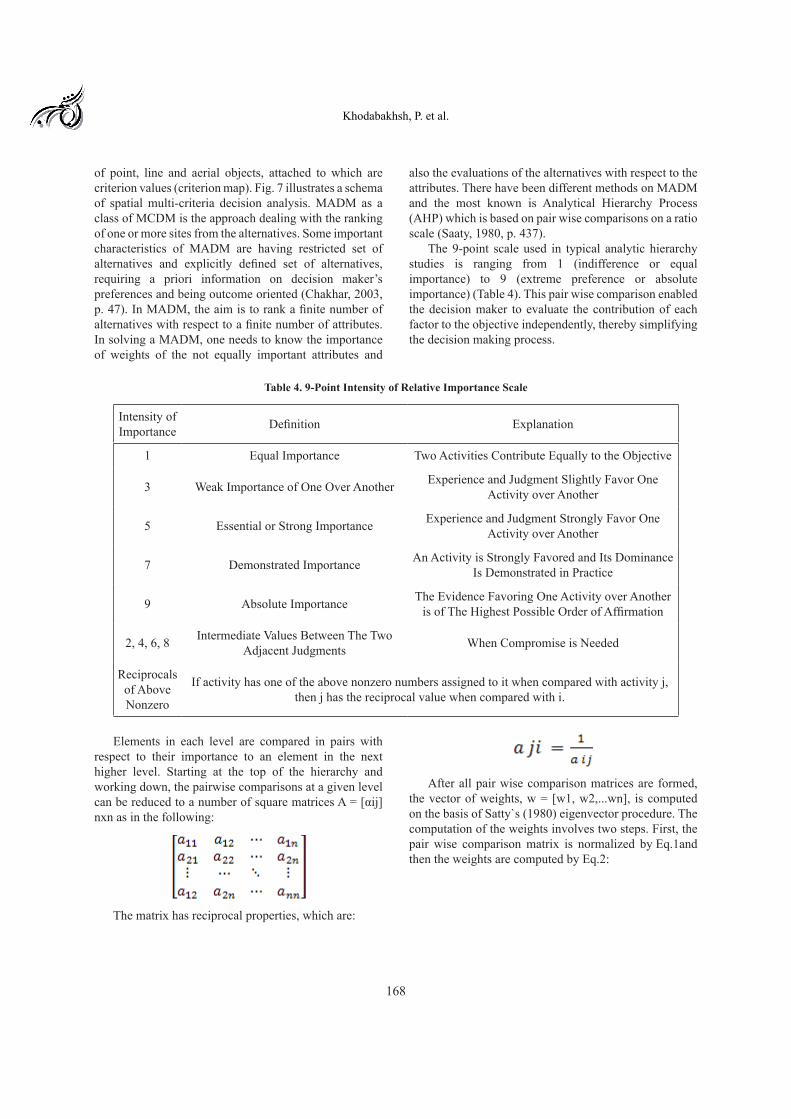
Fig. 8. The Amount of Public Transport Usage
As an important factor which effect on the attraction of a transport system, accessibility to the stations of public transport plays a key role. The more public transport stations are accessible from travel generation point (e.g. Home or offices), the more the public transport services will be attractive. More than 95 percent of surveyed households believe in an unacceptable accessibility to existing transport services. The distance of destinations by foot is also surveyed which shows a not convenient situation in the neighborhood. In fact the most public transport stations are located within a 30 minutes or more foot distance. Furthermore, the tendency of the ctizens in case of a proper public transport system is surveyed. More than 80 percent of the citizens tend to use public transport system if the prerequisite qualities be met.
Considering the limited choices of service centers,
most of the surveyed families get the services from the existing service center in the geographical center of the city which is located approximately 3km from the surveyed neighborhood. The second challenging point is the lack of hierarchy of services. In fact, the new city is not developed completely and there is no tension even to develop the city any more compare to the previous years, and therefore most of the facilities have not been yet established. This caused a need to more travel distance to the existing far away center even for neighborhood scale services. Besides, there has been a new tension raised to travel for 70 km to Tehran or Karaj to get the services from these cities. Most of these travel behaviors are the result of planning shortages which will be leaded to a more consumption of energy in transport sector. Considering the fore mentioned statues, proposed measures should be taken in to account not only in neighborhoord scale but also in district, regional and city scale. The transport and services structure of the neighbourhood is strictly dependent on the structure of the higher sclaes. Furthermore, the services and transport centers need to be decentralized and act integratively together in different scales from neighborhood to the whole city in order to achieve the efficiency targets.
Optimum Location for Different Transport and Services Centers
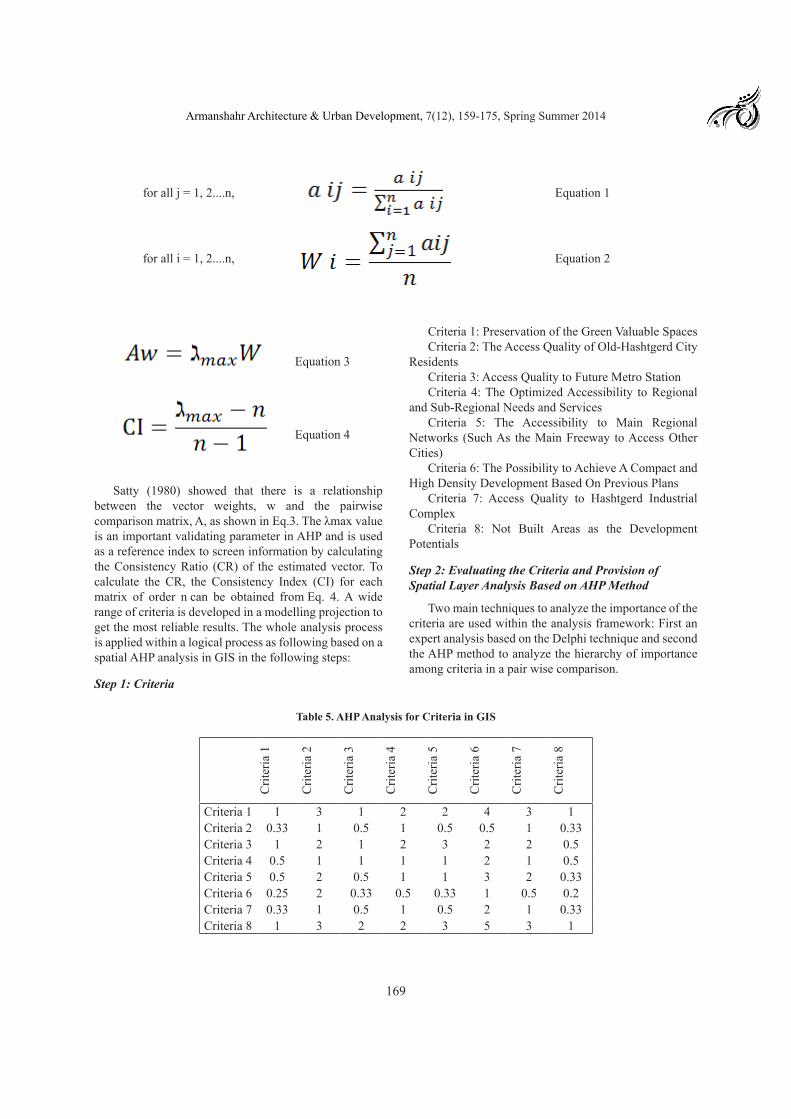
Fig. 9. Spatial Multi-Criteria Decision Analysis
Some spatial planning or spatial problems like site selection can be considered as a multiple criteria decision making (MCDM) involve a set of alternatives that are evaluated on the basis of conflicting and incommensurate criteria (Malczewski, 1999, p. 395). Spatial Multi-criteria decision problems usually involve a series of spatial situations that should be evaluated based on several different criteria (Rajabi et al, 2011, p. 77). GIS-based multi-criteria analysis is used in a wide range of decision and management situations like environment planning and ecology management, Urban and regional planning, Transportation, resource allocation and etc. In GIS technology, usually the alternatives are a collection
168
Khodabakhsh, P. et al.
of point, line and aerial objects, attached to which are criterion values (criterion map). Fig. 7 illustrates a schema of spatial multi-criteria decision analysis. MADM as a class of MCDM is the approach dealing with the ranking of one or more sites from the alternatives. Some important characteristics of MADM are having restricted set of alternatives and explicitly defined set of alternatives, requiring a priori information on decision maker’s preferences and being outcome oriented (Chakhar, 2003, p. 47). In MADM, the aim is to rank a finite number of alternatives with respect to a finite number of attributes. In solving a MADM, one needs to know the importance of weights of the not equally important attributes and
also the evaluations of the alternatives with respect to the attributes. There have been different methods on MADM and the most known is Analytical Hierarchy Process (AHP) which is based on pair wise comparisons on a ratio scale (Saaty, 1980, p. 437).
The 9-point scale used in typical analytic hierarchy studies is ranging from 1 (indifference or equal importance) to 9 (extreme preference or absolute importance) (Table 4). This pair wise comparison enabled the decision maker to evaluate the contribution of each factor to the objective independently, thereby simplifying the decision making process.
Table 4. 9-Point Intensity of Relative Importance Scale
Intensity of Importance Definition Explanation
1 Equal Importance Two Activities Contribute Equally to the Objective
3 Weak Importance of One Over Another Experience and Judgment Slightly Favor One Activity over Another
5 Essential or Strong Importance Experience and Judgment Strongly Favor One Activity over Another
7 Demonstrated Importance An Activity is Strongly Favored and Its Dominance Is Demonstrated in Practice
9 Absolute Importance The Evidence Favoring One Activity over Another is of The Highest Possible Order of Affirmation
2, 4, 6, 8 Intermediate Values Between The Two Adjacent Judgments When Compromise is Needed
Reciprocals of Above Nonzero
If activity has one of the above nonzero numbers assigned to it when compared with activity j, then j has the reciprocal value when compared with i.
Elements in each level are compared in pairs with respect to their importance to an element in the next higher level. Starting at the top of the hierarchy and working down, the pairwise comparisons at a given level can be reduced to a number of square matrices A = [αij]nxn as in the following:
The matrix has reciprocal properties, which are:
After all pair wise comparison matrices are formed, the vector of weights, w = [w1, w2,...wn], is computed on the basis of Satty`s (1980) eigenvector procedure. The computation of the weights involves two steps. First, the pair wise comparison matrix is normalized by Eq.1and then the weights are computed by Eq.2:
169
Armanshahr Architecture & Urban Development, 7(12), 159-175, Spring Summer 2014
for all j = 1, 2....n, Equation 1
for all i = 1, 2....n, Equation 2
Equation 3
Equation 4
Satty (1980) showed that there is a relationship between the vector weights, w and the pairwise comparison matrix, A, as shown in Eq.3. The λmax value is an important validating parameter in AHP and is used as a reference index to screen information by calculating the Consistency Ratio (CR) of the estimated vector. To calculate the CR, the Consistency Index (CI) for each matrix of order n can be obtained from Eq. 4. A wide range of criteria is developed in a modelling projection to get the most reliable results. The whole analysis process is applied within a logical process as following based on a spatial AHP analysis in GIS in the following steps:
Step 1: Criteria
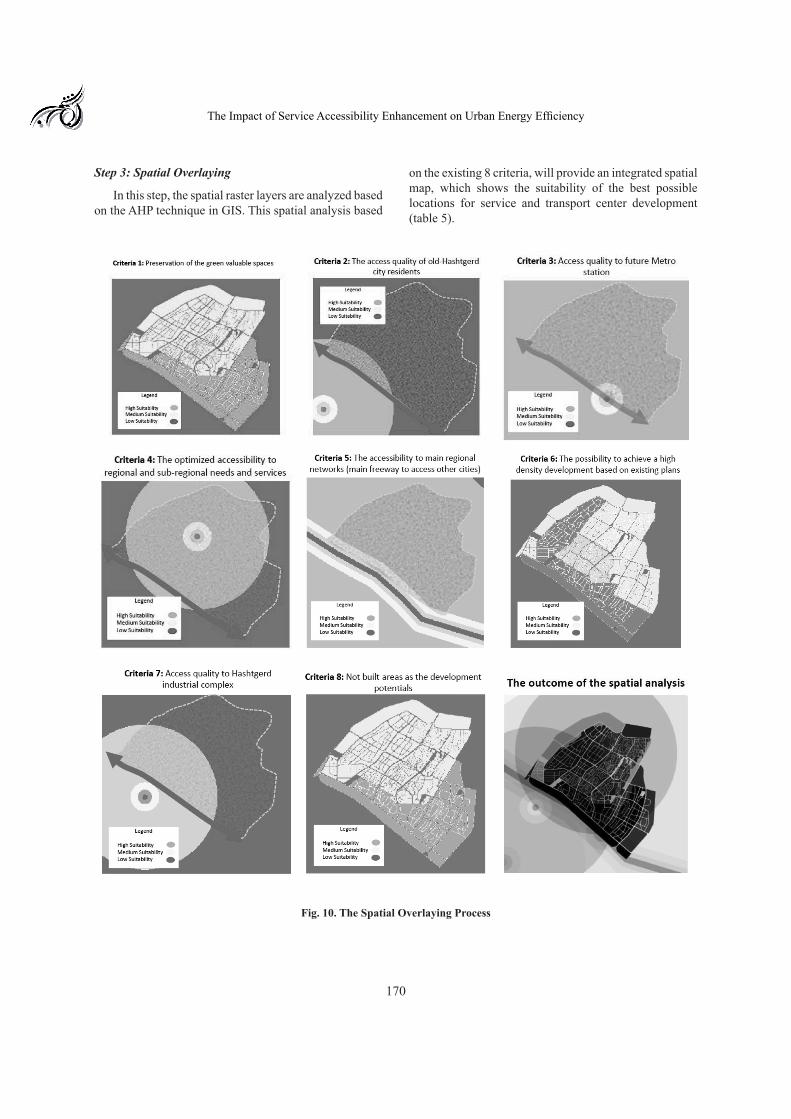
Criteria 1: Preservation of the Green Valuable SpacesCriteria 2: The Access Quality of Old-Hashtgerd City
ResidentsCriteria 3: Access Quality to Future Metro StationCriteria 4: The Optimized Accessibility to Regional
and Sub-Regional Needs and ServicesCriteria 5: The Accessibility to Main Regional
Networks (Such As the Main Freeway to Access Other Cities)
Criteria 6: The Possibility to Achieve A Compact and High Density Development Based On Previous Plans
Criteria 7: Access Quality to Hashtgerd Industrial Complex
Criteria 8: Not Built Areas as the Development Potentials
Step 2: Evaluating the Criteria and Provision of Spatial Layer Analysis Based on AHP Method
Two main techniques to analyze the importance of the criteria are used within the analysis framework: First an expert analysis based on the Delphi technique and second the AHP method to analyze the hierarchy of importance among criteria in a pair wise comparison.
Table 5. AHP Analysis for Criteria in GIS
Crit
eria
1
Crit
eria
2
Crit
eria
3
Crit
eria
4
Crit
eria
5
Crit
eria
6
Crit
eria
7
Crit
eria
8
Criteria 1 1 3 1 2 2 4 3 1Criteria 2 0.33 1 0.5 1 0.5 0.5 1 0.33Criteria 3 1 2 1 2 3 2 2 0.5Criteria 4 0.5 1 1 1 1 2 1 0.5Criteria 5 0.5 2 0.5 1 1 3 2 0.33Criteria 6 0.25 2 0.33 0.5 0.33 1 0.5 0.2Criteria 7 0.33 1 0.5 1 0.5 2 1 0.33Criteria 8 1 3 2 2 3 5 3 1
170
The Impact of Service Accessibility Enhancement on Urban Energy Efficiency
Step 3: Spatial Overlaying
In this step, the spatial raster layers are analyzed based on the AHP technique in GIS. This spatial analysis based
on the existing 8 criteria, will provide an integrated spatial map, which shows the suitability of the best possible locations for service and transport center development (table 5).
Fig. 10. The Spatial Overlaying Process
171
Armanshahr Architecture & Urban Development, 7(12), 159-175, Spring Summer 2014
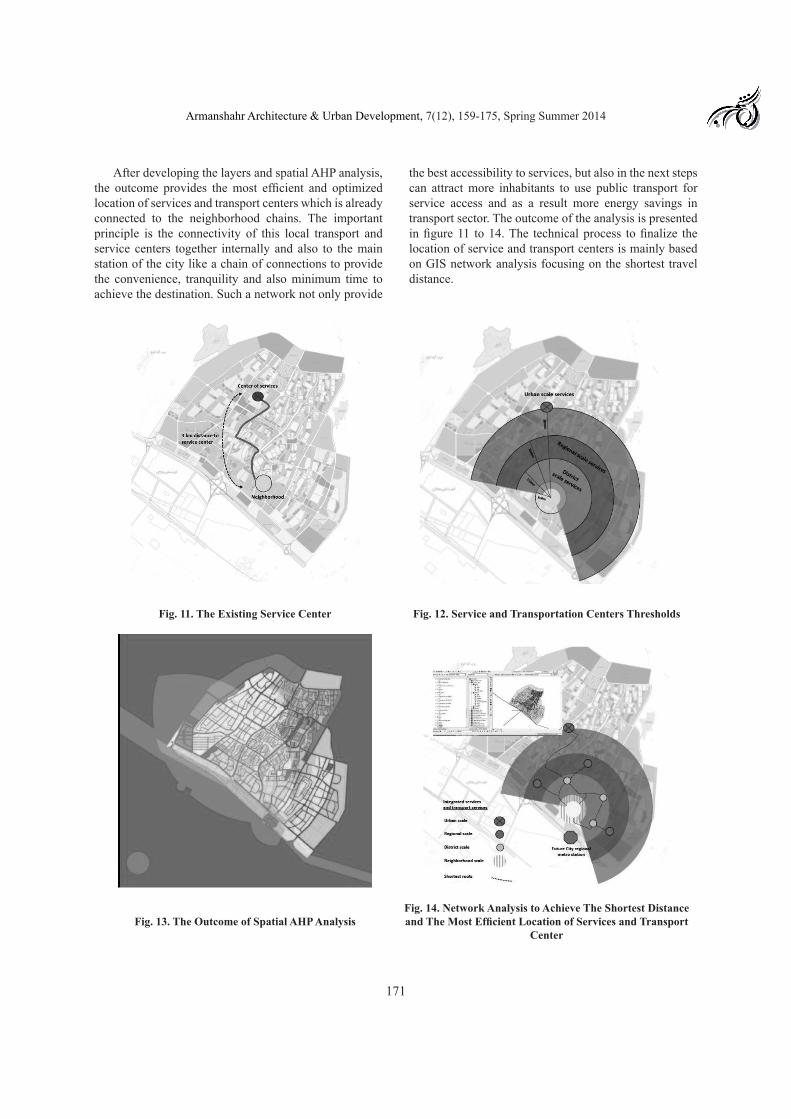
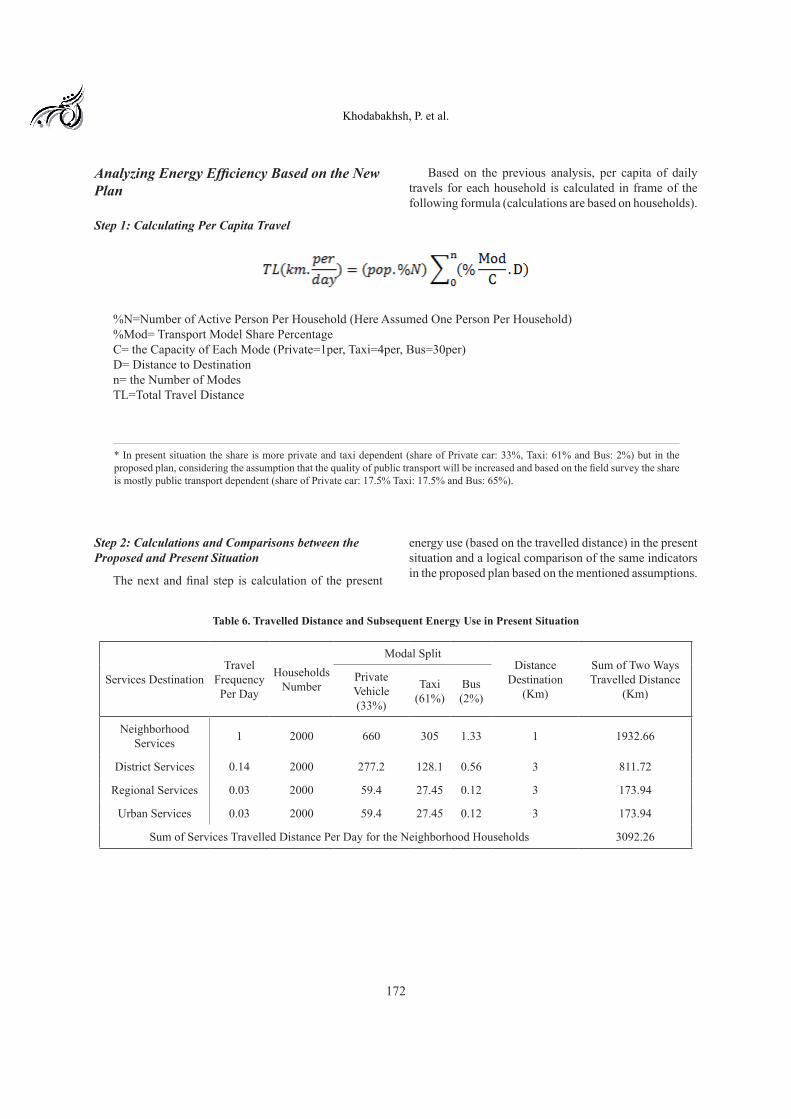
After developing the layers and spatial AHP analysis, the outcome provides the most efficient and optimized location of services and transport centers which is already connected to the neighborhood chains. The important principle is the connectivity of this local transport and service centers together internally and also to the main station of the city like a chain of connections to provide the convenience, tranquility and also minimum time to achieve the destination. Such a network not only provide
the best accessibility to services, but also in the next steps can attract more inhabitants to use public transport for service access and as a result more energy savings in transport sector. The outcome of the analysis is presented in figure 11 to 14. The technical process to finalize the location of service and transport centers is mainly based on GIS network analysis focusing on the shortest travel distance.
Fig. 11. The Existing Service Center Fig. 12. Service and Transportation Centers Thresholds
Fig. 13. The Outcome of Spatial AHP AnalysisFig. 14. Network Analysis to Achieve The Shortest Distance and The Most Efficient Location of Services and Transport
Center
172
Khodabakhsh, P. et al.
Analyzing Energy Efficiency Based on the New Plan
Step 1: Calculating Per Capita Travel
Based on the previous analysis, per capita of daily travels for each household is calculated in frame of the following formula (calculations are based on households).
%N=Number of Active Person Per Household (Here Assumed One Person Per Household)%Mod= Transport Model Share PercentageC= the Capacity of Each Mode (Private=1per, Taxi=4per, Bus=30per)D= Distance to Destinationn= the Number of ModesTL=Total Travel Distance
Step 2: Calculations and Comparisons between the Proposed and Present Situation
The next and final step is calculation of the present
energy use (based on the travelled distance) in the present situation and a logical comparison of the same indicators in the proposed plan based on the mentioned assumptions.
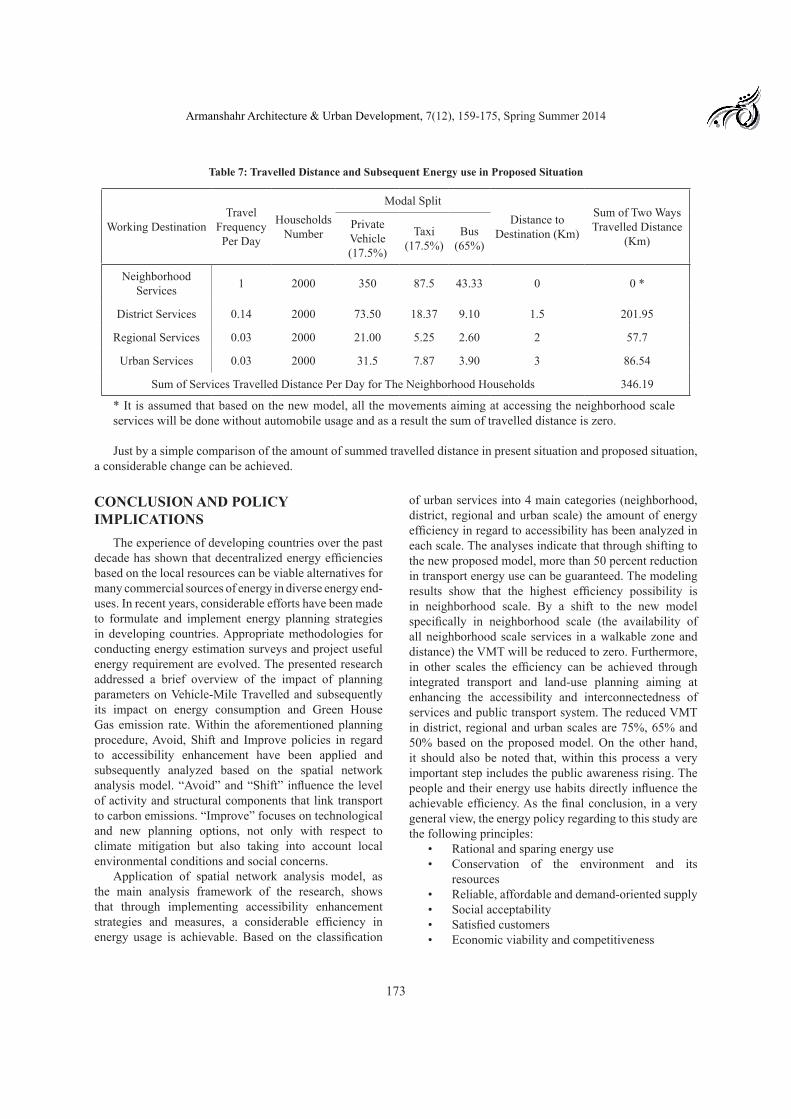
Table 6. Travelled Distance and Subsequent Energy Use in Present Situation
Services DestinationTravel
Frequency Per Day
Households Number
Modal SplitDistance
Destination (Km)
Sum of Two Ways Travelled Distance
(Km)Private Vehicle (33%)
Taxi (61%)
Bus (2%)
Neighborhood Services 1 2000 660 305 1.33 1 1932.66
District Services 0.14 2000 277.2 128.1 0.56 3 811.72
Regional Services 0.03 2000 59.4 27.45 0.12 3 173.94
Urban Services 0.03 2000 59.4 27.45 0.12 3 173.94
Sum of Services Travelled Distance Per Day for the Neighborhood Households 3092.26
* In present situation the share is more private and taxi dependent (share of Private car: 33%, Taxi: 61% and Bus: 2%) but in the proposed plan, considering the assumption that the quality of public transport will be increased and based on the field survey the share is mostly public transport dependent (share of Private car: 17.5% Taxi: 17.5% and Bus: 65%).
173
Armanshahr Architecture & Urban Development, 7(12), 159-175, Spring Summer 2014
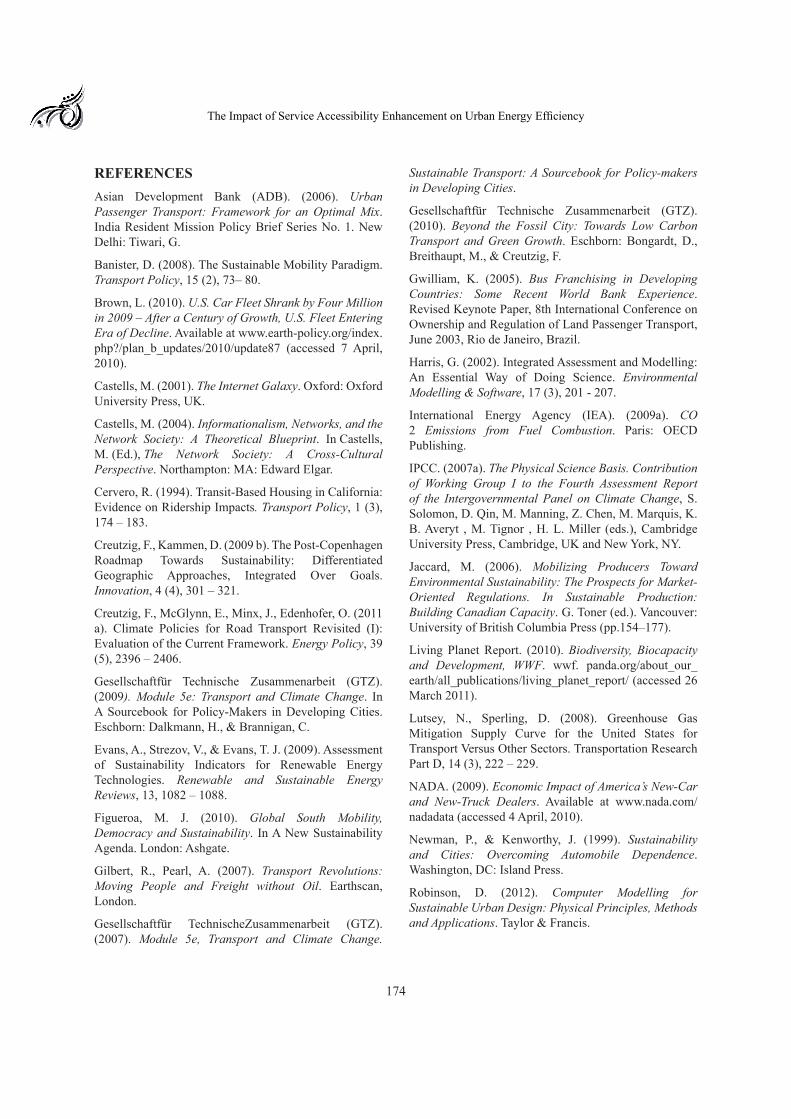
Table 7: Travelled Distance and Subsequent Energy use in Proposed Situation
Working DestinationTravel
Frequency Per Day
Households Number
Modal SplitDistance to
Destination (Km)
Sum of Two Ways Travelled Distance
(Km)Private Vehicle (17.5%)
Taxi (17.5%)
Bus (65%)
Neighborhood Services 1 2000 350 87.5 43.33 0 0 *
District Services 0.14 2000 73.50 18.37 9.10 1.5 201.95
Regional Services 0.03 2000 21.00 5.25 2.60 2 57.7
Urban Services 0.03 2000 31.5 7.87 3.90 3 86.54
Sum of Services Travelled Distance Per Day for The Neighborhood Households 346.19
* It is assumed that based on the new model, all the movements aiming at accessing the neighborhood scale services will be done without automobile usage and as a result the sum of travelled distance is zero.
Just by a simple comparison of the amount of summed travelled distance in present situation and proposed situation, a considerable change can be achieved.
CONCLUSION AND POLICY IMPLICATIONS
The experience of developing countries over the past decade has shown that decentralized energy efficiencies based on the local resources can be viable alternatives for many commercial sources of energy in diverse energy end-uses. In recent years, considerable efforts have been made to formulate and implement energy planning strategies in developing countries. Appropriate methodologies for conducting energy estimation surveys and project useful energy requirement are evolved. The presented research addressed a brief overview of the impact of planning parameters on Vehicle-Mile Travelled and subsequently its impact on energy consumption and Green House Gas emission rate. Within the aforementioned planning procedure, Avoid, Shift and Improve policies in regard to accessibility enhancement have been applied and subsequently analyzed based on the spatial network analysis model. “Avoid” and “Shift” influence the level of activity and structural components that link transport to carbon emissions. “Improve” focuses on technological and new planning options, not only with respect to climate mitigation but also taking into account local environmental conditions and social concerns.
Application of spatial network analysis model, as the main analysis framework of the research, shows that through implementing accessibility enhancement strategies and measures, a considerable efficiency in energy usage is achievable. Based on the classification
of urban services into 4 main categories (neighborhood, district, regional and urban scale) the amount of energy efficiency in regard to accessibility has been analyzed in each scale. The analyses indicate that through shifting to the new proposed model, more than 50 percent reduction in transport energy use can be guaranteed. The modeling results show that the highest efficiency possibility is in neighborhood scale. By a shift to the new model specifically in neighborhood scale (the availability of all neighborhood scale services in a walkable zone and distance) the VMT will be reduced to zero. Furthermore, in other scales the efficiency can be achieved through integrated transport and land-use planning aiming at enhancing the accessibility and interconnectedness of services and public transport system. The reduced VMT in district, regional and urban scales are 75%, 65% and 50% based on the proposed model. On the other hand, it should also be noted that, within this process a very important step includes the public awareness rising. The people and their energy use habits directly influence the achievable efficiency. As the final conclusion, in a very general view, the energy policy regarding to this study are the following principles:
• Rational and sparing energy use• Conservation of the environment and its
resources• Reliable, affordable and demand-oriented supply• Social acceptability• Satisfied customers• Economic viability and competitiveness
174
The Impact of Service Accessibility Enhancement on Urban Energy Efficiency
REFERENCESAsian Development Bank (ADB). (2006). Urban Passenger Transport: Framework for an Optimal Mix. India Resident Mission Policy Brief Series No. 1. New Delhi: Tiwari, G.
Banister, D. (2008). The Sustainable Mobility Paradigm. Transport Policy, 15 (2), 73– 80.
Brown, L. (2010). U.S. Car Fleet Shrank by Four Million in 2009 – After a Century of Growth, U.S. Fleet Entering Era of Decline. Available at www.earth-policy.org/index.php?/plan_b_updates/2010/update87 (accessed 7 April, 2010).
Castells, M. (2001). The Internet Galaxy. Oxford: Oxford University Press, UK.
Castells, M. (2004). Informationalism, Networks, and the Network Society: A Theoretical Blueprint. In Castells, M. (Ed.), The Network Society: A Cross-Cultural Perspective. Northampton: MA: Edward Elgar.
Cervero, R. (1994). Transit-Based Housing in California: Evidence on Ridership Impacts. Transport Policy, 1 (3), 174 – 183.
Creutzig, F., Kammen, D. (2009 b). The Post-Copenhagen Roadmap Towards Sustainability: Differentiated Geographic Approaches, Integrated Over Goals. Innovation, 4 (4), 301 – 321.
Creutzig, F., McGlynn, E., Minx, J., Edenhofer, O. (2011 a). Climate Policies for Road Transport Revisited (I): Evaluation of the Current Framework. Energy Policy, 39 (5), 2396 – 2406.
Gesellschaftfür Technische Zusammenarbeit (GTZ). (2009). Module 5e: Transport and Climate Change. In A Sourcebook for Policy-Makers in Developing Cities. Eschborn: Dalkmann, H., & Brannigan, C.
Evans, A., Strezov, V., & Evans, T. J. (2009). Assessment of Sustainability Indicators for Renewable Energy Technologies. Renewable and Sustainable Energy Reviews, 13, 1082 – 1088.
Figueroa, M. J. (2010). Global South Mobility, Democracy and Sustainability. In A New Sustainability Agenda. London: Ashgate.
Gilbert, R., Pearl, A. (2007). Transport Revolutions: Moving People and Freight without Oil. Earthscan, London.
Gesellschaftfür TechnischeZusammenarbeit (GTZ). (2007). Module 5e, Transport and Climate Change.
Sustainable Transport: A Sourcebook for Policy-makers in Developing Cities.
Gesellschaftfür Technische Zusammenarbeit (GTZ). (2010). Beyond the Fossil City: Towards Low Carbon Transport and Green Growth. Eschborn: Bongardt, D., Breithaupt, M., & Creutzig, F.
Gwilliam, K. (2005). Bus Franchising in Developing Countries: Some Recent World Bank Experience. Revised Keynote Paper, 8th International Conference on Ownership and Regulation of Land Passenger Transport, June 2003, Rio de Janeiro, Brazil.
Harris, G. (2002). Integrated Assessment and Modelling: An Essential Way of Doing Science. Environmental Modelling & Software, 17 (3), 201 - 207.
International Energy Agency (IEA). (2009a). CO 2 Emissions from Fuel Combustion. Paris: OECD Publishing.
IPCC. (2007a). The Physical Science Basis. Contribution of Working Group I to the Fourth Assessment Report of the Intergovernmental Panel on Climate Change, S. Solomon, D. Qin, M. Manning, Z. Chen, M. Marquis, K. B. Averyt , M. Tignor , H. L. Miller (eds.), Cambridge University Press, Cambridge, UK and New York, NY.
Jaccard, M. (2006). Mobilizing Producers Toward Environmental Sustainability: The Prospects for Market-Oriented Regulations. In Sustainable Production: Building Canadian Capacity. G. Toner (ed.). Vancouver: University of British Columbia Press (pp.154–177).
Living Planet Report. (2010). Biodiversity, Biocapacity and Development, WWF. wwf. panda.org/about_our_earth/all_publications/living_planet_report/ (accessed 26 March 2011).
Lutsey, N., Sperling, D. (2008). Greenhouse Gas Mitigation Supply Curve for the United States for Transport Versus Other Sectors. Transportation Research Part D, 14 (3), 222 – 229.
NADA. (2009). Economic Impact of America’s New-Car and New-Truck Dealers. Available at www.nada.com/nadadata (accessed 4 April, 2010).
Newman, P., & Kenworthy, J. (1999). Sustainability and Cities: Overcoming Automobile Dependence. Washington, DC: Island Press.
Robinson, D. (2012). Computer Modelling for Sustainable Urban Design: Physical Principles, Methods and Applications. Taylor & Francis.
175
Armanshahr Architecture & Urban Development, 7(12), 159-175, Spring Summer 2014
Rothengatter, W. (2003). Environmental Concepts – Physical and Economic. In Handbook of Transport and the Environment. D. Hensher and K. Button (eds.). Oxford: Elsevier.
Schafer, A., Heywood, J. B., Jacoby, H., & Waitz, I. (2009). Transportation in a Climate Constrained World. Cambridge, MA: MIT Press.
Schipper, L., Marie-Lilliu, M. (1999). Transport and CO2 Emissions: Flexing the Link – A Path for the World Bank. Environment Department Paper No. 69. Washington, DC: World Bank.
Schellnhuber, H.J. (2009). Tipping Elements in the Earth System. Proceedings of the National Academy of Sciences of the United States of America Special Issue, 106(49): 20561– 20563.
Sheller, M., Urry, J. (2003). Mobile Transformations Of Public and Private Life. Theory, Culture and Society, 20 (3), 25-107.
Sperling, D., Gordon, D. (2009). Two Billion Cars Driving Toward Sustainability. New York: Oxford University Press.
Toth, F. (2003). Climatic Policy In Light Of Climate Science: The Iclips Project. Climatic Change, 56: 7 – 36.
Urry, J. (2004). The System of Automobility. Theory, Culture and Society, 21 (4–5), 25 – 39.
Urry, J. (2007). Mobilities. Cambridge: Polity Press.
Van Wee, B., Rietveld, P., Meurs, H. (2006). Is Average Daily Travel Time Expenditure Constant? In Search of Explanations for An Increase In Average Travel Time. Journal of Transport Geography, 14, 109 – 122.
WBCSD. (2002). Mobility 2001: World Mobility at the End of the Twentieth Century and Its Sustainability. World Business Council for Sustainable Development (WBCSD), Geneva.
WGBU (German Advisory Council on Global Change). (2009). Solving the Climate Dilemma: The Budget Approach. Berlin: WGBU.
Whitelegg , J. (1997). Critical Mass. London: Pluto Press
Whitelegg, J., Haq, G. (2003). The Earthscan Reader in World Transport Policy and Practice. London: Earthscan.
