rail enhancement fund (ref) - olga · rail enhancement fund user’s manual 3 developed. these...
TRANSCRIPT

1.
Rail Enhancement Fund (REF)
User’s Manual
September 30, 2016

Rail Enhancement Fund User’s Manual 1
Rail Enhancement Fund (REF)
User’s Manual
1. Purpose and Overview of This User Manual
The purpose of this Manual is to summarize the policies and procedures governing the investment of Rail Enhancement Funds (REF) in passenger and freight rail assets that benefit a region of the Commonwealth or the Commonwealth as a whole. See Code of Virginia Section 33.2-1601 Rail Enhancement Fund in Appendix A of this Manual.
The first step in the rail investment process is a determination by the Commonwealth Transportation Board that an individual project will “result in public benefits to a region of the Commonwealth or the Commonwealth as a whole that are equal to or greater than the investment of” Rail Enhancement Funds. Section 2 of this Manual details the methods used by the Department of Rail and Public Transportation (DRPT) to determine the public benefits of a particular project, including:
State and federal best practices for benefit/cost analysis (BCA)
Directions for the use of the Virginia DRPT 2016 BCA Model
Outputs of the Virginia DRPT 2016 BCA Model
The second step in the rail investment process is a prioritized ranking of rail projects whose public benefits exceed the proposed investment of Rail Enhancement Funds (i.e. a BCA ratio greater than 1.0). The DRPT accepts project submissions on an annual or semi-annual basis to ensure that the best projects compete for limited Rail Enhancement Fund support. Section 3 of this Manual lays out the process and criteria for prioritizing REF investments in individual projects.
Based on statutory and constitutional findings, REF investments show benefits to both the overall transportation network and the Virginia system of highways. One of the most important ways to assure that these benefits can be demonstrated is to use best national BCA practices and to regularly update the data sources for the BCA Model. Section 4 of this Manual itemizes the data sources for the 2016 BCA Model and provides guidance for the periodic updating of that data.
Rail Enhancement Fund User’s Manual 2
2. Benefit/Cost Analysis for the Rail Enhancement Fund
Benefit/Cost Analysis (BCA) is a widely used method of monetizing the benefits of an infrastructure project, and comparing those monetized benefits to the project cost. It is a widely used method to assist in the allocation of state and federal transportation funds.
2.1 Federal and State Best Practices for Benefit/Cost Analysis
The use and evolution of BCA practices are well documented in both academic literature and federal government guidance.
This Manual documents a state-level BCA Model for investments of the Virginia Rail Enhancement Fund and is consistent with both federal BCA guidance and industry best practices, as of 2016.
2.1.1 Federal Benefit/Cost Guidance
The Federal Office of Management and Budget (OMB) provides broad BCA guidance in circulars A-4 and A-94. The United States Department of Transportation (USDOT) provides resource information and general BCA guidance under its TIGER and Nationally Significant Freight and Highway Program (NSFHP and related FASTLANE) grant programs.
The TIGER (www.dot.gov/tiger/guidance) guidance recommends the following major benefit categories, each accompanied by examples of possible benefits and potential monetization techniques:
Quality of Life
Economic Competitiveness
Safety
State of Good repair
Environmental Sustainability
The TIGER guidance also recommends “a life-cycle cost analysis approach in estimating the costs of the project to include operating, maintenance, and other life-cycle costs of the project, along with capital costs.” However, Section 33.2-1601 of the Code of Virginia provides a more narrow definition of project cost as the investment of Virginia Rail Enhancement Funds.
The Virginia BCA Model for the Rail Enhancement Fund is therefore focused on Virginia Costs and Virginia Benefits as required by the Statue.
2.1.2 Virginia Benefit/Cost Guidance
Virginia was one of the earliest states with statutory authority to invest public funds in private rail infrastructure in order to achieve specific public benefits. The original BCA model used by Virginia served the Commonwealth well, but largely relied on aggregate, nationwide metrics to calculate Virginia benefits - both passenger- and freight-related. However, significant advances in both data availability and economic methodology have also occurred since that model was

Rail Enhancement Fund User’s Manual 3
developed. These changes allow for a BCA Model capable of analyzing public benefits at the local, regional, corridor, and statewide levels. Appendix B summarizes the major changes from the original to the 2016 BCA model.
Given the Virginia statutory definition of project costs as the actual amount of Rail Enhancement Funds actually invested in the project, the DRPT 2016 BCA Model is focused on six broad categories of public benefit. Each is described more fully below, including a brief description of the changes from the original model and the basic calculations underlying each benefit category:
Travel time savings
Safety
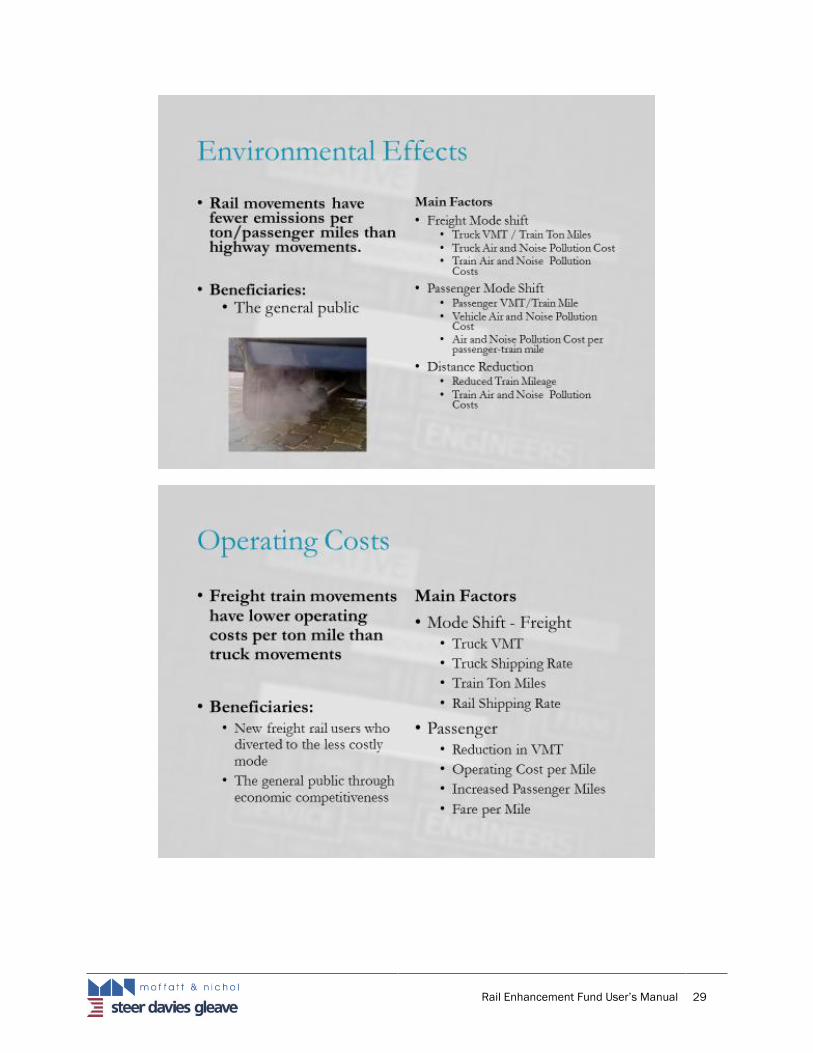
Environmental Effects
Vehicle Operating Costs
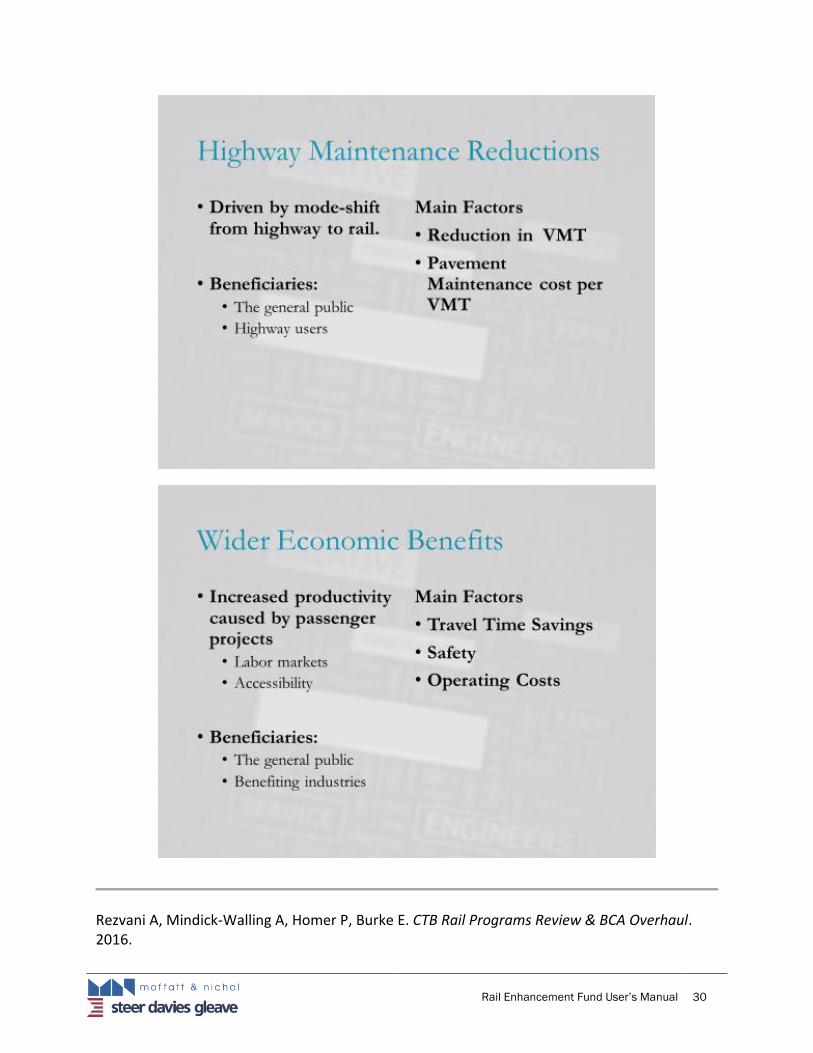
Wider Economic Benefits
Highway Maintenance Reductions
Appendix C graphically summarizes each benefit category, as well as its constituent factors and metrics.
As part of the Department’s commitment to transparency, the data sources that comprise the 2016 BCA Model and the recommended updates for the sources are documented in Appendix D of this Manual, and the model is available for download at: https://olga.drpt.virginia.gov/documents/forms/REF_BCA_Manual_20160930
Appendix D shows the likely schedule for updates to key data sets. The data sets for the 2016 BCA model should be updated at least biennially to reflect best industry practices.
The DRPT realizes that information submitted in the REF process may contain proprietary materials. Anything submitted to the department may be subject to Freedom of Information Act requests.
In the following computation examples, *F designates a field for Freight Benefits and *P designates a field for Passenger Benefits.
Travel Time Savings A major effect of a transportation investment is often on the travel time of users. As an illustration, imagine a hypothetical rail corridor in Virginia that is parallel to a major interstate. If throughput on the rail corridor is increased following the installation of a new signaling system, both freight and passengers on the rail corridor would benefit from reduced time spent in travel. The benefit of improved throughput would extend to others.
New users diverted to the faster rail service from other modes, be they passengers formerly in automobiles or freight formerly transported by truck, would benefit from the improved infrastructure.

Rail Enhancement Fund User’s Manual 4
Travel time savings can be realized when passengers reduce travel time during their route by using rail services instead of highway travel. The 2016 BCA model requires the input of passengers per year (current and proposed), the amount of time saved, and the purpose of travel data to compute passenger travel time savings.
Travel Time
Savings =
Per trip time
savings *
Weighted Average Value of
Time
* Annual
Passengers (existing)
+
Travel time Savings per trip of new passengers
*
Weighted Average value of
time
* Annual
Passengers (new)
Passengers who remain in automobiles or freight that remains in trucks, as the parallel interstate is now less congested, would also benefit from the shift from truck to rail.
Congestion Reduction Benefits are realized by the reduction of vehicle miles traveled multiplied by the congestion cost on a specific highway. The benefit measures the improvement in the levels of highway congestion by reducing the number of vehicles on major highways throughout Virginia. The 2016 BCA model requires the input of routes selected, the trip length, the number of trucks per railcar* (freight), and railcar or passenger demand to compute the benefit.
Congestion Reduction
Benefit =
Reduction in Truck (or Passenger) Vehicle Miles
Traveled *
Congestion Cost per Truck or Vehicle Mile
In a typical transportation project, the value of travel time savings can be a significant part of the benefit. Traditional transportation models can estimate vehicle travel time savings. Crucial to integrating travel time savings into a BCA is determining the monetary value of time that should be attached to the estimated time savings (e.g. lost wages or productivity for passengers and fewer labor hours to deliver a product for freight). The 2016 BCA Model includes the option of more detailed corridor value of time for passengers, as well as a significantly expanded database of freight commodities (e.g. time saved delivering critical pharmaceuticals is more valuable than time saved delivering mulch).
Safety Another important benefit of rail transportation investments is safety. Shifting passengers or freight to the rail network reduces the risks of crashes, injuries, and fatalities in measurable ways. This is an economic benefit in the same way that travel time savings are, and one which has been given a monetary value based on the observed values people place on reducing the risk of injury or death. Once monetized through the financial value of avoided crashes, injuries and fatalities, safety is usually one of the most important benefits for projects submitted to the REF program. As with value of time, a monetary value must be given to avoided injuries and fatalities for inclusion in the BCA. The 2016 BCA Model includes Virginia-specific values for avoided crashes, injuries and fatalities.
When passenger and freight traffic are reduced on the highways, a benefit from the reduction in accidents can be realized. There is also benefit from the closure of crossings along the trip

Rail Enhancement Fund User’s Manual 5
route. The 2016 BCA model requires the associated highway, number of crossings removed, diverted mileage, train mileages, trucks per railcar*F, tons per truck load*F, railcar and passenger demands as inputs.
Accident Reduction
Benefit =
Truck Ton
Miles *
Accident Costs per truck ton
miles
- Train Ton
Miles *
Freight Train Accident Cost per train ton
mile
+
Accident cost per
rail crossing
*
Number of Rail
Crossings Removed
Accident Reduction
Benefit =
Reduction in Passenger VMT
* Accident Costs
per vehicle mile
+ Accident cost
per rail crossing
* Number of Rail
Crossings Removed
Environmental Effects Environmental effects are an important component of a BCA, and for projects that create a mode shift from roads to rail, the net impact on vehicular emissions and associated health risk is usually positive. The Clean Air Act and its associated regulations have given rise to an extensive body of economic data on the health benefits of reduced emissions and improved air quality. The 2016 BCA Model includes statewide and locality-specific values for improved air quality through reduced vehicle emissions.
Environmental improvements are realized in two ways. The first is the modal shift from truck to train. A monetized value is assigned to the difference between the emissions made by truck traffic or passenger vehicle over the route distance and the emissions made by train traffic. The 2016 BCA model requires the project applicant or sponsor to enter the routes selected, rail tons per rail car*F, railcars per train*F, number of riders*P, train route length, vehicle trip length, trucks per rail car*F, rail car or passenger demand.
Freight Environmental Improvement (Mode Shift)
= Truck VMT
* Vehicle Air and Noise Pollution
Cost -
Train Ton
Miles *
Train Air and Noise
Pollution Costs
Passenger Environmental Improvement (Mode Shift)
= Passenger
VMT Reduction
*
Vehicle Air and Noise
Pollution Cost
-
Change in Passengers
* Passenger trip length
*
Pollution Cost per
passenger-train mile Passengers
per train
Rail Enhancement Fund User’s Manual 6
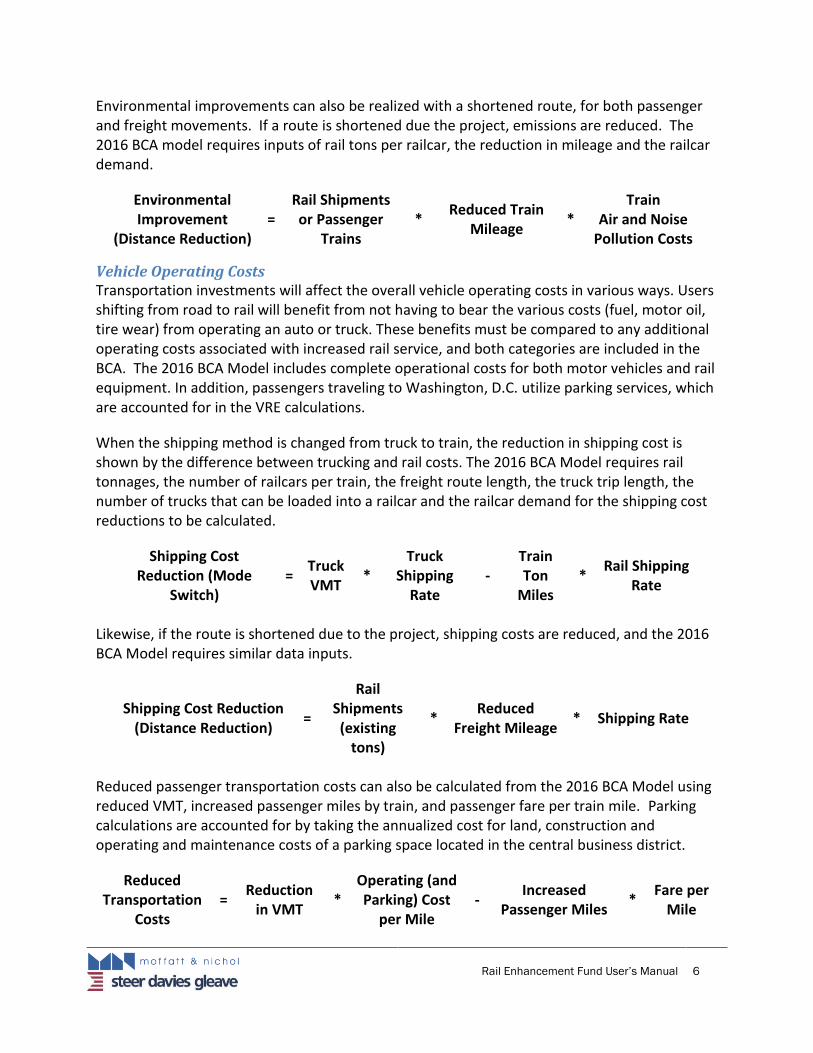
Environmental improvements can also be realized with a shortened route, for both passenger and freight movements. If a route is shortened due the project, emissions are reduced. The 2016 BCA model requires inputs of rail tons per railcar, the reduction in mileage and the railcar demand.
Environmental Improvement
(Distance Reduction) =
Rail Shipments or Passenger
Trains *
Reduced Train Mileage
* Train
Air and Noise Pollution Costs
Vehicle Operating Costs Transportation investments will affect the overall vehicle operating costs in various ways. Users shifting from road to rail will benefit from not having to bear the various costs (fuel, motor oil, tire wear) from operating an auto or truck. These benefits must be compared to any additional operating costs associated with increased rail service, and both categories are included in the BCA. The 2016 BCA Model includes complete operational costs for both motor vehicles and rail equipment. In addition, passengers traveling to Washington, D.C. utilize parking services, which are accounted for in the VRE calculations.
When the shipping method is changed from truck to train, the reduction in shipping cost is shown by the difference between trucking and rail costs. The 2016 BCA Model requires rail tonnages, the number of railcars per train, the freight route length, the truck trip length, the number of trucks that can be loaded into a railcar and the railcar demand for the shipping cost reductions to be calculated.
Shipping Cost Reduction (Mode
Switch) =
Truck VMT
* Truck
Shipping Rate
- Train Ton
Miles *
Rail Shipping Rate
Likewise, if the route is shortened due to the project, shipping costs are reduced, and the 2016 BCA Model requires similar data inputs.
Shipping Cost Reduction (Distance Reduction)
=
Rail Shipments (existing
tons)
* Reduced
Freight Mileage * Shipping Rate
Reduced passenger transportation costs can also be calculated from the 2016 BCA Model using reduced VMT, increased passenger miles by train, and passenger fare per train mile. Parking calculations are accounted for by taking the annualized cost for land, construction and operating and maintenance costs of a parking space located in the central business district.
Reduced Transportation
Costs =
Reduction in VMT
* Operating (and Parking) Cost
per Mile -
Increased Passenger Miles
* Fare per
Mile

Rail Enhancement Fund User’s Manual 7
Wider Economic Benefits Wider economic benefits refer to the effect on productivity attributable to a transportation project. Essentially, transportation investments make the economy more productive by reducing the costs of transportation. Transportation investments can also create greater densities of employment around transit services and allow businesses to be more productive than just travel time savings alone would suggest. Similarly, such investments may allow businesses access to a larger and/or more qualified work force.
These wider economic benefits are included in the 2016 BCA Model for passenger and commuter rail projects. While the Department considered the possibility of wider economic benefits for freight rail projects (e.g. an intermodal facility supporting adjacent industries), there was not sufficient publicly available data to support their inclusion in the 2016 BCA Model at this time. However, the federal TIGER grant standards are sufficiently flexible to allow such considerations on a case-by-case basis.
Wider Economic Benefits are those that have not typically been accounted for in traditional cost-benefit, but are realized in the ridership’s productivity. The 2016 BCA Model calculates Wider Economic Benefits from other benefits, including travel time savings, safety and reduced transportation costs.
Wider Economic Benefits
= 0.05 * ( Travel Time
Savings +
Safety Benefits
+ Reduced
Transportation Costs )
Highway Maintenance Reduction Transportation investments that shift passengers and freight to rail will reduce road usage. This reduced road usage will reduce pavement wear, particularly in the case of truck traffic. These savings have proven to be significant on several of the port-related rail investments. These values are significantly updated in the 2016 BCA Model, and may change as additional studies are completed and federal guidance is updated.
When vehicles, both freight truck and passenger, are removed from the highways, a savings in pavement maintenance is realized. The 2016 BCA Model requires the following inputs to calculate savings in pavement maintenance: the highways where traffic is diverted, the vehicle mileage removed from the roads, how many trucks can be loaded onto a railcar*F, passenger demand*P, and railcar demand*F.
Pavement Maintenance Savings
= Reduction in
VMT *
Pavement Maintenance cost per
Mile
Rail Enhancement Fund User’s Manual 8
2.2 Using the 2016 BCA Model
The 2016 BCA Model is used to transparently conduct the first step in the REF evaluation process to demonstrate that the Virginia-based public benefits of an individual rail project exceed the costs to the REF.
The 2016 BCA Model is publicly available at: https://olga.drpt.virginia.gov/documents/forms/REF_BCA_Model_20160930
2.2.1 Model-Wide User Notes
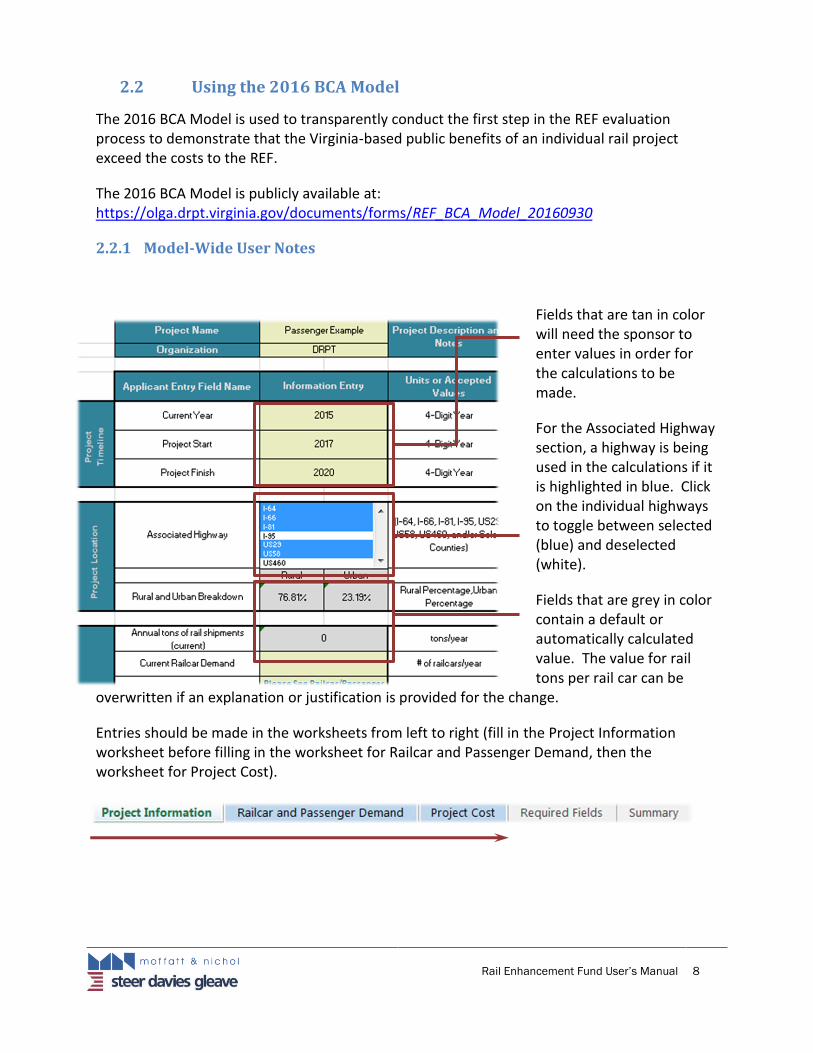
Fields that are tan in color will need the sponsor to enter values in order for the calculations to be made.
For the Associated Highway section, a highway is being used in the calculations if it is highlighted in blue. Click on the individual highways to toggle between selected (blue) and deselected (white).
Fields that are grey in color contain a default or automatically calculated value. The value for rail tons per rail car can be
overwritten if an explanation or justification is provided for the change.
Entries should be made in the worksheets from left to right (fill in the Project Information worksheet before filling in the worksheet for Railcar and Passenger Demand, then the worksheet for Project Cost).

Rail Enhancement Fund User’s Manual 9
2.2.2 Data Entry Worksheets
Data Entry Worksheets – A combination of worksheets (denoted with blue tabs, or when selected, white with green font) that allow the project sponsor to enter information about the project that will be scored using Benefit Cost Analysis.
Project Information – The project sponsor or applicant will provide project specific
information regarding the project timeline, location, truck and rail freight information
and vehicle and rail passenger information. Definitions are available on the worksheet
to aid the sponsor or applicant in entering the information.
Railcar and Passenger Demand – After the project information worksheet is completed,
the projected number of total freight railcars and total rail passengers are entered into
the railcar and passenger demand worksheet. All fields must be filled in, zero is the
default value. To reset the worksheet, the “Reset Railcar and Passenger Demand Page”
button can be clicked. The project start year and project completion years are
highlighted when the information is entered into the project information worksheet.
The Department strongly recommends a dialogue with the project sponsor or applicant
to ensure the long-term reliability of railcar and passenger demand. For example, a
freight sponsor or applicant might not be aware of the potential passenger benefits of a
particular rail improvement, while a passenger sponsor or applicant might not be aware
of a changing cargo mix over time. Many of the Virginia Class 1 railways support both
passenger and freight movements, and many rail improvements benefit both passenger
and freight services.
While passenger and railcar demand forecasts are essential to calculating public
benefits, the Department may or may not use such forecasts for grant administration
and sanctions.
Project Cost – Project sponsors or applicants should continue to the project cost
worksheet to enter information into individual cost centers by year.
The benefits will be automatically entered when the project information and railcar
passenger demand worksheets are filled in. Breakdowns will also be provided after the
DRPT percentage of funding is entered. In kind contributions can be entered into the
spreadsheet but are not accounted for in the benefit-cost study. The benefit cost
results are then provided within cells A60 through C62. More detailed results can be
found on the Summary page.
Rail Enhancement Fund User’s Manual 10
2.2.3 Information Worksheets (Grey Tabs)
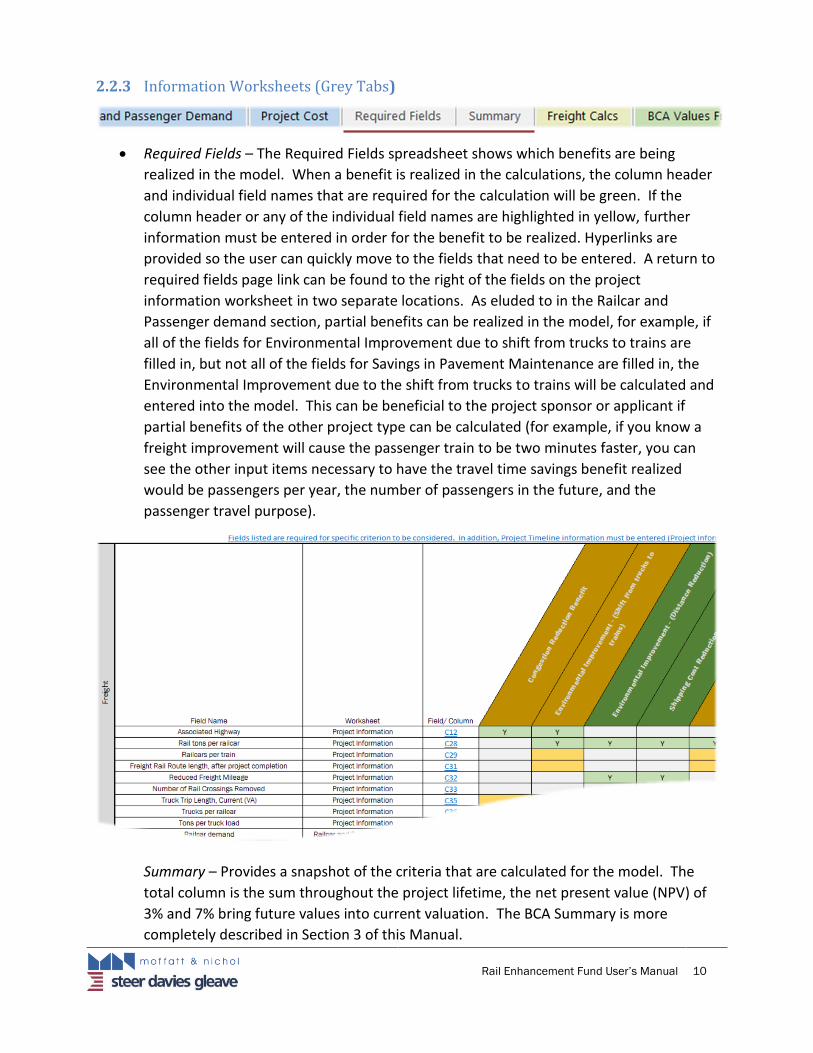
Required Fields – The Required Fields spreadsheet shows which benefits are being
realized in the model. When a benefit is realized in the calculations, the column header
and individual field names that are required for the calculation will be green. If the
column header or any of the individual field names are highlighted in yellow, further
information must be entered in order for the benefit to be realized. Hyperlinks are
provided so the user can quickly move to the fields that need to be entered. A return to
required fields page link can be found to the right of the fields on the project
information worksheet in two separate locations. As eluded to in the Railcar and
Passenger demand section, partial benefits can be realized in the model, for example, if
all of the fields for Environmental Improvement due to shift from trucks to trains are
filled in, but not all of the fields for Savings in Pavement Maintenance are filled in, the
Environmental Improvement due to the shift from trucks to trains will be calculated and
entered into the model. This can be beneficial to the project sponsor or applicant if
partial benefits of the other project type can be calculated (for example, if you know a
freight improvement will cause the passenger train to be two minutes faster, you can
see the other input items necessary to have the travel time savings benefit realized
would be passengers per year, the number of passengers in the future, and the
passenger travel purpose).
Summary – Provides a snapshot of the criteria that are calculated for the model. The
total column is the sum throughout the project lifetime, the net present value (NPV) of
3% and 7% bring future values into current valuation. The BCA Summary is more
completely described in Section 3 of this Manual.
Rail Enhancement Fund User’s Manual 11
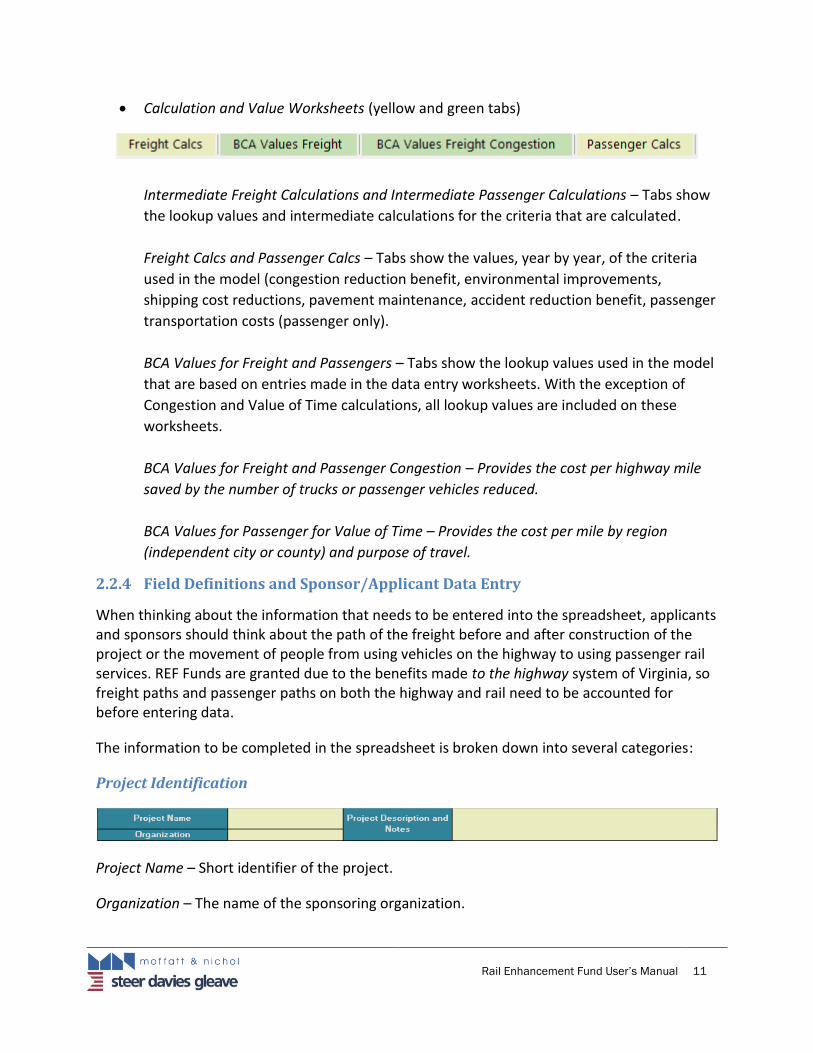
Calculation and Value Worksheets (yellow and green tabs)
Intermediate Freight Calculations and Intermediate Passenger Calculations – Tabs show
the lookup values and intermediate calculations for the criteria that are calculated.
Freight Calcs and Passenger Calcs – Tabs show the values, year by year, of the criteria
used in the model (congestion reduction benefit, environmental improvements,
shipping cost reductions, pavement maintenance, accident reduction benefit, passenger
transportation costs (passenger only).
BCA Values for Freight and Passengers – Tabs show the lookup values used in the model
that are based on entries made in the data entry worksheets. With the exception of
Congestion and Value of Time calculations, all lookup values are included on these
worksheets.
BCA Values for Freight and Passenger Congestion – Provides the cost per highway mile
saved by the number of trucks or passenger vehicles reduced.
BCA Values for Passenger for Value of Time – Provides the cost per mile by region
(independent city or county) and purpose of travel.
2.2.4 Field Definitions and Sponsor/Applicant Data Entry
When thinking about the information that needs to be entered into the spreadsheet, applicants and sponsors should think about the path of the freight before and after construction of the project or the movement of people from using vehicles on the highway to using passenger rail services. REF Funds are granted due to the benefits made to the highway system of Virginia, so freight paths and passenger paths on both the highway and rail need to be accounted for before entering data.
The information to be completed in the spreadsheet is broken down into several categories:
Project Identification
Project Name – Short identifier of the project.
Organization – The name of the sponsoring organization.

Rail Enhancement Fund User’s Manual 12
Project Description and Notes – A brief description of the project.
Project Timeline
Current Year – The year in which the projects will be scored.
Project Start – The year in which project construction will begin. When filling out the Railcar and Passenger Demand and Project Cost worksheets, the year of the project start (if it isn’t the current year) will be highlighted in yellow.
Project Finish – The first full year in which the project will be finished. Project benefits will be realized in this year. When filling out the Railcar and Passenger and Project Cost worksheets, project finish year will be highlighted in green.
Project Location Because funding is granted based on the benefits made to highway system of Virginia, the model has the capability to correlate project location to specific highway corridor(s). Sponsors and applicants should review the project location and think of all rail service that travels over project location, corridor or region. For example, if the route was shut down, which trains would be affected? Then think about how the freight, if no longer traveling by rail, would move on the highways within Virginia. The same goes for passenger traffic. What passengers travel over the project location? What highways would they drive on if rail was not available? See Appendix E for highway corridor correlation sketch.
The default for associated highways is an average of all of the corridors listed for selection. Multiple or single corridor selection is possible. If a highway name is highlighted in blue, it is considered to be selected. If the background remains white, it is not selected and will not be included in the calculations. In the example below, I-64, I-66, I-81, US29 and US58 are selected, while I-95 and US460 are not.
The Rural and Urban breakdowns are calculated automatically, based on the associated highway selections.

Rail Enhancement Fund User’s Manual 13
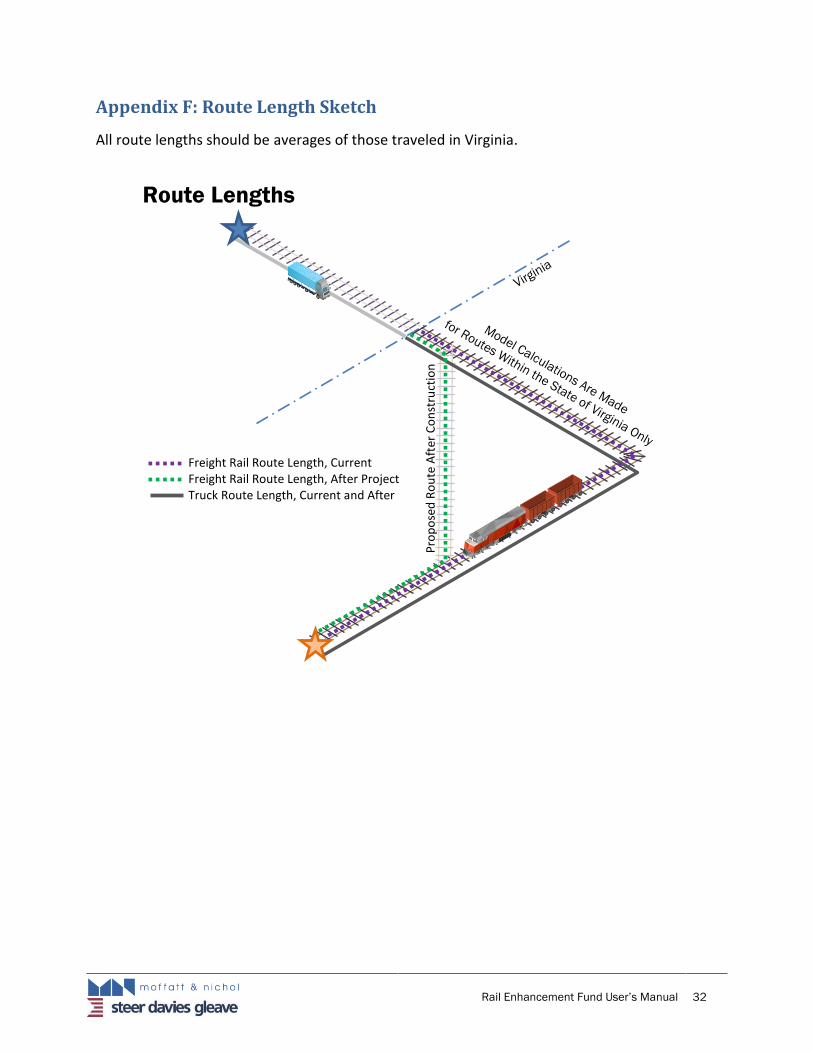
Rail Freight Data and Truck Freight Data Before filling out this section, applicants and sponsors should visualize the project location and function: the amount and type of freight traveling over the project location; the amount, source and termination of its route or routes. Consider how the freight would travel if rail was not an available option. Applicants and sponsors should fill out the rail freight data and truck freight data sections of the project information worksheet these thoughts in mind. See Appendix F for a sketch of how route lengths should be visualized.
Annual tons of rail shipments (current) – The current tonnage of rail shipments that pass over the project location in one year. The field for Annual tons of rail shipments is automatically calculated when the fields for current railcar demand and rail tons per railcar are filled in.
Current Railcar Demand – The number of railcars used to haul the shipments in a year. This value will be used as the base value for calculations involving the differences for future years in railcar demand. It will automatically fill in the current year of the Railcar and Passenger Demand Worksheet.
Additional Annual Railcar Demand – Is filled out on the Railcar and Passenger Demand worksheet. The Railcar and Passenger Demand worksheet is hyperlinked to the project information worksheet in this section.
Rail tons per railcar – A calculated item that can be overwritten by the project sponsor. The default value of 70.2 tons per railcar was taken using the average value of rail shipments originating in, traveling within, terminating in, or going through the Commonwealth of Virginia. If a more detailed value is known for a particular project, the sponsor or applicant may overwrite the value and provide the resource information when applying for REF funds. If the value is overwritten, a soft warning will appear and the units box will change from “tons/railcar” into a hyperlink to the field where a short justification can be written for the overwrite. The hyperlink will appear dark red until the justification is provided.
Railcars per train – The average number of railcars traveling over the project location in a year.
Mileages (Freight Rail Route Length, current and after project completion, Truck Trip Length, Current) – The Route Length diagram in Appendix F shows a single example of what distances should be averaged for the route length values. Mileage measurements for a route should

Rail Enhancement Fund User’s Manual 14
begin with either the origin (if it starts within the Commonwealth of Virginia) or where the freight enters the Commonwealth of Virginia, continues to travel over the project location, and finishes with the location where the freight either leaves the Commonwealth or concludes travel within the Commonwealth. A weighted average of all routes traveling over the project location should be entered into the Project Information Worksheet for both the current and after project values for rail and the current value for truck travel.
Reduced Freight Mileage – This value is automatically calculated by taking the difference in the current and after project completion distances for rail.
Number of Rail Crossings Removed – If the project completion will result in closing at-grade highway-rail crossings, list the number of crossings that will be closed, otherwise enter zero (0) for this value.
2.3 Rail Passenger Data and Vehicle Passenger Data
Before filling out this section, applicants and sponsors should visualize the project location: how passengers are routed over the project location; the number of passengers; their purpose of travel; and the origination and termination of the routes. Applicants and sponsors also should consider how the passengers would travel if rail was not an available option. The passenger data and vehicle passenger data sections of the project information worksheet should be filled out with these thoughts in mind. For each category, selections for either Amtrak and/or VRE can be made.
Number of Passengers per year –The current number of passengers that pass over the project location in one year. In essence, those passengers that will benefit first-hand when the project is completed.
Additional Passenger Demand – Is filled out on the Railcar and Passenger Demand worksheet. The Railcar and Passenger Demand worksheet is hyperlinked to the project information worksheet in this section.
Number of Passenger Trains per year (Current)– The number of passenger trains that are routed over the project location during the last full year.
Mileages (Passenger Trip Length (Existing and After Project, Rail; Automobile Trip Length) –Mileage measurements for a route should begin with either the origin (if it starts within the Commonwealth of Virginia) or where the passenger enters the Commonwealth of Virginia, continues to travel over the project location, and finishes with the location where the passenger either leaves the Commonwealth or concludes travel within the Commonwealth. A
Rail Enhancement Fund User’s Manual 15
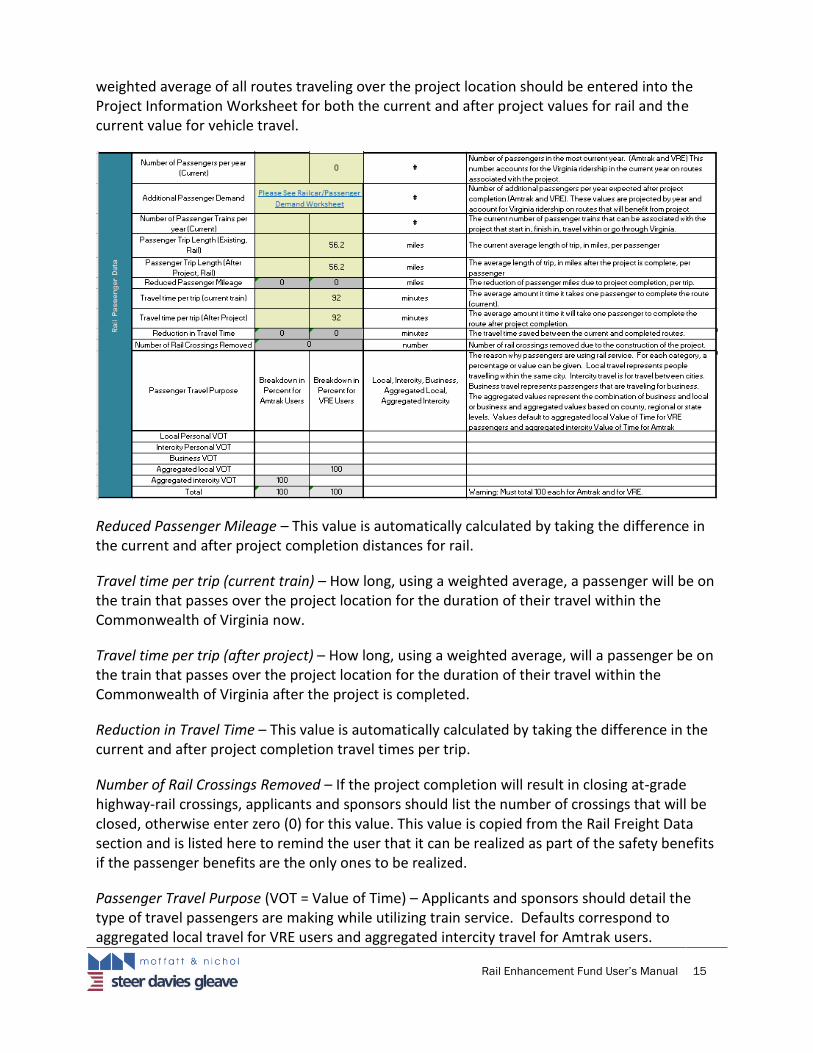
weighted average of all routes traveling over the project location should be entered into the Project Information Worksheet for both the current and after project values for rail and the current value for vehicle travel.
Reduced Passenger Mileage – This value is automatically calculated by taking the difference in the current and after project completion distances for rail.
Travel time per trip (current train) – How long, using a weighted average, a passenger will be on the train that passes over the project location for the duration of their travel within the Commonwealth of Virginia now.
Travel time per trip (after project) – How long, using a weighted average, will a passenger be on the train that passes over the project location for the duration of their travel within the Commonwealth of Virginia after the project is completed.
Reduction in Travel Time – This value is automatically calculated by taking the difference in the current and after project completion travel times per trip.
Number of Rail Crossings Removed – If the project completion will result in closing at-grade highway-rail crossings, applicants and sponsors should list the number of crossings that will be closed, otherwise enter zero (0) for this value. This value is copied from the Rail Freight Data section and is listed here to remind the user that it can be realized as part of the safety benefits if the passenger benefits are the only ones to be realized.
Passenger Travel Purpose (VOT = Value of Time) – Applicants and sponsors should detail the type of travel passengers are making while utilizing train service. Defaults correspond to aggregated local travel for VRE users and aggregated intercity travel for Amtrak users.

Rail Enhancement Fund User’s Manual 16
Current travel time by vehicle – This value represents the amount of time that a passenger spends in the vehicle to get from origin to destination (within the Commonwealth of Virginia) that would be replaced by travel time on the train after the project is completed.
Change in travel time for switching – This value is automatically calculated by taking the difference between the travel time before the project by vehicle and subtracting the travel time per trip after project.
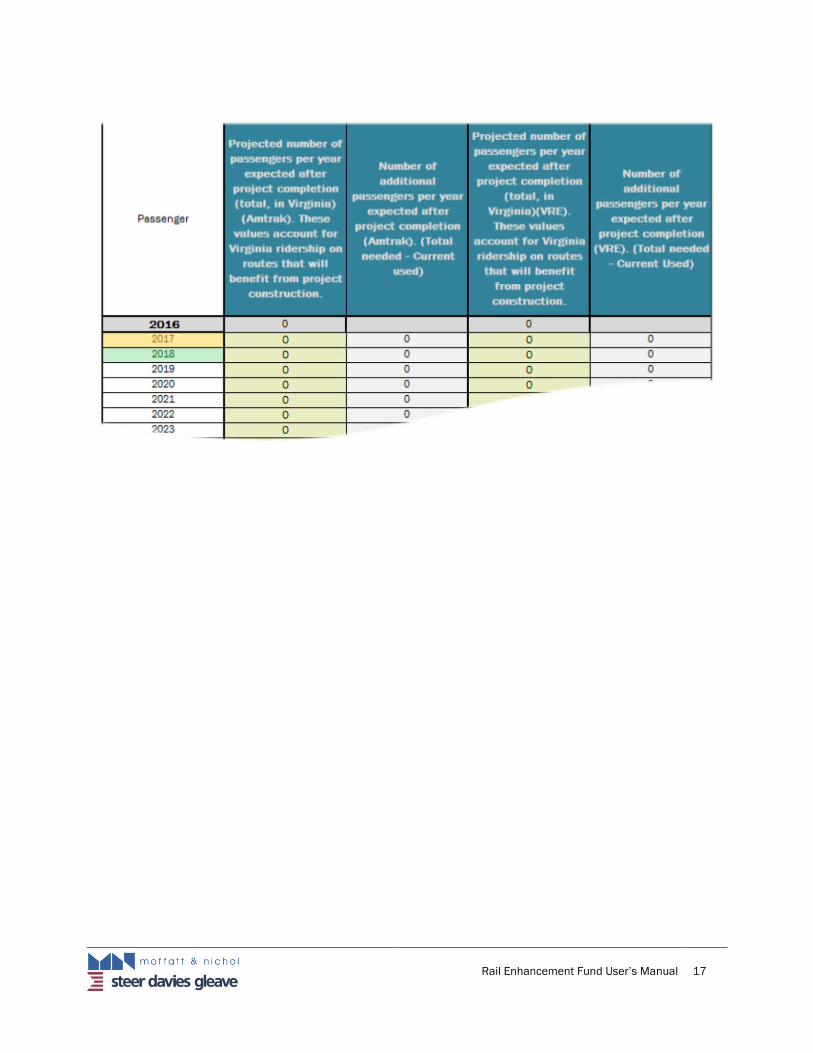
Railcar and Passenger Demand
Applicants and sponsors should use the railcar and passenger demand worksheet to enter the total number of railcars and/or passengers needed for the years after project completion. The project start year, if after the first year, will be highlighted in yellow. The project completion year will be highlighted in green. These values are taken from the Project Timeline section of the Project Information worksheet. If the page needs to be cleared out, when the reset railcar and passenger demand page button is clicked the entry values will be returned to zero. Fill in the projected number of railcars needed by year after the project is completed in this section, the number of additional passengers per year will be calculated to the right of the entry values automatically.
Rail Enhancement Fund User’s Manual 17
Rail Enhancement Fund User’s Manual 18
3. Project Cost
3.1 Cost Breakdown
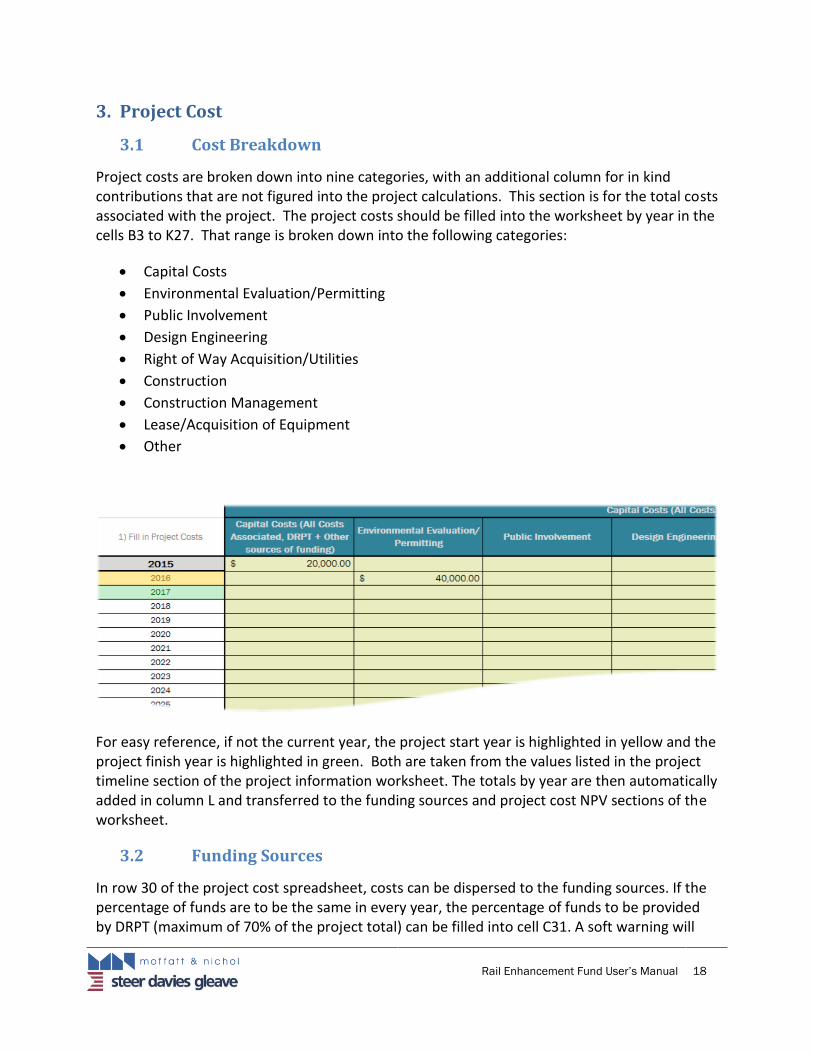
Project costs are broken down into nine categories, with an additional column for in kind contributions that are not figured into the project calculations. This section is for the total costs associated with the project. The project costs should be filled into the worksheet by year in the cells B3 to K27. That range is broken down into the following categories:
Capital Costs
Environmental Evaluation/Permitting
Public Involvement
Design Engineering
Right of Way Acquisition/Utilities
Construction
Construction Management
Lease/Acquisition of Equipment
Other
For easy reference, if not the current year, the project start year is highlighted in yellow and the project finish year is highlighted in green. Both are taken from the values listed in the project timeline section of the project information worksheet. The totals by year are then automatically added in column L and transferred to the funding sources and project cost NPV sections of the worksheet.
3.2 Funding Sources
In row 30 of the project cost spreadsheet, costs can be dispersed to the funding sources. If the percentage of funds are to be the same in every year, the percentage of funds to be provided by DRPT (maximum of 70% of the project total) can be filled into cell C31. A soft warning will

Rail Enhancement Fund User’s Manual 19
appear if a value greater than 70% is entered into cell C31. The funding values will automatically be calculated based on the totals from cells B3 to J27. If the funding is to be allocated in different percentages, the values in grey can be overwritten if justification is provided.
3.3 Net Present Value
Cells F30 through L57 are used to calculate the Net Present Value (NPV) for the Benefits and Costs by year. Cells N31 through S57 provide the NPV for funds provided by DRPT and Outside Funds. A summary of the NPV for 3% and 7% for DRPT funds and Total funds are provided in cells A60 through C62. These areas are used for calculation and cannot be edited.
3.4 Number of Years to Calculate
DRPT recommends a minimum required useful life of 15 year for a project. A soft stop will appear and the cell will turn pink with red text if a value of less than 15 years is entered. While values can be entered for any number of years in the railcar and passenger demand and project cost worksheets, calculations are made for the number of years inputted into cell H61 on the project cost worksheet. This enables the applicant or project sponsor to easily edit the project horizon while looking at the NPV of the Benefit Cost Ratios immediately to the left of this entry. Please note that projected BCA Values are available until the year 2040, a message of “No Available Values” will be received for calculations attempted for years after 2040.
3.4.1 Outputs of the 2016 BCA Model
The Department of Rail and Public Transportation is committed to transparency and industry best practices in the allocation of Rail Enhancement Funds. The 2016 BCA Model is the first step in that process and is built on those commitments. The Department will utilize a summary sheet with sections for the following: project information; freight benefits and passenger benefits showing the benefit name, the benefit amount (with no adjustment for NPV), and the definition of the benefit; total benefits and cost broken down by funding source; and lastly, the benefit cost ratio being brought to current year value using net present value. See Appendix G for one page summary sheet.
Rail Enhancement Fund User’s Manual 20
4. Prioritizing Rail Enhancement Fund Projects
The Code of Virginia requires the Commonwealth Transportation Board to make a formal finding that the public benefits of an REF project exceed the cost of the REF investment. The Department has developed the following scorecard to guide the CTB deliberations and actions, as well as to guide any subsequent grant conditions or oversight.
Scorecard(SC) 1. Rail Enhancement Fund: Corridor Investment Scorecard
The Rail Enhancement Fund (REF) is a dedicated source of funding for capital improvements benefiting passenger and freight initiatives. This document outlines the process of and reason for evaluating the benefits of the Commonwealth’s investment in freight and passenger rail infrastructure.
SC.i Purpose
Article X, Section 10 of the Constitution of Virginia indicates that the Commonwealth can only
make internal improvements with state parks and the state highway system. Investment in rail
infrastructure is not explicitly included in this article and, therefore, it has been ruled that any
investment of Commonwealth funds in rail infrastructure must benefit the highway system
(Montgomery County v. Virginia DRPT, 282 Va. 422,719). It is always important to highlight and
summarize the benefits of any government program. However, the ruling in the Montgomery v DRPT
case makes it critical to summarize and highlight the benefits of the REF program to the highways of
Virginia.
In addition, in HB 1887, the 2015 General Assembly directed the Commonwealth
Transportation Board (CTB) to “develop no later than December 1, 2015, a legislative proposal to
revise the public benefit requirements of the Rail Enhancement Fund….” Section 427 of the
Appropriations Act that same year directed the Secretary of Transportation and DRPT to summarize
previous REF allocations, expenditures and transfers, as well as the long-term needs of the REF. The
CTB, through its Rail Subcommittee, expanded the study to include an equivalent consideration of
program policy goals for the REF program. As a result, DRPT, in conjunction with the Rail Subcommittee
and an open process of stakeholder engagement, is conducting administrative improvements to
simplify the grant process and to enhance overall transparency and accountability of REF activities.
This REF scorecard is one initiative that will create higher accountability and transparency for the REF
program.
SC.ii Process
To complete a vision of enhancing and expanding freight and passenger rail in Virginia, this
Rail Enhancement scorecard will be created annually and provided to the CTB for their review and to
assist with their assessment of the effects of the REF program.
Step 1—All REF grant agreements will include the requirement that grantees will provide data annually to DRPT in order to effectively and accurately complete the annual REF scorecard.

Rail Enhancement Fund User’s Manual 21
Step 2—DRPT will gather and analyze all grantee provided data, organizing the data by corridor and comparing both existing corridor-wide performance with the expected project benefits of each REF assisted project.
Step 3—DRPT will provide the REF scorecard to the CTB Rail Subcommittee annually, and will be available to discuss and dissect the report with the Rail Subcommittee members to ensure that the information is accurate and understandable.
Step 4—CTB Rail Subcommittee members and DRPT will be responsible for reviewing the scorecard information and updating the policies, procedures, and goals of the REF program according to the overall benefits to the highway system and performance of the railroads in Virginia.
SC.iii Scorecard Results
The following pages break down the REF program of investments and the resulting
performance and benefits by strategic corridor within the Commonwealth of Virginia.

SC.iv Location of Strategic Rail Corridors in Virginia
Rail Corridors
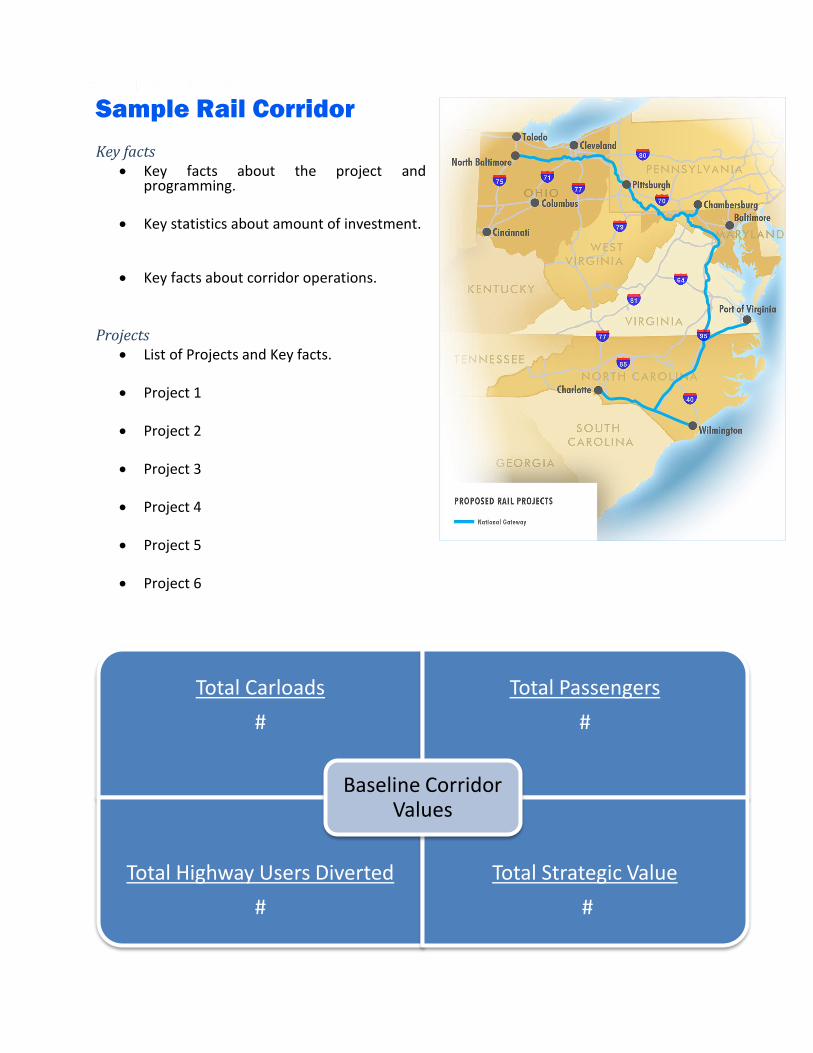
Sample Rail Corridor
Key facts Key facts about the project and
programming.
Key statistics about amount of investment.
Key facts about corridor operations.
Projects List of Projects and Key facts.
Project 1
Project 2
Project 3
Project 4
Project 5
Project 6
Total Carloads
#
Total Passengers
#
Total Highway Users Diverted
#
Total Strategic Value
#
Baseline Corridor Values
Rai
lcar
s

Rail Enhancement Fund User’s Manual 26
Category Benefit Description
Congestion Cost # Improvement in the levels of highway congestion realized by shifting
traffic from highway to rail.
Environmental # Benefit associated with the reduction in the level of CO2, VOCs, NOx
and Particulate Matter due do highway traffic moving to rail.
Shipping Cost # Cost savings realized by reducing the existing route length and/or
switching shipping modes; long haul shipping costs are lower by rail.
Pavement Maintenance # This calculates the reduction in road pavement maintenance costs due
to the mode shift of highway users.
Accident Cost # Reduction in the probability of having an accident on the highway due
to reduction of total VMT.
Economic # Improved labor productivity attributable to increased productivity
while traveling via rail.
Corridor Velocity # Average freight velocity for trains in the corridor.
On-Time-Performance # 2015 average of all passenger trains that arrived within 15 minutes of
their scheduled arrival.
125,000
175,000
225,000
275,000
325,000
375,000
FY14 FY15
Ridership
Newport News Norfolk Richmond
65%
70%
75%
80%
FY 2014 FY 2015
On-Time Performance
Newport News Norfolk Richmond
0
20,000
40,000
60,000
80,000
100,000
120,000
2010 2011 2012 2013 2014 2015
Corridor Performance
Rai
l car
s
Rail Enhancement Fund User’s Manual 25
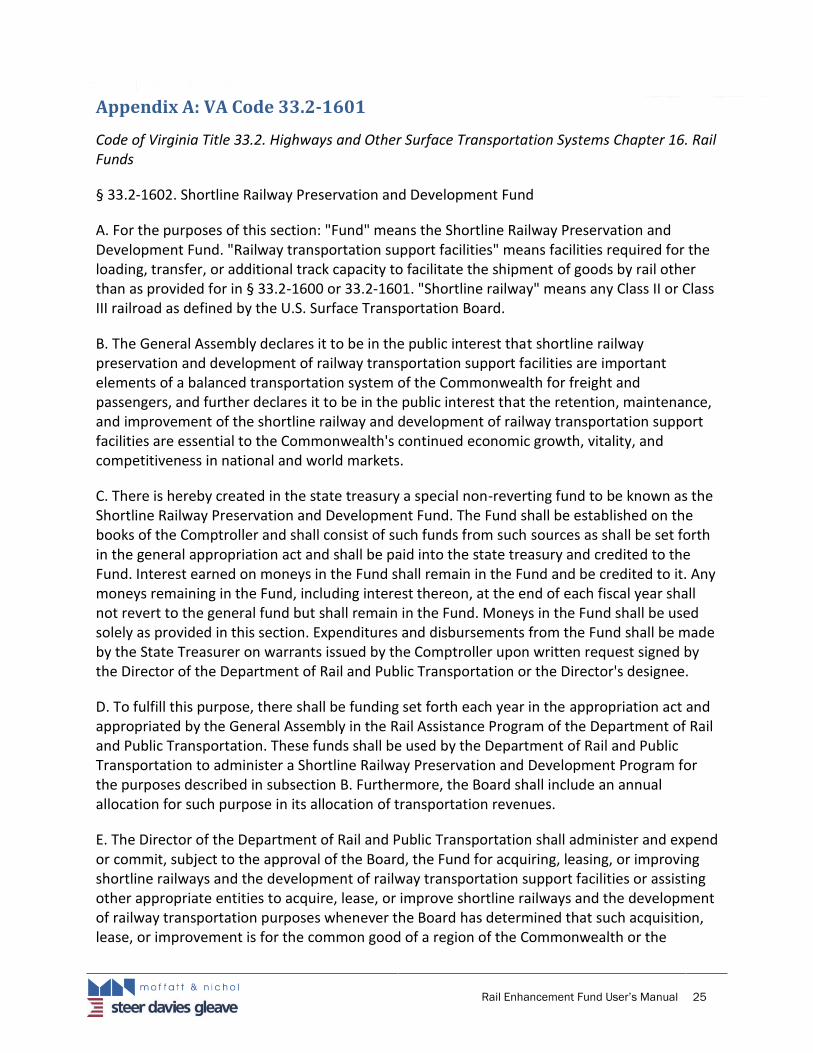
Appendix A: VA Code 33.2-1601
Code of Virginia Title 33.2. Highways and Other Surface Transportation Systems Chapter 16. Rail Funds
§ 33.2-1602. Shortline Railway Preservation and Development Fund
A. For the purposes of this section: "Fund" means the Shortline Railway Preservation and Development Fund. "Railway transportation support facilities" means facilities required for the loading, transfer, or additional track capacity to facilitate the shipment of goods by rail other than as provided for in § 33.2-1600 or 33.2-1601. "Shortline railway" means any Class II or Class III railroad as defined by the U.S. Surface Transportation Board.
B. The General Assembly declares it to be in the public interest that shortline railway preservation and development of railway transportation support facilities are important elements of a balanced transportation system of the Commonwealth for freight and passengers, and further declares it to be in the public interest that the retention, maintenance, and improvement of the shortline railway and development of railway transportation support facilities are essential to the Commonwealth's continued economic growth, vitality, and competitiveness in national and world markets.
C. There is hereby created in the state treasury a special non-reverting fund to be known as the Shortline Railway Preservation and Development Fund. The Fund shall be established on the books of the Comptroller and shall consist of such funds from such sources as shall be set forth in the general appropriation act and shall be paid into the state treasury and credited to the Fund. Interest earned on moneys in the Fund shall remain in the Fund and be credited to it. Any moneys remaining in the Fund, including interest thereon, at the end of each fiscal year shall not revert to the general fund but shall remain in the Fund. Moneys in the Fund shall be used solely as provided in this section. Expenditures and disbursements from the Fund shall be made by the State Treasurer on warrants issued by the Comptroller upon written request signed by the Director of the Department of Rail and Public Transportation or the Director's designee.
D. To fulfill this purpose, there shall be funding set forth each year in the appropriation act and appropriated by the General Assembly in the Rail Assistance Program of the Department of Rail and Public Transportation. These funds shall be used by the Department of Rail and Public Transportation to administer a Shortline Railway Preservation and Development Program for the purposes described in subsection B. Furthermore, the Board shall include an annual allocation for such purpose in its allocation of transportation revenues.
E. The Director of the Department of Rail and Public Transportation shall administer and expend or commit, subject to the approval of the Board, the Fund for acquiring, leasing, or improving shortline railways and the development of railway transportation support facilities or assisting other appropriate entities to acquire, lease, or improve shortline railways and the development of railway transportation purposes whenever the Board has determined that such acquisition, lease, or improvement is for the common good of a region of the Commonwealth or the

Rail Enhancement Fund User’s Manual 26
Commonwealth 1 8/28/2016 as a whole. The Director of the Department of Rail and Public Transportation may consult with other agencies or their designated representatives concerning projects to be undertaken under this section.
F. Tracks and facilities constructed, and property and equipment purchased, with funds under this section shall be the property of the Commonwealth for the useful life of the project, as determined by the Director of the Department of Rail and Public Transportation, and shall be made available for use by all common carriers using the railway system to which they connect under the trackage rights agreements between the parties. Projects undertaken pursuant to this section shall be limited to those of a region of the Commonwealth or the Commonwealth as a whole. Such projects shall include a minimum of 30 percent cash or in-kind matching contribution from a private source, which may include a railroad, a regional authority, private industry, a local government source, or a combination of such sources. No single project shall be allocated more than 50 percent of total available funds.
2006, c. 856, § 33.1-221.1:1.2; 2014, c. 805
§ 33.2-1602. Shortline Railway Preservation and Development Fund. Lawlisvirginiagov. 2016.Available at: http://law.lis.virginia.gov/vacode/title33.2/chapter16/section33.2-1602/. Accessed August 28, 2016.
Rail Enhancement Fund User’s Manual 27
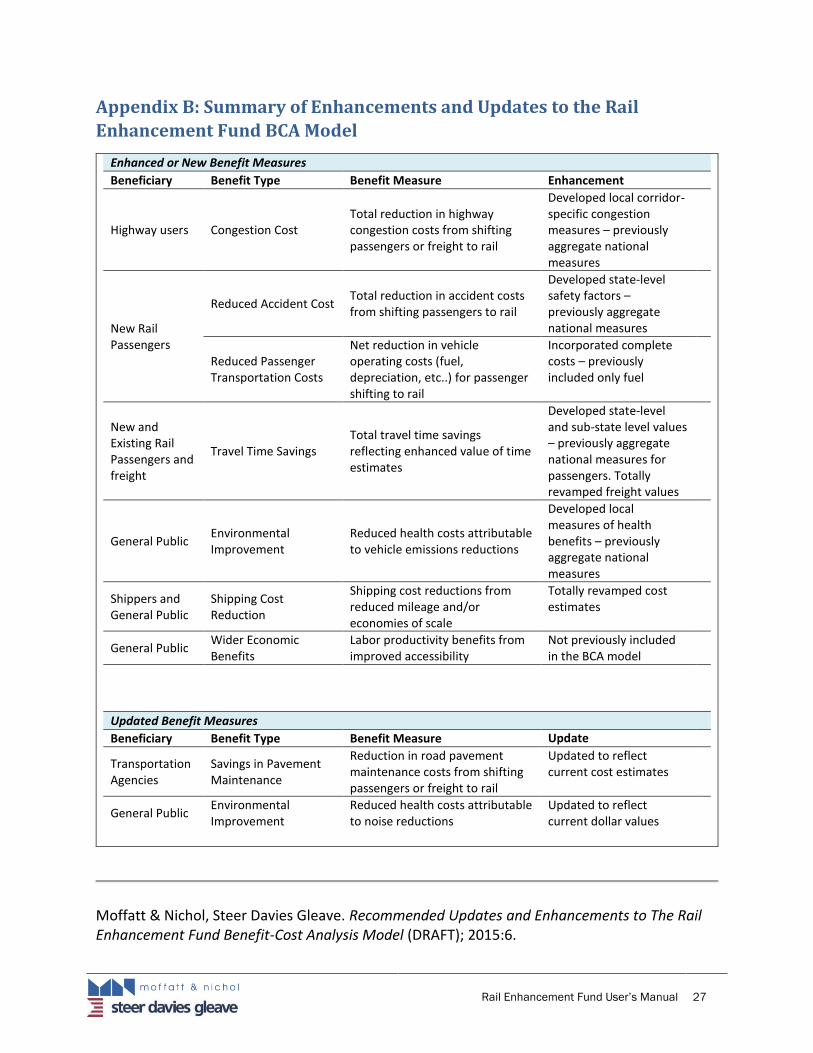
Appendix B: Summary of Enhancements and Updates to the Rail
Enhancement Fund BCA Model
Enhanced or New Benefit Measures
Beneficiary Benefit Type Benefit Measure Enhancement
Highway users Congestion Cost Total reduction in highway congestion costs from shifting passengers or freight to rail
Developed local corridor-specific congestion measures – previously aggregate national measures
New Rail Passengers
Reduced Accident Cost Total reduction in accident costs from shifting passengers to rail
Developed state-level safety factors – previously aggregate national measures
Reduced Passenger Transportation Costs
Net reduction in vehicle operating costs (fuel, depreciation, etc..) for passenger shifting to rail
Incorporated complete costs – previously included only fuel
New and Existing Rail Passengers and freight
Travel Time Savings Total travel time savings reflecting enhanced value of time estimates
Developed state-level and sub-state level values – previously aggregatenational measures for passengers. Totally revamped freight values
General Public Environmental Improvement
Reduced health costs attributable to vehicle emissions reductions
Developed local measures of health benefits – previously aggregate national measures
Shippers and General Public
Shipping Cost Reduction
Shipping cost reductions from reduced mileage and/or economies of scale
Totally revamped cost estimates
General Public Wider Economic Benefits
Labor productivity benefits from improved accessibility
Not previously included in the BCA model
Updated Benefit Measures
Beneficiary Benefit Type Benefit Measure Update
Transportation Agencies
Savings in Pavement Maintenance
Reduction in road pavement maintenance costs from shifting passengers or freight to rail
Updated to reflect current cost estimates
General Public Environmental Improvement
Reduced health costs attributable to noise reductions
Updated to reflect current dollar values
Moffatt & Nichol, Steer Davies Gleave. Recommended Updates and Enhancements to The Rail Enhancement Fund Benefit-Cost Analysis Model (DRAFT); 2015:6.

Rail Enhancement Fund User’s Manual 28
Appendix C: Beneficiaries of and Factors used to calculate Model
Benefits
Rail Enhancement Fund User’s Manual 29
Rail Enhancement Fund User’s Manual 30
Rezvani A, Mindick-Walling A, Homer P, Burke E. CTB Rail Programs Review & BCA Overhaul. 2016.

Use Term Recommended Sources Source Location Selection Reason Update Frequency
USDOT, FHWA, Freight Analysis Framework (2012) http://ops.fhwa.dot.gov/FREIGHT/freight_analysis/faf/index.htm
Public Waybill Sample http://www.stb.dot.gov/stb/industry/econ_waybill.html
USDOT, FHWA, Freight Analysis Framework (2012) http://ops.fhwa.dot.gov/FREIGHT/freight_analysis/faf/index.htm
VDOT, Investigation of Speed‐Flow Relations and Estimation of Volume Delay Functions for Travel Demand Models in Virginia (2009)
http://trbappcon.org/2009conf/TRB2009presentations/s12/TRB_App_Conf_12_100_Lee_Munn_0519_2009.ppt
An Analysis of the Operational Costs of Trucking: A 2014 Update (ATRI)
http://www.atri‐online.org/wp‐content/uploads/2014/09/ATRI‐Operational‐Costs‐of‐Trucking‐2014‐FINAL.pdf
2013 American Community Survey (BLS) http://www.bls.gov/news.release/pdf/ecec.pdf
Truck Noise pollution cost TIGER IV (National Average) https://www.transportation.gov/sites/dot.gov/files/docs/TIGER%20BCA%20Resource%20Guide%202014.pdf ‐Industry Best Practice Annual
US Department of Environmental Protection: Motor Vehicle Emission Simulator (MOVES2014a)
http://www3.epa.gov/otaq/models/moves/
Muller and Mendelsohn, "Measuring the Damages of Air Pollution in the United States" (2007)
‐ Not easily accessible
Train Air PollutionEPA ‐ "Regulatory Impact Analysis: Control of Emissions of Air Pollution from Locomotive Engines and Marine Compression Engines Less than 30 Liters per Cylinder" (2008)
http://nepis.epa.gov/Exe/ZyPURL.cgi?Dockey=P10024CN.TXT
‐ Use of a more up‐to‐date source‐ EPA source values consistent with truck air pollution‐Publicly Available‐ Industry Best Practice
Survey for new research every 5 years
Noise pollution cost per train ton mile
Forkenbrock (2001) http://nexus.umn.edu/Courses/ce8214/papers/Forkenbrock2001.pdf‐ Available Industry Practice‐Publicly Available
Survey for new research every 5 years
Shipping rate per train ton mile
Association of American Railroads (2013) https://www.aar.org/data‐center‐ Best Industry Practice‐Publicly Available
Annual
Shipping rate per truck ton mile
DAT Solutions, DAT Trendlines, Southeast Regional Van Rates, (Spring 2015)
http://www.dat.com/resources/trendlines‐ Use of a more up‐to‐date source‐ Regional values‐ Publicly Available
Annual
Pavement maintenance cost per truck mile
USDOT, Addendum to the FHCA Study, 2000 http://www.fhwa.dot.gov/policy/hcas/addendum.cfm ‐ Industry PracticeSurvey for new research every 5 years
Virginia DMV, Accident, Fatality and Injury Frequency (2014) http://www.dmv.state.va.us/safety/#crash_data/crash_facts/index.asp
TIGER IV (Values for Crashes and Injuries) https://www.transportation.gov/sites/dot.gov/files/docs/TIGER%20BCA%20Resource%20Guide%202014.pdf
Accident cost per freight train ton mile
Forkenbrock (2001) http://nexus.umn.edu/Courses/ce8214/papers/Forkenbrock2001.pdf‐ Best Industry Practice‐ Publicly Available
Survey for new research every 5 years
VDOT, Rail Crossing Injuries (2010‐2015) http://www.virginiadot.org/sitemap/default.asp
TIGER IV https://www.transportation.gov/sites/dot.gov/files/docs/TIGER%20BCA%20Resource%20Guide%202014.pdf
FRA Office of Safety, Accident Reports (2010‐2015) http://safetydata.fra.dot.gov/officeofsafety/default.aspx
Accident cost per rail crossing removed
‐ Use of a more up‐to‐date source‐ Publicly Available‐ Virginia Specific values‐ Industry Best Practice
Annual
Truck Air Pollution‐ Use of a more up‐to‐date source‐ Moves 2014 is specific to metropolitan and rural areas
Survey for new research every 5 years
Accident cost per truck VMT
‐ Use of a more up‐to‐date source‐ Publicly Available‐ Virginia Specific values‐ Industry Best Practice
Annual
Freight
Trucks per Rail Car
‐Publicly Available‐ Virginia Specific values‐ Industry Best Practice
Annual
Congestion cost
‐ Corridor Level Values‐ Publicly Available‐ Virginia specific values for passenger and freight value of time‐ Clear separation of Urban and Rural based on highway characteristics‐ Industry Best Practice
Annual
Rail Enhancement Fund User’s Manual 35
Appendix D: Source Information

Use Term Recommended Sources Source Location Selection Reason Update Frequency
Vehicle occupancy rate 2009 NHTS VA add‐on survey http://nhts.ornl.gov/2009/pub/usersguidev2.pdf‐ Publicly Sourced Data‐ Use of a more up‐to‐date source‐ Virginia Specific values
Survey for new research every 5 years
USDOT, FHWA, Freight Analysis Framework (2012) http://ops.fhwa.dot.gov/FREIGHT/freight_analysis/faf/index.htm
VDOT, Investigation of Speed‐Flow Relations and Estimation of Volume Delay Functions for Travel Demand Models in Virginia (2009)
http://trbappcon.org/2009conf/TRB2009presentations/s12/TRB_App_Conf_12_100_Lee_Munn_0519_2009.ppt
An Analysis of the Operational Costs of Trucking: A 2014 Update
http://www.atri‐online.org/wp‐content/uploads/2014/09/ATRI‐Operational‐Costs‐of‐Trucking‐2014‐FINAL.pdf
2013 American Community Survey http://www.bls.gov/news.release/pdf/ecec.pdf
Virginia DMV, Accident, Fatality and Injury Frequency (2014) http://www.dmv.state.va.us/safety/#crash_data/crash_facts/index.asp
TIGER IV (Values for Crashes and Injuries) https://www.transportation.gov/sites/dot.gov/files/docs/TIGER%20BCA%20Resource%20Guide%202014.pdf
USDOT Bureau of Transportation Statistics 2015 http://www.rita.dot.gov/bts/sites/rita.dot.gov.bts/files/publications/national_transportation_statistics/index.html
TIGER IV (Values for Crashes and Injuries) https://www.transportation.gov/sites/dot.gov/files/docs/TIGER%20BCA%20Resource%20Guide%202014.pdf
VDOT, Rail Crossing Injuries (2010‐2015) http://www.virginiadot.org/sitemap/default.asp
TIGER IV https://www.transportation.gov/sites/dot.gov/files/docs/TIGER%20BCA%20Resource%20Guide%202014.pdf
FRA Office of Safety, Accident Reports (2010‐2015) http://safetydata.fra.dot.gov/officeofsafety/default.aspx
Vehicle operating cost AAA, Your driving costs 2015 http://exchange.aaa.com/wp‐content/uploads/2015/04/Your‐Driving‐Costs‐2015.pdf‐ Use of a more up‐to‐date source‐ Publicly Available‐ Industry Best Practice
Annual
Amtrak https://www.narprail.org/our‐issues/ridership‐statistics/
VRE http://www.vre.org/service/rider/consist/
Weighted average value of time
Census Bureau http://factfinder.census.gov/faces/nav/jsf/pages/index.xhtml
‐ Use of a more up‐to‐date source‐ Virginia Specific (Regional and Corridor) Values‐ Publicly Available‐ Industry Best Practice
Annual
US Department of Environmental Protection: Motor Vehicle Emission Simulator (MOVES2014a)
http://www3.epa.gov/otaq/models/moves/
Muller and Mendelsohn, "Measuring the Damages of Air Pollution in the United States" (2007)
‐ Not easily accessible
Noise pollution cost per VMT
Federal Highway Cost Allocation Study (2000) (National Averages)
http://www.fhwa.dot.gov/policy/hcas/addendum.cfm‐ Industry Best Practice‐ Publicly Available
Survey for new research every 5 years
Air pollution cost per train mile
EPA ‐ "Regulatory Impact Analysis: Control of Emissions of Air Pollution from Locomotive Engines and Marine Compression Engines Less than 30 Liters per Cylinder" (2008)
http://nepis.epa.gov/Exe/ZyPURL.cgi?Dockey=P10024CN.TXT
‐ Use of a more up‐to‐date source‐ EPA source values consistent with truck air polution‐Publicly Available‐ Industry Best Practice
Survey for new research every 5 years
Noise pollution cost per train mile
2014 California High‐Speed Rail Benefit Cost Analysis (2014 Statewide Value)
http://www.hsr.ca.gov/docs/about/business_plans/BPlan_2014_Sec_7_CaHSR_Benefit_Cost_Analysis.pdf‐ Most recent US based report on train noise pollution‐ Publicly Available
Survey for new research every 5 years
Pavement maintenance cost per vehicle mile
Federal Highway Cost Allocation Study (2000) http://www.fhwa.dot.gov/policy/hcas/addendum.cfm‐ Industry Best Practice‐ Publicly Available
Survey for new research every 5 years
Air pollutant emission‐ Use of a more up‐to‐date source‐ Moves 2014 is specific to metropolitan and rural areas‐ Not easility accessible
Survey for new research every 5 years
Accident cost per rail crossing
‐ Use of a more up‐to‐date source‐ Publicly Available‐ Virginia Specific values‐ Industry Best Practice
Annual
Fare per passenger mile (Amtrak/VRE)
‐ Use of a more up‐to‐date source‐ Publicly Available‐ Industry Best Practice
Annual
Accident cost per vehicle mile
‐ Use of a more up‐to‐date source‐ Publicly Available‐ Virginia Specific values‐ Industry Best Practice
Annual
Accident cost per train passenger mile
‐ Use of a sourced value‐ Publicly Available‐ Virginia Specific values‐ Industry Best Practice
Annual
Passen
ger
Congestion cost
‐ Corridor Level Values‐ Publicly Available‐ Virginia specific values for passenger and freight value of time‐ Clear separation of Urban and Rural based on highway characteristics‐ Industry Best Practice
Annual
Rail Enhancement Fund User’s Manual 36

Rail Enhancement Fund User’s Manual 31
Appendix E
All route lengths should be averages of those traveled in Virginia.
Highway Corridors
Project Location Direction of Freight Travel Corresponding Highway Corridor
Rail Enhancement Fund User’s Manual 32
Appendix F: Route Length Sketch
All route lengths should be averages of those traveled in Virginia.
Freight Rail Route Length, Current Freight Rail Route Length, After Project Truck Route Length, Current and After
Route Lengths
Pro
po
sed
Ro
ute
Aft
er C
on
stru
ctio
n

Rail Enhancement Fund User’s Manual 33
Appendix G: Summary Sheet