analysis of public expenditures in support of food and
TRANSCRIPT

ANALYSIS OF PUBLIC EXPENDITURES IN SUPPORT OF FOOD AND AGRICULTURE DEVELOPMENT
IN BURKINA FASO 2006-2010
JANUARY 2013
This technical note is a product of the Monitoring African Food and Agricultural Policies project (MAFAP). It is a technical document intended primarily for internal use as background for the eventual MAFAP Country Report. This technical note may be updated as new data becomes available.
MAFAP is implemented by the Food and Agriculture Organization of the United Nations (FAO) in collaboration with the Organisation for Economic Co-operation and Development (OECD) and national partners in participating countries. It is financially supported by the Bill and Melinda Gates Foundation, the United States Agency for International Development (USAID), and FAO.
The analysis presented in this document is the result of the partnerships established in the context of the MAFAP project with governments of participating countries and a variety of national institutions.
For more information: www.fao.org/mafap
Suggested citation:
Yameogo S., Kienou A., 2013. Analysis of public expenditures in support of food and agriculture development in Burkina Faso, 2006-2010. Technical notes series, MAFAP, FAO, Rome.
© FAO 2013
FAO encourages the use, reproduction and dissemination of material in this information product. Except where otherwise indicated, material may be copied, downloaded and printed for private study, research and teaching purposes, or for use in non-commercial products or services, provided that appropriate acknowledgement of FAO as the source and copyright holder is given and that FAO’s endorsement of users’ views, products or services is not implied in any way.
All requests for translation and adaptation rights, and for resale and other commercial use rights should be made via www.fao.org/contact-us/licence-request or addressed to [email protected].
FAO information products are available on the FAO website (www.fao.org/publications) and can be purchased through [email protected].
2

Contents CONTENTS ....................................................................................................................................................... 3
ACRONYMS ...................................................................................................................................................... 4
SUMMARY ....................................................................................................................................................... 5
1. PURPOSE OF THE PAPER .............................................................................................................................. 6
2. ECONOMIC AND POLICY CONTEXT: AGRICULTURE, POVERTY AND PUBLIC EXPENDITURES IN BURKINA FASO ................................................................................................................................................ 6
3. ANALYSIS OF PUBLIC EXPENDITURES FOR FOOD AND AGRICULTURE IN BURKINA FASO ........................ 12
General trends in the global budget .......................................................................................................... 13
General trends in public expenditures for food and agriculture ............................................................... 13
Composition of public expenditures for food and agriculture .................................................................. 16
Public expenditures specific to the agricultural sector ............................................................................. 17
Public expenditures in support of agriculture ........................................................................................... 19
Nature of public expenditures for the food and agriculture sector .......................................................... 23
Types of public expenditures for the food and agriculture sector ............................................................ 24
Role of development aid in public expenditures for the food and agriculture sector Burkina Faso ........ 25
Conclusions and recommendations........................................................................................................... 28
REFERENCES .................................................................................................................................................. 30
ANNEX 1. SUMMARY OF MAIN METHODOLOGICAL CONCEPTS ................................................................... 31
ANNEX 2. MAFAP PUBLIC EXPENDITURE ANALYSIS AND EXISTING WORK ON PUBLIC EXPENDITURE REVIEWS ........................................................................................................................................................ 34
3
ACRONYMS CDMT : Cadre de dépenses à moyen terme
COMFIB : Commission des Finances et du Budget
CSLP : Cadre Stratégique de lutte contre la pauvreté
DCPE : Documents-cadre de politique économique
DGB : Direction Générale du Budget
DGCOOP : Direction Générale de la coopération
DGEP : Direction Générale de l’Economie et de la Planification
FASR : Facilité d'ajustement structurel renforcée
FMI : Fonds monétaire international
FRPC : Facilité pour la réduction de la pauvreté et la croissance
IADM : Initiative d'allègement de la dette multilatérale
MEF : Ministère de l’économie et des finances
OMD : Objectifs du millénaire pour le développement
ORD : Organismes régionaux de développement
PAP : Programme d'Actions prioritaires
PAS : Politiques d’ajustements structurels
PIP : Programme d'investissement public
PPD : Programme populaire de développement
PQDP : Plan quinquennal de développement populaire
RMH : Revenu moyen par habitant
SCADD : Stratégie de croissance accélérée et de développement durable
SPAAA : Projet de Suivi des politiques agricoles et alimentaires en Afrique
UEMOA : Union économique et monétaire ouest africaine
4

Summary The share of total budget approved for agriculture in Burkina Faso increased from 170.6 billion FCFA to 187.1 billion FCFA over the period 2006-2010, marking an overall rise of 2%. However, notable declines were recorded of 6 and 7% respectively, between 2007 and 2008 and between 2009 and 2010. Disbursements increased from 144.7 billion FCFA in 2006 to 153.9 billion FCFA in 2010, representing a rise of 6%. Of this total, more than 80% of expenditure was for investments.
The share of the overall budget allocated to agriculture underwent a constant decline during the period 2006-2010. However, it remains well above the 10% threshold recommended by the declaration of African heads of state in Maputo.
Public expenditure on agriculture is dominated by payments to producers-input subsidies (38%), spending on infrastructure (20%), and spending on training (15%). By contrast, very small percentages are spent on marketing (3%), storage (0%), inspection (1%), extension (3%), technical assistance (1%) and agricultural research (6%).
Public expenditure in support of agriculture was mainly dominated by spending on rural infrastructure (41%) and education (36%) for the period 2006-2010.
Public expenditure on agriculture brought, above all, cross-cutting support to all products representing 73.2% of total spending in 2010. The share of spending to support commodity groups saw a regular increase between 2006 (8.7%) and 2009 (21.5%). Spending to support individual products reached its highest level in 2006, with a figure of 43.8%, followed by a decline in 2007 and 2009 with, respectively, shares of 18.1% and 6.6%. The share improved in 2010, when it reached 11.7%
Development aid to the agriculture sector increased from 71 to 109 billion FCFA, with a peak in 2009. Over the period 2006-2010, the share of external financing, made up of an average 54.2% in loans, accounted for an average of 73% of total public expenditure on agriculture.
5

1. Purpose of the paper The Monitoring African Food and Agricultural Policies (MAFAP) project intends to help African policy-makers and other stakeholders ensure that policies and investments are fully supportive of agricultural development, the sustainable use of natural resources and enhanced food security.
It aims to support decision-making at national, regional and pan-African levels, and thereby contribute to the Comprehensive Africa Agriculture Development Programme (CAADP) of the New Partnership for Africa Development (NEPAD). For this, the MAFAP project will develop a system for monitoring food and agricultural policies in Africa. Central to this system will be the production of a triennial monitoring report and in-depth studies for an increasing number of countries. The reports will contain indicators and analysis of value to key stakeholders, including national governments and development partners. These indicators will provide quantitative information on agricultural policies, including market interventions and budgetary expenditures, and will measure the scale of development challenges faced by the agricultural sector. The proposed indicators and analysis will help inform decision-making in two key areas. First, how can food and agricultural policies best address the country’s policy objectives with respect to development, food security, poverty reduction and natural resource use? And second, how can aid and public expenditures most effectively target areas where the need is greatest and potential returns are highest? The information produced will feed into national decision-making processes and mechanisms for policy dialogue at the pan-African and regional level, as well as with donors and other stakeholders.
This paper focuses on the analysis related to the pillar of the project on budgetary expenditures in support of food and agriculture sector development and its aim is to provide a preliminary assessment of public expenditures in support of food and agriculture sector development in Burkina Faso. It is based on initial data collected by MAFAP partners in Burkina Faso from the Rural Economics Division of the Ministry of Agriculture (DGPER), with the assistance of the Budget Division (DGB) and Cooperation Division (DGCOOP).
2. Economic and policy context: agriculture, poverty and public expenditures in Burkina Faso State of the agricultural sector in Burkina Faso
During the past decade, the economy of Burkina Faso has seen considerable growth, but this remains insufficient to bring about a significant reduction in poverty, given the country’s high population growth. The agriculture sector is performing well, with a 9% growth rate of agricultural GNP in 2010 (MEF/IAP, 2012). As such, it has made a major contribution to national economic growth, notwithstanding the mining boom. Indeed, gold has become one of the country’s main exports. In 2009, agriculture contributed to 35.3% of GNP and accounted for more than 37% of national exports (MEF/IAP 2012, FAOSTAT 2012). Agricultural activity remains extensive, dominated (72%) by small-scale farms of less than 5 ha in 2008 (MEF/IAP, 2012).
Agricultural production is dominated by cereals and cotton, and dry cereals and rice are the main foods consumed (DGPER, 2010). Cotton aside, to which the government has dedicated special attention for a number of years, commodity sectors are poorly structured. They face trade challenges linked to insufficient integration of the agricultural economy into the sub-regional and global market,
6

and to an inadequate communications network (rural roads). Organizing rural areas remains a cause for concern for the government. Farms also face constraints of poor access to inputs, low levels of equipment and problems of finance. In 2008, just 0.2% of farms were estimated to use a tractor (DGPER, 2011). Several promising sectors have been identified and their development should encourage diversification and a higher value added component for the sector, as a way of increasing revenues for farmers. In addition, there is good scope offered by, amongst other features, the availability of agricultural land, the potential for irrigation, significant herds of livestock and the young average age of the population, all factors that promise a bright future for the agricultural sector.
However, poverty levels remain high with 43.9% of households living below the poverty threshold in 2009. It is estimated that 72.56% of the population lives on less than two US dollars a day (INSD, 2010; World Bank, 2012). This poverty has an even greater impact on rural communities where the incidence of poverty rises to 50.7%, compared with 19.9% in urban areas (INSD, 2010). Levels of income inequality are falling, but they remain high. Youth unemployment levels are high, especially in urban areas. It has reached 15.7% for 20 to 24 year-olds, while the national average is only 2.4% (INSD, 2010). Such precarious conditions often cause social unrest. According to data gathered during the general census of 2006, internal migration is increasing, especially the rural exodus, and migration flows to neighbouring countries are significant.
Major political strategies for agricultural and rural development and policy priorities
Since the Structural Adjustment Programmes (SAP) in the 1990s, Burkina Faso has made considerable progress in improving its macroeconomic management. Important features have been a consolidation of public finance, progressive liberalization of the economy, government withdrawal from certain production sectors and the adoption of a number of development and poverty reduction strategies. These efforts have encouraged a flow of foreign capital into the economy and an improvement in economic growth.
The agriculture sector was in the frontline of reforms, due to the important role that it plays in the national economy. A number of agricultural policies and strategies have been adopted and implemented, with significant amounts of public investment public.
During the 1990s, the government set up an Agricultural Sector Adjustment Programme (ASAP). This programme has led to trade liberalization for agricultural products, the privatization of agro-industrial enterprises, reorganization and support for Business Services Development (SDA), the privatization of all state controlled companies operating in the production, processing and marketing of agricultural products and the ending of subsidies for farm inputs.
Following the liberalization of the economy as part of ASAP and the adoption of conventions made at the Rio summit, ministerial departments in charge of rural development developed policy documents and sectoral strategies between 1995 et 2003. The principal ones are listed here:
Strategic Policy Document to work for sustainable growth for the agriculture and livestock sectors,
Strategic Operating Plan (PSO) to work for sustainable growth for the agriculture sector, Action Plan and Investment Programme for Livestock Sector (PAPISE),
7

National Forestry Policy (PFN), National Strategy for Food Security, National Water Policy (PNE), National Strategy and Action Plan for Biodiversity, National Programme of Action for Climate Change Adaptation, National Programme of Action Against Desertification, National Strategy for Environmental Education.
In December 2002, the government adopted a Policy Letter for Decentralized Rural Development (LPDRD) which aims to offer an umbrella framework and harmonize the methods and approaches of different projects and programmes targeting development for grassroots rural communities.
The Strategic Framework for Poverty Reduction (CSLP), drawn up in 2000 and revised in 2003, mentions that the government’s goal is to stimulate growth in the agriculture sector by creating, on the one hand, a more favourable economic climate for private investment (especially in the fields of production, marketing and industrial processing) and the development of small and medium enterprises in rural areas and in areas where poverty is endemic, and, on the other hand, a biophysical environment favourable to rapid growth. In an effort to translate the CSLP objectives into concrete action, the government adopted, in 2003, a Rural Development Strategy (SDR), aimed at achieving sustainable growth for the agriculture sector as a means of ensuring greater food security and promoting real rural development. The main objectives of the SDR are to:
• Increase agricultural, pastoral, forestry, animal and fisheries output through improvements in productivity;
• Increase revenues through diversification of economic activities in rural areas; • strengthen production/market linkage; • ensure sustainable management for natural resources; • improve the economic position and social standing of women and young people in rural
areas; • help rural communities to have a greater sense of responsibility as actors for
development.
The Strategy for Accelerated Growth and Sustainable Development (SCADD 2011-2015) was adopted in December 2010, to replace the CSLP. Its aim is to «achieve strong sustainable and quality economic growth (10% par year), that will generate multiple impacts in improving revenues and living standards for people and will respect the principle of sustainable development».
If these objectives were to be realized, it would be possible to achieve the Millennium Development Goals (MDG), and bring poverty levels down to less than 35% in 2015. SCADD foresees a significant level of contribution of the rural sector to the national economy, with a specific target of achieving an average growth rate of 10.7% over five years (2011-2015). For this purpose, the Rural Sector National Programme (PNSR) is in the process of being finalized, in conjunction with SCADD and the regional agriculture policy for ECOWAS (ECOWAP/PDDAA).
8

Figure 1. Strategic frameworks and operational programmes for agricultural policy in Burkina Faso
Source: Authors of policy documents
Current policy priorities and political environment
Given the predominant contribution of agriculture to the economy of Burkina Faso and its strategic role in promoting food security and poverty reduction, the government is planning to highlight this sector, notably by promoting areas of growth and development for promising sectors that could help to accelerate economic growth.
In an attempt to achieve strong economic growth of an annual 10% by 2015, SCADD is expecting an average 10.7% growth rate from the agriculture sector. To achieve this objective, the government has decided to identify promising sectors where support will be needed for development. The products selected are:
− oilseeds offering export potential on attractive international markets; − cereals and cowpeas, whose export potential lies mostly in West African markets; − fruits and vegetables, whose potential lies in both sub-regional and international markets; − livestock products (meat, hides and skins) with export potential in both regional and
international markets; − milk and dairy products, for which the domestic market alone is calculated at almost 10
billion FCFA per year.
The government’s vision and priorities for the agriculture sector for the period 2011-2015 are stated in the National Programme for the Rural Sector (PNSR). The PNSR is the benchmark framework for guidelines, planning, implementation and monitoring and evaluation of public and private interventions in areas of rural development, agriculture, water, fisheries resources, animal resources, the environment and living conditions. The programme is part of a vision described as follows:
9

«By 2025, agriculture in Burkina Faso will be modern, competitive, sustainable and an engine of growth, founded on household farms and effective agricultural enterprises and ensuring all people of Burkina Faso have access to the food they need to lead active healthy lives ».
This vision was drafted from the conclusions of the national conference on agriculture and food security (EGASA) held in November 2011. The PNSR envisages ambitious investments in the development of 17,000 ha of irrigated land, 35,000 ha of lowlands and the rehabilitation of some 1,500 ha of irrigated land.
The organization of the rural sector is one of the government’s most pressing current concerns. With the aim of improving the structure of sectors in Burkina Faso, a law on commodity associations is in the process of being adopted. The idea is to provide commodity associations with a legal framework which will enable them to play a full role in the emergence of promising agricultural sectors (proceedings of Council of Ministers, 28 March, 2012).
A major construction project under way for the agriculture sector is the building of the Samendéni dam in Ouest province. This is part of the Integrated Development Programme for the Samendéni Valley (PDIS), with a total cost of more than 181 billion FCFA.
The main objectives of the programme are as follows:
− the construction of a dam with a capacity of 1,050 million m3 of water; − the building of a hydroelectric power plant with an annual output of 16 GWh; − recalibrating riverbed as a feeder channel for irrigation, fisheries and river transport; − irrigation of 21,000 ha of land, of which 1,500 ha in the fist phase of the programme; − development of fisheries and aquaculture with an annual output of 1,100 tonnes from small-
scale fishing; − creation of an agro-industrial village to process and conserve agricultural and fisheries
products; − implementation of an environmental and social management plan.
Elsewhere, the «growth pole» approach is being pursued, with the Bagré Growth Pole project (in the Centre Est region of Burkina Faso). The project has three parts and will cost about 67 billion FCFA. It plans to attract at least three major investors who will each operate on 500 ha of land, alongside small and medium enterprises and small-scale producers who will have the use of 6,000 of land developed with irrigation etc. There are also plans to develop 15,000 ha of uplands, 3,000 ha of lowlands and 3,000 ha of gravity-fed irrigation, all for private investors. Other plans include the construction of an industrial estate, an abattoir, a livestock market, a fish market, 150 km of paved or repaired roads and a 140 km electricity grid to connect production areas. In the long term, the programme envisages the creation of at least 30,000 jobs, a total of 20,000 direct beneficiaries, 30% of them women, and 250,000 indirect beneficiaries. It is estimated that agricultural output should increase by about 157,000 tonnes to 450,000 tonnes and be flanked by an annual 1,250 tonnes of fisheries products and 2,400 tonnes of livestock feed.
10

It should be observed that for this programme to be successful there will need to be a climate of peace and political stability. The project is largely funded by donors. The events of recent years have shown that elections are often a cause of instability (one could cite the cases of Cote d’Ivoire, Senegal, Guinea etc.). There are uncertainties surrounding the progress and outcome of the next presidential election planned for 2015. These various sources of instability often affect the timing or the performance of such programmes and projects and can even be the cause of reluctance or withdrawal on the part of some donors.
11

3. Analysis of public expenditures for food and agriculture in Burkina Faso Public expenditures in agriculture in Burkina Faso have been typically measured taking into account those resources that were expended by agencies specifically responsible for agricultural matters.
All public expenditures that are undertaken in support of food and agriculture sector development were taken into account, financed from the national budget, either central or regional government, regardless of the ministry that implements the policy, and external aid, provided either through local governments or specific projects. They are composed of agriculture-specific expenditures and agriculture-supportive expenditures.
On top of measures for agriculture, agro-forestry, and fisheries measures were also considered. However, certain expenditure focusing on urban areas have been discarded, such as the Bangré Wéogo project, urban development projects, urban health and sanitation etc.
The following analysis uses concepts and definitions described in the MAFAP methodology for measuring public expenditures in support of food and agriculture sector development and its terminology. Those readers who are not familiar with the methodology are invited to refer to MAFAP concept paper available at: www.fao.org/mafap. However, for readers’ convenience, a few main definitions are provided in Box 1, while Annex 1 provides a brief summary of main concepts. Annex 2 offers a comparison of MAFAP public expenditure analysis, World Bank Public Expenditure Reviews and ReSAKSS Public Expenditure Reviews.
Box 1. Main definitions for public expenditure analysis Total public expenditures in support of food and agriculture sector (budget allocations and actualspending) include both policy transfers in support of food and agriculture, referred to as public expenditures in support of food and agriculture sector development, and policy administration costs.
Public expenditures in support of food and agriculture sector development: all public expenditures that are undertaken in support of food and agriculture sector development, financed from the national budget, either central or regional government, regardless of the ministry that implements the policy, and external aid, provided either through local governments or specific projects conducted by international organisation. They are composed of agriculture-specific expenditures and agriculture-supportive expenditures.
Agriculture-specific expenditures: all public expenditure measures that generate monetary transfers to agricultural agents (producers, consumers, input suppliers, trades, processors and transporters) or the sector as a whole (e.g. in form of research, extension services etc.)
Agriculture-supportive expenditures: public expenditure measures that are not strictly specific to agriculture sector, but that have strong influence on agricultural sector development, such as rural education, rural health or rural infrastructure (energy, water and sanitation, roads etc.)
Support to individual commodities: public expenditures that directly target specific individual commodities such as coffee or tea.
Support to groups of commodities: public expenditures that directly target specific groups of commodities such as crops or livestock.
Support to all commodities: public expenditures that do not target specific individual or groups of commodities, but that benefit any agricultural activity.
12

General trends in the global budget An analysis of the total budget approved for Burkina Faso reveals an almost constant upward trend over the period from 2006 to 2010. During this period, the country’s budget saw an overall increase of 31 percent, rising from 911.96 billion FCFA in 2006 to 1,197 billion FCFA in 2010 (budget legislation 2006, 2007, 2008, 2009 and 2010). Nevertheless, there was a slight decline between 2007 and 2008, with the budget falling from 1,032.6 billion FCFA in 2007 to 1,008.7 billion FCFA in 2008.
Similar trends were observed in levels of actual disbursements, although there was a slight decline in the gap between the approved budget and actual disbursements in 2010 (91 percent).
Figure 2. Development of total budget for Burkina Faso during period 2006-2010 (in billions of FCFA)
Source: Authors, using data from DGB and DGCOOP
General trends in public expenditures for food and agriculture During the period 2006-2010, the approved budget for food and agriculture saw an overall increase of 2 percent, while actual spending for food and agriculture underwent an overall increase of 6 percent. This marks an overall improvement in levels of disbursement, which reached 80 percent in 2006, 2009 and 2010, with an average of 79 percent over the 2006-2010 period. The development could be explained by efforts on the part of the Ministry of the Economy and Finances (MEF) to improve the efficacy of the financial circuit in recent years. In 2007, the level of disbursement was 72 percent and in 2008, it reached a low of 68 percent. The low levels of disbursement observed in 2008 were due to the measures taken in response to the food and financial crises, which led the government to defer all spending that was not considered a priority. But between 2008 and 2010, levels of disbursement improved considerably (increasing from 68 percent in 2008 to 88 percent in 2010), following support measures taken by the government to revive agricultural production in Burkina Faso.
-
200
400
600
800
1,000
1,200
1,400
2,006 2,007 2,008 2,009 2,010
Billi
on F
CFA
Total State budget - approved Total State budget - actual spending
13

Table 1: Total budget for food and agriculture in Burkina Faso: approved budget and actual total expenditure
Types of budget 2006 2007 2008 2009 2010 % variation
Billion FCFA Budget approved 170,6 186,1 174,3 187,1 174,8 2 Spending
144,7 134,6 118,5 150,4 153,9 6
Rate
84,8 72,3 68,0 80,3 88,0 Source: Authors using data from DGB
An analysis of the share of total public expenditure used for the rural and agriculture sector in Burkina Faso indicates that the overall budget allocated to agriculture underwent a regular decline during the period 2006-2010. The share of actual spending on agriculture saw a decline from 2006 to 2009, falling from 18,4 percent to 14,05 percent, before starting to rise slightly, reaching 14,1 percent in 2010. It should also be noted that the Maputo Declaration of 2003, which fixed a goal of 10 percent of the budget for the rural and agriculture sector, was respected in terms of actual disbursements made during the period 2006-2010.
Figure 3. Share of public expenditure for agriculture sector in total budget: approved budget and actual disbursement
Source: Authors
02468
101214161820
2006 2007 2008 2009 2010
Total expenditure in favor of agriculture- approved budget (% of total)
Total expenditure in favor of agriculture- actual spending (% of total)(% of total)
Maputo target
%
14

Table 2: Public expenditure in support of agriculture sector (actual total expenditure)
In millions of FCFA 2006 2007 2008 2009 2010 I. Agriculture specific policies 61 585 48 065 48 995 63 354 76 984
I.1. Payments to agents in the food and agriculture sector 41 401 23 565 27 785 33 553 30 062 I.1.1. Payments to producers 38 807 18 068 23 100 19 444 25 296
B. Input subsidies 29 218 17 737 19 049 18 137 24 404 B1. Variable inputs 3 371 3 465 6 857 4 406 11 298 B2. Capital 24 586 12 549 10 574 12 722 11 538 B3. Farm services 1 261 1 723 1 618 1 009 1 568
C. Revenue support 8 947 0 3 776 0 0 D. Others 642 331 275 1 307 892
I.1.2. Payments to consumers 2 128 4 974 4 439 14 031 4 097
E. Food aid 1 748 1 097 990 4 757 1 525
G. School feeding programmes 296 3 652 3 450 2 411 2 572 H.Others 85 225 0 6 863 0
I.1.3. Payments to input suppliers 150 57 78 12 98
I.1.4. Payments to processors 315 465 168 67 571
I.2. General sector support 20 184 24 500 21 210 29 800 46 922
I. Agricultural research 3 178 2 422 2 923 3 111 4 608
J. Technical assistance 663 616 540 505 653
K. Training 7 659 8 006 7 732 9 337 10 156
L. Extension 926 650 642 1 081 3 936
M. Inspection (veterinary/plant) 210 430 503 816 1 029
N. Infrastructure 6 600 10 605 6 453 10 620 21 694
Roads 1 177 3 931 1 765 2 121 5 403
Irrigation infrastructure 4 897 6 140 3 395 6 620 14 698
Others 527 534 1 292 1 880 1 593
O. Storage/public storage 61 93 78 86 1 025
P. Marketing 196 764 1 966 2 838 2 841
R. Others 691 914 373 1 406 978
II. Policies in support of agriculture 64 263 73 634 51 972 75 092 63 073
S. Education in rural areas 21 958 30 587 22 240 28 064 13 333
T. Health in rural areas 4 078 3 785 3 846 5 545 7 557
U. Rural infrastructure 22 688 37 270 16 790 31 157 28 635
Roads 3 723 21 534 6 844 17 614 9 957
Water and sanitation 15 035 10 697 6 589 10 849 16 829
Energy 1 834 2 080 977 1 295 411
Others 2 095 2 959 2 380 1 399 1 437 V. Others 15 539 1 992 9 095 10 326 13 548
III. Total spending in support of agriculture sector 125 848 121 699 100 967 138 446 140 056
Source: Authors, using data from DGB and DGCOOP
15

Composition of public expenditures for food and agriculture Total public spending for the food and agriculture sector saw a regular decrease in volume between 2006 and 2008, going from 125,8 billion to 100,9 billion. From 2008 to 2010, the sector recorded a rise of 38.7 percent, reaching 140 billion in 2010.. This could be explained by the low level of spending in 2008 and government support measures, especially subsidies for inputs and agricultural equipment, farmer training, the development of irrigated areas and lowlands, etc. Implementation of these measures continued until 2012.
The MAFAP typology for public expenditure for food and agriculture defines two main categories : Agriculture-specific expenditure, whose implementation directly influenced development of
the food and agriculture sector. These mainly involved payments in favour of agents from the food and agriculture sector and spending for general support to the sector (agricultural research, technical assistance, training, extension, inspection, infrastructure, storage, marketing and others).
Public expenditure in support of the agriculture sector when spending is not strictly linked to agriculture, with a considerable impact on development. These mainly involved spending on education, health, rural infrastructure, water and sanitation and energy in rural areas.
There was a predominance of spending on policies in support of agriculture, except in 2010. Indeed, more than 50 percent of public expenditure for the food and agriculture sector consisted of spending in support of the agriculture sector between 2006 and 2009. But agriculture-specific expenditure have been regularly increasing, to reach 53 percent of public expenditure for the food and agriculture sector in 2010.
Figure 2: Composition of public expenditure in support of the agriculture sector in Burkina Faso, 2006-2010
Source: Authors, using data from DGB
0
20
40
60
80
100
120
140
160
2006 2007 2008 2009 2010I.Agriculture-specific expenditure II. Agriculture-supportive expenditure
Billion FCFA
16

Public expenditures specific to the agricultural sector To analyze the composition of agriculture-specific public expenditure, two methods were calculated for the study period (2006-2007 and 2008-2010). During the period 2006-2007, agriculture-specific public spending was dominated by payments to operators in the agrifood sector, consisting of cash transfers to these actors on an individual basis. These were payments to producers, consumers, input suppliers, processors, traders and transporters.
In fact, over the 2006-2007 period, 56 percent of agriculture-specific public spending was allocated to payments on an individual basis to actors in the food and agriculture sector (producers, processors, etc.) and 44 percent were allocated to general support for the agriculture sector, that is to say cash transfers to operators in the agrifood sector on a collective basis (agricultural research, technical assistance, training, extension, inspection, infrastructure, storage, marketing and others).
Agriculture-specific public expenditure was mainly dominated by payments to producers – input subsidies (47 percent), spending on agriculture infrastructure (17 percent) and spending on training (15 percent) during the period 2006-2007. This is in line with certain aspects of parts 1 and 3 of the Strategic Framework for Poverty Reduction (CSLP), namely to spur equity-based growth and to enhance job opportunities and income-generating activities for the poor.
On the other hand, there was a very low level of agriculture-specific public expenditure in the field of marketing (1 percent), storage (0 percent), inspection (1 percent), extension (2 percent), technical assistance (1 percent) and agricultural research (5 percent). Public spending for these sectors fell short of requirements for part 3 of the CSLP, which had identified these as priority areas. Spending levels were low for agricultural research and extension, even though it has been demonstrated that these two spending categories generate more in terms of growth and poverty reduction through gains in productivity (Fan and Zhang, 2008).
Figure 5: Composition of agriculture-specific public spending in Burkina Faso, average 2006-2007
Source: Authors, using data from DGB
Payments to producers - input
subsidies38%
Payments to producers - other
1%
Payments to consumers
10%Payments to
input suppliers
0%
Payments to processors
1%Agricultural research
6%
Technical assistance1%
Training15%
Extension3%
Inspection 1%
Infrastructure20% Storage
0%Marketing
3%Others
1%
17

During the period 2008-2010, agriculture-specific public expenditure was dominated by spending for general support. In fact, spending for general support to the agriculture sector accounted for an average 53 percent of agriculture-specific public expenditure, compared with 47 percent for spending on operators in the food and agriculture sector. This was partly the result of a reduction in input subsidies between the periods 2006-2007 and 2008-2010, and partly due to an increase in support for training and infrastructure, especially infrastructures for irrigation.
These results reveal that input support was significant in the short term, but far less so over the long term. In fact, between 2006 and 2007, the share of agriculture-specific public expenditure allocated to payments to producers – input subsidies was 47 percent, while for the period 2008-2010, this share only accounted for 33 percent.
In terms of composition, agriculture-specific public expenditure was mainly comprised of spending on input subsidies (33 percent), spending on infrastructure (21 percent), training (15 percent) and payments to consumers (12 percent). Support to consumers, at 13 percent, was a significant figure, and this should be seen as a parallel strategy to government efforts to support inputs, evidence of an attempt to use budgetary tools to target both producers and consumers. As in the period 2006-2007, the period 2008-2010 witnessed a very low share of agriculture-specific public expenditure for storage (1 percent), inspection (1 percent), extension (3 percent), technical assistance (1 percent) and agricultural research (6 percent).
Long-term low levels of agriculture-specific public expenditure for storage, inspection, extension, technical assistance and agricultural research may become cause for concern since these sectors play a not insignificant role in agricultural development. Indeed, spending on extension services, inspection, technical assistance and agricultural research services can help farmers to adopt new production techniques that are friendlier to the environment and lead to more gains in productivity.
Figure 63. Composition of agriculture-specific public expenditure in Burkina Faso, average 2008-2010
Source: Authors, using data from DGB
Payments to producers - input
subsidies33%
Paiements aux producteurs -
other1%
Payments to consumers
12%
Payments to input suppliers
0%
Payments to processors
0%
Agricultural research
6%
Technical assistance
1%
Training15%
Extension3%
Inspection 1%
Infrastructure21% Storage
1%Marketing
4%Others
2%
18

Public expenditures in support of agriculture Public spending in support of agriculture includes public expenditure that is not agriculture-specific, but which has a positive impact on the development of the agriculture sector. This spending category covers: (i) funding for education in rural areas, including public spending in support of education in rural areas, (ii) funding for health in rural areas, including public spending in support of health services in rural areas, (iii) funding for rural infrastructure (roads, water, energy, others) which accounts for public spending in support of rural infrastructure, (iv) other public expenditure in support of agriculture for which there is insufficient information to classify it in one of the categories mentioned above.
The analysis, just as it is the case for the agricultural-specific expenditure, compares the 2006-2007 and 2008-2010 periods.
During the period 2006-2007, public expenditure in support of agriculture was mainly dominated by spending on rural infrastructure (43 percent) and education (38 percent). This refers to efforts to tackle illiteracy in rural areas and developing infrastructures (roads, water and sanitation, energy, etc.) to facilitate economic development in rural areas, in line with parts 2 and 3 of the Strategic Framework for Poverty Reduction (CSLP).
Spending on rural infrastructure in Burkina Faso mainly involves spending on infrastructures for water and sanitation, and for road infrastructures. These two types of expenditure are particularly highlighted in an attempt to promote supplies of safe drinking water and sanitation for rural communities and to facilitate trade in agricultural products from food surplus areas to those affected by shortages.
Figure 7. Composition of public expenditure in support of the agriculture sector, average 2006-2007
Source: Authors, using data from DGB
For the period 2008-2010, an almost identical structure was seen for public spending in support of agriculture, which continued to be dominated by spending on rural infrastructure (40 percent), education (34 percent) and others (17 percent). But during this period there was a relative decline in
Education38%
Health6%
Infrastructure -roads18%
Infrastructure -water and sanitation
18%
Infrastructure -energy
3%
Infrastructure -others
4%
Others13%
19

spending on rural infrastructure and education, compared with the period 2006-2007. By contrast, spending on health increased, rising to 9 percent, compared with 5 percent for the period 2006-2007.
The «others» category, which groups together measures to support agriculture for which there was insufficient information, also increased, rising from 13 percent to 17 percent between the period 2006-2007 and the period 2008-2010. Our analysis of the structure of public spending in support of agriculture could change if it were possible to move some projects and programme from this category into other categories for public spending in support of agriculture. It is therefore important that additional information is made available, so as to be able to place these measures in the appropriate spending categories.
Figure 8. Composition of public expenditure in support of the agriculture sector, average 2008-2010
Source: Authors, using data from DGB
The study also made it possible to offer a breakdown of public spending in support of agriculture, based on the products to which it was destined1. Three categories of public spending have been identified:
- Support for all commodities - Support for a given group of commodities (for example fruit and vegetables, livestock,
horticulture, etc.) - Support for individual commodities (rice, sorghum, sesame, etc.)
This breakdown shows a clear predominance for spending to support all commodities. During the period 2006-2010, the share of spending to support all commodities exceeded 63 percent,
1Spending described in this section is that which the present study has been able to classify, according to commodity or commodity group to which it was allocated.
Education34%
Health9%
Infrastructure -roads18%
Infrastructure -water and sanitation
18%
Infrastructure - energy
1%
Infrastructure -others
3%
Others17%
20

accounting for 73.2 percent of total spending in 2010. This category saw a constant increase between 2006 (47.5 percent) and 2010 (73.2 percent).
Figure 9: Composition of public expenditure by commodity: support for individual commodities, groups of commodities and all commodities
Source: Authors, using data from DGB
Public expenditure allocated to groups of commodities saw an increase between 2006 and 2009, going from 8.7 percent to 21.5 percent, but registered a small decline in 2010, at 15.2 percent. An analysis of the breakdown of public spending allocated to groups of commodities shows that the livestock/onion/mango group benefited from the largest share of funding. Indeed, 38 percent of total spending on groups of commodities was allocated to this particular group,. This is due to the importance of the World Bank supported “Agro-pastoral and forestry sectors support project” (PAFASP), which accounts for a very large share of agricultural-speficic public expenditure. Then come the «livestock» group, at 24 percent and the rice and horticulture group, at 18 percent. These results show that rice and livestock are the main groups of commodities targeted by the government, together with horticulture and fruits in the context of the PAFASP.
The lowest spending levels were for the «millet, maize, sorghum», «banana, milk and shea», «potato and onions», «rice, fish”, «forestry production» and «cereals, legumes and horticulture» groups, which each received allocations of less than 5 percent of expenditure allocated to groups of products.
0
10
20
30
40
50
60
70
80
2006 2007 2008 2009 2010
support to all commodities
support to individual commodities
support to groups of commodities
Billion FCFA
21
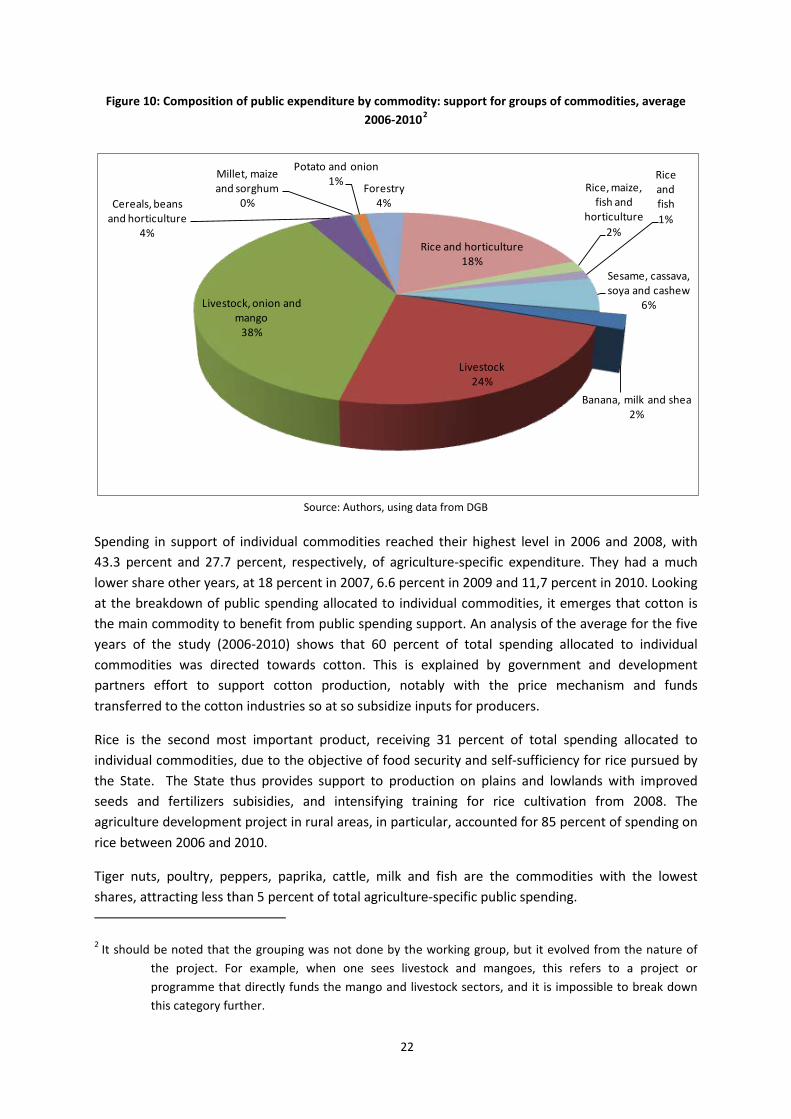
Figure 10: Composition of public expenditure by commodity: support for groups of commodities, average 2006-20102
Source: Authors, using data from DGB
Spending in support of individual commodities reached their highest level in 2006 and 2008, with 43.3 percent and 27.7 percent, respectively, of agriculture-specific expenditure. They had a much lower share other years, at 18 percent in 2007, 6.6 percent in 2009 and 11,7 percent in 2010. Looking at the breakdown of public spending allocated to individual commodities, it emerges that cotton is the main commodity to benefit from public spending support. An analysis of the average for the five years of the study (2006-2010) shows that 60 percent of total spending allocated to individual commodities was directed towards cotton. This is explained by government and development partners effort to support cotton production, notably with the price mechanism and funds transferred to the cotton industries so at so subsidize inputs for producers.
Rice is the second most important product, receiving 31 percent of total spending allocated to individual commodities, due to the objective of food security and self-sufficiency for rice pursued by the State. The State thus provides support to production on plains and lowlands with improved seeds and fertilizers subisidies, and intensifying training for rice cultivation from 2008. The agriculture development project in rural areas, in particular, accounted for 85 percent of spending on rice between 2006 and 2010.
Tiger nuts, poultry, peppers, paprika, cattle, milk and fish are the commodities with the lowest shares, attracting less than 5 percent of total agriculture-specific public spending.
2 It should be noted that the grouping was not done by the working group, but it evolved from the nature of the project. For example, when one sees livestock and mangoes, this refers to a project or programme that directly funds the mango and livestock sectors, and it is impossible to break down this category further.
Banana, milk and shea2%
Livestock24%
Livestock, onion and mango
38%
Cereals, beans and horticulture
4%
Millet, maize and sorghum
0%
Potato and onion1% Forestry
4%
Rice and horticulture18%
Rice, maize, fish and
horticulture2%
Rice and fish1%
Sesame, cassava, soya and cashew
6%
22

Figure 11. Composition of public expenditure by commodity: support for individual commodities, average 2006-2010
Source: Authors, using data from DGB and DGCOOP
Nature of public expenditures for the food and agriculture sector An analysis of expenditures for the food and agriculture sector for the period 2006-2010 shows that it was mainly dominated by transfers due to policies3, which can take two forms: actual budgetary transfers (such as subsidies to production) and a budgetary shortfall for public administration (corresponding, for example, to tax relief). In fact, the share of transfers due to policies out of the total budget for agriculture was higher than 50 percent throughout the period 2006-2010. It even reached 96 percent in 2010. Regarding administrative costs, these are linked to the drawing up, implementation and evaluation of agricultural policies. The share of administrative costs in the total budget for agriculture was less than 20 percent for the period 2006-2010, except in 2008, when it was 42 percent.
Table 4: Share of transfers due to policies and administrative costs out of actual total expenditure (%)
Type of spending 2006 2007 2008 2009 2010
Administrative costs 13 9 42 16 4
Transfers due to policies 87 91 58 84 96
Total budget for agriculture 100 100 100 100 100
Source: Authors, using data from DGB and DGCOOP
3 Transfers due to policies in this section do not include totals of transfers due to policies by the Ministries of Health, Education, Energy and Infrastructure.
23

In absolute terms, the budget approved for transfers due to policies varied between 154.1 and 175.5 billion FCFA for the period 2006-2010. Actual disbursements for transfers due to policies varied between 101 and 140.1 billion FCFA, with a disbursement level that varied between 65 and 88 percent over the period 2006-2010.
Regarding administrative costs, the approved budget varied between 11.7 and 19.8 billion FCFA for the period 2006-2010. In terms of actual disbursements, administrative costs varied between 11.9 and 18.9 billion FCFA over the same period. The disbursement level was more than 80 percent for all years during the same period. The disbursement level for administrative costs was therefore far higher than that of transfers due to policies between 2006 and 2009. By contrast, in 2010, the disbursement level for transfers due to policies was much higher than that for administrative costs.
Table 5: Approved budget and actual expenditures for the food and agriculture sector in Burkina Faso, 2006-2010
Billion FCFA 2006 2007 2008 2009 2010
Total budget for agriculture
Actual disbursement (bn FCFA) 144,7 134,6 118,5 150,4 153,9
Approved budget (bn FCFA) 170,6 186,1 174,3 187,1 174,8
Share of actual disbursement in budget (%) 85 72 68 80 88
Transfers due to policies Actual disbursement (bn FCFA) 125,8 121,7 101,0 138,4 140,1
Approved budget (bn FCFA) 154,1 171,0 154,6 175,5 158,4
Share of actual disbursement in budget (%) 82 71 65 79 88
Administrative costs -- Actual disbursement (bn FCFA) 18,9 12,9 17,6 11,9 13,8
Approved budget (bn FCFA) 16,6 15,1 19,8 11,7 16,4
Share of a actual disbursement in budget (%) 114 86 89 102 84
Source: Authors, using data from DGB and DGCOOP
Types of public expenditures for the food and agriculture sector The study also made it possible to classify total expenditures for the food and agriculture sector in Burkina Faso into investment spending and recurrent spending.
Investment spending is defined as spending on goods for developing the productive capacity of the agriculture sector.
Recurrent spending is that incurred by entities in charge of the agriculture sector in a repetitive manner over the years.
24

The analysis shows that expenditures for the food and agriculture sector is made up of more than 80 percent of investment spending. This predominance of investment spending is without doubt a positive factor for agricultural growth in Burkina Faso.
Table 6: Breakdown of public expenditure fir food and agriculture, by recurring and investment costs in Burkina Faso, 2006-2010, in billions of FCFA
Year 2006 2007 2008 2009 2010 Recurrent spending 16,1 12,9 19,7 18,4 13,2 Investment spending 83,9 87,1 80,3 81,6 86,8 Total budget for agriculture 100 100 100 100 100
Source: Authors, using data from DGB and DGCOOP
Role of development aid in public expenditures for the food and agriculture sector Burkina Faso In this study, public expenditures for the food and agriculture sector were also classified according to funding sources. These are divided into:
Spending with funding from domestic sources: this is spending funded by central and decentralized administrations in Burkina Faso ;
External funding, involving all initiatives in support of agriculture that are funded by development partners.
External funding may take the form of grants or loans. It is important to make a distinction between these two types of aid, since loans can have serious repercussions for the economy, leading to an increase in outstanding debt and debt servicing levels. Between 2006 and 2010, the level of development aid in the agriculture sector rose from 74 to 114 billion FCFA, with a peak in 2006. During the period 2006-2010, the share of external funding accounted for an average 71 percent of total expenditures for the food and agriculture sector. The highest share of external funding was in 2006, with 79 percent of total spending, and the lowest was in 2008, with 62 percent. The results reveal a strong reliance of agriculture on external funding for the period 2006-2010. This suggests great uncertainty in agricultural development for Burkina Faso, given that the country does not control external funding; it is difficult to build any strategy for sustainable agricultural growth in these conditions.
Table 7: External funding as share of expenditures for the food and agriculture sector in Burkina Faso, 2006-2010 (in billions of FCFA)
Year 2006 2007 2008 2009 2010 Moyenne
Total agriculture-supportive public expenditure 145 135 119 150 154 140
External funding 114 102 74 109 102 100 Share of external funding (in %) 79 76 62 72 66 71
Source: Authors, using data from DGB and DGCOOP
25

An analysis of public development aid in terms of agriculture-specific public spending and agriculture-supportive spending indicates that on average, public development aid financed agriculture-specific public spending at a level of 68,7 percent for the period 2006-2010. Regarding agriculture-supportive spending, this was financed at an average level of 84,4 percent by public development aid.
In the category of agriculture-specific public spending, the share of external funding according to the items of which it is comprised, the bulk of spendingI is allocated payments to producers, including input subsidies (32 percent), infrastructure (19 percent), training (17 percent) and payments to consumers (9 percent), who benefit from the largest amount of support in terms of external funding.
In the category of agriculture-supportive spending, policies linked to building rural infrastructure (42 percent) and education in rural areas (38 percent) receive the largest proportion of aid. It can also be seen that the «others» column accounts for 17 percent of agriculture-supportive spending.
In terms of the share of public spending made up of external funding, figures show that donors contribute mostly to marketing activities, which account for 86,8 percent of spending for these activities, as well as extension (82,5 percent), training (81,4 percent), payment to producers – input subsidies (59,7 percent), building infrastructures (72,2 percent)and payment to processors (85,2 percent).
Regarding activities in support of agriculture, the most vigorously supported sectors are education in rural areas (91.7 percent) and infrastructures in rural areas (85 percent). It is also important to highlight the significant proportion of external funding in the «others» category (91,2 percent). Such a category groups together projects with insufficient information that could hence not be classified satisfactorily.
26

Figure 12: Average share of aid to actual total expenditure for the food and agriculture sector in Burkina Faso, 2006-2010, (in %)
Source: Authors, using data from DGB and DGCOOP
Overall, aid to Burkina Faso supplied by donors would seem to be line with the Strategic Framework for Poverty Reduction (CSLP). External funding focuses mainly on parts 2 (guaranteeing basic social services to the poor) and 3 (expanding employment and income generating opportunities for the poor) of the CSLP, which highlights aspects of production/market linkage, extension and training, input subsidies, infrastructures, education and infrastructure in rural areas.
68,7%
59,5%
35,1%
59,9%
0%
85,2%
47,2%
61,4%
81,4%
82,5%
61,6%
72,2%
54,1%
86,2%
84%
84,4%
91,7%
21,9%
85%
91,2%
0.0 20.0 40.0 60.0 80.0
I. AGRICULTURE-SPECIFIC POLICIES
Payments to producers - input subsidies
Income support
Payments to consumers
Payments to input suppliers
Payments to processors
Research
Technical assistance
Training
Extension
Inspection
Infrastructure
Storage/public storage
Marketing
Others
II. AGRICULTURE-SUPPORTIVE POLICIES
Rural education
Rural health
Rural infrastructure
Others
donor (% next to the axis) national
27

A closer analysis of external aid makes it possible to break it down into grants and loans. Loans are financial transfers made by donors on condition that they are reimbursed at a later date, in some cases with interest. Grants are financial transfers made by assorted donors with no conditions.
For the period 2006-2010, loans made up an average 55.3 percent of total external funding. This indicates that during this period, external funding was dominated by loans, contributing to an increase in outstanding debt and debt servicing, which could prove an obstacle to development in Burkina Faso. Loans predominated in 2006, 2008, 2009 and 2010, when they accounted for, respectively, 58.3 percent, 50.2 percent, 50.7 percent and 68.3 percent of total external funding. However, in 2007, loans accounted for a share of 52.7 percent of total external funding.
The figure below gives a breakdown of external aid in terms of grants and loans.
Figure 13. Composition of development aid in loans and grants in Burkina Faso, 2006-2010, (in %)
Source Authors, using data from DGB and DGCOOP
Conclusions and recommendations An analysis of public expenditure reveals significant trends in budgetary support for the food and agriculture sector between 2005 and 2010, in terms of volume, but especially in terms of composition.
A first observation is that, according to criteria adopted by the MAFAP typology, the budget share in favour of the total rural and agricultural sector exceeds the 10 percent target set by the Maputo Declaration in 2003. The figure was an average 15.2 percent for the period 2006-2010. Actual expenditure in favour of the sector for that period saw a 6 percent overall increase between 2006 and 2010, despite the initial decline between 2006 and 2008 linked to low levels of disbursement.
In terms of composition, it is clear that, agricultural public spending favoured input subsidies and agricultural infrastructures. Input subsidies accounted for 38 percent of agricultural-specific spending, training accounted for 15 percent and infrastructure for 20 percent (especially irrigation
-
10
20
30
40
50
60
70
80
2,006 2,007 2,008 2,009 2,010
Share of loans in total aid to food and agricultural sector Share of grants in total aid to food and agricultural sector
28

and feeder roads). Rural infrastructure on their side accounted for 41 percent of agriculture-supportive spending. These attest to government interest in promoting irrigated agriculture and making certain production areas less remote.
Besides, the majority of public spending (an average of 63.2 percent of total spending) was allocated to all agricultural products, without targeting specific products, demonstrating an interest in cross-cutting agricultural policies and less targeting of public interventions. When sectors are targeted, it is mainly a case of rice, cotton, livestock and wheat, reflecting the government’s strategic priorities, but also revealing a certain neglect of subsistence crops. During the five year study, there was also an increase in public spending in favour of health in rural areas, in line with part 2 of the Strategic Framework for Poverty Reduction (CSLP), however spending for education strongly decreased.
The expenditure focused mainly on investment rather than recurrent spending, with investment spending reaching more than 80 percent during the period 2006-2010. This was largely covered by external funding, which accounted for an average 71 percent of total public spending in support of agriculture. Loans accounted for an average 55.3 percent of external funding, representing a considerable burden for the country’s debt levels.
Overall, public development aid appears to be in line with the key priorities of the Strategic Framework for Poverty Reduction (CSLP). But efforts can still be made to align it further with the country’s priorities.
Regarding results of the analysis of public spending in support of agriculture, it would seem opportune to make the following recommendations:
• In order to improve analyses in the future, the Direction of Studies and Planification (DEP), and especially ministries in charge of the agriculture sector, should set in place and/or improve the content of project and programme repertories by indicating, for each project, the ministry in charge, the overall objective, the specific objectives, the results expected, activities to be carried out, the area of intervention, the level of governance and the products involved in their implementation;
• The ministry in charge of the budget should work to ensure that finance channels are even more efficient so as to further improve the level of actual disbursement for approved budgets, though remarkable progress has been observed in recent years;
• In future, greater efforts must be made in orienting budgetary allocations towards priority areas identified by PNSR objectives for sector development. This would make it possible to lighten the clear predominance of spending in general support of agriculture compared with targeted support to certain sectors, correcting an absence of real priorities in total spending for agriculture sector. Support to food crop sectors, in particular, is inadequate.
• Decision-makers should consider increasing state interventions in the fields of building storage infrastructures, support to marketing, inspection, extension, agricultural research and technical assistance. Support to production cannot have sustainable repercussions unless producers have access to better production techniques, stronger marketing and processing channels and improved quality and productivity for each sector.
29

REFERENCES DPSAA, (2009), Evolution du secteur agricole et des conditions de vie des ménages au Burkina Faso et mesures de politiques agricoles et alimentaires face à la vie chère.
Komorowska J. (2010) “A proposed methodology for measuring government expenditures in support of food and agriculture sector development and application in the case of Uganda”, project paper, www.fao.org/mafap
MAH, (2011), Action Framework for Agricultural Investment in Burkina Faso, OECD, March 2011/Cadre d’action pour l’investissement agricole au Burkina Faso, OCDE, Mars 2011.
MAHRH, (2008), National Programme for Food Security (NPFS)/Programme National pour la Sécurité Alimentaire (PNSA)
MAHRH, (2010), National Programme for Rural Sector Development (NPRS)/Programme National du Secteur Rural (PNSR).
MEF, (2000), Strategic Framework for Poverty Reduction (CSLP)/Cadre Stratégique de Lutte contre la Pauvreté (CSLP)
MEF, (2009), Strategy for Accelerated Growth and Sustainable Development (SCADD) 2011 – 2015/Stratégie de croissance accélérée et de développement durable (SCADD) 2011 – 2015.
MEF, (2011), Technical note on arbitrating state budget investment priorities/ Note technique sur l’arbitrage des priorités d’investissements du budget de l’Etat.
OECD (2008,) Producer Support Estimate and Related Indicators of Agricultural Support: Concepts, Calculations, Interpretation and Use (The PSE Manual), http://www.oecd.org/LongAbstract/0,3425,fr _2649_33773_44253755_1_1_1_1,00.html
MAFAP (2010a), Detailed brochure for MAFAP project, www.fao.org/mafap
MAFAP (2010b) Monitoring African Food and Agricultural Policies project methodology: concept paper. Draft paper, www.fao.org/mafap
MAFAP (2011) Implementing MAFAP methodology in country-level work, project paper, www.fao.org/mafap
30

ANNEX 1. Summary of main methodological concepts The methodology proposes to capture all public expenditures that are undertaken in support of food and agriculture sector development. That includes expenditures from the national budget, either central or regional government, regardless of the ministry that implements the policy, and external aid, provided either through local governments or specific projects conducted by international organisation or NGOs.
The primary focus is on the food and agriculture sector, however, for some countries forestry and fisheries may be an important part of rural activity and are also included in the scope of the project.
We seek to capture all public expenditures in the rural areas, such as rural infrastructure, rural education and rural health, as they may also have an important role in agriculture’s sector development, even if they are not specific to the sector.
Expenditure measures generate explicit or implicit monetary transfers to supported individuals or groups. We consider all those expenditure measures that generate explicit or implicit monetary transfers in support of food and agriculture sector development. These measures are divided into two main categories of expenditures: agricultural-specific expenditures and agricultural supportive expenditures. Agricultural-specific expenditures include those measures that generate monetary transfers to agricultural agents or sector as a whole. The agents, or the sector as a whole, must be the only, or the principal recipient of the transfers generated by the expenditure measure. Agriculture supportive measures should include measures that are not strictly specific to agriculture sector, but that have strong influence on agricultural sector development such as investments in rural development. All the measures that comply with these criteria are considered, regardless their nature, objectives or perceived economic impacts.
Further, general expenditure measures available throughout the entire economy are not considered, even if they generate monetary transfers to agricultural sector.
Finally, the expenditure measures are considered and classified according to the way in which they are implemented and not on the basis of their objectives or economic impacts.
Classification and disaggregation
Many expenditures of greatest relevance to agricultural development, in terms of their ability to expand the production frontier, may not be specific to agriculture, but could fall into other categories. Moreover, support can be provided in several different ways. Support to agricultural producers may be provided via reduced input prices (e.g. a fertiliser subsidy), cost sharing for fixed capital (e.g. machinery), revenue foregone by the government (tax concession), reimbursement of taxes or charges or services in kind (e.g. delivery of extension services). Agriculture-specific support to the sector more generally may be provided via spending on agricultural education, research, marketing of agricultural goods, irrigation etc.
Some policies which benefit agriculture may be even more general, such as expenditures on rural infrastructure, rural education or rural health. Although the latter are not sector specific, they may be sector supportive. In order to capture all public expenditures in support of the food and agriculture sector, the following breakdown is proposed.
31

1. A broad distinction between policies that are: agriculture-specific, agriculture supportive and non-agricultural expenditures.
2. Within the agriculture-specific category, a distinction between support to producers and other agents in the value chain, and general sector support. The agents in the value chain include farmers (producers), input suppliers, processors, consumers, traders and transporters.
The detailed classification of support follows the OECD’s principle of classifying policies according to their economic characteristics i.e. the way they are implemented, which provides the basis for further policy analysis (OECD, 2008). The particular categories, however, should be designed to reflect the types of policies applied in African countries. Likewise, the categories proposed in the box below have been elaborated based on the experience of various agencies, including FAO (e.g. FAO, 2006), working on public expenditures in developing countries (for a comprehensive overview, see MAFAP, 2010c). Further, drawing on the OECD’s experience, the classification proposed aims at distinguishing, to the extent possible, policies providing private goods as opposed to public goods, given their different economic effects.
Proposed classification of public expenditures in support of the food and agriculture sector
I. Agriculture-specific policies – monetary transfers that are specific to agriculture sector i.e. agriculture is the only, or major, beneficiary of a given expenditure measure
I.1. Payments to the agents in the agro-food sector – monetary transfers to the agents of agro-food sector individually
I.1.1. Payments to producers – monetary transfers to individual agricultural producers (farmers)
A. Production subsidies based on outputs – monetary transfers to agricultural producers that are based on current output of a specific agricultural commodity
B. Input subsidies – monetary transfers to agricultural producers that are based on on-farm use of inputs:
variable inputs (seeds, fertiliser, energy, credit, other) – monetary transfers reducing the on-farm cost of a specific variable input or a mix of variable inputs
capital (machinery and equipment, on-farm irrigation, other basic on-farm infrastructure) – monetary transfers reducing the on-farm investment cost of farm buildings, equipment, plantations, irrigation, drainage and soil improvements
on-farm services (pest and disease control/veterinary services, on-farm training, technical assistance, extension etc., other) – monetary transfers reducing the cost of technical assistance and training provided to individual farmers
C. Income support – monetary transfers to agricultural producers based on their level of income
D. Other – monetary transfers to agricultural producers individually for which there is insufficient information to allocate them into above listed categories
I.1.2. Payments to consumers – monetary transfers to final consumers of agricultural commodities individually in form of:
E. food aid – monetary transfers to final consumers reducing the cost of food
F. cash transfers – monetary transfers to final consumers to increase their food consumption expenditure
G. school feeding programmes – monetary transfers to final consumers providing free or reduced-
32

cost food in schools
H. other – monetary transfers to final consumers individually for which there is insufficient information to allocate them into above listed categories
I.1.3. Payments to input suppliers – monetary transfers to agricultural inputs suppliers individually
I.1.4. Payments to processors – monetary transfers to agricultural commodities processors individually
I.1.5. Payments to traders – monetary transfers to agricultural traders individually
I.1.6. Payments to transporters – monetary transfers to agricultural commodities transporters individually
1.2. General sector support – public expenditures generating monetary transfers to the agro-food sector agents collectively
I. Agricultural research – public expenditures financing research activities improving agricultural production
J. Technical assistance – public expenditures financing technical assistance agricultural sector agents collectively
K. Training – public expenditures financing agricultural training
L. Extension/technology transfer – public expenditures financing provision of extension services
M. Inspection (veterinary/plant) – public expenditures payments financing control of quality and safety of food, agricultural inputs and the environment
N. Infrastructure (roads, non-farm irrigation infrastructure, other) – public expenditures financing off-farm collective infrastructure
O. Storage/public stockholding – public expenditures financing public storage of agro-food products
P. Marketing – public expenditures financing assistance in marketing of agro-food products
R. Other – other transfers to the agro-food agents collectively for which there is insufficient information to allocate them into above listed categories
II. Agriculture supportive policies – public expenditures that are not specific to agriculture, but which have a strong influence on agricultural sector development
S. Rural education – public expenditures on education in rural areas
T. Rural health – public expenditures on health services in rural areas
U. Rural infrastructure (rural roads, rural water, rural energy and other) – public expenditures on rural infrastructure
V. Other – other public expenditures on rural areas benefiting agricultural sector development for which there is insufficient information to allocate them into above listed categories
For more details on MAFAP methodology on measurement of public expenditures in support of food and agriculture sector development, see www.fao.org/mafap.
33

ANNEX 2. MAFAP public expenditure analysis and existing work on public expenditure reviews The following table describes the main differences between traditional public expenditure reviews, such as those performed by the World Bank, ReSAKSS and MAFAP public expenditures analysis.
Table 1. MAFAP, World Bank, and ReSAKSS Public Expenditure analysis comparison
WB PER MAFAP PE analysis ReSAKSS PE analysis
Nature of the exercise One-off reviews of the efficiency and allocation of agricultural public expenditure, carried out by World Bank staff and local consultants.
Sustainable monitoring system of the level and composition of food and agriculture public expenditure established within the Ministry of Agriculture in African countries with FAO’s technical assistance.
One-off reviews of the level and composition of public expenditure in African countries that have signed the CAADP compacts, to assess their status with regards to the CAADP targets (especially Maputo), carried out by IFPRI staff and local consultants.
Objective Promote more efficient budgetary processes (expenditure frameworks especially). Formulate evidence-based recommendations to improve technical and allocative efficiency of public expenditure for agriculture in the countries.
Develop a monitoring system at country-level that will inform policy makers and development stakeholders on the level and composition of agricultural spending. Compare the composition of agricultural spending with policies affecting prices in the country and policy objectives to assess policy coherence.
Follow the implementation of the CAADP commitments through public expenditure in member countries of the African Union.
Scope Agriculture-specific measures according to the Classification of Functions of Government (COFOG), use of COFOG + (including certain agricultural-supportive measures, i.e rural development). Tracking from 5 to 10 years.
More than 10 countries over the period 2006-2012.
Agriculture specific and agriculture supportive (rural development e.g. health, education, infrastructure), based on the Organisation of Economic Cooperation and Development (OECD) classification but COFOG-compatible. Starting with 2006-2011.
10 countries over the period 2006-2012.
Agriculture-specific measures according to the Classification of Functions of Government (COFOG) : Agriculture, Livestock, Fisheries, Forestry. Tracking from 2000 to 2008.
3 countries over the period 2006-2012 (and calculation of the Maputo target for all African Union countries).
34

Ministries and institutions covered
All ministries that manage measures that benefit only or mainly agricultural sector.
All ministries that manage measures that benefit only or mainly agricultural sector.
All ministries that manage measures that benefit only or mainly agricultural sector.
Classifications and disaggregation
Typically based on policy objectives.
Derived from existing or disaggregation in the country and hence differ from country to country. Increasingly based on COFOG as countries start to adopt it more and more. Looking at an aggregated level : Agriculture, Livestock, Fisheries, Forestry.
Two types of disaggregation: by function (similar to MAFAP but more aggregated and not based on implementation criteria) and economic area.
Classification based on how measures are implemented (“economic characteristics” of measures) and comparable between countries. Disaggregated with information on each project, program and activity, on commodity targeted and level of government (centralized/decentralized).
Budgeted amount versus actual spending. Loans versus grants. Recurrent versus development. Revenue foregone.
Classification based on COFOG for aggregated data. Disaggregated data presented according to each country specific classification system.
Admin costs Included in the classification Excluded from the main classification, treated separately. Included in the classification
Budget/Actual expenditure
Included in the classification Included in the classification Included in the classification
Recurrent/Development Included in the classification Included in the classification Included in the classification
Revenue foregone Excluded. Included. Excluded.
Aid Included in the classification and further analysis; analysis of off-budget expenditures
At country level: included in classification and further analysis; analysis of off-budget expenditure
Included in the classification, off-budget aid excluded.
35
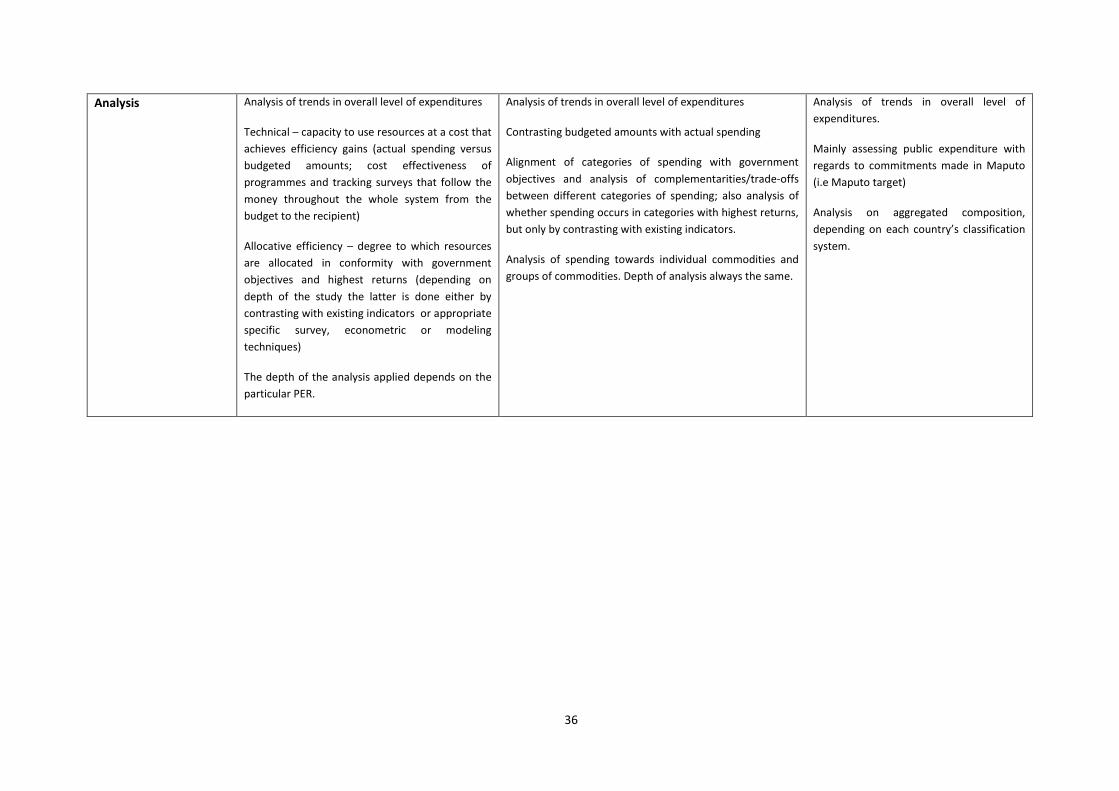
Analysis Analysis of trends in overall level of expenditures
Technical – capacity to use resources at a cost that achieves efficiency gains (actual spending versus budgeted amounts; cost effectiveness of programmes and tracking surveys that follow the money throughout the whole system from the budget to the recipient)
Allocative efficiency – degree to which resources are allocated in conformity with government objectives and highest returns (depending on depth of the study the latter is done either by contrasting with existing indicators or appropriate specific survey, econometric or modeling techniques)
The depth of the analysis applied depends on the particular PER.
Analysis of trends in overall level of expenditures
Contrasting budgeted amounts with actual spending
Alignment of categories of spending with government objectives and analysis of complementarities/trade-offs between different categories of spending; also analysis of whether spending occurs in categories with highest returns, but only by contrasting with existing indicators.
Analysis of spending towards individual commodities and groups of commodities. Depth of analysis always the same.
Analysis of trends in overall level of expenditures.
Mainly assessing public expenditure with regards to commitments made in Maputo (i.e Maputo target)
Analysis on aggregated composition, depending on each country’s classification system.
36
