analysis of incentives and disincentives for sugar in kenya
TRANSCRIPT

ANALYSIS OF INCENTIVES AND DISINCENTIVES
FOR SUGAR IN KENYA
JULY 2013

This technical note is a product of the Monitoring African Food and Agricultural Policies project (MAFAP). It is a technical document intended primarily for internal use as background for the eventual MAFAP Country Report. This technical note may be updated as new data becomes available.
MAFAP is implemented by the Food and Agriculture Organization of the United Nations (FAO) in collaboration with the Organisation for Economic Co-operation and Development (OECD) and national partners in participating countries. It is financially supported by the Bill and Melinda Gates Foundation, the United States Agency for International Development (USAID), and FAO.
The analysis presented in this document is the result of the partnerships established in the context of the MAFAP project with governments of participating countries and a variety of national institutions.
For more information: www.fao.org/mafap
Suggested citation: Monroy L., Mulinge W., Witwer M., 2012. Analysis of incentives and disincentives for sugar in Kenya. Technical notes series, MAFAP, FAO, Rome. © FAO 2013 FAO encourages the use, reproduction and dissemination of material in this information product. Except where otherwise indicated, material may be copied, downloaded and printed for private study, research and teaching purposes, or for use in non-commercial products or services, provided that appropriate acknowledgement of FAO as the source and copyright holder is given and that FAO’s endorsement of users’ views, products or services is not implied in any way. All requests for translation and adaptation rights, and for resale and other commercial use rights should be made via www.fao.org/contact-us/licence-request or addressed to [email protected].
2

CONTENTS
1. PURPOSE OF THE NOTE............................................................................................................................. 4
2. POLICY CONTEXT ....................................................................................................................................... 5
a. Production ............................................................................................................................................. 5
b. Consumption ......................................................................................................................................... 7
c. Marketing and Trade ............................................................................................................................ 8
d. Description of the Value Chain ........................................................................................................... 10
e. Policy Decisions and Measures ........................................................................................................... 15
3. DATA REQUIREMENTS, DESCRIPTION AND CALCULATION OF INDICATORS .......................................... 19
4. INTERPRETATION OF INDICATORS ............................................................................................................. 31
5. PRELIMINARY CONCLUSIONS AND RECOMMENDATIONS ......................................................................... 34
6. Bibliography ............................................................................................................................................... 35
ANNEX I: Additional Data and Information ..................................................................................................... 37
ANNEX II: Data and calculations used in the analysis ..................................................................................... 38
3

1. PURPOSE OF THE NOTE This technical note aims to describe the market incentives and disincentives for sugar production in Kenya. For this purpose, yearly averages of farm gate and wholesale prices are compared with reference prices calculated on the basis of the price of the commodity in the international market. The price gaps between the reference prices and the prices along the value chain indicate to what extent incentives (positive gaps) or disincentives (negative gaps) are present at the farm gate and wholesale level. In relative terms, the price gaps are expressed as Nominal Rates of Protection (NRPs). These key indicators are used by MAFAP to highlight the effects of policy and market development gaps (MDGs) on prices.
The note starts with a brief review of the commodity’s production and consumption as well as trade and policies affecting the commodity. It also provides a detailed description of how the key components of the price analysis were obtained. Using this data, the MAFAP indicators were calculated and interpreted in light of existing policies and market characteristics. The analysis is commodity and country specific and covers the period 2005-2011. The indicators were calculated using available data from different sources for this period and are described in Chapter 3.
The results of this analysis can be used by stakeholders involved in policy-making for the food and agricultural sector. They can also serve as input for evidence-based policy dialogue at the country or regional level.
This technical note is not to be interpreted as an analysis of the value chain or detailed description of production, consumption or trade patterns. All information related to these areas is presented merely to provide background on the commodity under review, help understand major trends and facilitate the interpretation of the indicators. Additionally, all information presented in this note is preliminary and still subject to review and validation
.
4
2. POLICY CONTEXT The sugar industry plays a significant role in Kenya’s economy, contributing about 15 percent to the country’s agricultural GDP (KSI, 2009). The sector consists of more than 250,000 smallholder farmers, who supply over 92 percent of the sugarcane processed by sugar companies, while the remainder is supplied by factory-owned nucleus estates (KSI, 2009; KSB, 2010). An estimated 25 percent of the country’s population depends directly or indirectly on the sugar industry for their livelihood.
The processing component of Kenya’s sugar industry consists of 11 mills, 6 of which are privately owned (EU, 2012). The government supports the sugar industry through direct investment in these mills. However, the industry continues to operate below capacity and is unable to meet Kenya’s national demand for sugar or compete with more efficient producers in the international market. For this reason, Kenya’s sugar sector remains highly protected, often at the expense of local consumers.
In recent years, Kenya’s sugar industry has faced several key challenges, including trade liberalization under the COMESA and WTO protocols, high costs of production compared to other sugar producing countries in the region, the dilapidated state of some factories, poor governance and management, insufficient funding and inadequate research and extension services (KSI, 2009). These challenges have led to the development of a new national strategy for the industry, which focuses on industry privatization, improved access to credit, sector research and diversification (USDA, 2011; USDA, 2012).
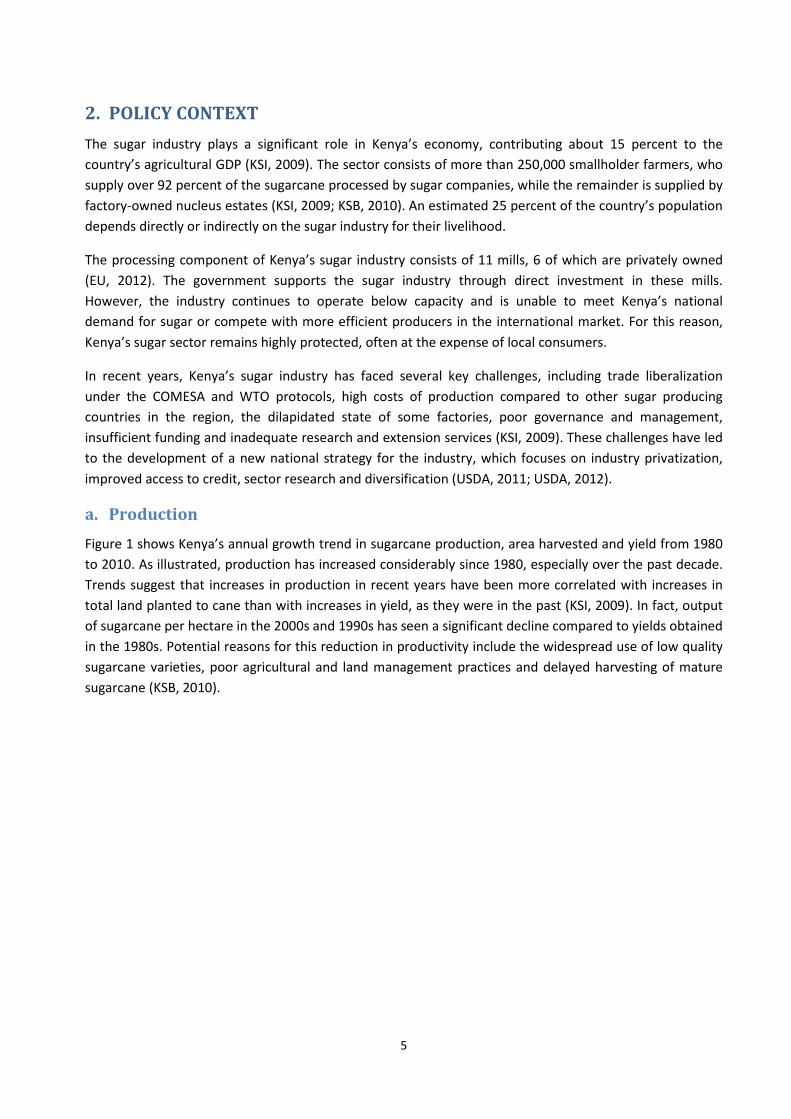
a. Production Figure 1 shows Kenya’s annual growth trend in sugarcane production, area harvested and yield from 1980 to 2010. As illustrated, production has increased considerably since 1980, especially over the past decade. Trends suggest that increases in production in recent years have been more correlated with increases in total land planted to cane than with increases in yield, as they were in the past (KSI, 2009). In fact, output of sugarcane per hectare in the 2000s and 1990s has seen a significant decline compared to yields obtained in the 1980s. Potential reasons for this reduction in productivity include the widespread use of low quality sugarcane varieties, poor agricultural and land management practices and delayed harvesting of mature sugarcane (KSB, 2010).
5
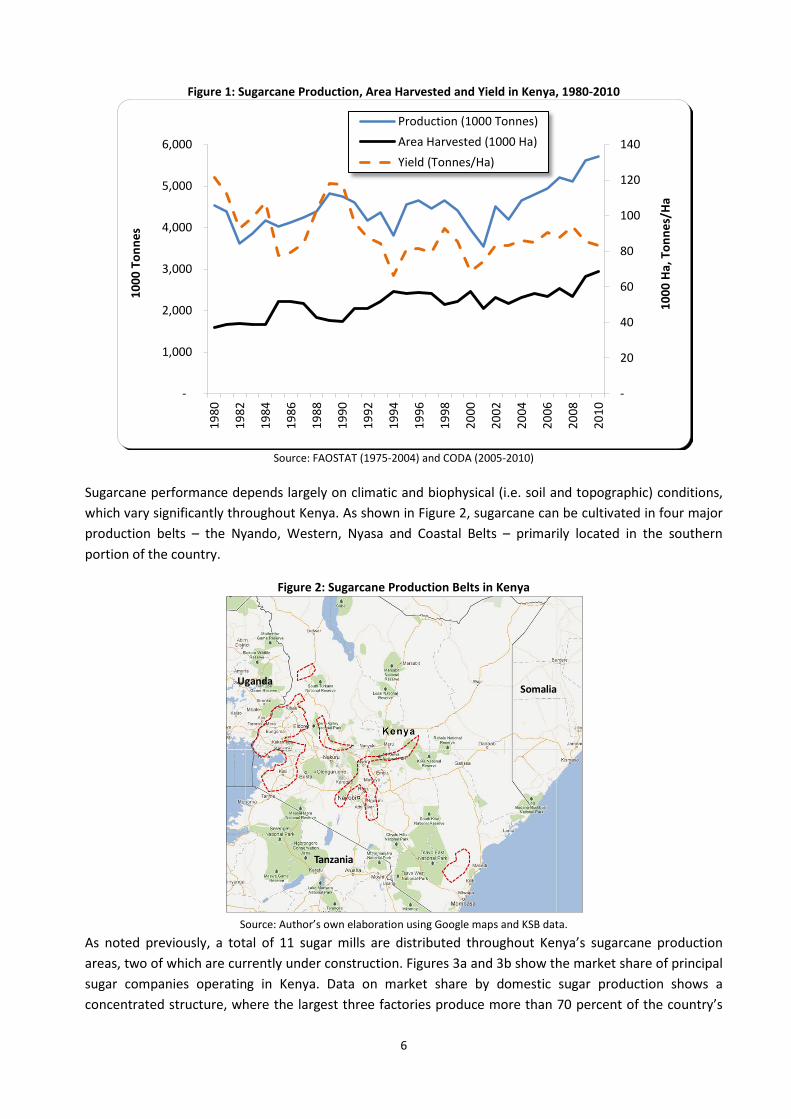
Figure 1: Sugarcane Production, Area Harvested and Yield in Kenya, 1980-2010
Source: FAOSTAT (1975-2004) and CODA (2005-2010)
Sugarcane performance depends largely on climatic and biophysical (i.e. soil and topographic) conditions, which vary significantly throughout Kenya. As shown in Figure 2, sugarcane can be cultivated in four major production belts – the Nyando, Western, Nyasa and Coastal Belts – primarily located in the southern portion of the country.
Figure 2: Sugarcane Production Belts in Kenya
Source: Author’s own elaboration using Google maps and KSB data.
As noted previously, a total of 11 sugar mills are distributed throughout Kenya’s sugarcane production areas, two of which are currently under construction. Figures 3a and 3b show the market share of principal sugar companies operating in Kenya. Data on market share by domestic sugar production shows a concentrated structure, where the largest three factories produce more than 70 percent of the country’s
-
20
40
60
80
100
120
140
-
1,000
2,000
3,000
4,000
5,000
6,000
1980
1982
1984
1986
1988
1990
1992
1994
1996
1998
2000
2002
2004
2006
2008
2010
1000
Ha,
Ton
nes/
Ha
1000
Ton
nes
Production (1000 Tonnes)Area Harvested (1000 Ha)Yield (Tonnes/Ha)
Tanzania
SomaliaUganda
6

sugar, with one company (Mumias) accounting for almost half of the total domestic sugar production. As illustrated in Figure 3b, Mumias Sugar Company also accounts for the largest share of national sugar sales, followed by importers, who account for about 25 percent of national sales (KIPPRA, 2010). However, according to KIPPRA (2010), there is no clear dominant player in the national sugar market.
Figure 3: Market Share of Principal Sugar Companies in Kenya, 2010
Source: KSB, 2010; KIPPRA, 2010
b. Consumption Over the last three decades, sugar consumption in Kenya has grown steadily, outpacing domestic production, as shown in Figure 4. Total sugar production grew from 436,238 tonnes in 1980 to 523,652 tonnes in 2010, while sugar consumption increased from 300,000 tonnes in 1980 to 743,000 tonnes in 2010. Kenya’s sugar deficit is mainly filled through imports of raw sugar from the Common Market for Eastern and Southern Africa (COMESA) region. Despite government investment in sugar mills, the country still has not reached self-sufficiency in sugar production, as several mills continue to operate inefficiently and below capacity. For this reason, it is unlikely that Kenya will achieve its stated goal of becoming a net exporter of raw sugar in the near future, unless it is able to substantially improve the condition and efficiency of its sugar mills.
7

Figure 4: Sugar Consumption Relative to Production and Trade in Kenya, 1980-2010
Source: FAOSTAT, KSB & USDA
According to the United States Department of Agriculture’s (USDA) 2011 Global Agriculture Information Network (GAIN) Report, the main factors driving increased sugar consumption in Kenya are population growth and industrial use for the production of biscuits, confectionary products, soft drinks and other beverages, which has been rising steadily.
c. Marketing and Trade As stated previously, since local sugar production is insufficient to fulfill Kenya’s growing national demand, many local wholesalers rely on raw sugar imports to cover their deficit. As shown in Table 2, Kenya was a net importer of raw sugar throughout the entire 2005-2010 period, with an import dependency ratio ranging from 22.9 percent in 2005 to 31.7 percent in 2007 and 2008. Figure 5 shows the variation in Kenya’s negative trade balance over this six-year period, which was lowest in 2007 when sugar imports peaked.
Table 2: Sugar Production and Trade in Kenya, 2005-2010 2005 2006 2007 2008 2009 2010
Production (tonnes) 516,800 488,100 517,000 520,404 511,900 547,999 Imports (tonnes) 149,664 166,326 230,013 220,176 184,537 195,000 Exports (tonnes) 11,978 14,519 22,267 45,096 2,136 2 Self-sufficiency Ratio (%) 79.0 76.3 71.3 74.8 73.7 73.8 Import Dependency Ratio (%) 22.9 26.0 31.7 31.7 26.6 26.2
Source: FAOSTAT & Global Trade Atlas
-
100
200
300
400
500
600
700
800
1980
1982
1984
1986
1988
1990
1992
1994
1996
1998
2000
2002
2004
2006
2008
2010
1000
Ton
nes
Apparent Consumption ProductionImports Exports
8
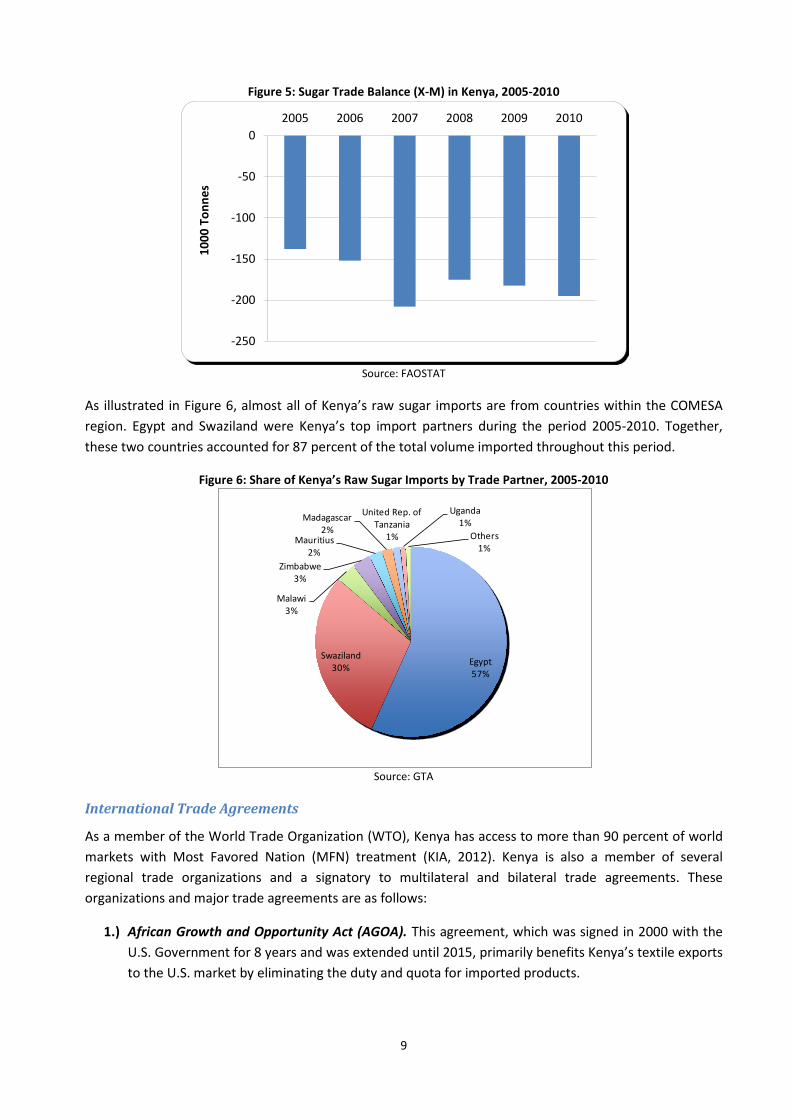
Figure 5: Sugar Trade Balance (X-M) in Kenya, 2005-2010
Source: FAOSTAT
As illustrated in Figure 6, almost all of Kenya’s raw sugar imports are from countries within the COMESA region. Egypt and Swaziland were Kenya’s top import partners during the period 2005-2010. Together, these two countries accounted for 87 percent of the total volume imported throughout this period.
Figure 6: Share of Kenya’s Raw Sugar Imports by Trade Partner, 2005-2010
Source: GTA
International Trade Agreements
As a member of the World Trade Organization (WTO), Kenya has access to more than 90 percent of world markets with Most Favored Nation (MFN) treatment (KIA, 2012). Kenya is also a member of several regional trade organizations and a signatory to multilateral and bilateral trade agreements. These organizations and major trade agreements are as follows:
1.) African Growth and Opportunity Act (AGOA). This agreement, which was signed in 2000 with the U.S. Government for 8 years and was extended until 2015, primarily benefits Kenya’s textile exports to the U.S. market by eliminating the duty and quota for imported products.
-250
-200
-150
-100
-50
02005 2006 2007 2008 2009 2010
1000
Ton
nes
Egypt57%
Swaziland30%
Malawi3%
Zimbabwe3%
Mauritius2%
Madagascar2%
United Rep. of Tanzania
1%
Uganda1%
Others1%
9

2.) ACP-EU Trade Agreement. This agreement, signed in 2000 between the European Community and the African, Caribbean and Pacific Group of States (ACP), gives Kenya no-reciprocal market access to the E.U.
3.) Common Market of Eastern and Southern Africa (COMESA). Kenya is a member of COMESA, a regional economic co-operation organization, which has been working to reduce trade barriers applied to goods produced within and traded among its 19 member countries. Under COMESA, a Free Trade Area has been in effect since 2000.
4.) East African Community (EAC). Kenya, Tanzania, Uganda, Rwanda and Burundi comprise the East African Community, which aims to achieve cooperation and regional harmonization on issues related to labor movement, work permits, education qualifications, standards, customs, rules of origin and common tariff nomenclature.
d. Description of the Value Chain Kenya’s sugar value chain consists of three main components – production, processing and distribution. Sugarcane production in Kenya is dominated by smallholder farmers (outgrowers), with only a few factory-owned farms (nucleus estates). The processing component of the value chain consists of 11 public, private and mixed-owned factories distributed throughout the country’s sugarcane production areas. Sugar distribution after processing is highly integrated between wholesalers, retailers and importers.
As illustrated in Figure 7, outgrowers generally sell their product to sugar mills that process the sugarcane into raw sugar, which is then sold to the local food industry and households through wholesalers and retailers. The by-products of the processed sugarcane are reused for planting or sold for energy and animal feed production (KSB, 2010).
Since domestic sugar production is insufficient to meet Kenya’s growing national demand, significant volumes of raw sugar are also imported, mainly through the Mombasa Port. These imports are transported to major wholesale markets, where they compete with locally produced sugar in the domestic market.
10

Figure 7: Simplification of Kenya’s Sugar Value Chain
Source: Author’s own elaboration based on KSB, 2010.
Wholesalers, Retailers
and Importers
Smallholder Farms
(Outgrowers)
Factory-owned Farms
(Nucleus Estates)
Animal Feed and
Energy Industries
Production Harvest
and Transport
Processing
Distribution and
Importation
Consumption
Local Sugar Factories
Food Industry
and Households
Sugarcan
e
Domestic Raw Sugar
Sugarcane By-Products
Raw Sugar Imports
Private Factory
Transporters
11

Though they are not shown in Figure 7, several key institutions also play a role in Kenya’s sugar value chain. These include (1) the Government of Kenya (GOK), which in addition to being responsible for the sector’s overall development, is currently the sugar industry’s largest shareholder (KSI, 2009); (2) the Kenya Sugar Board (KSB), which is a public body responsible for industry regulation, promotion, coordination and equity insurance; and (3) the Kenya Sugar Research Foundation (KESREF), which is responsible for the development and transfer of appropriate technology in the sugar sector.
Lastly, it is important to note that even after more than 25 years of industry protection and government investment, Kenya’s sugar industry is still characterized by high production costs. In 2009, sugar production costs in Kenya were the highest in the region, as shown in Table 3. These costs not only limit the industry’s capacity to meet the national demand for sugar, but they also hinder its ability to compete with more efficient producers in the international market.
Table 3: Sugar Production Cost in Selected COMESA and EAC Countries, 2009 Country Cost USD/Tonne Kenya 415-500 Sudan 250-340 Egypt 250-300
Swaziland 250-300 Zambia 230-260 Malawi 200-230 Uganda 140-180
Tanzania 180-190 Source: KSI, 2009
Sugarcane Production
Outgrowers supply more than 92 percent of the sugarcane processed by Kenyan sugar factories (KSI, 2009), while the remainder is supplied by factory-owned nucleus estates. Sugarcane outgrowers in Kenya mainly consist of smallholder farmers (more than 250,000), who have low technical capacity, limited capital and produce sugarcane under rain-fed conditions.
Ratoon cropping, a farming method which leaves the lower part of the plant uncut during harvesting so that it can re-grow the following season, has proven to be cost efficient for many sugarcane producers. This system allows farmers to harvest their crop several times before replanting, though the yield of the ratoon crop decreases after each cycle1. Sugarcane farmers using this farming method are able to obtain higher margins than those using traditional methods because they do not have pay for land preparation and seed every growing season (KSB, 2012). In Kenya, Mumia and Nzoia are the only two sugar companies that produce ratoon crops. Table 4 provides the sugarcane production costs for both of these companies and for smallholder farmers in Kenya’s Western Sugar Belt, which are differentiated by cropping system. As shown, production costs for all producers were substantially lower when using the ratoon cropping method than when using traditional methods.
1 Farmers in top sugar-producing countries are known to harvest their crop more than 10 times before replanting, while marginal producers rarely go beyond two (Kegode, 2005). In Tanzania, which has the lowest sugarcane production costs in the EAC, farmers typically harvest their crop between 5 and 8 times before replanting (KSI, 2009).
12

Table 4: Sugarcane Production Costs by Cropping System in Kenya (Ksh), 2011
Mumias Sugar
Company Nzoia Sugar
Company Smallholders in
Western Sugar Belt Costs Plant Ratoon Plant Ratoon Plant Ratoon
Land Preparation 17,676 0 17,352 0 12,675 0 Seed Cane 35,753 0 37,229 0 20,740 0 Fertilizers 24,952 13,265 28,500 28,500 15,050 8,400 Inter-cultivation 0 3,063 0 1,775 0 2,000 Labor 17,792 17,445 24,986 16,884 21,250 12,500 Total Direct Costs 96,173 33,773 108,067 47,159 69,715 22,900 Interest (Inputs) 20,616 5,888 36,487 17,581 6,221 1,666 Harvesting 23,500 18,800 14,300 11,440 8,000 6,400 Transportation 76,900 61,520 79,587 63,670 60,000 48,000 Levies 7,800 6,240 7,030 5,624 10,200 8,160 Total Costs 224,989 126,221 245,471 145,474 154,136 87,126 Total Costs per Tonne 2,250 1,578 2,455 1,818 1,541 1,089
Source: KSB, 2012
Harvesting and transportation represent the largest costs for sugarcane outgrowers, accounting for 45 percent of total production costs (KSB, 2010). These two activities are often considered jointly due to the fact that sugarcane must be transported to processing facilities within hours of harvesting to avoid spoiling. Sugarcane harvesting is extremely labor intensive, requiring an average of 71 Man-days2 (KSB, 2010). Additionally, sugarcane is a bulky crop, which makes it more expensive to transport (KSI, 2009). These costs are assumed by farmers, as they are deducted from the producer price paid at farm gate (KSB, 2010).
Even though farmers assume the cost of harvesting and transportation, they have no real control over the transportation companies and continuously report delays of up to 12 months in the mature cane harvest due to uncoordinated and unpredictable schedules and inefficiencies in mill operations (KSI, 2009).
Land fragmentation was identified as another problem affecting many outgrowers. Land owned by individual outgrowers continues to be subdivided into even smaller parcels, decreasing the efficiency of almost all farming activities (KSI, 2009).
Kenya’s sugarcane producers are organized into several different companies and cooperatives. In an effort to better represent the interests of these individual producer organizations, an umbrella organization, known as the Kenya Sugar Cane Growers Association (KESGA), was established in 1982. It is through the KESGA that farmers are able to lobby the government for support and negotiate sector relations (GOK, 2007).
Sugarcane Processing
Kenya’s sugar factories have the combined installed capacity to process more than 24,000 tonnes of cane per day. If this capacity were fully exploited, the industry could meet the national demand for sugar; however, factories continue to operate at a capacity utilization of only 55 to 60 percent because of significant technical and management limitations (KSI, 2009; KSB, 2010).
2 This is for green harvesting only, since burnt cane harvesting is prohibited by Kenyan authorities, even though is requires 14 less Man-days than green harvesting (KSB, 2010).
13

Every factory has its traditional supply zones, where it works together with outgrowers to obtain sugarcane inputs. Some also supplement outgrowers’ inputs with sugarcane from their own plantations. The factories coordinate with private transportation companies or provide their own transportation for sugarcane collection, scheduling it according to their quantity requirements. However, due to continuous breakdowns stemming from maintenance problems, factory demand for sugarcane is often inconsistent and unpredictable, adversely affecting local outgrowers.
One indicator of a sugar factory’s production efficiency is its conversion ratio, which measures the amount of sugarcane needed to produce one unit of sugar. When comparing the conversion ratios of Kenya’s sugar factories, there is a significant difference between the private and government-owned companies. For example, in 2008, the conversion ratio for the privately owned Mumias Company was 9.65, while the conversion ratio for the publicly owned Muhoroni Company was 12.67 (KSB, 2010). This means that Muhoroni required an additional 3 tonnes of sugarcane to produce the same amount of sugar as Mumias. Even though a factory’s conversion ratio largely depends on the quality of the sugarcane supplied by producers, factory management and processing time also affect production efficiency. In 2008, the overall time efficiency for Mumias was 83 percent, while the time efficiency for Muhoroni was only 63 percent (KSB, 2010).
In 2008, average factory costs for government-owned companies were 12,445 Ksh/tonne compared to 8,467 Ksh/tonne for private companies (KSB, 2010). However, average finance and administration costs were 14,072 Ksh/tonne for private companies, but only 11,559 Ksh/tonne for government-owned companies (KSB, 2010).
Although most factory revenue is generated through sugar sales, there has been some interest in moving toward industry diversification through the exploitation of sugarcane by-products, such as bagasses and molasses, for ethanol production and energy co-generation. However, high investment costs, uncompetitive price mechanisms, limited technology and a weak legal and regulatory framework are some of the main reasons why little has been achieved in this direction (KSI, 2009).
Sugar Distribution
Before liberalization of the sugar industry in 1992, marketing and distribution was controlled by the government through the Kenyan National Trading Corporation, which regulated producer and consumer prices and imports (KSB, 2010). Now, after liberalization, processed sugar reaches the end consumer through an integrated network of private wholesalers, retailers, importers and distributors. The ex-factory price paid by wholesalers incorporates the cost of the sugarcane (raw material inputs), milling, processing, packaging, factory operations, the factory’s margin, and government levies, which include a 16 percent Value Added Tax (VAT) and a 4 percent Sugar Development Levy (SDL) imposed by the KSB (KSB, 2010).
According to the KSB’s 2010 sugar value chain analysis, the main factor hindering sugar marketing is the high cost of transportation due to large distances traveled and poor road conditions, a distribution system controlled by few players and inadequate packaging and branding.
Even though sugar imports in Kenya are regulated through quotas and tariffs (which are discussed in the next section), the insufficient administration of quotas and high local retail prices have allowed importer “syndicates” to obtain profit margins that more than double those of local producers (MCI, 2008).
14
e. Policy Decisions and Measures The sugar industry in Kenya is closely linked to the government and is strongly influenced by domestic and international policies. After market liberalization in 1992, the government issued a set of temporary protective measures to help ease the sugar industry’s transition to full market liberalization. However, expiring import tariff and quota regulations have been extended to 2014, since Kenya’s sugar industry still cannot compete with more efficient producers in the international market (MCI, 2008; USDA, 2011).
The extension of these protective measures, granted in 2008/2009, was subject to certain conditions imposed by the COMESA Council and adopted by the GOK (KSI, 2009). These conditions, which have largely shaped the sector’s development policy in recent years, include the following:
a) Rising duty free import quota in tandem with a declining import tariff. b) Adoption of a privatization plan. c) Implementation of a sugarcane payment system based on sucrose content instead of weight. d) The adoption of a product diversification policy (e.g. co-generation and bio-fuel). e) Increase funding for research and extension. f) Increase funding for road infrastructure.
In addition, the GOK is required to report to the COMESA Council twice a year on industry performance and efforts made to improve the sector’s competitiveness (KSI, 2009).
Marketing and Price Policies
Currently, domestic sugar prices are inflated and are well above the international price for sugar due to tariffs and quotas applied to Kenya’s raw sugar imports (see Figure 8). While these high prices benefit local producers, they make raw sugar and sugar products more expensive for consumers. It is estimated that if the COMESA safeguards were lifted, the influx of sugar from other countries would drive domestic prices down by about 25 percent3, diminishing the profits of local factories4 (MCI, 2008).
3 Another analysis suggests that the impact may not be so large because COMESA exporters will continue to target more lucrative markets in the EU, US and Asia as world prices remain relatively high (USDA-GAIN Report, 2011). 4 Under 2008… Poner que solo Mumias y Kibos podrían competir si se abren los mercato… (MCI, 2008).
15
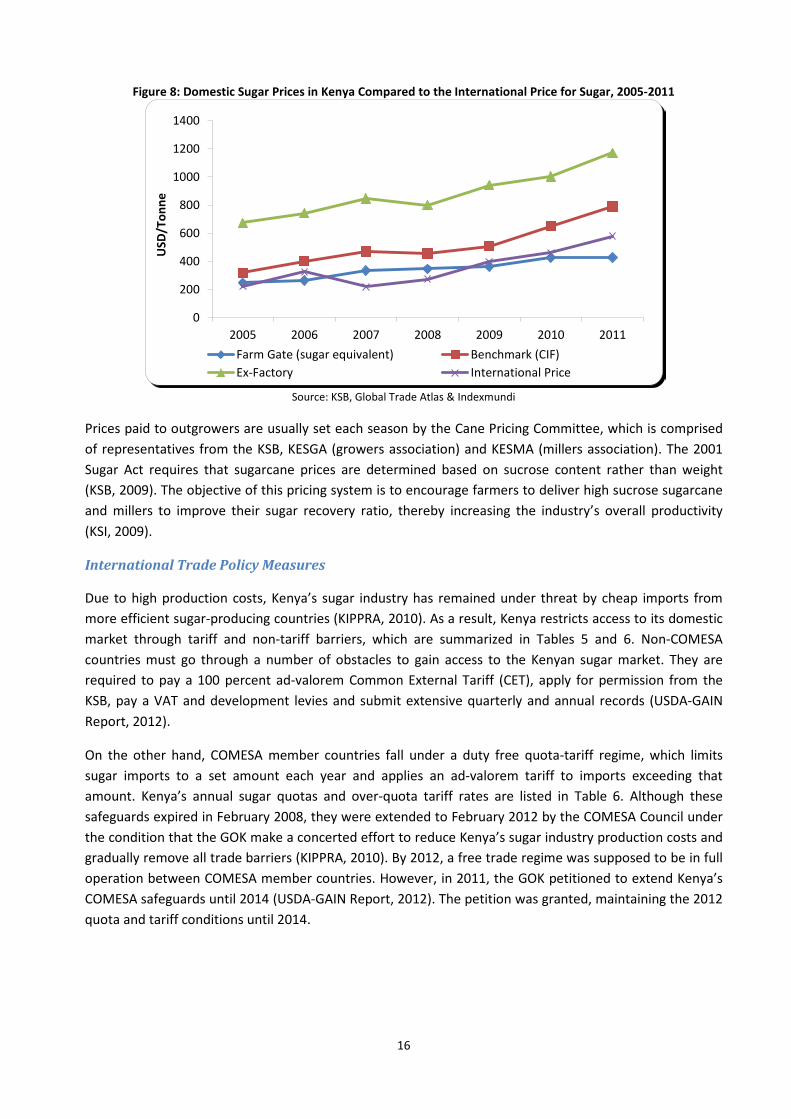
Figure 8: Domestic Sugar Prices in Kenya Compared to the International Price for Sugar, 2005-2011
Source: KSB, Global Trade Atlas & Indexmundi
Prices paid to outgrowers are usually set each season by the Cane Pricing Committee, which is comprised of representatives from the KSB, KESGA (growers association) and KESMA (millers association). The 2001 Sugar Act requires that sugarcane prices are determined based on sucrose content rather than weight (KSB, 2009). The objective of this pricing system is to encourage farmers to deliver high sucrose sugarcane and millers to improve their sugar recovery ratio, thereby increasing the industry’s overall productivity (KSI, 2009).
International Trade Policy Measures
Due to high production costs, Kenya’s sugar industry has remained under threat by cheap imports from more efficient sugar-producing countries (KIPPRA, 2010). As a result, Kenya restricts access to its domestic market through tariff and non-tariff barriers, which are summarized in Tables 5 and 6. Non-COMESA countries must go through a number of obstacles to gain access to the Kenyan sugar market. They are required to pay a 100 percent ad-valorem Common External Tariff (CET), apply for permission from the KSB, pay a VAT and development levies and submit extensive quarterly and annual records (USDA-GAIN Report, 2012).
On the other hand, COMESA member countries fall under a duty free quota-tariff regime, which limits sugar imports to a set amount each year and applies an ad-valorem tariff to imports exceeding that amount. Kenya’s annual sugar quotas and over-quota tariff rates are listed in Table 6. Although these safeguards expired in February 2008, they were extended to February 2012 by the COMESA Council under the condition that the GOK make a concerted effort to reduce Kenya’s sugar industry production costs and gradually remove all trade barriers (KIPPRA, 2010). By 2012, a free trade regime was supposed to be in full operation between COMESA member countries. However, in 2011, the GOK petitioned to extend Kenya’s COMESA safeguards until 2014 (USDA-GAIN Report, 2012). The petition was granted, maintaining the 2012 quota and tariff conditions until 2014.
0
200
400
600
800
1000
1200
1400
2005 2006 2007 2008 2009 2010 2011
USD
/Ton
ne
Farm Gate (sugar equivalent) Benchmark (CIF)Ex-Factory International Price
16

Table 5: Summary of Kenya’s Sugar Industry Trade Policies Tariffs and Quotas
COMESA Countries
Raw sugar imports from COMESA member countries are subject to a duty free quota and an ad-valorem over-quota tariff. The GOK is required to gradually raise its import quota, while lowering its over-quota tariff each year until 2014, when these safeguards expire.
Non-COMESA Countries
All imports from Non-COMESA countries are subject to a 100% ad-valorem Common External Tariff (CET), but not less than $200/tonne. Refined sugar imports from Non-COMESA countries are only subject to a 10% ad-valorem tariff after approved duty remission.
Non-tariff Barriers
Importer Registration
1. All sugar importers must be registered by the Kenya Sugar Board (KSB) and pay an annual fee of $126 (Kshs 100,000). 2. All industrial sugar importers must be members of the Kenya Association of Manufacturers (KAM), which is responsible for processing tax remission. KAM’s membership fee is based on annual turnover. 3. All industrial sugar importers must be listed on the East African Community list of industrial users in order to benefit from 90% remission of the above noted external tariff.
Import Permit An import permit is required for each consignment. All permits are approved by the KSB.
Application of Intent to Import Sugar
The GOK requires that all raw sugar importers submit a letter requesting approval to import sugar. Refined sugar importers must apply to KAM requesting approval to import sugar as a raw material.
Quarterly and Annual Import Returns
Raw sugar importers must submit quarterly returns to KSB, and refined sugar importers must submit annual returns to KAM and the Ministry of Finance. The returns must include quantities imported and usage.
Value Added Tax (VAT) A 16% ad-valorem VAT is levied on all sugar imports.
Sugar Development Levy (SDL) A 4% ad-valorem tax is levied on all sugar imports, except for industrial refined sugar imports.
Raw Sugar vs. Refined Sugar Shipments Controlled by GOK
The GOK sets an annual limit on the amount of refined sugar that can be imported under the 90% remission of the above noted external tariff. The GOK grants specific high-value product producers access to this refined sugar.
USDA-GAIN Report, 2011
Table 6: Kenya’s Sugar Quotas and Over-Quota Tariff Rates Applied to Imports from COMESA Member Countries
Year Quota (1000 tonnes) Tariff Rate (%)
Before 2008 200 100 2008/09 220 100 2009/10 260 70 2010/11 300 40 2011/12 340 10 2012/13 340 10 2013/14 340 10 2014/15 Free market 0
Source: KSI, 2009 & USDA-GAIN Report, 2012
Taxes and Subsidies to Production
In Kenya, sugar is not classified as a basic food, so it is subject to a 16 percent VAT. Additionally, the GOK established the Sugar Development Fund (SDF) in 1992, which is financed by a Sugar Development Levy (SDL) imposed on both domestic and imported sugar (GOK, 2007). The levy was initially set at 7 percent, but was reduced to 4 percent in November 2007 (GAINS, 2008). According to the KSB (2009), the total 4 percent SDL is distributed as follows:
17

a) 0.71% - Factory Development Rehabilitation b) 0.94% - Research and Extension c) 0.66% - Sugarcane Development and Maintenance d) 0.29% - Industry Infrastructure e) 1.40% - Kenya Sugar Board Administration
In addition to administration costs, the SDL has been used mainly to increase the total land planted to sugarcane, rehabilitate some factories and improve roads and infrastructure (KSB, 2009). However, the SDL cannot be taken as a direct subsidy to producers because it is a loan that has to be refunded.
Finally, the GOK taxes most agricultural inputs, but does not provide direct subsidies to sugarcane producers in order to offset these high costs
.
18

3. DATA REQUIREMENTS, DESCRIPTION AND CALCULATION OF INDICATORS
To calculate the indicators needed to estimate incentives or disincentives to production (NRPs) as well as Market Development Gaps (MDGs), several types of data are needed. They were collected and are presented and explained hereafter.
Trade Status of The Product and Trade Flow Analyzed
Kenya was a net importer of raw sugar throughout the entire 2005-2011 period, with most imports proceeding from Egypt (57%) and Swaziland (30%), followed by Malawi and Zimbabwe (3% each). Being the main point of entry of imported raw sugar the Port of Mombasa situated at 448 kilometers from the country capital, Nairobi.
Sugar factories usually are located within the cane production areas. In the case of Kenya, each factory has their own cane production land, but mainly obtain their cane input from smallholder farmers around the factory (outgrowers). After processing, raw sugar goes to a wholesale market and/or to industrial consumption for the production of beverages, confectionery, pharmaceutics, among others. Due to the highly protected sugar industry, this analysis will focus on the outgrower and factory level, in order to analyze the market incentives and disincentives for farmers and factories.
Since the principal wholesale market for national and imported sugar is Nairobi, the analysis set this city as the Point of Competition. However, as this analysis is not primarily focused on the wholesalers’ incentives and disincentives, the ex-factory price was taken as the price at the point of competition in this analysis5.
For the purpose of calculating access costs, Kakamega in Western Kenya, at 396 kilometers from Nairobi, was selected as the local sugar production point. This point was selected because it is situated at the heart of a major cane production zone, besides the Mumias Sugar Company is situated there6. The assumed trade flow analyzed is illustrated in Figure 9.
5 Adding the transport costs from the factory to the wholesale market. 6 Mumias production account for about 45 percent of the national production, representing around 35 percent of the national sugar market.
19

Figure 9: Trade Flow Analyzed for Kenyan Sugar.
Source: Author’s own elaboration using Google maps, 2012
BENCHMARK PRICES
Observed
The basis for calculating a reference parity price to determine whether sugar producers receive market incentives or disincentives is to establish a benchmark price, which represents the market price for sugar that would prevail in the absence of domestic policy interventions and market inefficiencies. Since Kenya was a net importer of sugar during the seven years under study, the benchmark price considered is the CIF price of raw sugar7.
The CIF prices were obtained from the Kenya Sugar Board and then verified for consistency using FAOSTAT, UN Comtrade and Global Trade Atlas data. The prices for “Raw sugar not containing added flavoring or coloring matter: -- Cane sugar”, HS code 17011, were used. These are shown in Table 8 and Figure 108.
Table 8: CIF prices Raw sugar in Kenya (USD/tonne), 2005-2011.
2005 2006 2007 2008 2009 2010 2011 USD/Tonne 320.36 400.22 470.38 456.43 507.21 651.14 790.69
Source: KSB. Commodity under HS nomenclature: 170111.
7 Even though Kenya is also importing refined sugar it wasn’t considered because Kenya sugar industry only produces raw sugar. 8 This price doesn’t include the VAT or the SDL.
Production Zone (Farm Gate)
Mumias Factory (Processing)
Nairobi (Point of Competition)
Mumbasa (Border)
Uganda
Tanzania
20

Figure 10: Benchmark Price for Sugar in Kenya (USD/tonne), 2005-2011.
Source: KSB
Adjusted
No adjustments to benchmark prices were made. DOMESTIC PRICES Two domestic prices are required for this analysis – the raw sugar price at the point of competition and the price for sugarcane at the farm gate.
Point of Competition
The point of competition is set at Nairobi. However, in order to bring the analysis closer to the factory level, the prices for raw sugar at the point of competition were assumed to be the average national prices paid at the factory gate (ex-factory prices). An Ex-factory Price at Point of Competition was constructed adding the transportation costs from Kakamega to Nairobi based on the World Bank (2009) study for maize in the region.
Ex-factory prices were provided by the Kenya Sugar Board (KSB). Following the international price increase and protected by the country trade measures, the local factory prices in the period increased from 50,900 KSh per tonne (637 USD) in 2005 to 104,060 Ksh per tonne (1171 USD) in 2011. These figures are shown in Table 9 and Figure 11.
0
100
200
300
400
500
600
700
800
900
2005 2006 2007 2008 2009 2010 2011
CIF Raw Sugar
21

Table 9: Domestic Ex-factory Prices for Raw Sugar in Kenya (KSh/tonne), 2005-2011. Concept Unit 2005 2006 2007 2008 2009 2010 2011
(A) Ex-Factory price Ksh/ tonne of sugar 50,900.0 53,540.0 57,063.0 55,240.0 72,920.0 79,580.0 104,060.0
From Nairobi to Kakamega (396 kilometres)
Regular transport costs Ksh/ tonne of sugar 2,769.31 2,802.24 2,728.20 3,226.95 3,988.52 4,252.39 5,434.77
Non-Tariff costs Ksh/ tonne of sugar 235.09 237.88 231.60 273.93 338.58 360.98 461.36
(B) Transport (Point of Competition-Factory Gate)
Ksh/ tonne of sugar 3,004.40 3,040.12 2,959.80 3,500.88 4,327.10 4,613.38 5,896.13
Ex-Factory Price at Point of Competition (A+B)
Ksh/ tonne of sugar 53,904.4 56,580.1 60,022.8 58,740.8 77,247.1 84,193.3 109,956.1
Source: KSB and WB, 2009
Figure 11: Ex-factory Prices for Raw Sugar in Kenya (KShs/tonne), 2005-2011.
Source: KSB and WB, 2009
Farm Gate National average farm gate prices for sugarcane were provided by the KSB (see Table 10). The farm gate prices also revealed a steady increase, but only form 1,910 KSh per tonne (25 USD) in 2005 to 3,287 Ksh per tonne (39 USD) in 2011. The trend is shown in Figure 12.
Table 10: Domestic Farm Gate Prices for sugarcane in Kenya (KSh/tonne), 2005-2011. Source 2005 2006 2007 2008 2009 2010 2011
KSh/Tonne of cane 1,910.0 2,002.0 2,250.0 2,400.0 2,739.0 3,094.0 3,487.0 Source: KSB
0
20
40
60
80
100
120
2005 2006 2007 2008 2009 2010 2011
1000
Ksh
/Ton
ne
Ex-Factory Price Ex-Factory Price at POC
22

Figure 12: Farm Gate Prices for Sugarcane in Kenya (KShs/tonne), 2005-2011.
Source: KSB
EXCHANGE RATES
Observed
Average nominal exchange rates between the Kenya Shilling and the US Dollar were used in this analysis. The average rates for each year under review (shown in Table 11) were obtained from the World Bank’s World Development Indicators database.
Table 11: Average Nominal Exchange Rates, 2005-2010. 2005 2006 2007 2008 2009 2010
KShs/USD 75.55 72.10 67.32 69.18 77.35 79.23 Source: World Bank
Adjusted
No adjustments to exchange rates were made.
ACCESS COSTS
Observed
Observed access costs include all the costs associated with bringing the commodity from Mombasa (border) to Nairobi (point of competition), as well as from the sugar production zone (farm gate) to Nairobi (point of competition), passing through the Mumia Sugar Company (factory gate) in Kakamega in West Kenya. These costs mainly include transaction costs, processing, storage and handling, importing fees, non-tariff costs and transport.
Border to Point of competition
Table 12 describes all the import costs after the sugar reaches the port of Mumbasa. All costs are in Ksh per tonne and based on the CIF prices used in this study. Because the ex-factory prices used in this analysis (explained later) include the national VAT and SDL, those were not treated as an import tariff so they were
0
500
1,000
1,500
2,000
2,500
3,000
3,500
4,000
2005 2006 2007 2008 2009 2010 2011
KSh/
Tonn
e
Sugar Cane FG Price
23
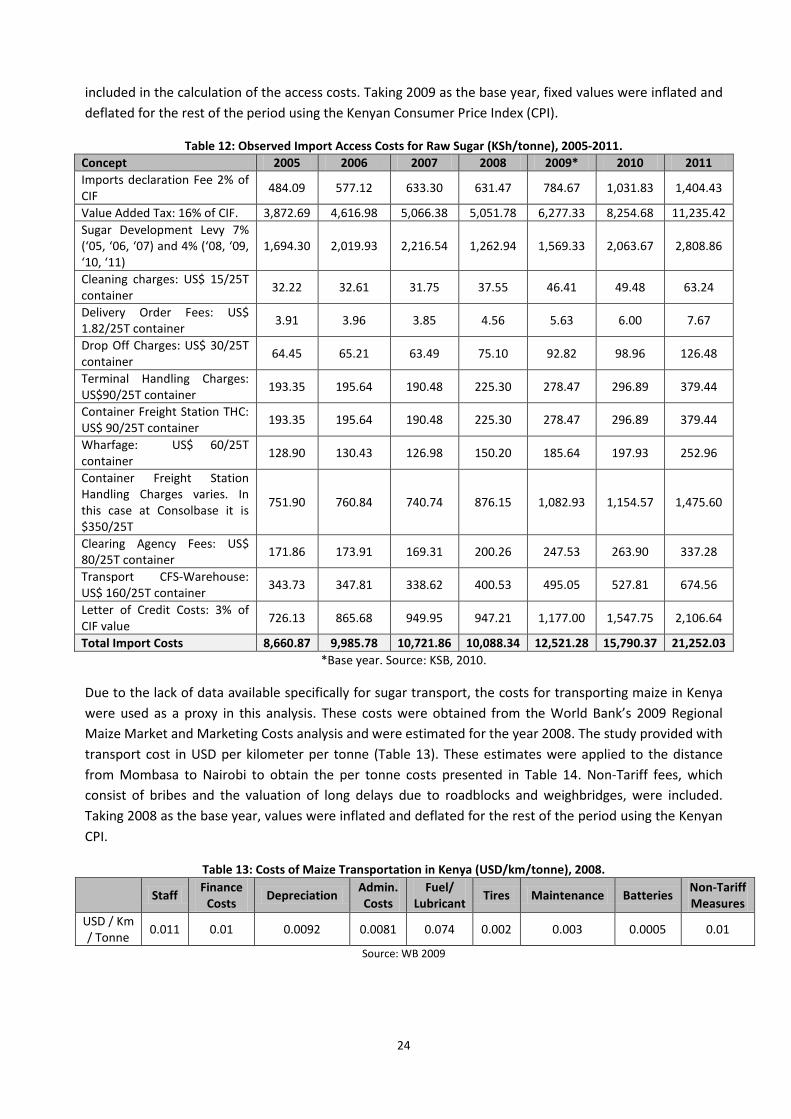
included in the calculation of the access costs. Taking 2009 as the base year, fixed values were inflated and deflated for the rest of the period using the Kenyan Consumer Price Index (CPI).
Table 12: Observed Import Access Costs for Raw Sugar (KSh/tonne), 2005-2011. Concept 2005 2006 2007 2008 2009* 2010 2011 Imports declaration Fee 2% of CIF 484.09 577.12 633.30 631.47 784.67 1,031.83 1,404.43
Value Added Tax: 16% of CIF. 3,872.69 4,616.98 5,066.38 5,051.78 6,277.33 8,254.68 11,235.42 Sugar Development Levy 7% (‘05, ‘06, ‘07) and 4% (‘08, ‘09, ‘10, ‘11)
1,694.30 2,019.93 2,216.54 1,262.94 1,569.33 2,063.67 2,808.86
Cleaning charges: US$ 15/25T container 32.22 32.61 31.75 37.55 46.41 49.48 63.24
Delivery Order Fees: US$ 1.82/25T container 3.91 3.96 3.85 4.56 5.63 6.00 7.67
Drop Off Charges: US$ 30/25T container 64.45 65.21 63.49 75.10 92.82 98.96 126.48
Terminal Handling Charges: US$90/25T container 193.35 195.64 190.48 225.30 278.47 296.89 379.44
Container Freight Station THC: US$ 90/25T container 193.35 195.64 190.48 225.30 278.47 296.89 379.44
Wharfage: US$ 60/25T container 128.90 130.43 126.98 150.20 185.64 197.93 252.96
Container Freight Station Handling Charges varies. In this case at Consolbase it is $350/25T
751.90 760.84 740.74 876.15 1,082.93 1,154.57 1,475.60
Clearing Agency Fees: US$ 80/25T container 171.86 173.91 169.31 200.26 247.53 263.90 337.28
Transport CFS-Warehouse: US$ 160/25T container 343.73 347.81 338.62 400.53 495.05 527.81 674.56
Letter of Credit Costs: 3% of CIF value 726.13 865.68 949.95 947.21 1,177.00 1,547.75 2,106.64
Total Import Costs 8,660.87 9,985.78 10,721.86 10,088.34 12,521.28 15,790.37 21,252.03 *Base year. Source: KSB, 2010.
Due to the lack of data available specifically for sugar transport, the costs for transporting maize in Kenya were used as a proxy in this analysis. These costs were obtained from the World Bank’s 2009 Regional Maize Market and Marketing Costs analysis and were estimated for the year 2008. The study provided with transport cost in USD per kilometer per tonne (Table 13). These estimates were applied to the distance from Mombasa to Nairobi to obtain the per tonne costs presented in Table 14. Non-Tariff fees, which consist of bribes and the valuation of long delays due to roadblocks and weighbridges, were included. Taking 2008 as the base year, values were inflated and deflated for the rest of the period using the Kenyan CPI.
Table 13: Costs of Maize Transportation in Kenya (USD/km/tonne), 2008.
Staff Finance Costs Depreciation Admin.
Costs Fuel/
Lubricant Tires Maintenance Batteries Non-Tariff Measures
USD / Km / Tonne 0.011 0.01 0.0092 0.0081 0.074 0.002 0.003 0.0005 0.01
Source: WB 2009
24
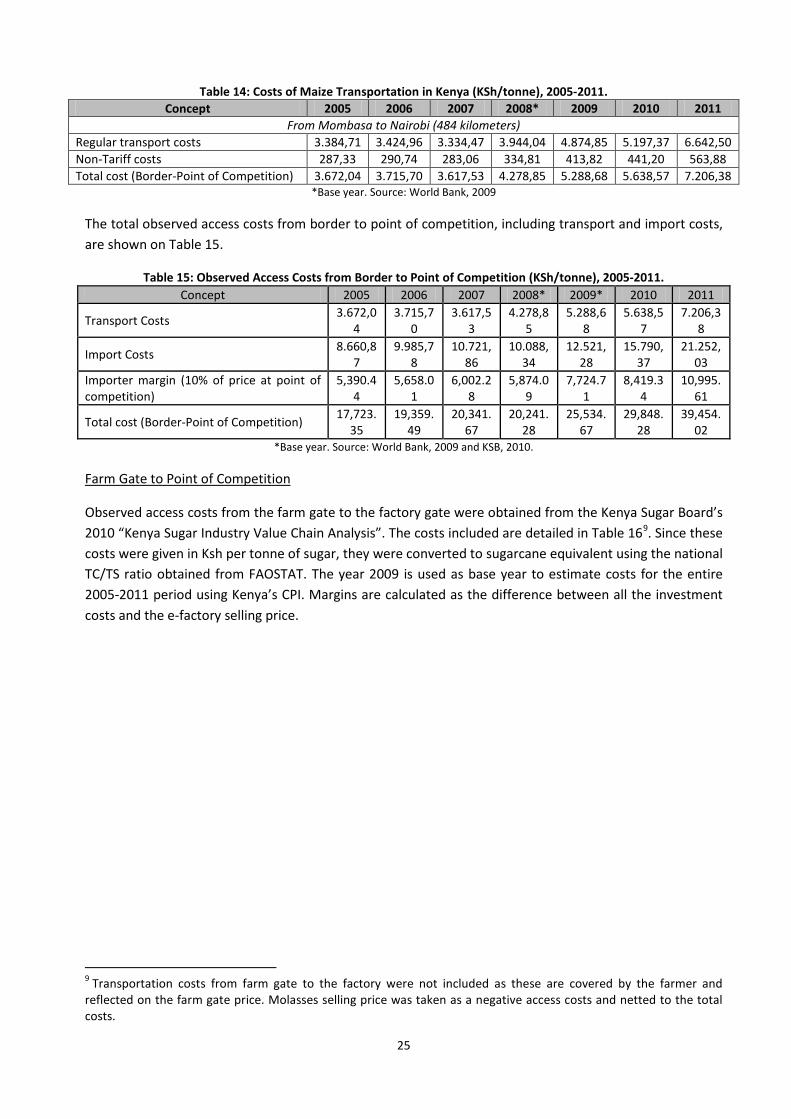
Table 14: Costs of Maize Transportation in Kenya (KSh/tonne), 2005-2011. Concept 2005 2006 2007 2008* 2009 2010 2011
From Mombasa to Nairobi (484 kilometers) Regular transport costs 3.384,71 3.424,96 3.334,47 3.944,04 4.874,85 5.197,37 6.642,50 Non-Tariff costs 287,33 290,74 283,06 334,81 413,82 441,20 563,88 Total cost (Border-Point of Competition) 3.672,04 3.715,70 3.617,53 4.278,85 5.288,68 5.638,57 7.206,38
*Base year. Source: World Bank, 2009
The total observed access costs from border to point of competition, including transport and import costs, are shown on Table 15.
Table 15: Observed Access Costs from Border to Point of Competition (KSh/tonne), 2005-2011. Concept 2005 2006 2007 2008* 2009* 2010 2011
Transport Costs 3.672,04
3.715,70
3.617,53
4.278,85
5.288,68
5.638,57
7.206,38
Import Costs 8.660,87
9.985,78
10.721,86
10.088,34
12.521,28
15.790,37
21.252,03
Importer margin (10% of price at point of competition)
5,390.44
5,658.01
6,002.28
5,874.09
7,724.71
8,419.34
10,995.61
Total cost (Border-Point of Competition) 17,723.35
19,359.49
20,341.67
20,241.28
25,534.67
29,848.28
39,454.02
*Base year. Source: World Bank, 2009 and KSB, 2010.
Farm Gate to Point of Competition
Observed access costs from the farm gate to the factory gate were obtained from the Kenya Sugar Board’s 2010 “Kenya Sugar Industry Value Chain Analysis”. The costs included are detailed in Table 169. Since these costs were given in Ksh per tonne of sugar, they were converted to sugarcane equivalent using the national TC/TS ratio obtained from FAOSTAT. The year 2009 is used as base year to estimate costs for the entire 2005-2011 period using Kenya’s CPI. Margins are calculated as the difference between all the investment costs and the e-factory selling price.
9 Transportation costs from farm gate to the factory were not included as these are covered by the farmer and reflected on the farm gate price. Molasses selling price was taken as a negative access costs and netted to the total costs.
25

Table 16: Observed Access Costs for Sugarcane from Farm Gate to Factory Gate (Ksh/tonne of cane), 2005-2011 Access Costs from Farm Gate to Factory Gate
Concept 2005 2006 2007 2008 2009* 2010 2011
Factory Production 108.41 118.50 117.89 135.89 146.51 143.19 163.37 Factory Boiler maintenance operations 72.27 79.00 78.59 90.59 97.67 95.46 108.91 Factory Administration 151.77 165.90 165.05 190.25 205.11 200.47 228.71 Factory Electrical and Instrument 115.63 126.40 125.75 144.95 156.27 152.74 174.26 Factory Engineering 57.82 63.20 62.88 72.47 78.14 76.37 87.13 Factory Maintenance 65.04 71.10 70.74 81.53 87.90 85.91 98.02 Factory Milling and Processing 144.54 158.00 157.19 181.19 195.34 190.92 217.82 Factory Packaging 72.27 79.00 78.59 90.59 97.67 95.46 108.91 Factory Process House 86.73 94.80 94.31 108.71 117.20 114.55 130.69 Factory quality control 36.14 39.50 39.30 45.30 48.84 47.73 54.46 At Finance and Administration Level 881.71 963.78 958.86 1,105.24 1,191.58 1,164.62 1,328.71 At Finance Charges Level 187.91 205.40 204.35 235.54 253.94 248.20 283.17 Total Processing Costs 1,980.24 2,164.56 2,153.50 2,482.25 2,676.17 2,615.62 2,984.16
Profit Margin 1,284.77 1,444.85 1,302.62 649.31 1,706.95 1,589.02 3,078.30
(a) Grand Total 3,265.01 3,609.41 3,456.11 3,131.56 4,383.12 4,204.64 6,062.46 (b) Molasses sell price** 47.84 53.92 51.50 54.13 44.65 43.01 49.58
Netted Access Costs (a-b) 3,217.17 3,555.48 3,404.62 3,077.43 4,338.47 4,161.63 6,012.88
*Base year for factory costs. **In cane equivalent using the annual average of tonnes of molasses per tonne of cane obtained with FAOSTAT data. Source: KSB 2010 and FAOSTAT.
Adjusted
Adjusted access costs represent the costs of transporting the commodity in an efficient, well-functioning market. Thus, all taxes, fees (excluding fees for services), subsidies and non-tariff measures are omitted. Additionally, all excessive costs and profit margins are adjusted. Border to Point of Competition
To calculate the adjusted access costs from Mombasa to Nairobi, all non-tariff costs were omitted, thereby, eliminating the cost of bribes and long delays due to roadblocks and weighbridges. However, no excessive margins or other costs were identified. The total adjusted access costs are shown in Table 17.
Table 17: Adjusted Access Costs from Border to Point of Competition (Ksh/tonne), 2005-2010 Concept 2005 2006 2007 2008* 2009* 2010 2011
From Mombasa to Nairobi (484 kilometres)
Transport Costs 3.384,71 3.424,96
3.334,47
3.944,04
4.874,85
5.197,37
6.642,50
Import Costs 14,051.3 15,643.8
16,724.1
15,962.4
20,246.0
24,209.7
32,247.6
Total cost (Border-Point of Competition)
17,436.02
19,068.7
20,058.6
19,906.4
25,120.8
29,407.0
38,890.1
*Base year. Source: WB, 2009 and KSB, 2010.
Farm Gate to Point of Competition
Sugar factories profit margins ranged from 13 to 48 percent of the investment cost during the period analyzed. MAFAP methodology suggest that profit margins higher than 10 percent of the investment cost should be adjusted accordingly. The adjusted access costs are shown in Table 18.
26

Table 18: Adjusted Access Costs from Farm Gate to Point of Competition (Ksh/tonne), 2005-2010 Access Costs from Farm Gate to Factory Gate
Concept 2005 2006 2007 2008 2009* 2010 2011
Total Processing Costs 1,980.24 2,164.56 2,153.50 2,482.25 2,676.17 2,615.62 2,984.16
Adjusted Profit Margin 389.02 416.66 440.35 488.23 541.52 570.96 647.12
(a) Adjusted Grand Total 2,369.26 2,581.22 2,593.85 2,970.48 3,217.68 3,186.58 3,631.27 (b) Molasses sell price** 47.84 53.92 51.50 54.13 44.65 43.01 49.58 Adjusted Netted Access Costs (a-b) 2,321.42 2,527.29 2,542.35 2,916.35 3,173.03 3,143.57 3,581.70
*Base year for factory costs. **In cane equivalent using the annual average of tonnes of molasses per tonne of cane obtained with FAOSTAT data. Source: KSB 2010 and FAOSTAT.
EXTERNALITIES
No externalities were taken into account in this analysis.
BUDGET AND OTHER TRANSFERS
Government is the owner of a mayor part of the Kenyan sugar companies. Hence, there were no specific budget transfers to sugar stakeholders as subsidies or price support.
QUALITY AND QUANTITY ADJUSTMENTS
The reference prices in Ksh per tonne of sugar were converted to sugarcane equivalent at the point of competition. The conversion factor applied was Kenya’s TC/TS factor . Access costs from the farm gate to the factory gate were given in terms of sugar. These were also converted to sugarcane equivalent using Kenya’s TS/TC ratio. Local and regional conversion factors are shown in Table 19.
Table 19. Kenya and Kenya’s Main Trade Partners Cane to Sugar Conversion Ratios, 2005-2011. Country Unit 2005 2006 2007 2008 2009 2010 2011*
Kenya TC/TS 9,84 9,54 10,00 9,99 10,24 10,90 10,90 TS/TC 0,102 0,105 0,100 0,100 0,098 0,092 0,092
Main Trade Partners (Egypt, Swaziland and
Malawi)
Weighted Average TC/TS 9,56 9,70 8,92 8,85 8,74 7,99 8,37
Weighted Average TS/TC 0,10 0,10 0,11 0,11 0,11 0,13 0,12
*Estimated using the average of the previous two years for trade partners. Source: FAOSTAT and USDA (2012)
There is no quality difference identified between local and imported raw sugar.
Following the discussion above, a summary of the main data sources and methodological decisions taken for this analysis of price incentives and disincentives is provided below.
27
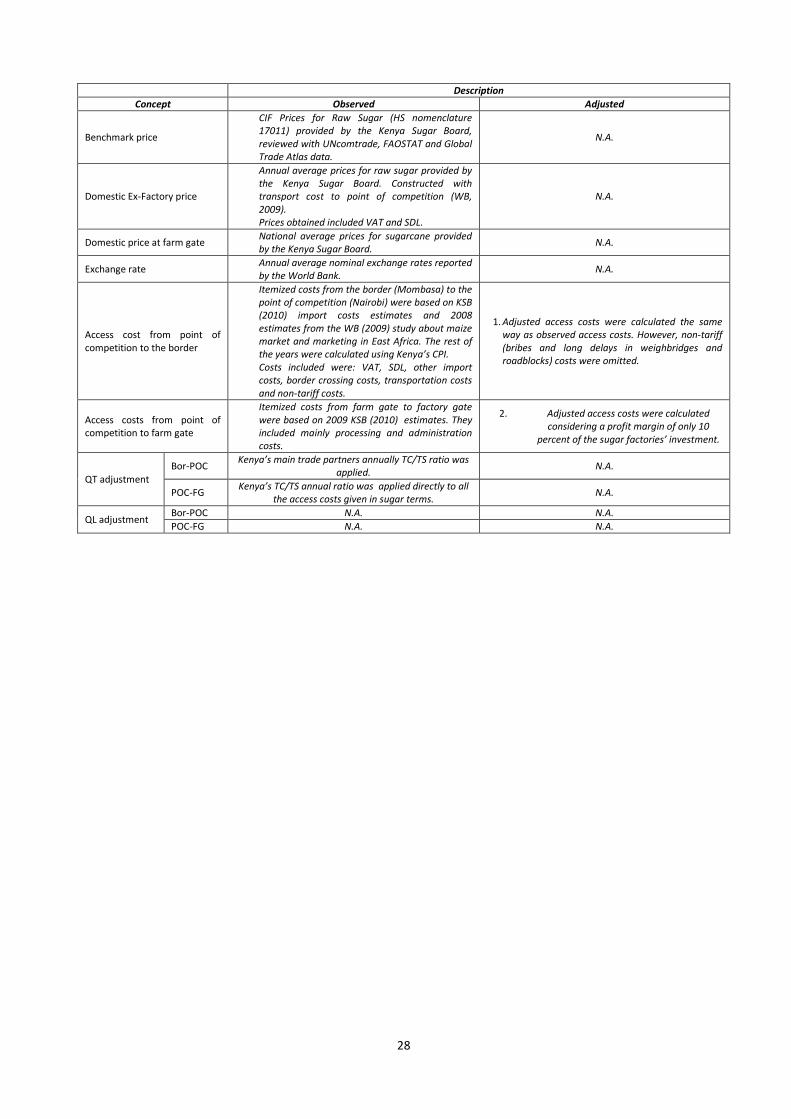
Description Concept Observed Adjusted
Benchmark price
CIF Prices for Raw Sugar (HS nomenclature 17011) provided by the Kenya Sugar Board, reviewed with UNcomtrade, FAOSTAT and Global Trade Atlas data.
N.A.
Domestic Ex-Factory price
Annual average prices for raw sugar provided by the Kenya Sugar Board. Constructed with transport cost to point of competition (WB, 2009). Prices obtained included VAT and SDL.
N.A.
Domestic price at farm gate National average prices for sugarcane provided by the Kenya Sugar Board. N.A.
Exchange rate Annual average nominal exchange rates reported by the World Bank. N.A.
Access cost from point of competition to the border
Itemized costs from the border (Mombasa) to the point of competition (Nairobi) were based on KSB (2010) import costs estimates and 2008 estimates from the WB (2009) study about maize market and marketing in East Africa. The rest of the years were calculated using Kenya’s CPI. Costs included were: VAT, SDL, other import costs, border crossing costs, transportation costs and non-tariff costs.
1. Adjusted access costs were calculated the same way as observed access costs. However, non-tariff (bribes and long delays in weighbridges and roadblocks) costs were omitted.
Access costs from point of competition to farm gate
Itemized costs from farm gate to factory gate were based on 2009 KSB (2010) estimates. They included mainly processing and administration costs.
2. Adjusted access costs were calculated considering a profit margin of only 10
percent of the sugar factories’ investment.
QT adjustment Bor-POC Kenya’s main trade partners annually TC/TS ratio was
applied. N.A.
POC-FG Kenya’s TC/TS annual ratio was applied directly to all the access costs given in sugar terms. N.A.
QL adjustment Bor-POC N.A. N.A. POC-FG N.A. N.A.
28

CALCULATION OF INDICATORS
The indicators and methodology applied in this analysis are described in Box 1. A detailed description of the calculations and data requirements is available on the MAFAP website or by clicking here.
Box 1: MAFAP POLICY INDICATORS MAFAP uses four measures of market price incentives or disincentives. First, it uses two observed nominal rates of protection (NRPs), one at the wholesale and one at the farm gate level. These compare observed domestic prices to reference prices, which represent the market price for the commodity that would prevail in the absence of domestic policy interventions and structural inefficiencies along the commodity’s marketing chain.
Reference prices are calculated from a benchmark price, such as an import or export price expressed in local currency and brought to the wholesale and farm gate levels with adjustments for quality, quantity, market access costs, shrinkage and loss.
The Nominal Rate of Protection - observed (NRPo) is the price gap between the domestic market price and the reference price divided by the reference price at both the farm gate and wholesale levels:
𝑁𝑅𝑃𝑜𝑓𝑔 = (𝑃𝑓𝑔 − 𝑅𝑃𝑜𝑓𝑔) 𝑅𝑃𝑜𝑓𝑔; ⁄ 𝑁𝑅𝑃𝑜𝑤ℎ = (𝑃𝑤ℎ − 𝑅𝑃𝑜𝑤ℎ) 𝑅𝑃𝑜𝑤ℎ; ⁄
The NRPofg captures all trade and domestic policies, as well as other structural factors affecting incentives and disincentives for the farmer, while the NRPowh helps identify where incentives and disincentives may be distributed along the commodity’s marketing chain.
Second, MAFAP uses the Nominal Rate of Protection - adjusted (NRPa) at the wholesale and farm gate level, in which the reference prices are adjusted to eliminate excessive access costs and other distortions found in developing country market supply chains. The equations to estimate the adjusted rates of protection, however, follow the same general pattern:
𝑁𝑅𝑃𝑎𝑓𝑔 = (𝑃𝑓𝑔 − 𝑅𝑃𝑎𝑓𝑔) 𝑅𝑃𝑎𝑓𝑔; ⁄ 𝑁𝑅𝑃𝑎𝑤ℎ = (𝑃𝑤ℎ − 𝑅𝑃𝑎𝑤ℎ) 𝑅𝑃𝑎𝑤ℎ; ⁄
MAFAP also analyzes market development gaps (MDGs) caused by market power, exchange rate misalignments, externalities and excessive access costs, which when added to the observed reference prices generate the adjusted reference prices and NRPa indicators. A comparison of the different rates of protection identifies where market development gaps can be found and reduced.
29

Nominal Rates of Protection were calculated and the results are presented in Tables 20-22.
Table 20 MAFAP Price Gaps for Sugar in Kenya (KSh/tonne), 2005-2011
2005 2006 2007 2008 2009 2010 2011 Trade status for the year m m m m m m m Observed price gap at competition point 11,976.73 8,364.49 8,016.28 6,925.98 12,479.10 2,753.37 280.73
Adjusted price gap at competition point 12,264.06 8,655.23 8,299.34 7,260.78 12,892.93 3,194.57 844.61
Observed price gap at farm gate 864.38 504.11 454.13 288.85 751.56 (213.60) (564.90) Adjusted price gap at farm gate (2.16) (493.61) (379.83) 161.29 (373.46) (1,191.19) (2,944.34)
Table 21: MAFAP Nominal Rates of Protection (NRPs) for Sugar in Kenya, 2005-2011
2005 2006 2007 2008 2009 2010 2011 Trade status for the year m m m m m m m Observed NRP at factory gate 28.57% 17.35% 15.41% 13.37% 19.27% 3.38% 0.26% Adjusted NRP at factory gate 29.45% 18.06% 16.05% 14.10% 20.03% 3.94% 0.77% Observed NRP at farm gate 82.67% 33.65% 25.29% 13.68% 37.82% -6.46% -13.94% Adjusted NRP at farm gate -0.11% -19.78% -14.44% 7.20% -12.00% -27.80% -45.78%
Table 22: MAFAP Market Development Gaps for Sugar in Kenya (KSh/tonne), 2005-2011
2005 2006 2007 2008 2009 2010 2011 Trade status for the year m m m m m m m International markets gap (IRG) - - - - - - - Exchange policy gap (ERPG) - - - - - - - Access costs gap to competition point (ACGwh) 287.33 290.74 283.06 334.81 413.82 441.20 563.88
Access costs gap to farm gate (ACGfg) (1,153.86) (1,288.46) (1,117.02) (462.37) (1,538.84) (1,418.79) (2,943.32) Externality gap - - - - - - -
30

4. INTERPRETATION OF INDICATORS Figures 12-14 show the results for the set of MAFAP indicators generated, which include price gaps, Nominal Rates of Protection (NRPs) and Market Development Gaps (MDGs) at the point of competition and farm gate. Price gaps are market price differentials between the commodity domestic and reference parity prices in each respective year. More conceptually, they provide an absolute measure of the extent to which producers are protected under the existing market conditions and structure, while NRPs express this measure of protection as ratios that are comparable across countries and commodities. MDGs measure the gap between the observed and adjusted access costs, which help identify potential inefficiencies along the value chain that may be affecting the level of protection provided to producers and factories, as well as the overall marketability of sugar in Kenya.
Price Gaps and Nominal Rates of Protection (NRPs) at Point of Competition
At the point of competition (ex-factory at competition point), the average observed and adjusted NRP throughout the period under review was 13.9 and 14.6 percent, respectively. As shown in Figures 12-13, the observed price gaps and NRPs were positive in all years, indicating that sugar factories are receiving market incentives and protection. However, the trend shows a constant decline in the observed NPR, being of 28 percent at the beginning of the studied period and of just 0.2 percent at the end. This might be due to the increasing international market liberalization and lack of improvement on the industry efficiency.
Price Gaps and Nominal Rates of Protection (NRPs) at Farm Gate
At the farm gate level, the average observed and adjusted NRP throughout the period under review were 24.6 and -16.1 percent, respectively. As shown in Figures 13-14, the observed price gaps and NRPs were positive in all years, indicating that sugarcane farmers are receiving market incentives. The trend show a constant decline in the NRP at the farm gate, being of more than 82 percent at the beginning of the period and declining up -13.9 percent at the end. This show that farmers received benefits from the national protective policy; the high margins earned by the factories allow them to pay a higher price to sugar cane farmers. However, as the government protective policy decreased farmers’ NRPs showed a consequently decreased. The adjusted NRPs show a different story. As the main adjustment was made at the factories’ profit margin, this show a alternative scenario where margins are lower (maybe due to more direct competition with the international market), and in consequence, NRPs received by the farmers diminish.
Price Dynamics at Point of Competition and Farm Gate
This situation shown in the analysis is inconsistent with the farmers’ performance, as they highly increased sugarcane production and land productivity throughout the period, in contrast with the industry efficiency decrease.
In general, sugar prices, international and domestic, showed a positive trend through all the period. The sector bad performance is specifically due to the sugar companies’ inefficiency. As farmers highly increased sugarcane production and land productivity throughout the period, and local sugar consumption growth rate had remained high, the decreasing NRP are mainly explain by the incapacity of the sugar companies to improve their efficiency.
31

Figure 12: Observed and Adjusted Price Gaps at Point of Competition and Farm Gate (KShs), 2005-2010
Source: Author’s own calculations using data as described above.
Figure 13: Observed and Adjusted NRPs at Point of Competition and Farm Gate (%), 2005-2010
Source: Author’s own calculations using data as described above.
Market Development Gaps (MDGs)
The positive access costs gaps at Point of Competition are due to the non-tariff costs from Mombasa to Nairobi. The adjusted positive gaps show that less access costs were subtracted from the benchmark price to construct the reference price. Thus non-tariff costs were acting as a market inefficient protection barrier
-4,000
-2,000
0
2,000
4,000
6,000
8,000
10,000
12,000
14,000
2005 2006 2007 2008 2009 2010 2011
Pric
e G
ap (K
Sh/T
onne
) Observed price gap at competition point
Adjusted price gap at competition point
Observed price gap at farm gate
Adjusted price gap at farm gate
-40%
-20%
0%
20%
40%
60%
80%
100%
2005 2006 2007 2008 2009 2010
Nom
inal
Rat
e of
Pro
tect
ion
(%)
Observed NRP at factory gate Adjusted NRP at factory gate
Observed NRP at farm gate Adjusted NRP at farm gate
32

from imports. That is why Adjusted NRPs to both, farmer and factory were higher. This gaps show a general increasing trend during the period under review. This trend is mainly explained by the use of Kenya’s PCI for inflating and deflating the available data for the year 2008 to estimate the value of the other years. The identified access costs gaps doesn´t represent an important proportion of the observed access costs (2 percent). However, this might be only due to the lack of complete information regarding non-tariff access costs and/or prove of excessive margins in the imported sugar value chain.
The access costs gaps at Farm Gate show the strong impact of the highly protected sugar industry structure on the farmers.
Figure 14: Access Costs Gap to Farm Gate and Competition Point (KShs/tonne), 2005-2010.
Source: Author’s own calculations using data as described above.
-867 -998
-834
-128
-1,125 -978
29 30 28 34 40 40
-896 -1,028
-862
-161
-1,165 -1,018
-1,400
-1,200
-1,000
-800
-600
-400
-200
0
200
2005 2006 2007 2008 2009 2010
Ksh/
tonn
e
Access costs gap from farm gate to factory gateAccess costs gap from factory gate to border
33

5. PRELIMINARY CONCLUSIONS AND RECOMMENDATIONS MAIN MESSAGE
What this analysis show is a highly protected national industry that has been losing terrain in front of its international competitors. The reason for this is its incapability of increasing their efficiency in face of the eventual but gradual international market liberalization.
So, the protection policy had shown a classic example of agriculture protection paid by the consumer, whom are being affected by excessive high prices product of a costly local production and lack of unrestrictive access to international markets.
Furthermore, the protection benefits didn’t reach the cane producer, that through all the period had faced negative market incentives, that increased along the years. High transportation and harvesting costs are highly affecting the farmers income. Problems primarily due to bad coordination with the industry and long delays product of processing inefficiency.
As a result, the Kenyan sugar sector today is incapable of covering the national demand of sugar, even less of becoming a net exporter. If the situation doesn’t improve, it would be hard for all the companies to survive full liberalization. Privatization seems to be the solution found by the government, however there are no guarantees for its successful implementation.
PRELIMINARY RECOMMENDATIONS
It is important to note the necessity to improve the relationship between factories and outgrowers. Primarily to address the problem concerning harvesting and transportation high costs due to delays and lack of coordination.
Special interest has to be put by the government in order to improve the relationship between cotton producers and ginners. Farmers won´t produce more cotton, nor improve the quality, if the ginneries don´t facilitate access to fair prices, extension services, good quality seed, credit and formal commercialization schemes. On the other side, ginneries’ situation won´t improve if they don´t have enough good quality cotton supply from local farmers.
LIMITATIONS
1. Lack of detailed transport costs specific to sugar. 2. Lack of sufficient information regarding the sugar companies-wholesalers-importers relationships. 3. Lack of information regarding the effectiveness of the Kenya Sugar Board.
FURTHER INVESTIGATION AND RESEARCH
• An in-depth study of the real difference in efficiency between public and private owned companies, as privatization seems to be the policy strategy taken by the government;
• Deepen in a value chain analysis regarding the importers segment as they might as well been getting important margins due to the local industry inefficiency, despite the national market protection;
• Further detailed investigation on the product diversification;
34
Bibliography
− Center of Governance and Development [CGD] (2005). “Cotton Dreams” in CGD Bills Digest, Issue 04-010/05. Nairobi, Kenya.
− Global Trade Atlas [GTA] (2012). Kenya Raw Sugar Imports and Exports 2006-2011 [Data File].
Retrieved from http://www.gtis.com/english/GTIS_WTA.html
− Government of Kenya [GOK] (2007). National Adaptation Strategy for the Sugar Industry of Kenya. Retrieved from http://www.kenyasugar.co.ke/
− Government of Kenya [GOK] (2008). Kenya Vision 2030: First Medium Term Plan, 2008-2012. Kenya
Poverty Reduction Strategy Paper. Retrieved from http://www.imf.org/external/pubs/ft/scr/2010/cr10224.pdf
− Kegode, Peter (2005). Economic Governance Reform in the Sugar Sub-Sector. Center for Governance and Development, Nairobi. Retrieved from http://www.cgd.or.ke/documents/Sugar%20Report.pdf
− Kenya Anti-Corruption Commission [KACC] (2010). Review of the Policy, Legal and Regulatory Framework for the Sugar Sub-Sector in Kenya. Research and Policy Department Directorate of Preventive Services, Nairobi. Retrieved from http://www.eacc.go.ke/docs/sugar-report.pdf
− Kenya Institute for Public Policy Research and Analysis [KIPPRA] (2010). Should Kenya Revert to Price Controls? KIPPRA Policy Paper No. 4, December 2010. Retrieved from http://www.kippra.org/docs/PP4.pdf
− Kenya Investment Authority [Kia] (2012). Preferential Market Access within the Region the E.U., Americas and Asia. Web Page consulted July 2012 http://www.investmentkenya.com/index.php?option=com_content&task=view&id=43&Itemid=38
− Kenya National Bureau of Statistics (2011). Kenya Consumer Price Index 2005-2010 [Data File].
Online Database. Retrieved from http://www.knbs.or.ke/consumerpriceindex.php
− Kenya Ministry of Trade [MOT] (2009). National Trade Policy. Republic of Kenya. Retrieved from http://www.eac.int/trade/index.php?option=com_docman&task=doc_details&gid=12&Itemid=124
− Kenya Sugar Board [KSB] (2009). Kenya Sugar Board Strategic Plan 2009. Retrieved from http://www.kenyasugar.co.ke/
− Kenya Sugar Board [KSB] (2010). The Kenya Sugar Industry Value Chain Analysis: Analysis of the Production and Marketing Costs for Sugarcane and Sugar Related Products. Provided by the KSB through http://www.kenyasugar.co.ke/index.php?option=com_k2&view=item&layout=item&id=61&Itemid=184&lang=en
35

− Kenya Sugar Industry [KSI] (2009). Kenya Sugar Industry Strategic Plan 2010-2014.Retrieved from http://www.kenyasugar.co.ke/
− Millennium Cities Initiative [MCI] (2008). Sugar In Kisumu, Kenya. The Earth Institute at Columbia University, New York. Retrieved from http://www.vcc.columbia.edu/pubs/documents/SugarWorkingPaper.pdf
− The World Bank [WB] (2009). Eastern Africa: A Study Of The Regional Maize Market And Marketing Costs. Report No. 49831 – AFR, retrieved from https://openknowledge.worldbank.org/bitstream/handle/10986/3155/498310REPLACEM11Grain1Trade1printed.pdf?sequence=1
− The World Bank [WB] (2011). Kenya Exchange Rates 2005-2011 [Data File]. World Bank World Development Indicators Online Database. Retrieved from http://databank.worldbank.org/ddp/home.do?Step=2&id=4&DisplayAggregation=N&SdmxSupported=Y&CNO=2&SET_BRANDING=YES
− UN Comtrade. (2010). Kenya Raw Sugar Imports and Exports 2005-2010 [Data File]. United Nations
Commodity Trade Statistics Database. Retrieved from http://comtrade.un.org/db/dqBasicQuery.aspx
− UN Food and Agriculture Organization [FAO] (2012). Kenya Sugarcane, Raw Sugar, Molasses
statistics 1975-2010 [Data File]. FAOSTAT Online Database. Retrieved from http://faostat.fao.org/default.aspx?lang=en
− UN Food and Agriculture Organization [FAO] (2012). Kenya Food Balance Sheets 1997-2007 [Data
File]. FAOSTAT Online Database. Retrieved from http://faostat.fao.org/default.aspx?lang=en
− United States Department of Agriculture [USDA] (2008). Kenya 2008 Sugar Annual Report. Global Agriculture Information Network Report Number: KE8011.
− United States Department of Agriculture [USDA] (2010). Kenya 2010 Sugar Annual Report. Global Agriculture Information Network Report.
− United States Department of Agriculture [USDA] (2011). Kenya 2011 Sugar Annual Report. Global Agriculture Information Network Report.
− United States Department of Agriculture [USDA] (2012). Kenya 2012 Sugar Annual Report. Global Agriculture Information Network Report.
36

ANNEX I: Additional Data and Information The 2008 Kenya Sugar Industry Study indicates that “while there has been a great deal of interest in protecting and promoting the Kenyan sugar industry to achieve the country objective of self-sufficiency and in such case, of becoming an exporting country, the results haven’t been what was expected, and Kenya sugar industry production costs are still the highest in the region” (KSI, 2009).
The analysis of Strengths, Weaknesses, Opportunities and Threats (SWOT) to the sugar sector presented in the Kenya Sugar Industry Strategic Plan, 2010-2014, is summarized in the following table.
Table 7: SWOT Analysis for Kenya’s Sugar Sector Strengths Weaknesses
a. Vast potential for expansion of area under cane b. Unutilized processing capacity c. Strong agronomic research capacity d. Resilient, hardworking farmers e. Stakeholder participation and concurrence f. Protected local markets
a. Over-reliance on a single product (sugar ) for revenue b. Limited irrigation c. Weak corporate governance d. High level of industry indebtedness e. Substantial Government ownership f. High post harvest losses (estimated to be at least 5%) g. Poor transport infrastructure h. Capacity underutilization i. Low capacity mills (only 12.5% of operating factories above 3,500 TCD) j. High costs of production k. Inadequate and uncoordinated funding l. Lack of performance monitoring and evaluation system
Opportunities Threats a. Ready local and regional markets b. Agronomic potential c. Government goodwill d. Proven opportunities for product diversification (co-generation, ethanol) e. Sucrose based pricing and cane payment system f. Sugarcane production through irrigation
a. Continued reduction of the SDL b. Informal cross-border trade c. Strong import competition d. Uneconomic land sub-division e. High energy costs f. High tax burden g. Risk of insolvency of some producers h. Food insecurity i. Risk of slow adoption of new technologies j. Political interference in affairs of the industry k. Climate change due to environmental degradation l. Malaria and HIV/AIDS
Source: KSI, 2009
37

ANNEX II: Data and calculations used in the analysis
Year 2005 2006 2007 2008 2009 2010 2011DATA Unit Symbol trade status m m m m m m m
Benchmark Price
1 Observed USD/TONNE Pb(int$) 320.36 400.22 470.38 456.43 507.21 651.14 790.691b Adjusted USD/TONNE Pba
Exchange Rate2 Observed KSH/USD ERo 75.55 72.10 67.32 69.18 77.35 79.23 88.81
2b Adjusted KSH/USD ERa
Access costs border - point of competition
3 Observed KSH/TONNE ACowh 12,332.91 13,701.48 14,339.39 14,367.20 17,809.96 21,428.94 28,458.41
3b Adjusted KSH/TONNE ACawh 12,045.58 13,410.74 14,056.32 14,032.39 17,396.14 20,987.74 27,894.53
4 Domestic price at point of competition KSH/TONNE Pdwh 53,904.40 56,580.12 60,022.80 58,740.88 77,247.10 84,193.38 109,956.13
Access costs point of competition - farm gate
5 Observed KSH/TONNE ACofg 1,932.40 2,110.64 2,102.00 2,428.12 2,631.52 2,572.61 2,934.58
5b Adjusted KSH/TONNE ACafg
6 Farm gate price KSH/TONNE Pdfg 1,910.00 2,002.00 2,250.00 2,400.00 2,739.00 3,094.00 3,487.007 Externalities associated w ith production KSH/TONNE E8 Budget and other product related transfers KSH/TONNE BOT
Quantity conversion factor (border - point of competition) Fraction QTwh 1.00 1.00 1.00 1.00 1.00 1.00 1.00
Quality conversion factor (border - point of competition) Fraction QLwh 1.00 1.00 1.00 1.00 1.00 1.00 1.00
Quantity conversion factor (point of competition - farm gate) Fraction QTfg 10% 10% 11% 11% 11% 13% 12%Quality conversion factor (point of competition - farm gate) Fraction QLfg 1.00 1.00 1.00 1.00 1.00 1.00 1.00
38

CALCULATED PRICES Unit Symbol 2005 2006 2007 2008 2009 2010 2010 FormulaBenchmark price in local currency
9 Observed KSH/TONNE Pb(loc$) 24,204.32 28,856.14 31,664.85 31,573.62 39,233.33 51,591.73 70,221.38 [1]*[2]10 Adjusted KSH/TONNE Pb(loc$)a 24,204.32 28,856.14 31,664.85 31,573.62 39,233.33 51,591.73 70,221.38 [1]*[2]
Reference Price at point of competition11 Observed KSH/TONNE RPowh 36,537.23 42,557.62 46,004.24 45,940.82 57,043.29 73,020.67 98,679.79 ([9]*[QTw h]*[QLw h])+[3]12 Adjusted KSH/TONNE RPawh 36,249.90 42,266.88 45,721.18 45,606.01 56,629.46 72,579.47 98,115.91 ([10]*[QTw h]*[QLw h])+[3b]
Reference Price at Farm Gate 13 Observed KSH/TONNE RPofg 1,891.28 2,274.53 3,054.18 2,761.30 3,893.49 6,562.38 8,858.09 ([11]*[QTfg]*[QLfg])-[5]14 Adjusted KSH/TONNE RPafg 1,861.21 2,244.57 3,022.45 2,723.48 3,846.15 6,507.18 8,790.71 ([12]*[QTfg]*[QLfg])-[5]
INDICATORS Unit Symbol 2005 2006 2007 2008 2009 2010 2010 FormulaPrice gap at point of competition
15 Observed KSH/TONNE PGowh 17,367.17 14,022.50 14,018.56 12,800.06 20,203.81 11,172.71 11,276.34 [4]-[11]16 Adjusted KSH/TONNE PGawh 17,654.50 14,313.25 14,301.62 13,134.87 20,617.64 11,613.91 11,840.22 [4]-[12]
Price gap at farm gate17 Observed KSH/TONNE PGofg 18.72 (272.53) (804.18) (361.30) (1,154.49) (3,468.38) (5,371.09) [6]-[13]18 Adjusted KSH/TONNE PGafg 48.79 (242.57) (772.45) (323.48) (1,107.15) (3,413.18) (5,303.71) [6]-[14]
Nominal rate of protection at point of competition19 Observed % NRPowh 47.5% 32.9% 30.5% 27.9% 35.4% 15.3% 11.4% [15]/[11]20 Adjusted % NRPawh 48.7% 33.9% 31.3% 28.8% 36.4% 16.0% 12.1% [16]/[12]
Nominal rate of protection at farm gate21 Observed % NRPofg 1.0% -12.0% -26.3% -13.1% -29.7% -52.9% -60.6% [17]/[13]22 Adjusted % NRPafg 2.6% -10.8% -25.6% -11.9% -28.8% -52.5% -60.3% [18]/[14]
Nominal rate of assistance23 Observed % NRAo 1.0% -12.0% -26.3% -13.1% -29.7% -52.9% -60.6% ([17]+[8])/[13]24 Adjusted % NRAa 2.6% -10.8% -25.6% -11.9% -28.8% -52.5% -60.3% ([18]+[8])/[14]
39
