analysis and simulation of a wind-electric battery charging system
TRANSCRIPT

INTERNATIONAL JOURNAL OF ENERGY RESEARCHInt. J. Energy Res. 2006; 30:633–646Published online 13 January 2006 in Wiley InterScience (www.interscience.wiley.com). DOI: 10.1002/er.1175
Analysis and simulation of a wind-electric batterycharging system
Jaime Martınez1, Alfredo Morales1,2, Oliver Probst1,2,n,y,Armando Llamas2 and Ciro Rodrıguez3
1Physics Department, Instituto Tecnologico y de Estudios Superiores de Monterrey, Monterrey 64849, Mexico2Center for Energy Studies, Instituto Tecnologico y de Estudios Superiores de Monterrey, Monterrey 64849, Mexico
3Center for Integrated Manufacturing Systems, Instituto Tecnologico y de Estudios Superiores de Monterrey,
Monterrey 64849, Mexico
SUMMARY
A small commercial wind-electric battery-charging system based on a three-bladed rotor has been analysedin a detailed fashion. The system consists of a synchronous generator with permanent magnets, a six-pulserectifier and a battery bank with charge controller. A steady-state power curve is predicted based on theelectric characteristics found experimentally and the aerodynamic performance of the rotor simulated witha version of blade element momentum (BEM) theory developed in our group. The BEM code has beendesigned to account for variable Reynolds numbers at different blade sections and stall conditions. Thefindings are compared with the manufacturer’s specifications, and a detailed discussion is provided. A verygood agreement with the steady-state power curve given by the manufacturer has been obtained afteraccounting for different sources of power losses, such as voltage drops in the rectifier, Joule heating in thepower cables and losses in the generator’s core. The system is found to operate near the aerodynamicoptimum for all wind speeds studied, whereas electrical losses are significant near rated power.Some recommendations for improving the system performance are provided. Copyright # 2005 JohnWiley & Sons, Ltd.
KEY WORDS: energy; wind; battery; aerodynamics; synchronous generator; rectifier; harmonics
1. INTRODUCTION
Small wind-electric systems are among the most popular renewable energy options forelectrification of remote sites and water pumping (Gipe, 2004; Velasco et al., 2004; Fernandezet al., 2001). There are also becoming increasingly popular for grid-interconnection (Heier,1998), even though the growth of small systems does not stand up to that observed in the class
Received 24 January 2005Revised 29 June 2005Accepted 31 July 2005Copyright # 2005 John Wiley & Sons, Ltd.
yE-mail: [email protected]
Contract/grant sponsor: National Council for Science and Technology (CONACYT, Mexico); contract/grant number:40273
nCorrespondence to: O. Probst, Physics Department, Instituto Tecnologico y de Estudios Superiores de Monterrey,E. Garza Sada 2501 Sur, Monterrey N.L., 64849, Mexico.

of megawatt turbines. Although nowadays small wind-electric systems have a high level ofreliability (Gipe, 2004), the prediction of the energy production of a wind-electric system stilldepends sensitively on a number of parameters, such as the measured wind resource, the steady-state power curve PðUfreeÞ as a function of the free-stream wind speed Ufree (typically providedby the turbine manufacturer), the dimensions of the battery bank, and the charge controllercharacteristics. Currently, independent certification of the power curves of small wind-electricsystems is not required (Gipe, 2004), although some manufacturers have sought externalcertifications of specific products (Corbus et al., 1999), and several systematic field studies havebeen performed, such as the NREL Field Verification Project (Field Verification Project, 2001).Also, a considerable body of studies on the influence of battery capacity and the detailedcharging and control schemes exists (Corbus et al., 2002; De Broe et al., 1999; Gevorgian et al.,1998). However, little work has been published so far on the detailed aerodynamical andelectromechanical characteristics of small wind-electric systems and their opportunities forimprovements. Moreover, in most electrical engineering studies of small wind systems it isassumed that the turbine rotor can be described by a power coefficient Cp as a function of the tipspeed ratio (TSR) OR=Ufreeonly (Bialasiewicz, 2003; Fernandez et al., 2001; Velasco et al.,2004), which is not always an appropriate approximation for small wind turbines. O is the shaftangular frequency and R the rotor radius, respectively. The current study is intended to fill thisvoid, providing a detailed account of the properties of small commercial battery-chargingsystem, the Bergey BWC XL.1, and a comparison with the published power curve. In thecurrent study we will concentrate on the normal or non-idling operation of the system, asopposed to the operation with partially or nearly fully charged batteries which has been studiedextensively in literature (Corbus et al., 2002; DeBroe et al., 1999; Gevorgian et al., 1998).
2. AERODYNAMICS
The appropriate description of the aerodynamic power extraction process is key to a reliableprediction of the power characteristics of a wind turbine system. In this work we used a BEMmodel developed in our group in order to predict the power curves of stall-regulated windturbines (Martınez et al., 2005).
BEM theory (Burton et al., 2001; Hansen, 2000; Snel, 2003) relies on the knowledge of bladegeometry and two-dimensional aerodynamic properties of the blade sections, allowing todetermine the local aerodynamic conditions and the forces and torques acting at each bladeelement. In order to obtain the power extracted by the blade an integration has to be performedover the blade span. For large wind turbines, where the aerodynamic coefficients vary little withReynolds number, the extracted power can be written as
Pex ¼ 12ArU3
freeCpðlÞ ð1Þ
where the power coefficient Cp depends only on the tip speed ratio l ¼ OR=Ufree: For theReynolds number range observed in small turbines like the BWC XL.1, however, theaerodynamic coefficients strongly depend on Re and therefore Cp will be a function of both Ufree
and the shaft frequency n½rpm� ¼ 60O½s�1�=ð2pÞ:In order to account for this situation our previously developed BEM computer code
(Martınez et al., 2005) was coupled to the electromechanical model described in Section 3 and
Copyright # 2005 John Wiley & Sons, Ltd. Int. J. Energy Res. 2006; 30:633–646
J. MARTINEZ ET AL.634

modified in order to self-consistently determine the local Reynolds number and thecorresponding aerodynamic coefficients at each blade section.
The airfoil SH3045 used in the BWC XL.1 blades has been specially designed and patented bythe provider of the commercial system (Bergey); its aerodynamic coefficients were therefore notreadily available. Our approach consisted in first measuring the co-ordinates of the perimeter ofthe blade using a Zeiss MMC co-ordinate measurement system. These data were then correctedfor the finite ball size of the probe as well the non-normal approach of the probe with the help ofa specialized software developed in our group.
The aerodynamic coefficients were calculated using the commercial CFD solver VisualFoil(Hanley, 2004) designed especially for airfoil characterization. Two characteristics of theSH3045 are worth mentioning: the airfoil has an unusually strong camber, and it has a blunttrailing edge. Blunt tips have been proposed (Standish and Van Dam, 2003) as a suitable meansto obtain high lift coefficients while preserving mechanical stability; furthermore, they allow forextrusion of the blade and therefore a potentially lost-cost blade manufacturing.
The airfoils were simulated with a coupled inviscous panel/viscous boundary layer method,where the airflow around the airfoil is first calculated from potential flow theory and thencoupled to the viscous boundary layer in order to determine drag. An Eppler correction (Epplerand Somers, 1980) was applied to the lift curve with the maximum lift coefficient set to occur atan upper surface separation of 20%.
In order to overcome stability problems observed in the simulation due to the blunt tip wereplaced the blunt tip by a pointed tip by merging the SH3045 with a NACA7409 airfoil.
3. ELECTROMECHANICS
The small wind-electric battery-charging system (BWC XL.1, rated at 1 kW) was purchasedfrom Bergey Inc. Its main components are a three-bladed rotor with a diameter of 2.5m, a 12-pole synchronous generator with permanent magnets, a six-pulse rectifier, and a batterybank operating at a nominal voltage of 24V with a charge controller based on pulsewidth modulation (PWM). The additional inverter will not be considered in the present study.
The generator-rectifier set can be represented by three star-connected ideal AC voltagesources with their respective armature resistances and inductances connected to a six-pulserectifier. We replace this three-phase circuit by a simplified equivalent circuit, where one phaseof the generator was coupled to the DC load circuit by means of a current-controlled voltagesource. This equivalent circuit can be justified as follows: (i) the three phases of the generator areexpected to be balanced, unless a failure occurs; (ii) a six-pulse rectifier provides a relatively flatoutput signal with only a small voltage and current ripple, respectively. The load voltage andcurrent can then be described reasonably by a variable resistance VDC=IDC; without having toworry about the complex nature of both quantities.
We will now develop the general framework of the model and describe the determination ofthe free parameters from measurements. As a starting point we assume a sinusoidal line-to-linevoltage vab ¼ van � vbn ¼ Vm sinðotÞ; where Vm ¼
ffiffiffi3
p ffiffiffi2
pVt; the other line-to-line voltages
ðvbc; vcaÞ have a phase shift of 1208 and 2408, respectively. Vt is the effective value of the terminalvoltage of either of the three generator phases. The DC voltage VDC appearing on the outputside of the current-controlled voltage source can now be obtained by integrating the line-to-linevoltage over a phase interval of p/3, given the fact that the output voltage of the rectifier consists
Copyright # 2005 John Wiley & Sons, Ltd. Int. J. Energy Res. 2006; 30:633–646
ANALYSIS AND SIMULATION OF A WIND-ELECTRIC BATTERY CHARGING SYSTEM 635

of six pulses within a full cycle of 2p, and considering a voltage drop of 2VD at the twoconducting diodes during each of the rectifier pulses:
VDC ¼1
p=3
Z 2p=3
p=3vab dðotÞ � 2VD ¼
3ffiffiffi6
pp
Vt � 2VD ð2Þ
The diode voltage depends on the armature current Ia in an logarithmic fashion; thequalitative behaviour can be approximated, however, by a threshold conduction according to
VD ¼ VK þmIa ð3Þ
where the threshold voltage VK and the slope m have to be determined from experiment. Forsilicon diodes a typical threshold voltage of 0.7V can be expected. The effective armaturecurrent Ia, on the other hand, is the rms value of the time-varying armature current iaðtÞ ofone phase:
Ia ¼
ffiffiffiffiffiffiffiffiffiffiffiffiffiffiffiffiffiffiffiffiffiffiffiffiffiffiffiffiffiffiffiffiffiffiffiffiffiffiffiffiffiffiffiffiffi1
2p
Z 2p
0
ðiaðotÞÞ2 dðotÞ
s¼ IDC
ffiffiffi2
3
rð4Þ
where the current during conduction periods of the rectifier has been approximated by theaverage value of the rectified current IDC. In a real circuit, however, due to the presence ofinductance and harmonics due to the non-linearities of the circuit, a modified relationship
IDC ¼ kIa ð40Þ
is expected, where the new proportionality constant k has to be determined from the experiment.It has been shown in literature (Llamas et al., 2004) that a pu-pulse rectifier with apredominantly resistive charge will produce harmonics of the order of h ¼ jpu� 1where j ¼ 1; 2; 3; 4; . . . . In the present case pu ¼ 6; and therefore the lowest-order harmonicsexpected from our device are 5, 7, 11, and 13. As we will show below, the analysis of the
CTL
Battery bank
( )( )
ZnP ,gen/rect (n, Z(n))PBattery
freeaero ,Un P
Rotor (3 blades)
Synchronous generatorwith permanent magnets
Six-pulserectifier
CTL
Chargecontroller
Zn,
Figure 1. Block diagram of the wind-electric battery charging system studied in the present work.
Copyright # 2005 John Wiley & Sons, Ltd. Int. J. Energy Res. 2006; 30:633–646
J. MARTINEZ ET AL.636

harmonics provides a useful tool for determining the armature resistance and inductance of thegenerator.
In order to complete our discussion, the terminal voltage Vt has still to be related to theinduction voltage provided by the generator (or electromotive force) and an effective armatureimpedance ZK by
Vt ¼ Ef � ZKIa ð5Þ
It is important to point out that ZK is not the complex armature impedance given by Ra þ jXa;but a real number allowing to quantify the effective voltage drop at the armature winding in thepresence of harmonics. The electromotive force is expected to be directly proportional to theshaft frequency n; due to the non-linearity in the lowest part of the core’s magnetization curve,however, an approximated relationship of the form Ef ¼ Ef 0 þ E1n for the relevant shaftfrequency range is expected. If we define a load impedance by Z0L ¼ VDC=IDC we can nowcombine Equations (2), (3), (40) and (5) in order to express the armature current in terms ofmeasurable quantities only:
Ia ¼ð3
ffiffiffi6
p=pÞEf � 2VK
kZ0L þ ð3ffiffiffi6
p=pÞZK þ 2m
ð6Þ
Z0L ¼ ZLðnÞ þ Rline consists of a variable component ZLðnÞ determined by the chargecontroller and the resistance of the transmission line Rline that connects the wind turbine to thecharge controller/battery bank. After these preparations we are now able to calculate the powerdelivered to the battery bank as well as the different power losses. We first note that themechanical power delivered to the electromechanical system given by the generator, rectifier,charge controller and battery bank can be split up as follows:
Pmech ¼ Pbattery þ Pline þ Pcu þ PD þ PCC þ Pmisc ð7Þ
where Pbattery is the useful power delivered to the battery bank, Pline the transmission losses dueto Joule heating, Pcu the resistive armature losses, PD the losses at the rectifying diodes, PCC thecharge controller losses, and Pmisc miscellaneous losses including those occurring at thegenerator’s core.
The useful (battery) power is given by
Pbattery ¼ I2DCZL ¼ ðkIaÞ2ZL ð8Þ
Similarly, the transmission line losses are
Pline ¼ I2DCRline ¼ ðkIaÞ2Rline ð9Þ
The copper (resistive) losses at the armature windings can be obtained from
Pcu ¼ 3I2aRa ð10Þ
where the factor 3 accounts for the three phases of the generator. The diode losses can becalculated from
PD ¼ 2VDIa ð11Þ
where the factor 2 comes from the fact that conduction at the six-pulse rectifier at any givenmoment occurs through two diodes simultaneously. The losses occurring at the chargecontroller were found to be negligible and will not be discussed any further. The miscellaneouslosses will be discussed in the following section on measurements. The total measurable power
Copyright # 2005 John Wiley & Sons, Ltd. Int. J. Energy Res. 2006; 30:633–646
ANALYSIS AND SIMULATION OF A WIND-ELECTRIC BATTERY CHARGING SYSTEM 637

delivered by the generator (excluding transmission line losses) is given by
PA ¼ Pbattery þ PD ¼ ðkIaÞ2ZL þ 2VDIa ð12Þ
Electrical measurements of the generator/rectifier set. The generator was mounted on a testbench on the same axis with a driving DC motor. The DC motor was externally excited using a120V/low-amp self-transformer and a rectifying bridge. The armature current of the DC motorwas provided by a 220V/20A self-transformer and a rectifying bridge. The output leads of thesix-pulse rectifier belonging to the generator were connected to a bank of incandescent lightbulbs, allowing for a variable resistive load. Electrical measurements (current, voltage, real andreactive power, fundamental frequency, harmonics spectra, displacement power factor) wereperformed with a Fluke 43B Power Quality Analyser, where the current was measured with aHall effect current sensor. For each driving frequency both the three-phase quantities directly atthe generator output leads and the DC quantities after the six-pulse rectifier were measured. Themechanical shaft frequency was measured with a stroboscope in order to verify the usualrelationship oe ¼ ðp=2Þom between the electrical and mechanical angular frequencies oe andom; respectively, p being the number of poles (12 in the present case).
Mechanical measurements of the generator torque. In order to assess the mechanical losses thegenerator was attached to a wooden table-like support structure, where one (shorter) leg restedon an electronic balance provided by MTE (Metrologıa Electronica Mexicana, Monterrey,Mexico). This balance had a capacity of 100 kg and a resolution of 0.01 kg. By means of thesupport structure the generator was able to transfer torque to the balance. The system wascarefully balanced, and the small deviation moments due to a not completely axiallysymmetrical coupling of the axes of the DC motor and the generator were accounted for.Electrical measurements were performed with a multimeter EZ DM-531T capable of providingtrue rms readings of voltage and current.
Electrical characterization of the load impedance curve established by the charge controller.In this study we were mainly interested in the normal operation of the system, as opposed to theidle or semi-idle operation required when batteries are almost charged and no or little load isconnected to the system. We therefore started with a completely discharged battery bank; thecharge level was verified both through the voltage readings and the sulphuric acid leveldetermined through the measurement of the density of the battery solution. In this set ofmeasurements the generator was connected to the charge controller through a pair of leads witha resistance of Rline ¼ 0:11 O; as suggested by the manufacturer, equivalent to the resistance ofthe transmission line required for a mounting of the turbine at a height of 30m and a lateraldistance from the charge controller of about 4m. The generator was coupled to the driving axisof a car; the driving frequency was controlled manually and held at constant levels with anaccuracy of about � 5%. Electrical measurements were performed with a Fluke 43B PowerQuality Analyser as before.
4. RESULTS AND DISCUSSION
4.1. Aerodynamics
The results of the different airfoil simulations are displayed in Figure 2: whereas a smoothbehaviour of the lift coefficient is observed in the cases of the NACA7409 and the
Copyright # 2005 John Wiley & Sons, Ltd. Int. J. Energy Res. 2006; 30:633–646
J. MARTINEZ ET AL.638

SH3045MOD1 airfoils, a double kink appears in the CLðaÞ curve for the unmodified SH3045airfoil at small angles of attack. This kink is believed to be an artefact of the simulation ratherthan a real feature. The compound airfoil (the SH3045MOD1) is seen to be a high-lift devicewith an onset of trailing edge flow separation at around 12.58. The drag coefficients of theNACA airfoil and the SH3045MOD1 profile are practically identical for angles of attack of upto 158 and are generally very low. Interestingly, the predicted CLðaÞ-curve for the modifiedSH3045MOD1 airfoil is very similar to the measured CLðaÞ-curve of the SH3055 (Selig andMcGranahan, 2004), an airfoil based on the SH3045 design (Selig and McGranahan, 2004). Weconsider this finding an endorsement for the modelling approach discussed above.
4.2. Electrical measurements
The electrical model developed in the preceding section contains several parameters ðEf 0;E1;VK;m; k;Ra;Ls;ZKÞ which have to be determined from experiment. Furthermore, thetransmission line resistance Rline; the parameters corresponding to the miscellaneous(mechanical and core) losses, as well as the charge controller action have to be quantified. Inorder to determine this set of parameters the following sets of experiments have been conducted:
(a) Measurement of the open-circuit induction voltage (electromotive force) Ef. For themeasurement of Ef the driving shaft frequency was varied between 150 and 497 rpm (closeto the rated frequency of the Bergey XL.1 wind turbine of 490 rpm), corresponding toelectrical frequencies from 15 to 49.7Hz. A perfectly linear relationship ðR2 ¼ 1Þ wasobserved between the output line-to-neutral voltage Ef and the shaft frequency n, whereEf ½Vrms� ¼ 0:1064þ 0:04073½rpm�:
(b) Determination of the effective armature impedance ZK from electrical measurements withvariable load. Four sets of measurements with load resistances of the order of 10, 5, 3,and 2O were conducted for electrical frequencies of 15, 25, 35, and 45Hz each. Due toheating, the load resistance was not constant, but increased monotonically during eachset. Having measured the induction voltage Ef and the armature current Ia in each ofthe 16 measurements, we were able to calculate ZK from Equation (4), obtainingZK ¼ ð0:128� 0:018ÞO:
(a)
Lift
coef
ficie
nt C
L
0
0.5
1
1.5
2
-10 -5 0 5 10 15 -10 -5 0 5 10 15
Angle of attack [˚] Angle of attack [˚]
NACA7409SH3045SH3045MOD1
Re=570,000
(b)
Dra
g co
effic
ient
CD
0
0.01
0.02
0.03
0.04
0.05
Cd-NACA7409Cd-SH3045Cd-SH3045MOD1
Figure 2. Aerodynamic coefficients calculated with VisualFoil 4.1 for the airfoil profile as measured(SH3045), a similar NACA 4-series airfoil (NACA7409), and the modified SH3045MOD1: (a) lift
coefficients; and (b) drag coefficients.
Copyright # 2005 John Wiley & Sons, Ltd. Int. J. Energy Res. 2006; 30:633–646
ANALYSIS AND SIMULATION OF A WIND-ELECTRIC BATTERY CHARGING SYSTEM 639

(c) Determination of the armature resistance Ra and inductance La. We followed anuncommon approach by measuring the harmonics current spectra using the Fluke 43Band comparing them to the corresponding spectra obtained from the simulation of theoriginal three-phase equivalent circuit using PSpice. The analysis was conducted in aninteractive manner, specifying values of Ra and La that would yield similar values of the
total harmonic distortion Idist 13 ¼ffiffiffiffiffiffiffiffiffiffiffiffiffiffiffiffiffiffiffiffiffiffiffiffiffiffiffiffiffiffiffiffiffiffiffiffiffiI25 þ I27 þ I211 þ I213
q: The final result after evaluating
a total of 18 combinations of ðRa;LaÞ was Ra ¼ 0:055 O and La ¼ 0:6 mH; thiscombination had the smallest relative error defined by
error ¼ffiffiffiffiffiffiffiffiffiffiffiffiffiffiffiffiffiffiffiffiffiffiffiffiffiffiffiffiffiffiffiffiffiffiffiffiffiffiffiffiffiffiffiffiffiffiffiffiffiffiffiffiffiffiffiX
i¼5;7;11;13ðIi;sim � Ii;expÞ
2q
=Idist 13
Some representative results of the simulation and its comparison with the measured valuesare given in Table I.
(d) Evaluation of the diode parameters VK and m, and the proportionality constant k: For thistask the measurements performed in paragraph b were used. The voltage drop at the diodeswas calculated from Equation (1) and plotted against the armature current. A reasonablylinear relationship ðR2 ¼ 0:82Þ according to Equation (2) was obtained where VD½V � ¼0:7092þ 0:0708Ia½Arms�: Similarly, the rectified current IDC was plotted against the armaturecurrent Ia, providing the desired proportionality constant k ¼ IDC=Ia ¼ ð1:25� 0:02ÞA=Arms:It should be noted that this experimental value is very close to the theoretical value predictedfor an ideal six-pulse rectifier with a resistive load which has k ¼
ffiffi32
q¼ 1:225 (Equation 4).
Once all parameters have been determined the measured generator power values can becompared to the corresponding values predicted by the model. From Figure 3 it can be seen thatthe generator power predicted from Equation (11) indeed reproduces the measured values fairlywell; the average error from the 16 measurements shown is about 2.7%.
4.3. Mechanical measurements
(a) Measurement of the mechanical torque with no load. The generator was driven to 170,260, 320, 400, 430, and 500 rpm. The readings showed no variation of the generatortorque with respect to shaft frequency and were consistent with a torque 50.3Nm.
(b) Measurements with an electrical load. A set of measurements was performed for thehighest load ðRload � 2 OÞ: Data were taken at shaft frequencies of 200, 300, 400,
Table I. Representative set of simulation results obtained with PSpicefor the equivalent three-phase circuit.
Harmonics of armature current (Arms)
Ra (O) La (mH) 5th 7th 11th 13th Ia (total) Idist Error
0.128 0 2.27 1.03 0.66 0.39 11.2 2.61 18.5%0 0.72 2.16 0.66 0.31 0.15 11.4 2.29 5.7%0.05 0.72 2.08 0.65 0.30 0.16 11.1 2.21 6.8%0.05 0.65 2.14 0.67 0.34 0.16 11.1 2.28 5.1%0.055 0.6 2.17 0.70 0.37 0.17 11.2 2.32 4.5%Measurements with Fluke43B 2.16 0.76 0.31 0.23 11.16 2.32 }
Copyright # 2005 John Wiley & Sons, Ltd. Int. J. Energy Res. 2006; 30:633–646
J. MARTINEZ ET AL.640
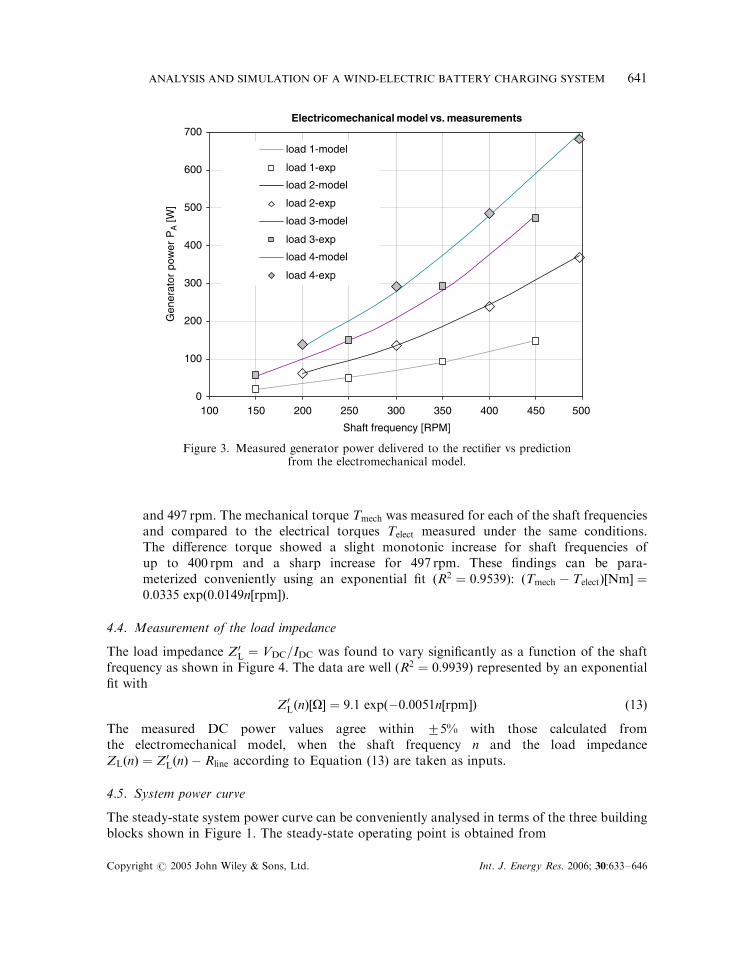
and 497 rpm. The mechanical torque Tmech was measured for each of the shaft frequenciesand compared to the electrical torques Telect measured under the same conditions.The difference torque showed a slight monotonic increase for shaft frequencies ofup to 400 rpm and a sharp increase for 497 rpm. These findings can be para-meterized conveniently using an exponential fit ðR2 ¼ 0:9539Þ: ðTmech � TelectÞ½Nm� ¼0:0335 expð0:0149n½rpm�Þ:
4.4. Measurement of the load impedance
The load impedance Z0L ¼ VDC=IDC was found to vary significantly as a function of the shaftfrequency as shown in Figure 4. The data are well ðR2 ¼ 0:9939Þ represented by an exponentialfit with
Z0LðnÞ½O� ¼ 9:1 expð�0:0051n½rpm�Þ ð13Þ
The measured DC power values agree within �5% with those calculated fromthe electromechanical model, when the shaft frequency n and the load impedanceZLðnÞ ¼ Z0LðnÞ � Rline according to Equation (13) are taken as inputs.
4.5. System power curve
The steady-state system power curve can be conveniently analysed in terms of the three buildingblocks shown in Figure 1. The steady-state operating point is obtained from
Electricomechanical model vs. measurements
0
100
200
300
400
500
600
700
100 150 200 250 300 350 400 450 500
Shaft frequency [RPM]
Gen
erat
or p
ower
PA [W
]
load 1-model
load 1-exp
load 3-model
load 3-exp
load 4-model
load 4-exp
load 2-exp
load 2-model
Figure 3. Measured generator power delivered to the rectifier vs predictionfrom the electromechanical model.
Copyright # 2005 John Wiley & Sons, Ltd. Int. J. Energy Res. 2006; 30:633–646
ANALYSIS AND SIMULATION OF A WIND-ELECTRIC BATTERY CHARGING SYSTEM 641

Paeroðn;UfreeÞ � 12rpR2U3
freeCpðUfree; nÞ ¼ Pmechðn;ZLðnÞÞ ð14Þ
where Pmech is given by Equation (7). Note that Pmech and therefore the operating point for agiven wind speed Ufree is controlled by the load impedance function ZLðnÞ: Equation (14) isillustrated graphically in Figure 6, where two sets of Paero for different wind speeds}one for aconstant Reynolds number of 570 000 and another for variable Reynolds numbers along theblade span}have been plotted as a function of the shaft frequency together with theelectromechanical system curve Pmechðn;ZLðnÞÞ; where ZLðnÞ ¼ Z0LðnÞ � Rline was calculatedaccording to Equation (13). It is conspicuous from Figure 6 that the electromechanical systemcurve intersects the aerodynamic power curves close to the maximum power points (MPPs) in allcases, although in the case of the more realistic aerodynamic calculation (that for variableReynolds number) the MPPs occur at greater shaft frequencies than predicted by theintersection of the power curves. It is clear from the figure, however, that due to the veryflat maxima of the aerodynamic power curves this lateral displacement for the optimal operatingpoints has very little effect on the steady-state mechanical power. The load impedance curvesfor optimal mechanical power can be calculated from Equation (14) by equating CpðUfree; nÞto its maximum value CpðUfree; noptÞ at a given wind speed and solving for ZLðnoptÞ: The resultsof these calculations are shown in Figure 4 together with the experimentally determinedload impedance curve ZL;expðnÞ; both for the case of constant and variable Reynolds numberalong the blade span. It can be seen that the experimental load impedance curve coincidesfairly well with the one required for optimal aerodynamic conditions, considering a constantReynolds number of 570 000. In the case of the more realistic variable Reynolds numbercalculation higher impedance values than those provided by the charge controller would berequired, corresponding to a less steep electromechanical system curve, as one would expectfrom Figure 6.
y = 9.1062e-0.0051x
R2 = 0.9939
0
1
2
3
4
5
100 150 200 250 300 350 400 450 500
n (RPM)
ZL
(Ohm
s)Experimental data
Cp_max (const. Re)
Cp_max (var. Re)
Figure 4. Load impedance curve established by the battery charge controller.
Copyright # 2005 John Wiley & Sons, Ltd. Int. J. Energy Res. 2006; 30:633–646
J. MARTINEZ ET AL.642
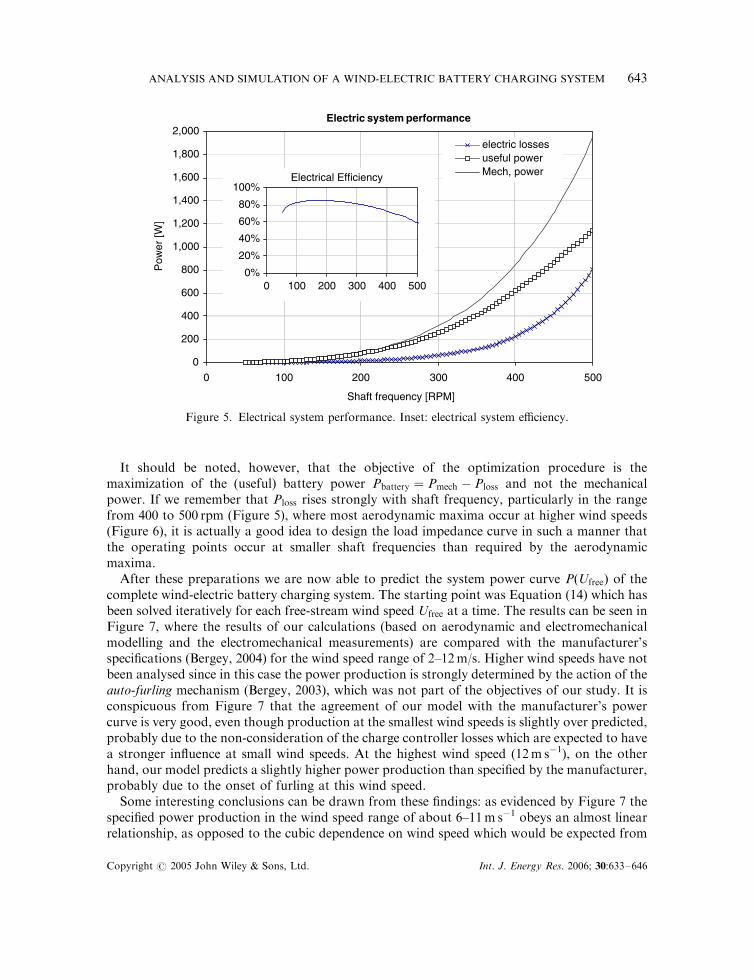
It should be noted, however, that the objective of the optimization procedure is themaximization of the (useful) battery power Pbattery ¼ Pmech � Ploss and not the mechanicalpower. If we remember that Ploss rises strongly with shaft frequency, particularly in the rangefrom 400 to 500 rpm (Figure 5), where most aerodynamic maxima occur at higher wind speeds(Figure 6), it is actually a good idea to design the load impedance curve in such a manner thatthe operating points occur at smaller shaft frequencies than required by the aerodynamicmaxima.
After these preparations we are now able to predict the system power curve PðUfreeÞ of thecomplete wind-electric battery charging system. The starting point was Equation (14) which hasbeen solved iteratively for each free-stream wind speed Ufree at a time. The results can be seen inFigure 7, where the results of our calculations (based on aerodynamic and electromechanicalmodelling and the electromechanical measurements) are compared with the manufacturer’sspecifications (Bergey, 2004) for the wind speed range of 2–12m/s. Higher wind speeds have notbeen analysed since in this case the power production is strongly determined by the action of theauto-furling mechanism (Bergey, 2003), which was not part of the objectives of our study. It isconspicuous from Figure 7 that the agreement of our model with the manufacturer’s powercurve is very good, even though production at the smallest wind speeds is slightly over predicted,probably due to the non-consideration of the charge controller losses which are expected to havea stronger influence at small wind speeds. At the highest wind speed (12m s�1), on the otherhand, our model predicts a slightly higher power production than specified by the manufacturer,probably due to the onset of furling at this wind speed.
Some interesting conclusions can be drawn from these findings: as evidenced by Figure 7 thespecified power production in the wind speed range of about 6–11m s�1 obeys an almost linearrelationship, as opposed to the cubic dependence on wind speed which would be expected from
Electric system performance
0
200
400
600
800
1,000
1,200
1,400
1,600
1,800
2,000
0 100 200 300 400 500
Shaft frequency [RPM]
Pow
er [
W]
electric lossesuseful powerMech, powerElectrical Efficiency
0%
20%
40%
60%
80%
100%
0 100 200 300 400 500
Figure 5. Electrical system performance. Inset: electrical system efficiency.
Copyright # 2005 John Wiley & Sons, Ltd. Int. J. Energy Res. 2006; 30:633–646
ANALYSIS AND SIMULATION OF A WIND-ELECTRIC BATTERY CHARGING SYSTEM 643

an operation at a (constant) maximum power coefficient for all wind speeds. The reason for thisbehaviour can be traced back to the electromechanical system curve, as we will explain briefly.
The electromechanical power losses Ploss show a marked dependence on shaft frequency(Figure 5), which translates into a significant dependence of the electromechanical efficiencyPbattery=Pmech on wind speed (inset of Figure 5). In the before mentioned range of 6–11m s�1 thisefficiency drops from slightly over 80% to 60%, thereby consuming part of the increase inaerodynamical power production. It is fairly clear that the greatest fields of opportunity of theBWC XL.1 wind-electric battery charging system lie within the electromechanical design ratherthan its aerodynamics which appear to be remarkably efficient in spite of the simple (constantchord and constant pitch) blade design.
Some possible improvements will be discussed briefly. The most obvious measure is to reducethe Joule losses caused by the low voltage transmission from generator/rectifier to the chargecontroller. A simple solution would be the use of a three-phase transformer in order to raise thetransmission voltage to a higher level and the subsequent rectification after the transmissionline, rather than before. A convenient side effect of this measure would be the reduction of therectification losses due to the voltage drop at the rectifying diodes. As a numeric example weconsider raising the transmission voltage by a factor of four, which would bringthe transmission losses from its current level of about 200W at 500 rpm down to 12.5W andthe rectifying losses from 220W to about 23W. Assuming a transformer efficiency of 95% the
0 100 200 300 400 500 6000
500
1000
1500
2000
n [RPM]
Aer
odyn
amic
pow
er [W
]12m/s
11m/s
10m/s
9m/s
8m/s
7m/s
6m/s 5m/s
Electromechanical system curve
Variable Reynolds number
Constant Reynoldsnumber
Max. power (var. Re) Max. power (const. Re)
Figure 6. Illustration of the steady-state operating points of the wind-electric battery charging system.
Copyright # 2005 John Wiley & Sons, Ltd. Int. J. Energy Res. 2006; 30:633–646
J. MARTINEZ ET AL.644

loss reductions mentioned would be somewhat offset by transformer losses of approximately80W, leaving us with an increase in power delivery to the battery bank of about 300W. It has tobe admitted, though, that this increased power capture comes at the expense of a less compactturbine design (since the transformer has to be integrated into the nacelle) and an increasednacelle weight.
5. CONCLUSIONS
A state-of-the-art wind-electric battery charging system, the BWC XL.1 with charge controller,has been analysed in a detailed fashion considering both the rotor aerodynamics and theelectromechanical system. An electromechanical model has been developed for the descriptionof the permanent-magnet synchronous generator coupled to a non-controlled six-pulse rectifierusing only rms values of all electrical quantities, and all model parameters have been determinedexperimentally. The coupling of the aerodynamical and the electromechanical models allowedfor a prediction of the steady-state operating curve PðUfreeÞ: A good prediction of the powercurve specified by the manufacturer was obtained for wind speeds between 2 and 12m s�1, if theBEM simulation is performed in the variable Reynolds number mode.
ACKNOWLEDGEMENTS
The present work was funded by the National Council for Science and Technology (CONACYT, Mexico)under contract number 40273. Its support is gratefully acknowledged. We also appreciate the enthusiastic
0
200
400
600
800
1,000
1,200
1,400
0 2 4 6 8 10 12 14
Ufree (m/s)
Pba
ttery
[W
]
Model (this work)
Manufacturer's data
Electromechanical losses
Model-constant Re
Electromechanical effciency
0%
20%
40%
60%
80%
100%
0 2 4 6 8 10 12
Ufree (m/s)
Onset of furling
Figure 7. System power curve as a function of the free-stream wind speed.Inset: electromechanical efficiency.
Copyright # 2005 John Wiley & Sons, Ltd. Int. J. Energy Res. 2006; 30:633–646
ANALYSIS AND SIMULATION OF A WIND-ELECTRIC BATTERY CHARGING SYSTEM 645

help of Humberto Bustamante and Arturo Guardiola with the measurement and processing of the airfoilco-ordinates. We specially thank Dr Luis Lauro Cantu of 1Metrologıa Electronica Mexicana for providingan electronic precision balance.
REFERENCES
Bialasiewicz JT. 2003. Furling control for small wind turbine power regulation. IEE International Symposium onIndustrial Electronics ISIE ’03, 9–11 June 2003, vol. 2. IEEE: New York; 804–809.
Bergey. 2003. BWC XL.1, 24VDC Battery Charging System, Owners Manual. Version 2.2, August 2003.Bergey. 2004. Worksheet for the performance evaluation of the BWC XL.1. Available at http://www.bergey.com/
Technical/XL.1.R.xls. Last access: March 2004.Burton T, Sharpe D, Jenkins N, Bossanyi E. 2001. Wind Energy Handbook. Wiley: UK.Corbus D, Link H, Butterfield S, Stork C, Newcomb C. 1999. Certification testing for small wind turbines. NREL/CP-
500-27062.Corbus D, Newcomb C, Baring-Gould EI, Friedly S. 2002. Battery voltage stability effects on small wind turbine energy
capture. NREL/CP-500-32511.De Broe AM, Drouilhet S, Gevorgian V. 1999. A peak power tracker for small wind turbines in battery charging
applications. IEEE Transactions on Energy Conversion 14(4):1630–1635.Eppler R, Somers D. 1980. A computer program for the design and analysis of low-speed airfoils. NASA TM-80210.Fernandez R, Mantz R, Battaiotto PE. 2001. Analisis de un sistema aislado de generacion eolica. Avances en Energıas
Renovables y Medio Ambiente 5:6.13–6.18. ISSN 0329-5184 (in Spanish).Field Verification Project for Small Wind Turbines. 2001. Fourth Quarterly Report July–September. Available at
http://www.nrel.gov/wind/verification project.html/Gevorgian V, Corbus DA, Drouilhet S, Holz R. 1998. Modeling, testing, and economic analysis battery charging station.
NREL/CP-500-2490.Gipe P. 2004. Wind Power: Renewable Energy for Home, Farm, & Business, Energy/Environment, ISBN 1-931498-14-8.Hanley P. 2004. http://www.hannleyinnovations.comHansen MOL. 2000. Aerodynamics of Wind Turbines: Rotors, Loads and Structure. James & James: UK.Heier S. 1998. Grid integration of wind energy conversion systems. Wiley: New York, ISBN 047197143X.Llamas AT, Acevedo S, Baez J, De los Reyes J. 2004. Armonicas en Sistemas Electricos Industriales. Innovacion Editorial
Lagares Mexico. ISBN 968-5785-83-X (in Spanish).Martınez J, Bernabini L, Probst O, Rodrıguez C. 2005. An improved BEMmodel for the power curve prediction of stall-
regulated wind turbines. Wind Energy, in press, DOI: 10.1002/we.147 (published online 1 December 2004).Selig MS, McGranahan BD. 2004. Wind tunnel aerodynamic tests of six airfoils for use on small wind turbine. ASME
Journal of Solar Energy Engineering 126:986–1001.Snel H. 2003. Review of aerodynamics for wind turbines. Wind Energy 6:203–211.Standish KJ, Van Dam CP. 2003. Aerodynamic analysis of blunt trailing edge airfoils. ASME Journal of Solar Energy
Engineering 125:479–487.Velasco M, Probst O, Acevedo S. 2004. Theory of wind-electric water pumping. Renewable Energy 29:873–893.
Copyright # 2005 John Wiley & Sons, Ltd. Int. J. Energy Res. 2006; 30:633–646
J. MARTINEZ ET AL.646