analisis turistico internacional
DESCRIPTION
2011 Analisis Turistico Internacional, España, Islas canariasTRANSCRIPT
Análisis turísticoInternacional
España-CanariasInternational Tourism Analysis
Centro de Iniciativas Turísticas de Santa Cruz de Tenerife

RELEVANCIA ECONÓMICA DEL TURISMOECONOMIC IMPORTANCE OF TOURISM
• Principal rama económica del planeta - 12% PIB mundial. Main economic branch of the planet - 12% of global GDP.
• Los ingresos por turismo internacional representan el 8% de las exportaciones mundiales de bienes y servicios (37% de las exportaciones de servicios. International tourism receipts accounted for 8% of world exports of goods and services (37% of exports of services).
• Empleo: 45% en pequeños países y zonas turísticas, 5% países industrializados. Employment: 45% in small countries and tourist areas, 5% in industrialized countries.

TURISTAS EN EL MUNDOTourists in the world
1950 1960 1970 1980 1990 2000 2010 2011 2020
1500
980935
682
456
288
1666925
millionFuente: Organización Mundial del Turismo (OMT).
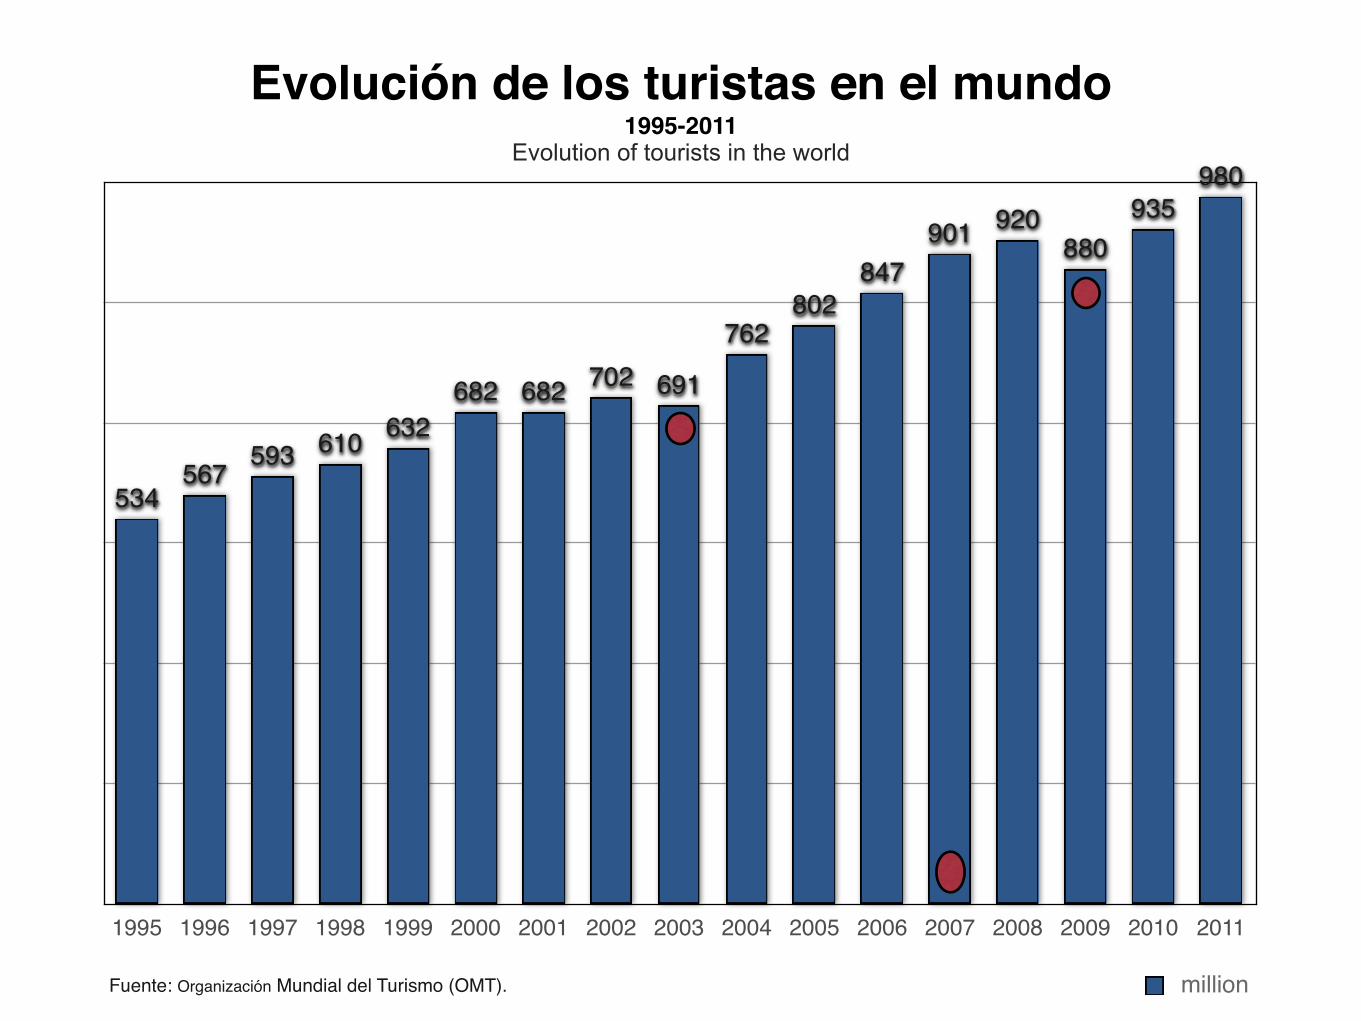
Evolución de los turistas en el mundo1995-2011
Evolution of tourists in the world
1995 1996 1997 1998 1999 2000 2001 2002 2003 2004 2005 2006 2007 2008 2009 2010 2011
980935
880920901
847802
762
691702682682632610593567
534
millionFuente: Organización Mundial del Turismo (OMT).
2011 International Tourism Results and Prospects for 2012
UNWTO News Conference HQ, Madrid, Spain16 January 2012
John G.C. KesterProgramme Manager, Tourism
Trends and Marketing Strategies
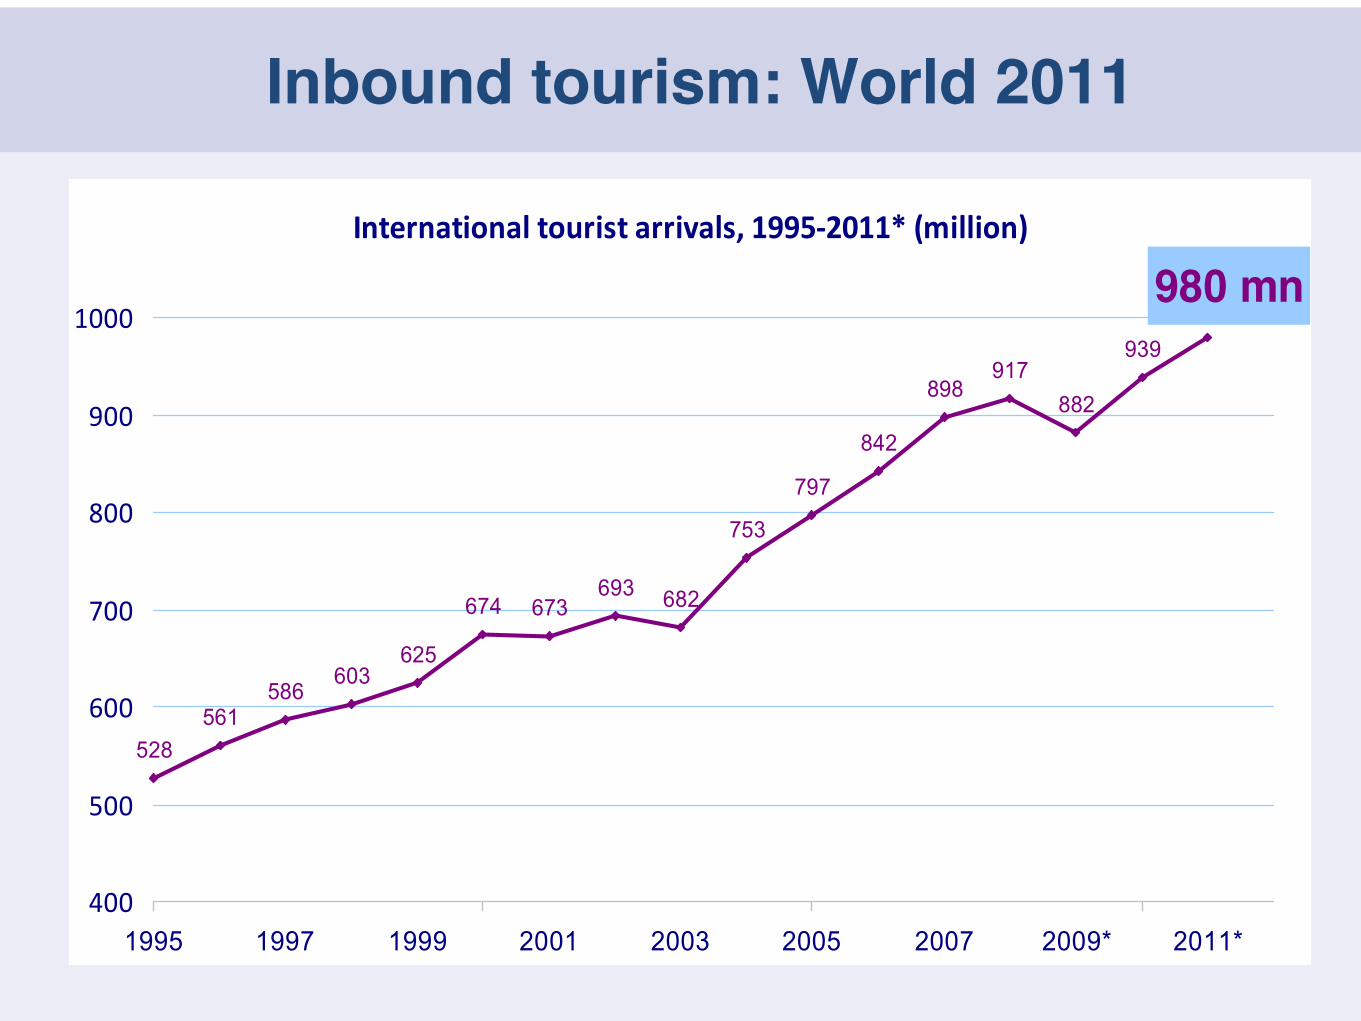
Inbound tourism: World 2011
International tourist arrivals, 1995-2011* (million)
528561
586603
625
674 673693 682
753
797
842
898917
882
939
980 mn
400
500
600
700
800
900
1000
1995 1997 1999 2001 2003 2005 2007 2009* 2011*
Source: World Tourism Organization (UNWTO)
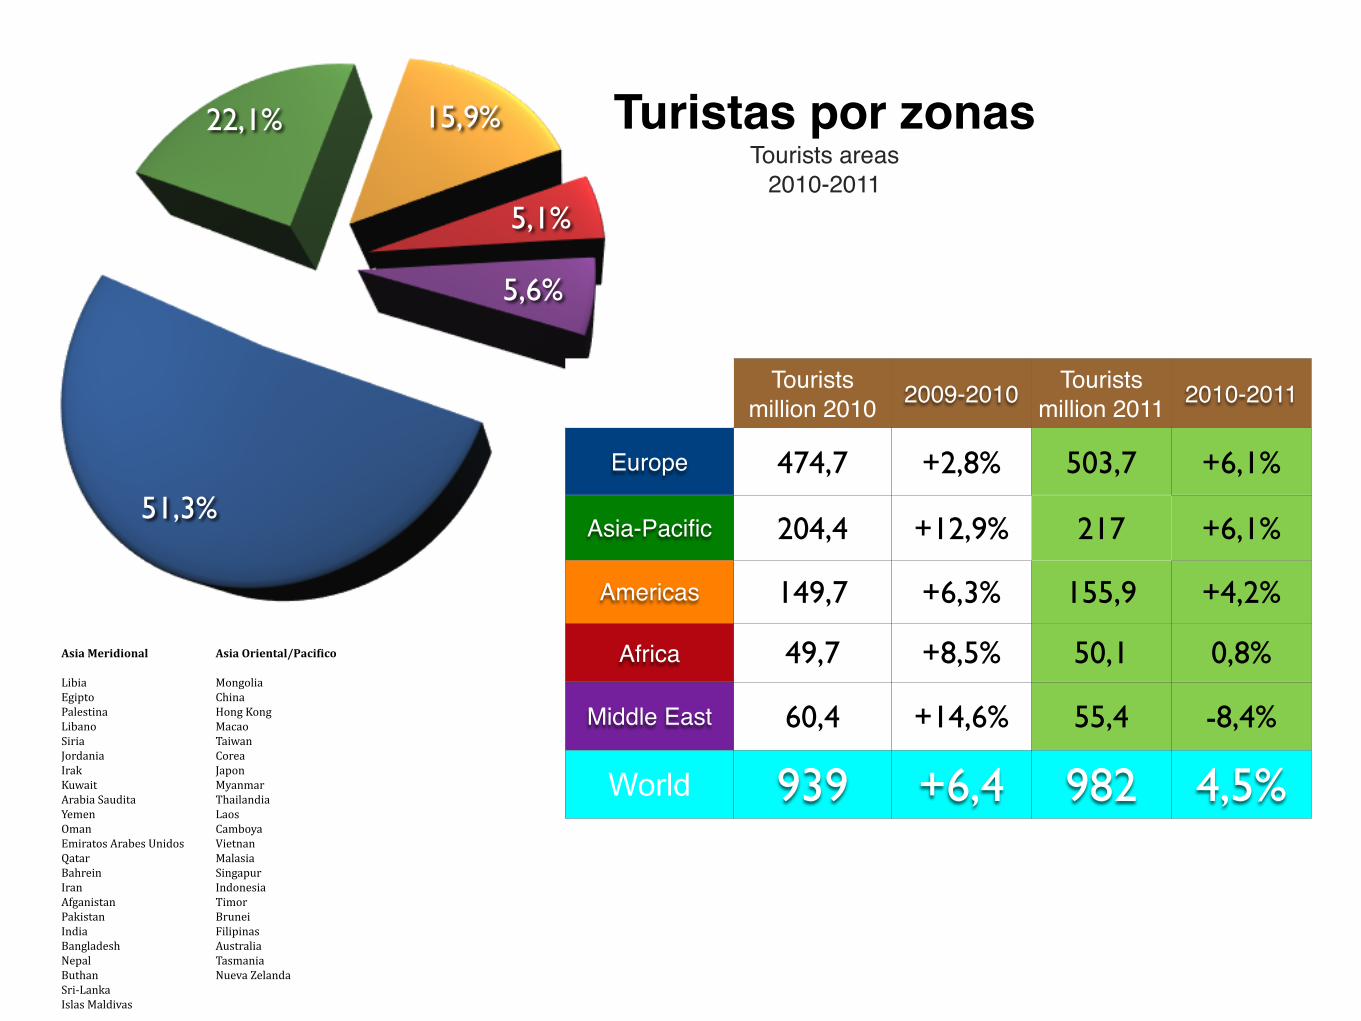
Turistas por zonasTourists areas
2010-2011
51,3%
22,1% 15,9%
5,1%
5,6%
Tourists million 2010 2009-2010 Tourists
million 2011 2010-2011
Europe
Asia-Pacific
Americas
Africa
Middle East
474,7 +2,8% 503,7 +6,1%
204,4 +12,9% 217 +6,1%
149,7 +6,3% 155,9 +4,2%
49,7 +8,5% 50,1 0,8%
60,4 +14,6% 55,4 -8,4%
World 939 +6,4 982 4,5%
Asia Oriental/Paci/ico
MongoliaChinaHong KongMacaoTaiwanCoreaJaponMyanmarThailandiaLaosCamboyaVietnanMalasiaSingapur IndonesiaTimor BruneiFilipinasAustraliaTasmaniaNueva Zelanda
Asia Meridional
LibiaEgiptoPalestinaLibanoSiriaJordaniaIrakKuwaitArabia SauditaYemenOmanEmiratos Arabes UnidosQatarBahreinIranAfganistanPakistanIndiaBangladeshNepalButhanSri-‐LankaIslas Maldivas
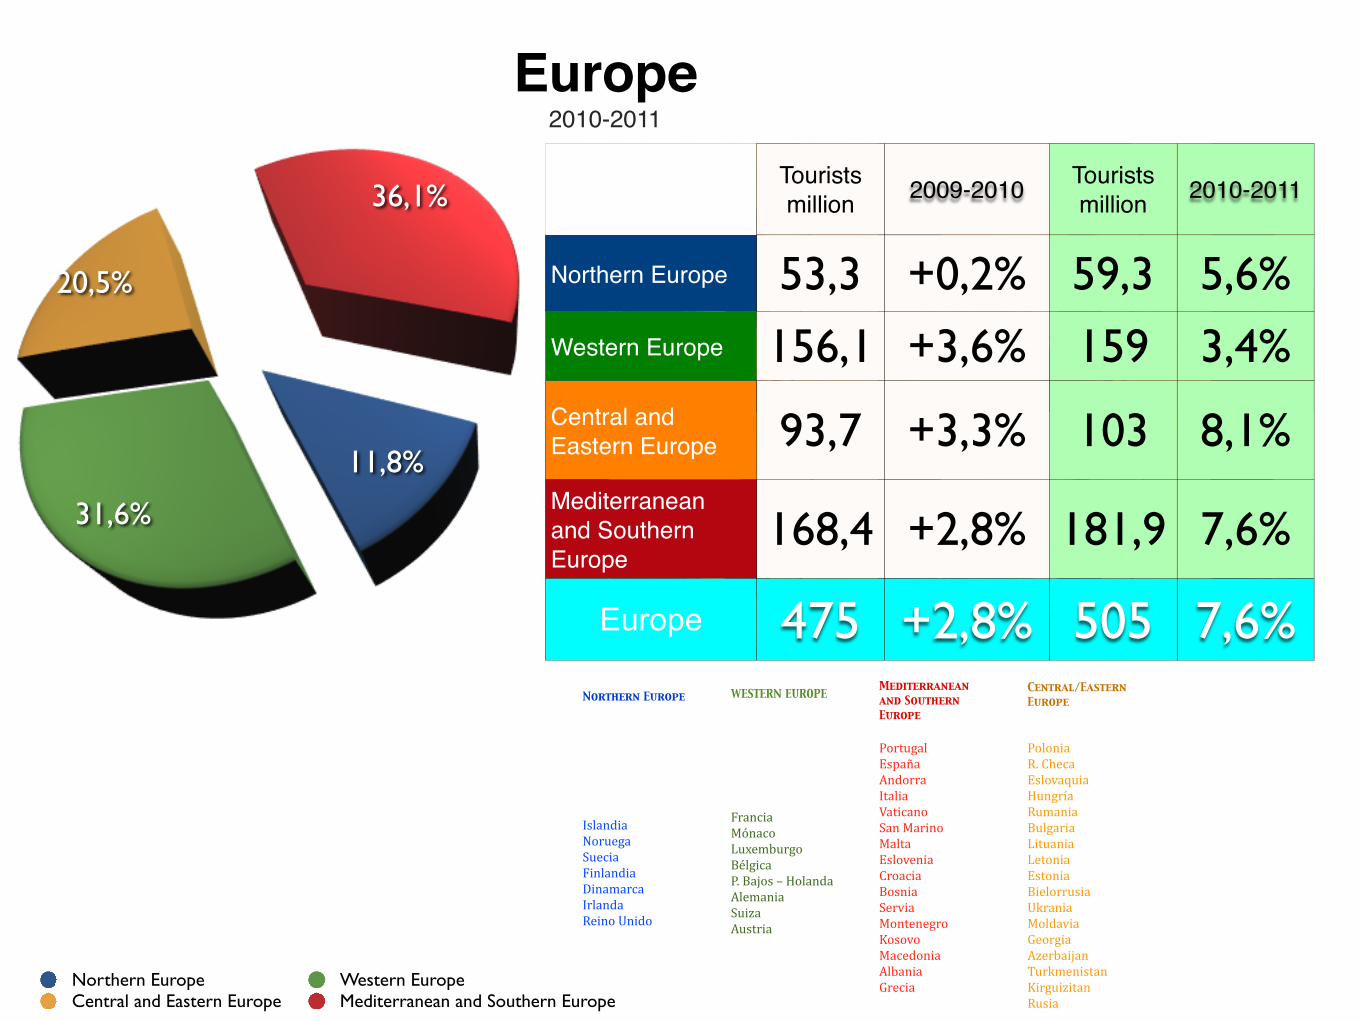
Europe2010-2011
11,8%
31,6%
20,5%
36,1%
Northern Europe Western EuropeCentral and Eastern Europe Mediterranean and Southern Europe
Tourists million 2009-2010 Tourists
million 2010-2011
Northern Europe
Western Europe
Central and Eastern Europe
Mediterranean and Southern Europe
53,3 +0,2% 59,3 5,6%
156,1 +3,6% 159 3,4%
93,7 +3,3% 103 8,1%
168,4 +2,8% 181,9 7,6%
Europe 475 +2,8% 505 7,6%Northern Europe
WESTERN EUROPE
Mediterranean and Southern Europe
Central/Eastern Europe
IslandiaNoruegaSueciaFinlandiaDinamarcaIrlandaReino Unido
FranciaMónacoLuxemburgoBélgicaP. Bajos – HolandaAlemaniaSuizaAustria
PortugalEspañaAndorraItaliaVaticanoSan MarinoMaltaEsloveniaCroaciaBosniaServiaMontenegroKosovoMacedoniaAlbaniaGrecia
PoloniaR. ChecaEslovaquiaHungríaRumaniaBulgariaLituaniaLetoniaEstoniaBielorrusiaUkraniaMoldaviaGeorgiaAzerbaijanTurkmenistanKirguizitanRusia

INGRESOS INTERNACIONALES POR TURISMOIncome International Tourism
0
275
550
825
1100
2005 2007 2008 2009 2010 2011
1030928
852940
857
678
miles millones $
+7,1%
+15,3%+9,7% +5,5%
-5,6,%
+3,8%

INGRESOS POR ZONAS International Tourism by (Sub)region
2011
Fuente: Organización Mundial del Turismo (OMT).
US$ (billion) 2010-2011
Europe
Asia-Pacific
Americas
Africa
Middle East
463,4 +5,2%
289 +4,3%199,5 +5,7%
32,6 +2,2%45,9 -14,4
World 1.030 +5,5%45,0%
28,0% 19,4%
3,2%
4,5%
Europe Asia-Pacific AmericasAfrica Middle East
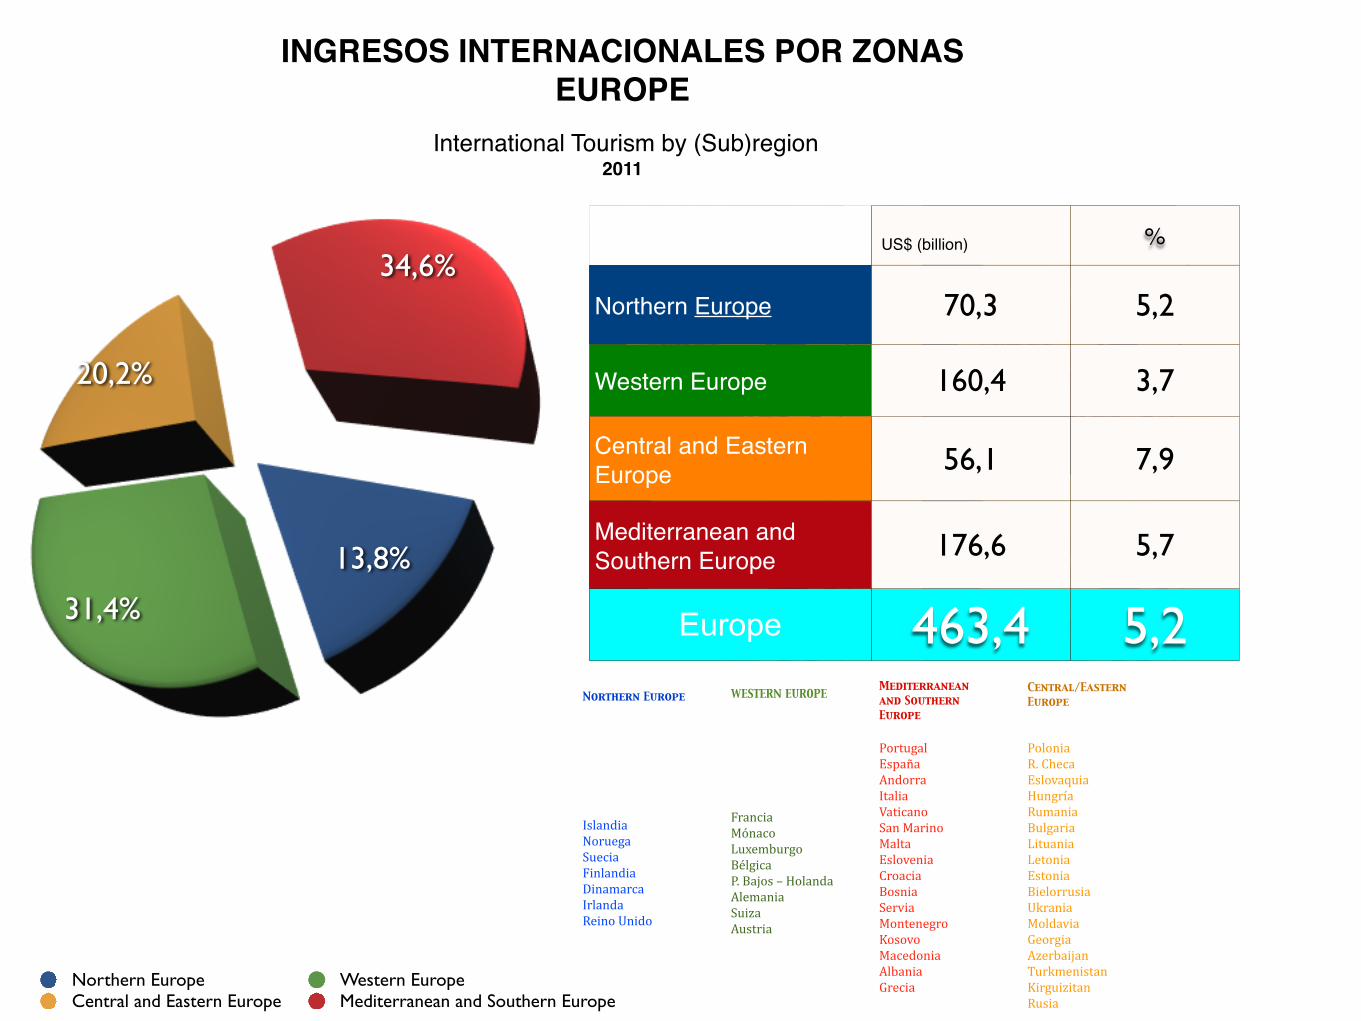
INGRESOS INTERNACIONALES POR ZONASEUROPE
International Tourism by (Sub)region 2011
13,8%
31,4%
20,2%
34,6%
Northern Europe Western EuropeCentral and Eastern Europe Mediterranean and Southern Europe
US$ (billion) %
Northern Europe
Western Europe
Central and Eastern Europe
Mediterranean and Southern Europe
70,3 5,2
160,4 3,7
56,1 7,9
176,6 5,7
Europe 463,4 5,2Northern Europe
WESTERN EUROPE
Mediterranean and Southern Europe
Central/Eastern Europe
IslandiaNoruegaSueciaFinlandiaDinamarcaIrlandaReino Unido
FranciaMónacoLuxemburgoBélgicaP. Bajos – HolandaAlemaniaSuizaAustria
PortugalEspañaAndorraItaliaVaticanoSan MarinoMaltaEsloveniaCroaciaBosniaServiaMontenegroKosovoMacedoniaAlbaniaGrecia
PoloniaR. ChecaEslovaquiaHungríaRumaniaBulgariaLituaniaLetoniaEstoniaBielorrusiaUkraniaMoldaviaGeorgiaAzerbaijanTurkmenistanKirguizitanRusia
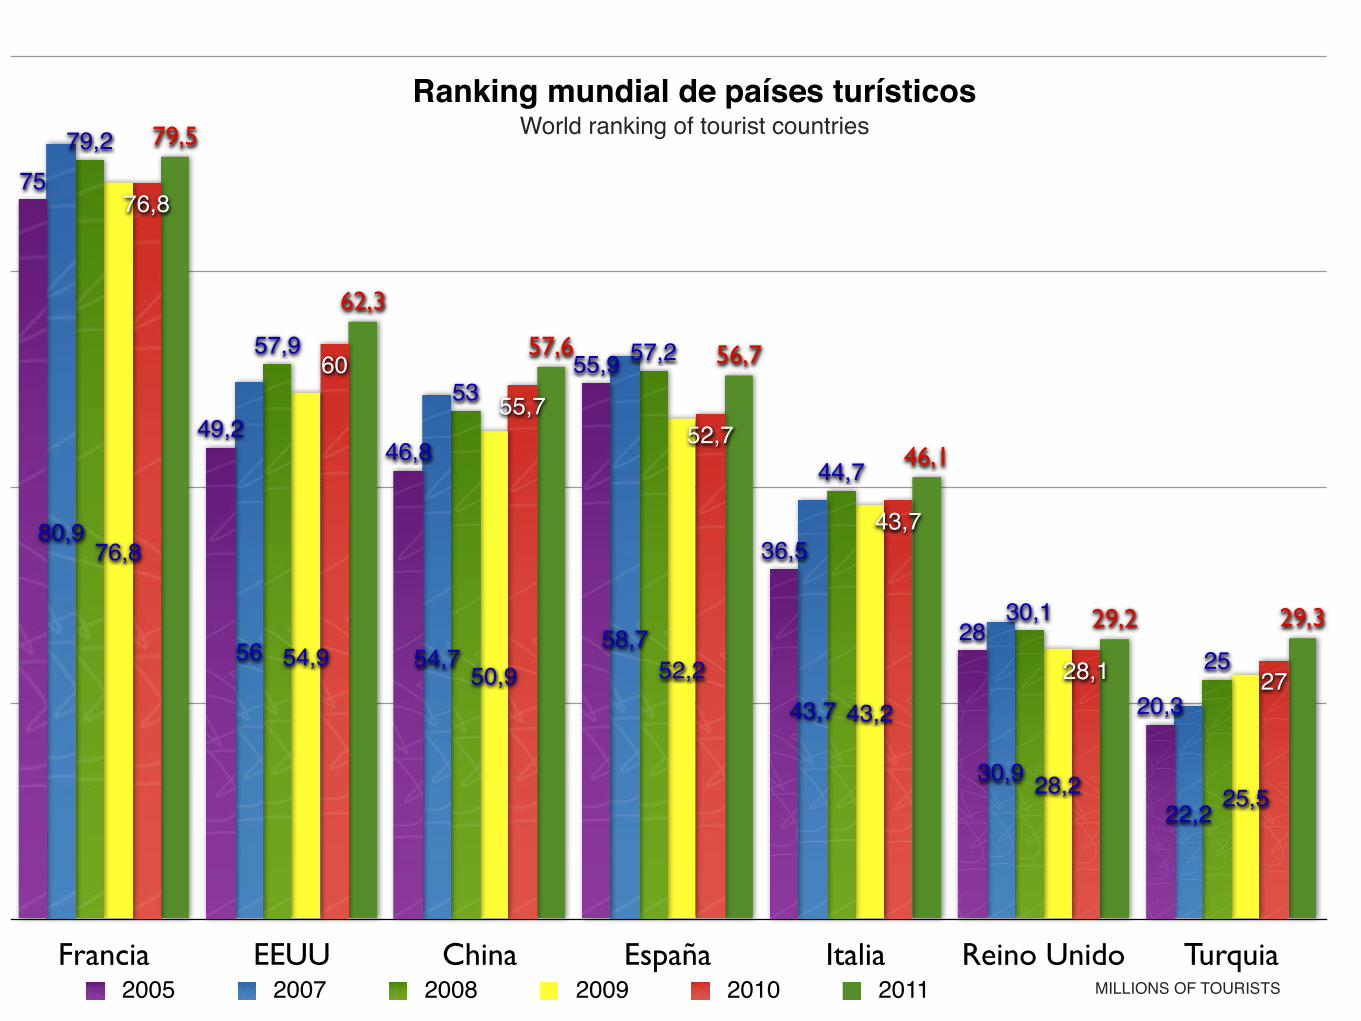
0
22,5
45
67,5
90
Francia EEUU China España Italia Reino Unido Turquia
29,329,2
46,1
56,757,6
62,3
79,5
2728,1
43,7
52,755,7
60
76,8
25,528,2
43,2
52,250,954,9
76,8
25
30,1
44,7
57,253
57,9
79,2
22,230,9
43,7
58,754,756
80,9
20,3
28
36,5
55,9
46,849,2
75
2005 2007 2008 2009 2010 2011 MILLIONS OF TOURISTS
Ranking mundial de países turísticosWorld ranking of tourist countries
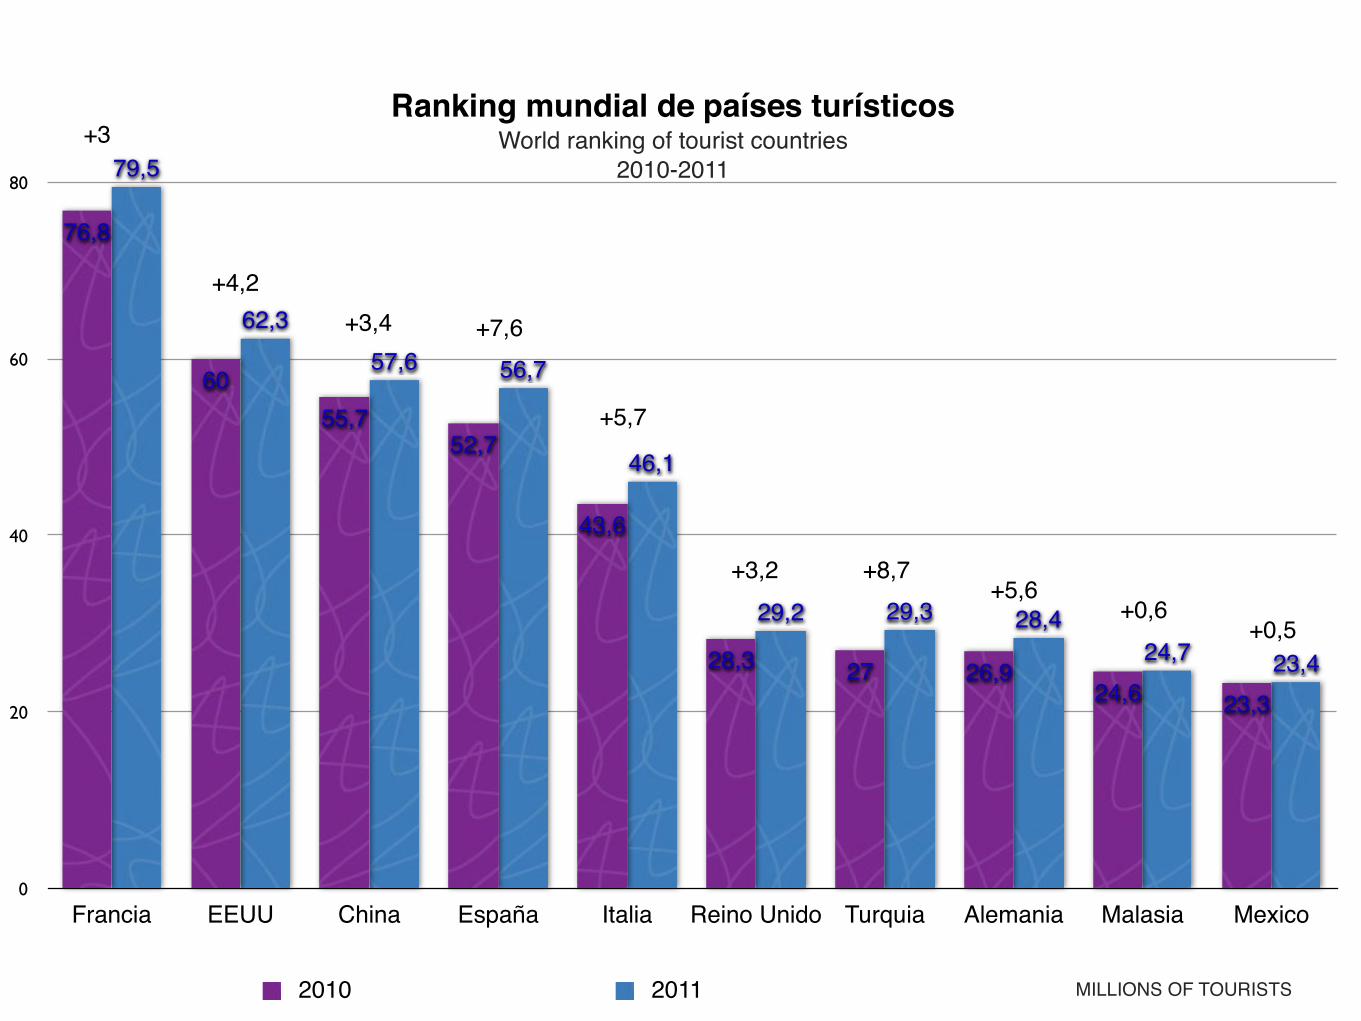
Ranking mundial de países turísticosWorld ranking of tourist countries
2010-2011
0
20
40
60
80
Francia EEUU China España Italia Reino Unido Turquia Alemania Malasia Mexico
23,424,728,429,329,2
46,1
56,757,662,3
79,5
23,324,626,92728,3
43,6
52,755,7
60
76,8
2010 2011 MILLIONS OF TOURISTS
+3
+4,2+3,4 +7,6
+5,7
+3,2 +8,7+5,6
+0,6+0,5

World's top destinations by international tourism receipts
% change over previous year Full year
(local currencies, current prices) US$ euro
Rank Series¹ 08/07 09/08 10/09 11*/10 2008 2009 2010 2011* 2008 2009 2010 2011*
'11 '10 (billion) (billion)
1 1 United States sa 13.4 -14.7 9.9 12.3 110.4 94.2 103.5 116.3 75.1 67.5 78.1 83.52 2 Spain -0.4 -9.0 3.9 8.6 61.6 53.2 52.5 59.9 41.9 38.1 39.6 43.03 3 France -2.9 -7.7 -1.1 10.1 56.6 49.5 46.6 53.8 38.5 35.5 35.1 38.74 4 China $ 9.7 -2.9 15.5 5.8 40.8 39.7 45.8 48.5 27.8 28.4 34.6 34.85 5 Italy -0.1 -7.2 1.4 5.5 45.7 40.2 38.8 43.0 31.1 28.9 29.3 30.96 6 Germany 3.2 -8.5 5.3 6.7 39.9 34.6 34.7 38.8 27.1 24.8 26.2 27.97 7 United Kingdom sa 1.6 -1.3 8.4 6.9 36.0 30.1 32.4 35.9 24.5 21.6 24.4 25.88 8 Australia 10.7 10.3 -0.2 -6.2 24.7 25.4 29.8 31.4 16.8 18.2 22.5 22.69 9 Macao (China) 26.2 6.6 53.5 .. 16.9 18.1 27.8 .. 11.5 13.0 21.0 ..
10 10 Hong Kong (China) 11.1 6.7 35.6 22.7 15.3 16.4 22.2 27.2 10.4 11.8 16.7 19.511 12 Thailand 4.9 -9.0 15.7 26.0 18.2 16.1 20.1 26.3 12.4 11.5 15.2 18.912 11 Turkey $ 18.7 -3.2 -2.1 10.6 22.0 21.3 20.8 23.0 14.9 15.2 15.7 16.513 13 Austria 7.6 -5.3 0.9 1.7 21.6 19.4 18.6 19.9 14.7 13.9 14.0 14.314 14 Malaysia 5.6 9.1 5.9 -5.1 15.3 15.8 18.3 18.3 10.4 11.3 13.8 13.115 18 Singapore 10.9 -10.1 41.4 17.4 10.7 9.4 14.1 18.0 7.3 6.7 10.7 12.916 16 Switzerland 6.7 -1.4 1.5 -0.1 14.4 14.1 15.0 17.6 9.8 10.1 11.3 12.617 17 India 14.4 8.3 18.1 19.6 11.8 11.1 14.2 17.5 8.0 8.0 10.7 12.618 15 Canada -0.2 -6.0 4.2 3.5 15.7 13.7 15.7 16.9 10.7 9.8 11.9 12.219 21 Greece 2.8 -10.6 -7.6 9.3 17.1 14.5 12.7 14.6 11.6 10.4 9.6 10.520 20 Netherlands -6.6 -2.3 9.6 6.8 13.3 12.4 12.9 14.4 9.1 8.9 9.7 10.421 24 Sweden 0.4 6.3 1.7 12.9 11.2 10.3 11.1 13.9 7.6 7.4 8.4 10.022 26 Korea, Republic of $ 59.2 0.5 5.5 18.8 9.8 9.8 10.4 12.3 6.6 7.0 7.8 8.823 23 Mexico $ 3.4 -15.2 4.3 -0.8 13.3 11.3 11.8 11.7 9.0 8.1 8.9 8.424 30 Russian Federation $ 25.4 -20.9 -5.7 29.1 11.8 9.4 8.8 11.4 8.1 6.7 6.7 8.225 27 Portugal 0.5 -7.2 10.0 7.2 10.9 9.6 10.1 11.3 7.4 6.9 7.6 8.1
Source: World Tourism Organization (UNWTO) © (Data as collected by UNWTO May 2012)¹

Los ciudadanos que más viajan en el mundoPeople traveling in the world more
2011
Los españoles están en 11ª posición.Realizaron unos 20 millones de viajes.
Alemanes
Británicos
EEUU
Franceses
Chinos 39
40
60
75
90

Turistas recibidos en EspañaForeign tourists staying in Spain
2000-2011
2000 2001 2002 2003 2004 2005 2006 2007 2008 2009 2010 2011
56,7
52,752,2
57,358,758,455,9
53,652,451,749,548,2
2ª 3ª 4ª3ª 4ª
Primavera Arabe
Crisis Econimica
Internacional
Crisis Econimica
Internacional

Nacionalidades de los turistas en España2011
Nationalities of tourists in Spain
Reino Unido
Alemania
Francia
Países Nordicos
Italia
Países Bajos
Portugal
Belgica
Suiza
Irlanda
EEUU
Rusia 0,8
1,1
1,2
1,3
1,7
1,7
2,77
3,7
3,8
8,5
9
13,61
Millones

Vías de acceso a EspañaAccess routes to Spain
2011
Aeropuertos77,6%
Carretera19,2%
Puertos2,7% Tren
0,5%

Gasto medio por tipo de alojamiento, por personaAverage expenditure by type of accommodation, per person
2011
TOTAL
HOTELERO
NO HOTELERO
926,7
935,1
932
47,2
60,8
53,4
66,7
136,3
97,6
Gasto total medio diarioGasto destino medio diarioGasto total medio persona Euros

Estancia Media en EspañaAverage stay in Spain
Hoteleno No Hotelero alquiler propiedad amigos/familiares camping otros
14,8
11,610,4
16,917,6
13
7
Dias

Ranking Turístico por ComunidadesEspaña
2001-2011Autonomous Cominidades tourist Ranking
Cataluña
Baleares
Canarias
Andalucia
Valencia
Madrid4,6
5,4
7,88
10,18
10,09
13,77
4,8
5,1
7,3
8,2
9
12,7
2,9
5,1
7,1
10,7
10,2
10,1
2001 2009 2011
2001 2009 2011
1.- CANARIAS 1.- CATALUÑA 1.- CATALUÑA
2.- BALEARES 2.- BALEARES 2.- CANARIAS
3.- CATALUÑA 3.- CANARIAS 3.- BALEARES
4.- ANDALUCIA 4.- ANDALUCIA 4.- ANDALUCIA
5.- VALENCIA 5.- VALENCIA 5.- VALENCIA
6.- MADRID 6.- MADRID 6.- MADRID