analisis multivariado parcial
TRANSCRIPT
8/7/2019 analisis multivariado PARCIAL
http://slidepdf.com/reader/full/analisis-multivariado-parcial 1/8
Journal of Hazardous Materials 164 (2009) 288–295
Contents lists available at ScienceDirect
Journal of Hazardous Materials
j o u r n a l h o m e p a g e : w w w . e l s e v i e r . c o m / l o c a t e / j h a z m a t
Application of multicriteria decision analysis to jar-test results for chemicalsselection in the physical–chemical treatment of textile wastewater
P. Aragonés-Beltrán a, J.A. Mendoza-Roca b,∗, A. Bes-Piá a, M. García-Melón b, E. Parra-Ruiz b
a Department of Engineering Projects, Polytechnic University of Valencia, Camino de Vera s/n, 46022 Valencia, Spainb Department of Chemical and Nuclear Engineering, Polytechnic University of Valencia, Camino de Vera s/n, 46022 Valencia, Spain
a r t i c l e i n f o
Article history:
Received 20 May 2008
Received in revised form 1 August 2008
Accepted 6 August 2008
Available online 22 August 2008
Keywords:
Jar-test
Physical–chemical treatment
Multicriteria decision analysis
Textile wastewater
a b s t r a c t
Jar-test is a well-known tool for chemicals selection for physical–chemical wastewater treatment. Jar-
test results show the treatment efficiency in terms of suspended matter and organic matter removal.
However,in spite of having all these results, coagulant selection is not an easy task because one coagulant
can remove efficiently the suspended solids but at the same time increase the conductivity or increase
considerablythe sludge productioncontaining chemicals and toxic dyes. This makes the final selection of
coagulants very dependent on the relative importance assigned to each measured parameter.
In this paper, theuse ofmulticriteria decision analysis (MCDA) is proposedto help on theselection of the
coagulant and its concentration in the physical–chemical wastewater treatment, since textile wastewater
contains hazardous substances. Therefore, starting from the parameters fixed by the jar-test results, these
techniques will allow to weight these parameters, according to the judgements of wastewater experts,
and to establish priorities among coagulants. Two well-known MCDA techniques have been used: ana-
lytic hierarchic process (AHP) and preference ranking organization method for enrichment evaluations
(PROMETHEEs) and their results were compared.
Themethod proposedhas beenappliedto the particularcase of textile wastewaters.The results obtained
show that MCDA techniques are useful tools to select the chemicals for the physical-technical treatment.
© 2008 Elsevier B.V. All rights reserved.
1. Introduction
Physical–chemical treatment of wastewaters is widely used in
the field of the waste industrial effluents. Its application in tex-
tile industries can be performed in combination with a biological
treatment or as unique treatment if the final effluent is discharged
into a sewer. By means of a physical–chemical treatment, removal
efficiencies of both suspended solids and COD can reach values up
to 95 and 70%, respectively, [1,2] and colour can also be removed
depending on the chemical used [3]. Other authors report about
processes combining physical–chemical treatment with hydrol-
ysis/acidification and Fenton oxidation [4] and about biological
treatment plus membrane processes [5].
Jar-tests are a valuable tool in wastewater treatment to evalu-
ate the efficiency of a physical–chemical treatment [6]. Chemicals
selection and optimum operating conditions (pH and chemicals
concentrations) are determined by means of these experiments.
However, selection of the best chemical and the best condi-
tions is not an easy task, since high suspended and organic matter
∗ Corresponding author. Tel.: +34 963877630; fax: +34 963877639.
E-mail address: [email protected] (J.A. Mendoza-Roca).
removals are coupled withan increase in conductivityand above all
an increase in the sludge production. Besides, the coagulant selec-
tion is difficult at first sight since different coagulants show many
similar results. Thus, decision hasto be made accordingto different
criteria and not only evaluating the pollutants removal efficiency.
In this work, multicriteria decision analysis (MCDA) is proposed
as a tool forhelping in thedesign of thephysical–chemical wastew-
ater treatment. MCDA “is a term that includes a set of concepts,
methods and techniques that seek to help individuals or groups
to make decisions, which involve several points of view in conflict
and multiple stakeholders” [7]. All these MCDA conceptsand meth-
ods have been largely studied in the operational research literature
[7,8].
Selectionof the mathematicalmodel based on MCDA is not easy.
According to Bouyssou et al. [9], there are several models that can
be used ina decision-makingprocess. There is nobest model.In this
paper, the use of two well-known MCDA techniques is proposed:
analytic hierarchy process (AHP) [10] and PROMETHEE II [11], the
results of which will be analysed and compared.
In the field of water management the MCDA techniques have
already been used by different authors. AHP has been applied in
Refs. [12–14]. On the other hand, PROMETHEE has been used in
Refs. [15,16]. Other different MCDA techniques have been used in
0304-3894/$ – see front matter © 2008 Elsevier B.V. All rights reserved.
doi:10.1016/j.jhazmat.2008.08.046

8/7/2019 analisis multivariado PARCIAL
http://slidepdf.com/reader/full/analisis-multivariado-parcial 2/8
P. Aragonés-Beltrán et al. / Journal of Hazardous Materials 164 (2009) 288–295 289
Refs. [17–19]. However, no references related to jar-test coagulant
selection have been found.
2. Material and methods
2.1. Wastewater characterization
Theparameters analysedwere conductivity, pH,COD, colour andturbidity. COD was determined with Spectroquant Nova 60 from
Merck and turbidity with D-112 apparatus from DINKO. Both con-
ductivity and pH were measured with CRISON apparatus. Colour
was calculated by means of the spectral absorption coefficients at
three differentwavelengths (436, 525 and 620nm) according to the
following equation [20]:
colour =A2
436 + A2525 + A2
620
A436 + A525 + A620(1)
Absorption coefficients values were measured by means of a spec-
trophotometer UV-Visible HP 8453.
2.2. Chemicals
Testscan be dividedinto fourgroupsdependingon thecoagulant
used. These chemicals were:
• Coagulant A. It is a polymeric liquid chemical based on alu-
minium.• FeCl3 combined with an anionic flocculant (anionic polyacry-
lamide).• Coagulant B. It is formulated as a combination of inorganic and
organic coagulants (mainly ferric sulphate).• Coagulant C. It is an organic cationic coagulant.
2.3. Jar-tests
Physical–chemical experiments were carried out in a multiplestirrer jar-test apparatus from SELECTA. The procedure consisted
in introducing 900 mL of the sample in the jars, then the coagulant
was added and rapidly mixed (180rpm)during3 min. Afterthat, the
paddles velocity was decreased down to 50 rpm and the flocculant
was added in thetests in which ferricchloride was used. At last, the
paddles were withdrawn so that the particles could settle during
30min [21].
In all tests COD, turbidity, colour, pH and conductivity of the
clarified water and the sludge volume after 30 min sedimentation
(V 30) were measured.
2.4. Evaluation process
The decision-making process proposed in the present work con-
sists of the following steps (Fig. 1).
For the proper development of the process a group of experts
was chosen. The main tasks of the experts were (i) To choose the
coagulants to be tested and their concentrations, (ii) to define the
jar-test parameters and to carry out the experiments and (iii) to
weight the criteria.
The participation of experts in the processes of multicriteria
evaluation is widely extended and enhances de value of the results
obtained. [22]
2.5. Chemicals selection with MCDA: the AHP and PROMETHEE
methods
2.5.1. The AHP method
The AHP proposed by Saaty is a measurement theory of intan-
gible criteria [23]. AHP is based on the fact that the inherent
complexity of a multiple criteria decision-making problem can be
solved through the construction of hierarchic structures consisting
of a goal, criteria and alternatives.
In each hierarchical level paired comparisons are made with
judgments using numerical values taken from the AHP absolute
fundamental scale of 1–9. These comparisons lead to dominance
matricesfrom which ratio scales are derivedin the formof principal
eigenvectors. These matrices are positive and reciprocal (aij = 1/aji).
The synthesis of AHP combines multidimensional scales of mea-
surement into a single one-dimensional scale of priorities. For
mathematical details see Refs. [10,24].The method has the additional advantage of being easy to
explain to the experts that have to assess the different criteria or
alternatives in a simple and systematic way. The support software,
Expert Choice 2000 (EC 2000), also enables the calculations and
presentation of the results to be done easily and quickly.
Fig. 1. Decision-making process.
8/7/2019 analisis multivariado PARCIAL
http://slidepdf.com/reader/full/analisis-multivariado-parcial 3/8
290 P. Aragonés-Beltrán et al. / Journal of Hazardous Materials 164 (2009) 288–295
2.5.2. The PROMETHEE methods
The PROMETHEE I and II methods belong to the family of the
outranking methods in MCDA [11]. The difference between them is
thatPROMETHEE I allows the construction of a partial pre-ordering
andPROMETHEEII a complete pre-orderingon a finite setof feasible
alternatives. In this work PROMETHEE II has been chosen because
the objective is to obtain a complete rank order of the different
alternatives. For that, the algorithm of the method starting fromthe evaluation matrix associates a preference function (generalised
criterion) to each criterion considering the difference on values
between the alternatives for this specific criterion. This preference
function takes values between 0 and 1 and allows the establish-
ment of indifference and preference thresholds. The authors of the
method propose six types of preference functions. After that, the
preference structure is based on pairwise comparisons so that a
new matrix of aggregated preference indexes can be created. Each
value of this matrix is obtained by multiplying (for each criterion
in which alternative A is better than B) the value of its weight
by the value of the preference function. From this matrix and for
each alternative, a positive flux (˚+) is calculated which quanti-
fies how much this alternative dominates theothers and a negative
flux(˚−) which quantifies how much this alternative is dominated
by the others. The support software, DecisionLab, also enables the
calculations and presentation of the results to be done easily and
quickly.
3. Results
3.1. Wastewater characterization
In Table 1, characterization results of the raw wastewater of
a printing, dyeing and finishing textile industry are shown. As
expected, for textile wastewaters COD is approximately 2.5 times
higher than for domestic wastewaters. Other characteristics to be
highlighted are the alkaline pH (10.5), the salt content, given by the
conductivity and the brown colour.
3.2. Criteria weights
The criteria weights statementis essential in anyMCDA process.
The assessment and interpretation of criteria weights have been
matters of controversy in the operational research field. The mean-
ings of weights differ according to the models and to the decision
contexts [7]. Nowadays one of the most used and recommended
technique to assess weights is the AHP. Once the criteria have been
established, theAHP method allows establishing a scaleof priorities
among the criteria by means of binary comparisons.
To this end, a specific questionnaire was designed to obtain the
judgements of each expert. After that, the weights were calculated
with the aid of the EC2000 software, which allows both individ-
ual and combined (mean of individual ones) results. It also enables
inconsistencies to be analysed and resolved.
The weights obtained for the different criteria are shown in
Table 2. Finally, it hasto be pointed outthatcost (measured in D /kg)
has been added to the six-jar-test criteria.
Table 1
Characterization of textile wastewater samples
Parameter
Conductivity (mS/cm) 2.09
COD (mg/L) 2560
Colour 1.34
pH 10.5
Turbidity (NTU) 140.9
Table 2
Weights of the different criteria according to the experts committee tests
Criteria Weights
COD 0.412
Turbidity 0.172
pH 0.140
Conductivity 0.049
Colour 0.085
V 30 0.081Cost 0.061
For all experts COD was the most important factor to be
considered, followed by turbidity. Weights of the other crite-
ria were ranged depending on the expert. It was supposed
that a physical–chemical treatment did not change dramatically
the wastewater characteristics concerning conductivity, colour
and pH.
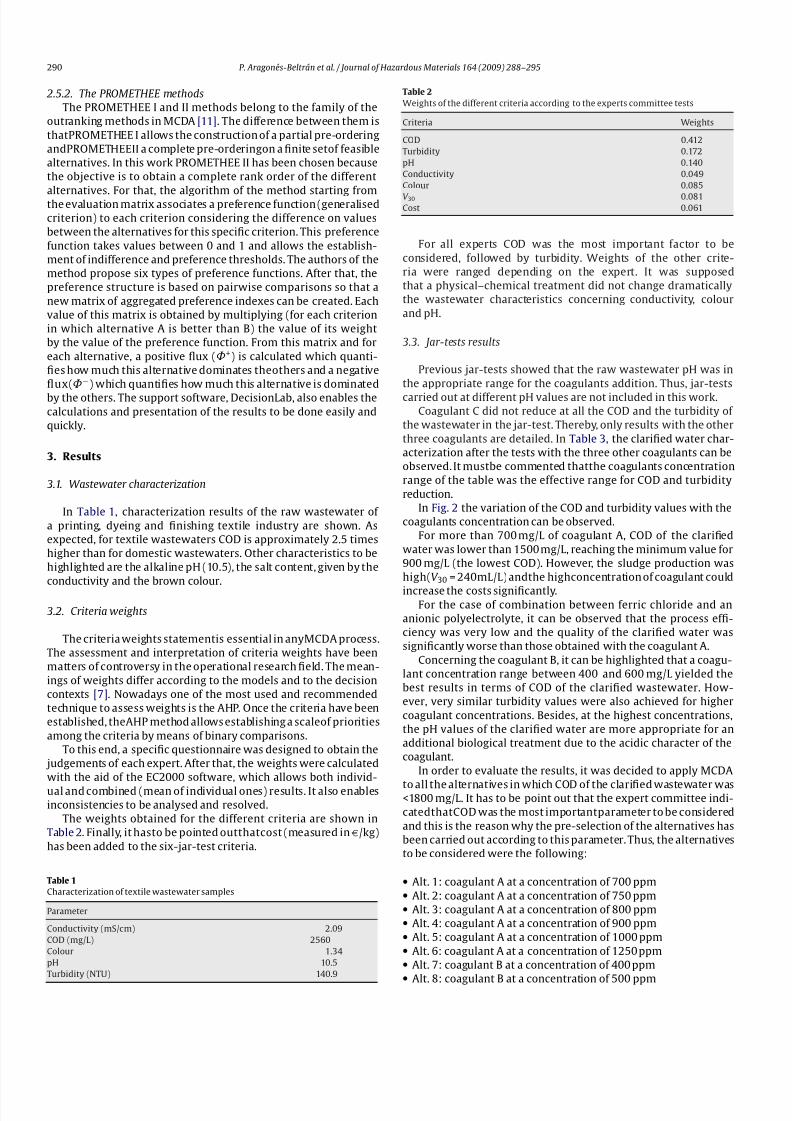
3.3. Jar-tests results
Previous jar-tests showed that the raw wastewater pH was in
the appropriate range for the coagulants addition. Thus, jar-tests
carried out at different pH values are not included in this work.Coagulant C did not reduce at all the COD and the turbidity of
the wastewater in the jar-test. Thereby, only results with the other
three coagulants are detailed. In Table 3, the clarified water char-
acterization after the tests with the three other coagulants can be
observed. It mustbe commented thatthe coagulants concentration
range of the table was the effective range for COD and turbidity
reduction.
In Fig. 2 the variation of the COD and turbidity values with the
coagulants concentration can be observed.
For more than 700 mg/L of coagulant A, COD of the clarified
water was lower than 1500mg/L, reaching the minimum value for
900 mg/L (the lowest COD). However, the sludge production was
high(V 30 = 240mL/L) andthe highconcentration of coagulant could
increase the costs significantly.For the case of combination between ferric chloride and an
anionic polyelectrolyte, it can be observed that the process effi-
ciency was very low and the quality of the clarified water was
significantly worse than those obtained with the coagulant A.
Concerning the coagulant B, it can be highlighted that a coagu-
lant concentration range between 400 and 600 mg/L yielded the
best results in terms of COD of the clarified wastewater. How-
ever, very similar turbidity values were also achieved for higher
coagulant concentrations. Besides, at the highest concentrations,
the pH values of the clarified water are more appropriate for an
additional biological treatment due to the acidic character of the
coagulant.
In order to evaluate the results, it was decided to apply MCDA
to all the alternatives in which COD of the clarified wastewater was<1800 mg/L. It has to be point out that the expert committee indi-
catedthatCOD was the most importantparameter to be considered
and this is the reason why the pre-selection of the alternatives has
been carried out according to this parameter. Thus, the alternatives
to be considered were the following:
• Alt. 1: coagulant A at a concentration of 700 ppm• Alt. 2: coagulant A at a concentration of 750 ppm• Alt. 3: coagulant A at a concentration of 800 ppm• Alt. 4: coagulant A at a concentration of 900 ppm• Alt. 5: coagulant A at a concentration of 1000 ppm• Alt. 6: coagulant A at a concentration of 1250ppm• Alt. 7: coagulant B at a concentration of 400 ppm•
Alt. 8: coagulant B at a concentration of 500 ppm
8/7/2019 analisis multivariado PARCIAL
http://slidepdf.com/reader/full/analisis-multivariado-parcial 4/8
P. Aragonés-Beltrán et al. / Journal of Hazardous Materials 164 (2009) 288–295 291
Fig. 2. Influence of coagulants concentration on COD and turbidity.
• Alt. 9: coagulant B at a concentration of 600 ppm• Alt. 10: coagulant B at a concentration of 700 ppm• Alt. 11: coagulant B at a concentration of 800 ppm• Alt. 12: coagulant B at a concentration of 950 ppm
3.4. Evaluation and decision matrix
The decision matrix (Table 4) was made from the results
obtained in the previous steps.
Table 3
Water characterization after different j ar-tests with the coagulants tested
Coagulant A
Concentration (mg/L)
250 500 600 700 750 800 900 1000 1250
COD (mg/L) 1908 1965 1815 1740 1405 1415 1350 1375 1420
Turbidity (NTU) 62.0 61.5 63.5 56.5 55.5 52.0 51.0 50.5 63.0
pH 9.8 9.2 9.6 8.9 8.9 8.6 8.4 8.5 7.6
Conductivity (mS/cm) 1.43 1.37 1.71 1.71 1.70 1.69 1.70 1.69 1.26
Colour 1.01 0.91 0.81 0.66 0.64 0.61 0.55 0.49 0.8
V 30 (mL/L) 40 95 125 160 180 180 240 325 350
Ferric chloride+ anionic polyelectrolite
Flocculant (mg/L)
1 5 10
5a 25a 120a 15a 125a 130a 25a 140a 250a
COD (mg/L) 2200 1915 2025 2170 1820 2020 2040 1900 1980
Turbidity (NTU) 64.0 63.0 70.0 66.0 65.0 65.5 62.0 68.0 66.0
pH 10.4 10.4 10.2 10.2 10.2 10.1 10.4 10.2 9.9
Conductivity (mS/cm) 2.09 2.03 1.69 2.01 1.81 1.74 1.99 1.71 1.67
Colour 1.08 1.03 1.31 1.04 1.14 1.33 1.02 1.34 1.46
V 30 (mL/L) 12 40 40 39 54 40 41 40 58
Coagulant B
Concentration (mg/L)
50 100 250 400 500 600 700 800 950
COD (mg/L) 2210 2000 1855 1308 1296 1248 1565 1465 1645
Turbidity (NTU) 67.5 65.0 50.5 50.0 46.5 48.5 47.0 46.5 44.5
pH 10.1 10.0 9.8 9.8 9.7 9.6 7.5 7.9 7.8
Conductivity (mS/cm) 1.99 1.90 1.87 1.76 1.71 1.69 2.10 1.94 2.18
Colour 1.07 0.88 0.62 0.56 0.61 0.43 0.64 0.51 0.54
V 30 (mL/L) 31 61 96 100 110 120 58 60 64
a
FeCl3 concentration (mg/L).

8/7/2019 analisis multivariado PARCIAL
http://slidepdf.com/reader/full/analisis-multivariado-parcial 5/8
292 P. Aragonés-Beltrán et al. / Journal of Hazardous Materials 164 (2009) 288–295
Table 4
Decision matrix
COD (mg/L) Turbidity (NTU) pH Conductivity (mS/cm) Colour V 30 (mL/L) Cost (D /kg)
0.412a 0.172a 0.140a 0.049a 0.085a 0.081a 0.061a
ALT.1.A700 1740.00 56.50 8.90 1.71 0.66 160.00 6.70
ALT.2.A750 1405.00 55.50 8.90 1.70 0.64 180.00 7.18
ALT.3.A800 1415.00 52.00 8.60 1.69 0.61 180.00 7.66
ALT.4.A900 1350.00 51.00 8.40 1.70 0.55 240.00 8.62
ALT.5.A1000 1375.00 50.50 8.50 1.69 0.49 325.00 9.58ALT.6.A1250 1420.00 63.00 7.60 1.26 0.80 350.00 1.97
ALT.7.B400 1308.00 50.00 9.80 1.76 0.56 100.00 7.00
ALT.8.B500 1296.00 46.50 9.70 1.71 0.61 110.00 8.75
ALT.9.B600 1248.00 48.50 9.60 1.69 0.43 120.00 10.50
ALT.10.B700 1565.00 47.00 7.50 2.10 0.64 58.00 12.25
ALT.11.B800 1465.00 46.50 7.90 1.94 0.51 60.00 14.00
ALT.12.B950 1645.00 44.50 7.80 2.18 0.54 64.00 16.63
a Weight.
3.5. Evaluation with AHP
The AHP method has been applied to calculate the criteria
weights and the final rank of the alternatives. In our case the value
of the different alternatives relative to each covering criterion has
been given in an objective way. Thus, these values reflect the deci-sion maker preferences (except that of pH). Therefore, these values
have been introduced in a direct way in the software EC2000 and
normalised with the sum.
For criterionpH thefollowing utility function(uf) hasbeen used:
• If pH <5.5≤uf = 0 (pH should be increased if either an additional
biological treatment ora discharge tothe sewer haveto be carried
out).• If pH≤ [5.5–6.5]≥uf=0.5.• If pH≤ [6.5–8.5]≥uf = 1 (optimum value for a biological treat-
ment and for a discharge to the sewer).• If pH≤ [8.5–9.5]≥uf=0.5.• If pH> 9.5≥uf = 0 (pH should be decreased if either a biological
treatment or a discharge to the sewer have to be carried out).
Fig. 3 presents the final results obtained with EC 2000. The
values shown represent the preference ratio associated to each
alternative. According to this method the best alternative is coag-
ulant B at a concentration of 800 mg/L because it has a preference
ratio of 9.54%. Following in the ranking we can find a group of four
coagulants with very similar ratios (B700, B950, B900 and A1000).
The worst ranked coagulant is A at a concentration of 700 mg/L.
3.5.1. Sensitivity analysis
The weightof the criteria has a big influencein the rank order of
the alternatives. The decision maker must know the degree of reli-
ability of the results in order to be able to make the final decision.
Therefore, a sensitivity analysis is recommended to be used once
the global order of alternatives has been obtained. This consists incalculating again the rank order of the alternatives but with modi-
fications in the weight of each criterion. With the help of software
EC 2000 a complete sensitivity analysis can be performed. The way
to do that is to increasingly or decreasingly modify the weight of
each criterion little by little while the rest of the criteria weights
remain fixed. In that way, the contribution of each criterion to the
value of the alternatives may be analysed. After proceeding with
the sensitivity analysis, the alternatives ranking may change. The
analysis of all the possible changes can be done with the help of
Expert Choice 2000, which has a very powerful and user-friendly
sensitivity analysis module.
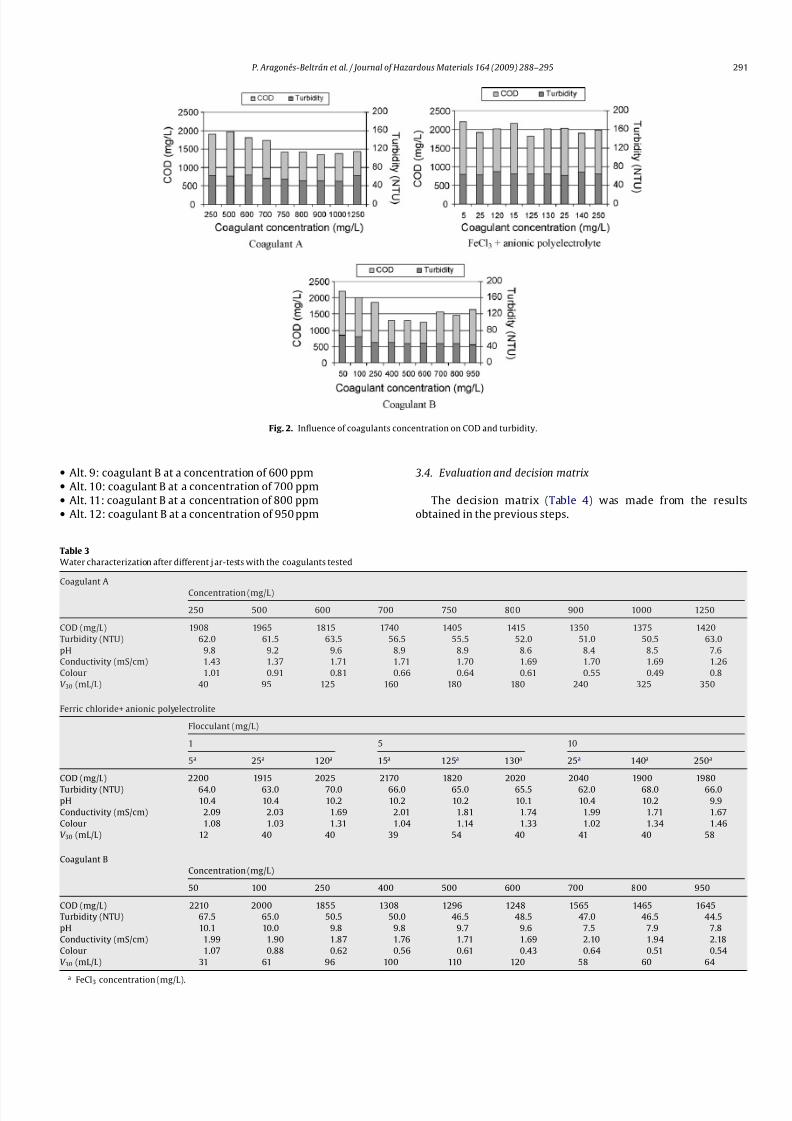
As an example, in Fig. 4 a graphical representation of one
of the sensitivity analysis performed is presented. It shows on
the left side the criteria weights modified in order to study theinfluence of the COD criterion weight (the most important one)
on the preference ratios for the different alternatives (shown on
the right side). For that, the COD weight had to be increased
from 41.2% (Table 2) up to 67.5% so that the alternatives B800
and A900 could have the same preference ratio. That means that
the weight of criterion COD has to be deeply modified in order
to change the rank order of alternative B800, which shows that
results are stable in front of weight modifications smaller than
20%.
Fig. 3. Evaluation results with AHP.
8/7/2019 analisis multivariado PARCIAL
http://slidepdf.com/reader/full/analisis-multivariado-parcial 6/8
P. Aragonés-Beltrán et al. / Journal of Hazardous Materials 164 (2009) 288–295 293
Fig. 4. Sensitivity analysis for COD criterion.
3.6. Evaluation with PROMETHEE II
The PROMETHEE method is sensitive to the type of the pref-
erence function chosen for each criterion. PROMETHEE does not
propose a particular way of calculating the criteria weightings.
In this work, the criteria weightings determined in Section 3.2
(by means of AHP) have been used for the application of the
PROMETHEE method, as other authors recommend [25].
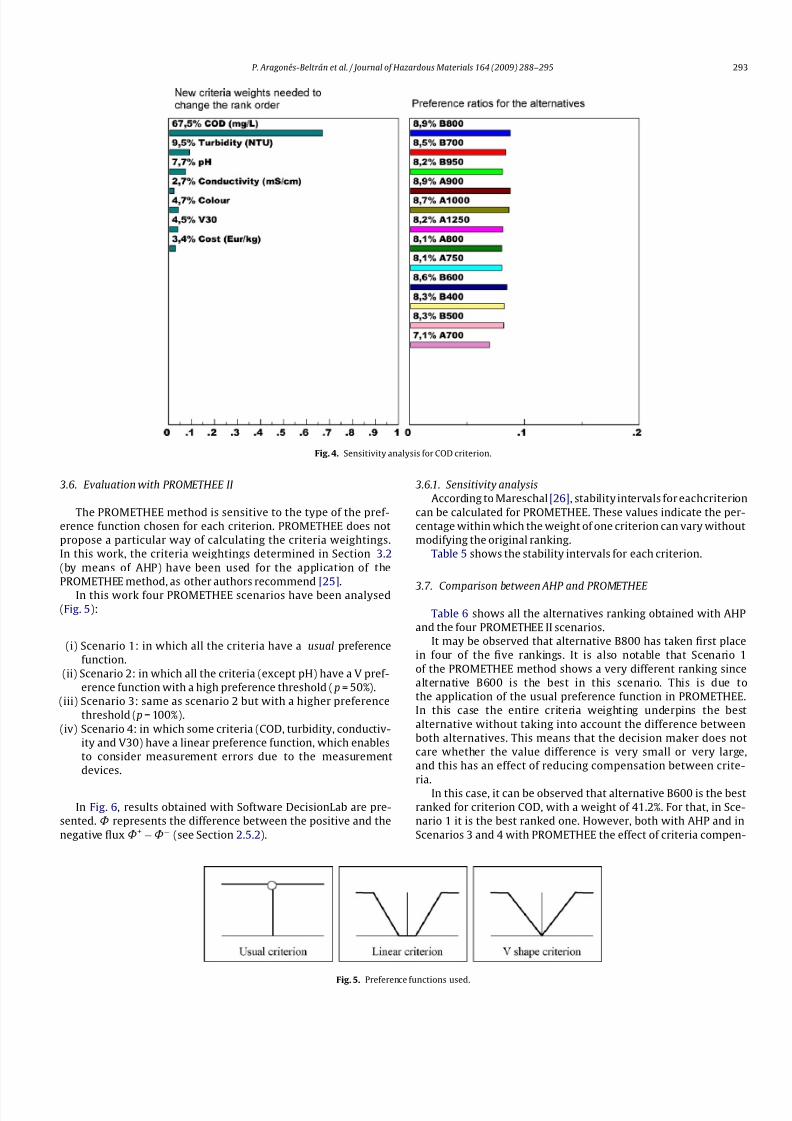
In this work four PROMETHEE scenarios have been analysed
(Fig. 5):
(i) Scenario 1: in which all the criteria have a usual preference
function.
(ii) Scenario 2: in which all the criteria (except pH) have a V pref-
erence function with a high preference threshold (p = 50%).
(iii) Scenario 3: same as scenario 2 but with a higher preference
threshold (p = 100%).
(iv) Scenario 4: in which some criteria (COD, turbidity, conductiv-
ity and V30) have a linear preference function, which enables
to consider measurement errors due to the measurement
devices.
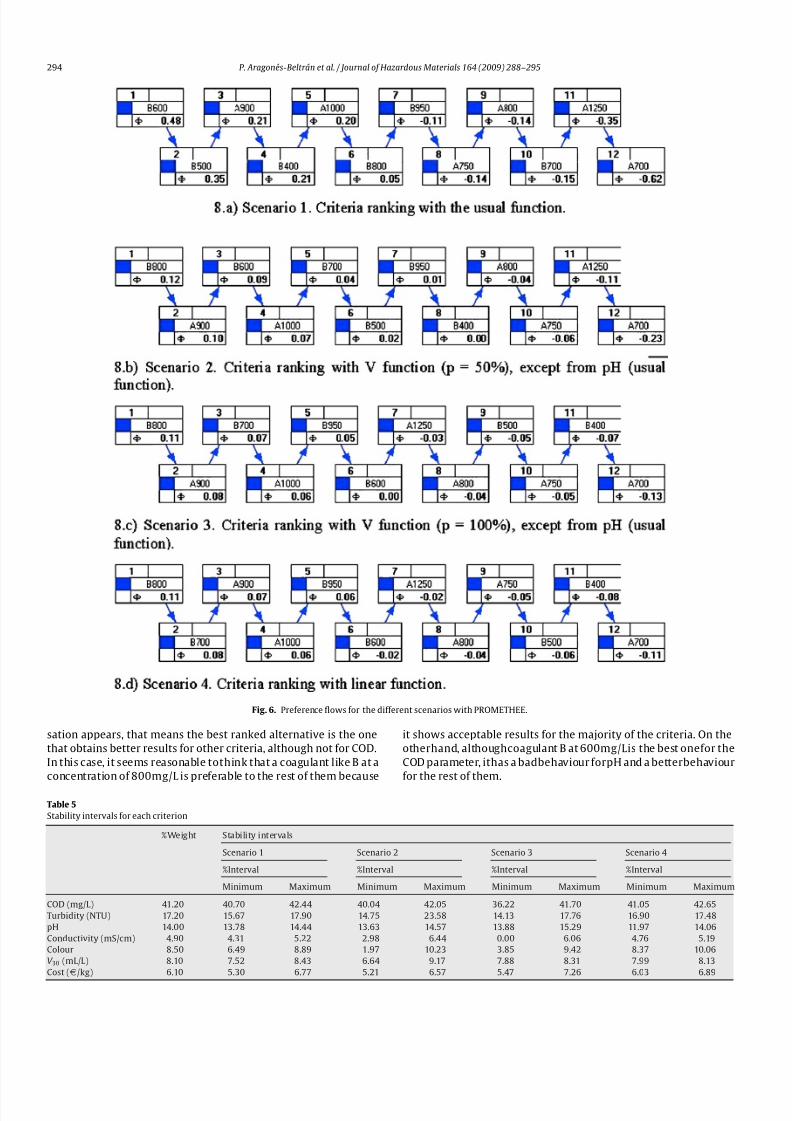
In Fig. 6, results obtained with Software DecisionLab are pre-
sented. ˚ represents the difference between the positive and the
negative flux ˚+−˚− (see Section 2.5.2).
3.6.1. Sensitivity analysis
According to Mareschal[26], stability intervals for eachcriterion
can be calculated for PROMETHEE. These values indicate the per-
centage within which the weight of one criterion can vary without
modifying the original ranking.
Table 5 shows the stability intervals for each criterion.
3.7. Comparison between AHP and PROMETHEE
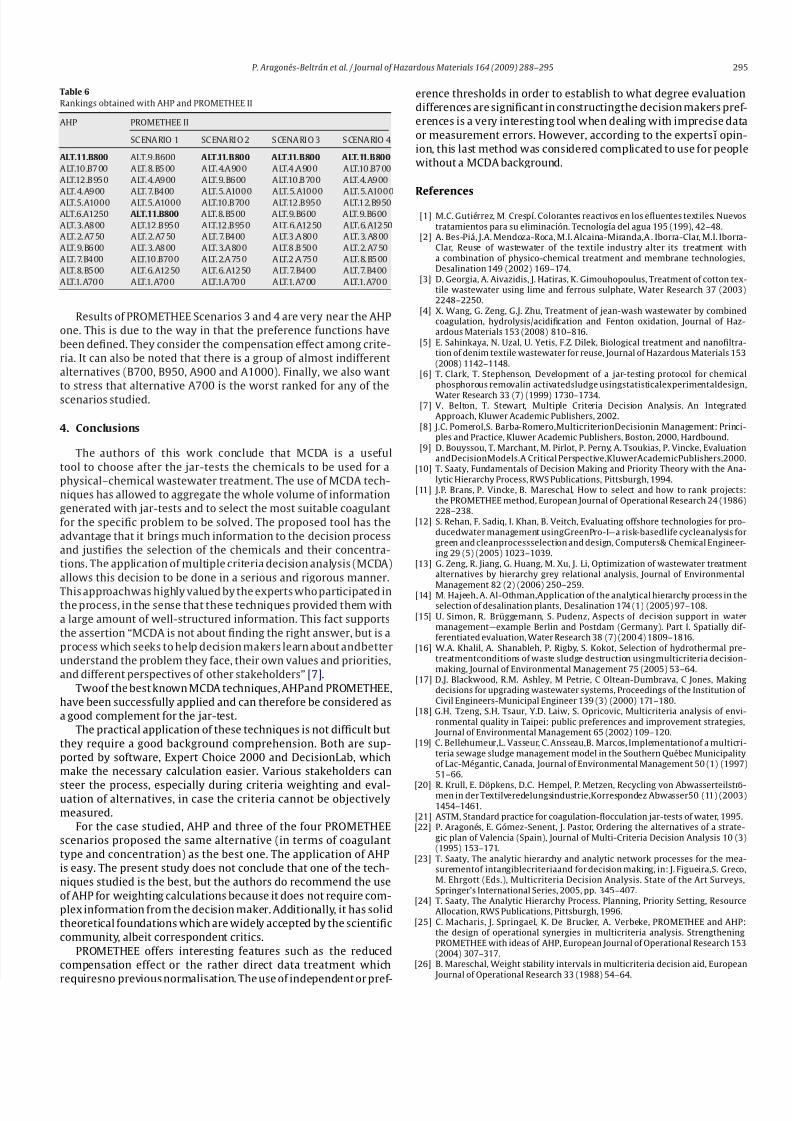
Table 6 shows all the alternatives ranking obtained with AHP
and the four PROMETHEE II scenarios.
It may be observed that alternative B800 has taken first place
in four of the five rankings. It is also notable that Scenario 1
of the PROMETHEE method shows a very different ranking since
alternative B600 is the best in this scenario. This is due to
the application of the usual preference function in PROMETHEE.
In this case the entire criteria weighting underpins the best
alternative without taking into account the difference between
both alternatives. This means that the decision maker does not
care whether the value difference is very small or very large,
and this has an effect of reducing compensation between crite-
ria.
In this case, it can be observed that alternative B600 is the best
ranked for criterion COD, with a weight of 41.2%. For that, in Sce-
nario 1 it is the best ranked one. However, both with AHP and in
Scenarios 3 and 4 with PROMETHEE the effect of criteria compen-
Fig. 5. Preference functions used.
8/7/2019 analisis multivariado PARCIAL
http://slidepdf.com/reader/full/analisis-multivariado-parcial 7/8
294 P. Aragonés-Beltrán et al. / Journal of Hazardous Materials 164 (2009) 288–295
Fig. 6. Preference flows for the different scenarios with PROMETHEE.
sation appears, that means the best ranked alternative is the one
that obtains better results for other criteria, although not for COD.
In this case, it seems reasonable tothink that a coagulant like B at a
concentration of 800mg/L is preferable to the rest of them because
it shows acceptable results for the majority of the criteria. On the
otherhand, althoughcoagulant B at 600mg/Lis the best onefor the
COD parameter, ithas a badbehaviour forpH and a betterbehaviour
for the rest of them.
Table 5
Stability intervals for each criterion
%Weight Stability intervals
Scenario 1 Scenario 2 Scenario 3 Scenario 4
%Interval %Interval %Interval %Interval
Minimum Maximum Minimum Maximum Minimum Maximum Minimum Maximum
COD (mg/L) 41.20 40.70 42.44 40.04 42.05 36.22 41.70 41.05 42.65
Turbidity (NTU) 17.20 15.67 17.90 14.75 23.58 14.13 17.76 16.90 17.48
pH 14.00 13.78 14.44 13.63 14.57 13.88 15.29 11.97 14.06
Conductivity (mS/cm) 4.90 4.31 5.22 2.98 6.44 0.00 6.06 4.76 5.19
Colour 8.50 6.49 8.89 1.97 10.23 3.85 9.42 8.37 10.06
V 30 (mL/L) 8.10 7.52 8.43 6.64 9.17 7.88 8.31 7.99 8.13
Cost (D /kg) 6.10 5.30 6.77 5.21 6.57 5.47 7.26 6.03 6.89
8/7/2019 analisis multivariado PARCIAL
http://slidepdf.com/reader/full/analisis-multivariado-parcial 8/8
P. Aragonés-Beltrán et al. / Journal of Hazardous Materials 164 (2009) 288–295 295
Table 6
Rankings obtained with AHP and PROMETHEE II
AHP PROMETHEE II
SCENARIO 1 SCENARI O 2 S CENARI O 3 S CENARIO 4
ALT.11.B800 ALT.9.B600 ALT.11.B800 ALT.11.B800 ALT.11.B800
ALT.10.B700 ALT. 8. B500 ALT. 4.A900 ALT.4.A900 ALT.10.B700
ALT.12.B950 ALT.4.A900 ALT.9.B600 ALT.10.B700 ALT.4.A900
ALT.4.A900 ALT.7.B400 ALT.5.A1000 ALT.5.A1000 ALT.5.A1000
ALT.5.A1000 ALT.5.A1000 ALT.10.B700 ALT.12.B950 ALT.12.B950
ALT.6.A1250 ALT.11.B800 ALT.8.B500 ALT.9.B600 ALT.9.B600
ALT.3.A800 ALT.12.B950 ALT.12.B950 ALT.6.A1250 ALT.6.A1250
ALT. 2. A750 ALT. 2. A750 ALT. 7. B400 ALT.3.A800 ALT. 3. A800
ALT. 9. B600 ALT. 3. A800 ALT. 3.A800 ALT.8.B 500 ALT. 2. A750
ALT. 7. B400 ALT.10.B700 ALT. 2.A750 ALT.2.A750 ALT. 8. B500
ALT.8.B500 ALT.6.A1250 ALT.6.A1250 ALT.7.B400 ALT.7.B400
ALT.1. A700 ALT.1. A700 ALT.1.A700 ALT.1. A700 ALT.1. A700
Results of PROMETHEE Scenarios 3 and 4 are very near the AHP
one. This is due to the way in that the preference functions have
been defined. They consider the compensation effect among crite-
ria. It can also be noted that there is a group of almost indifferent
alternatives (B700, B950, A900 and A1000). Finally, we also want
to stress that alternative A700 is the worst ranked for any of the
scenarios studied.
4. Conclusions
The authors of this work conclude that MCDA is a useful
tool to choose after the jar-tests the chemicals to be used for a
physical–chemical wastewater treatment. The use of MCDA tech-
niques has allowed to aggregate the whole volume of information
generated with jar-tests and to select the most suitable coagulant
for the specific problem to be solved. The proposed tool has the
advantage that it brings much information to the decision process
and justifies the selection of the chemicals and their concentra-
tions. The application of multiple criteria decision analysis (MCDA)
allows this decision to be done in a serious and rigorous manner.
This approachwas highly valued by the experts who participated inthe process, in the sense that these techniques provided them with
a large amount of well-structured information. This fact supports
the assertion “MCDA is not about finding the right answer, but is a
process which seeks to help decision makers learn about andbetter
understand the problem they face, their own values and priorities,
and different perspectives of other stakeholders” [7].
Twoof the best known MCDA techniques, AHPand PROMETHEE,
have been successfully applied and can therefore be considered as
a good complement for the jar-test.
The practical application of these techniques is not difficult but
they require a good background comprehension. Both are sup-
ported by software, Expert Choice 2000 and DecisionLab, which
make the necessary calculation easier. Various stakeholders can
steer the process, especially during criteria weighting and eval-uation of alternatives, in case the criteria cannot be objectively
measured.
For the case studied, AHP and three of the four PROMETHEE
scenarios proposed the same alternative (in terms of coagulant
type and concentration) as the best one. The application of AHP
is easy. The present study does not conclude that one of the tech-
niques studied is the best, but the authors do recommend the use
of AHP for weighting calculations because it does not require com-
plex information from the decision maker. Additionally, it has solid
theoretical foundations which are widely accepted by the scientific
community, albeit correspondent critics.
PROMETHEE offers interesting features such as the reduced
compensation effect or the rather direct data treatment which
requiresno previous normalisation. The use of independent or pref-
erence thresholds in order to establish to what degree evaluation
differences are significant in constructingthe decision makers pref-
erences is a very interesting tool when dealing with imprecise data
or measurement errors. However, according to the expertsı̌ opin-
ion, this last method was considered complicated to use for people
without a MCDA background.
References
[1] M.C. Gutiérrez, M. Crespí. Colorantes reactivos en los efluentes textiles. Nuevostratamientos para su eliminación. Tecnología del agua 195 (199), 42–48.
[2] A. Bes-Piá, J.A. Mendoza-Roca, M.I. Alcaina-Miranda,A . Iborra-Clar, M.I. Iborra-Clar, Reuse of wastewater of the textile industry alter its treatment witha combination of physico-chemical treatment and membrane technologies,Desalination 149 (2002) 169–174.
[3] D. Georgia, A. Aivazidis, J. Hatiras, K. Gimouhopoulus, Treatment of cotton tex-tile wastewater using lime and ferrous sulphate, Water Research 37 (2003)2248–2250.
[4] X. Wang, G. Zeng, G.J. Zhu, Treatment of jean-wash wastewater by combinedcoagulation, hydrolysis/acidification and Fenton oxidation, Journal of Haz-ardous Materials 153 (2008) 810–816.
[5] E. Sahinkaya, N. Uzal, U. Yetis, F.Z. Dilek, Biological treatment and nanofiltra-tion of denim textile wastewater for reuse, Journal of Hazardous Materials 153(2008) 1142–1148.
[6] T. Clark, T. Stephenson, Development of a jar-testing protocol for chemicalphosphorous removalin activatedsludge usingstatisticalexperimentaldesign,
Water Research 33 (7) (1999) 1730–1734.[7] V. Belton, T. Stewart, Multiple Criteria Decision Analysis. An Integrated
Approach, Kluwer Academic Publishers, 2002.[8] J.C. Pomerol,S. Barba-Romero,MulticriterionDecisionin Management: Princi-
ples and Practice, Kluwer Academic Publishers, Boston, 2000, Hardbound.[9] D. Bouyssou, T. Marchant, M. Pirlot, P. Perny, A. Tsoukias, P. Vincke, Evaluation
andDecisionModels.A Critical Perspective,KluwerAcademicPublishers,2000.[10] T. Saaty, Fundamentals of Decision Making and Priority Theory with the Ana-
lytic Hierarchy Process, RWS Publications, Pittsburgh, 1994.[11] J.P. Brans, P. Vincke, B. Mareschal, How to select and how to rank projects:
the PROMETHEE method, European Journal of Operational Research 24 (1986)228–238.
[12] S. Rehan, F. Sadiq, I. Khan, B. Veitch, Evaluating offshore technologies for pro-ducedwater management usingGreenPro-I—a risk-basedlife cycleanalysis forgreen and cleanprocessselection and design, Computers& Chemical Engineer-ing 29 (5) (2005) 1023–1039.
[13] G. Zeng, R. Jiang, G. Huang, M. Xu, J. Li, Optimization of wastewater treatmentalternatives by hierarchy grey relational analysis, Journal of Environmental
Management 82 (2) (2006) 250–259.[14] M. Hajeeh, A. Al-Othman,Application of the analytical hierarchy process in theselection of desalination plants, Desalination 174 (1) (2005) 97–108.
[15] U. Simon, R. Brüggemann, S. Pudenz, Aspects of decision support in watermanagement—example Berlin and Postdam (Germany). Part I. Spatially dif-ferentiated evaluation, Water Research 38 (7) (200 4) 1809–1816.
[16] W.A. Khalil, A. Shanableh, P. Rigby, S. Kokot, Selection of hydrothermal pre-treatmentconditions of waste sludge destruction usingmulticriteria decision-making, Journal of Environmental Management 75 (2005) 53–64.
[17] D.J. Blackwood, R.M. Ashley, M Petrie, C Oltean-Dumbrava, C Jones, Makingdecisions for upgrading wastewater systems, Proceedings of the Institution of Civil Engineers-Municipal Engineer 139 (3) (2000) 171–180.
[18] G.H. Tzeng, S.H. Tsaur, Y.D. Laiw, S. Opricovic, Multicriteria analysis of envi-ronmental quality in Taipei: public preferences and improvement strategies,Journal of Environmental Management 65 (2002) 109–120.
[19] C. Bellehumeur,L. Vasseur, C. Ansseau,B. Marcos, Implementationof a multicri-teria sewage sludge management model in the Southern Québec Municipalityof Lac-Mégantic, Canada, Journal of Environmental Management 50 (1) (1997)51–66.
[20] R. Krull, E. Döpkens, D.C. Hempel, P. Metzen, Recycling von Abwasserteilströ-men in der Textilveredelungsindustrie,Korrespondez Abwasser50 (11) (2003)1454–1461.
[21] ASTM, Standard practice for coagulation-flocculation jar-tests of water, 1995.[22] P. Aragonés, E. Gómez-Senent, J. Pastor, Ordering the alternatives of a strate-
gic plan of Valencia (Spain), Journal of Multi-Criteria Decision Analysis 10 (3)(1995) 153–171.
[23] T. Saaty, The analytic hierarchy and analytic network processes for the mea-surementof intangiblecriteriaand for decision making, in: J. Figueira,S. Greco,M. Ehrgott (Eds.), Multicriteria Decision Analysis. State of the Art Surveys,Springer’s International Series, 2005, pp. 345–407.
[24] T. Saaty, The Analytic Hierarchy Process. Planning, Priority Setting, ResourceAllocation, RWS Publications, Pittsburgh, 1996.
[25] C. Macharis, J. Springael, K. De Brucker, A. Verbeke, PROMETHEE and AHP:the design of operational synergies in multicriteria analysis. StrengtheningPROMETHEE with ideas of AHP, European Journal of Operational Research 153(2004) 307–317.
[26] B. Mareschal, Weight stability intervals in multicriteria decision aid, EuropeanJournal of Operational Research 33 (1988) 54–64.