an observational and modeling study of the processes
TRANSCRIPT

HAL Id: hal-02092515https://hal.uca.fr/hal-02092515
Submitted on 12 Nov 2021
HAL is a multi-disciplinary open accessarchive for the deposit and dissemination of sci-entific research documents, whether they are pub-lished or not. The documents may come fromteaching and research institutions in France orabroad, or from public or private research centers.
L’archive ouverte pluridisciplinaire HAL, estdestinée au dépôt et à la diffusion de documentsscientifiques de niveau recherche, publiés ou non,émanant des établissements d’enseignement et derecherche français ou étrangers, des laboratoirespublics ou privés.
Distributed under a Creative Commons Attribution| 4.0 International License
An Observational and Modeling Study of the ProcessesLeading to Deep, Moist Convection in Complex TerrainTammy Weckwerth, Lindsay Bennett, L. Jay Miller, Joël van Baelen, Paolo Di
Girolamo, Alan Blyth, Tracy Hertneky
To cite this version:Tammy Weckwerth, Lindsay Bennett, L. Jay Miller, Joël van Baelen, Paolo Di Girolamo, et al.. AnObservational and Modeling Study of the Processes Leading to Deep, Moist Convection in ComplexTerrain. Monthly Weather Review, American Meteorological Society, 2014, 142 (8), pp.2687-2708.�10.1175/MWR-D-13-00216.1�. �hal-02092515�

An Observational and Modeling Study of the Processes Leading to Deep, MoistConvection in Complex Terrain
TAMMY M. WECKWERTH,* LINDSAY J. BENNETT,1 L. JAY MILLER,* JOEL VAN BAELEN,#
PAOLO DI GIROLAMO,@ ALAN M. BLYTH,1 AND TRACY J. HERTNEKY*
* Earth Observing Laboratory, National Center for Atmospheric Research,& Boulder, Colorado1National Centre for Atmospheric Science, School of Earth and Environment, University of Leeds,
Leeds, United Kingdom#Laboratoire de M�et�eorologie Physique, CNRS–Universit�e Blaise Pascal, Clermont-Ferrand, France
@ Scuola di Ingegneria, Universit�a degli Studi della Basilicata, Potenza, Italy
(Manuscript received 2 July 2013, in final form 18 March 2014)
ABSTRACT
A case study of orographic convection initiation (CI) that occurred along the eastern slopes of the Vosges
Mountains in France on 6 August 2007 during the Convective and Orographically-Induced Precipitation
Study (COPS) is presented. Global positioning system (GPS) receivers and two Doppler on Wheels (DOW)
mobile radars sampled the preconvective and storm environments and were respectively used to retrieve
three-dimensional tomographic water vapor and wind fields. These retrieved data were supplemented with
temperature, moisture, and winds from radiosondes from a site in the eastern Rhine Valley. High-resolution
numerical simulations with the Weather Research and Forecasting (WRF) Model were used to further in-
vestigate the physical processes leading to convective precipitation.
This unique, time-varying combination of derived water vapor and winds from observations illustrated an
increase in low-level moisture and convergence between upslope easterlies and downslope westerlies along
the eastern slope of the Vosges Mountains. Uplift associated with these shallow, colliding boundary layer
flows eventually led to the initiation of moist convection. WRF reproduced many features of the observed
complicated flow, such as cyclonic (anticyclonic) flow around the southern (northern) end of the Vosges
Mountains and the east-side convergent flow below the ridgeline. The WRF simulations also illustrated
spatial and temporal variability in buoyancy and the removal of the lids prior to convective development. The
timing and location of CI from the WRF simulations was surprisingly close to that observed.
1. Introduction
The Convective and Orographically-Induced Pre-
cipitation Study (COPS; Wulfmeyer et al. 2008, 2011)
was designed to improve the forecasting skill of con-
vective precipitation in complex terrain using observa-
tions andmodeling of its life cycle. COPSwas conducted
1 June–31 August 2007 with a variety of in situ and re-
mote sensing instruments to sample clear air and moist
convection. The region of southwestern Germany and
eastern France was chosen because of its severe thun-
derstorm activity and low quantitative precipitation
forecast (QPF) skill (Wulfmeyer et al. 2008). One of the
critical components to achieving improved QPF skill is
understanding the factors that influence the timing and
location of new, deep,moist convection. This convection
initiation (CI) problem is further complicated in regions
of complex terrain.
Proper identification of the location and timing of
CI and the associated precipitation is particularly im-
portant in mountainous regions where storms may
or may not lead to flooding, depending upon which
river catchments are affected (e.g., Rotach et al. 2009a,
b). Inaccuracies in quantitative forecasts of mountain
precipitation include the overestimation (underesti-
mation) of precipitation on the windward (leeward)
&The National Center for Atmospheric Research is sponsored
by the National Science Foundation.
Corresponding author address: Tammy M. Weckwerth, NCAR
EOL, P.O. Box 3000, Boulder, CO 80307-3000.
E-mail: [email protected]
AUGUST 2014 WECKWERTH ET AL . 2687
DOI: 10.1175/MWR-D-13-00216.1
� 2014 American Meteorological SocietyUnauthenticated | Downloaded 11/12/21 10:27 AM UTC

side of the mountains and the production of phase er-
rors in the diurnal cycle of precipitation. These phase
errors in numerical models often produce pre-
cipitation several hours too early (e.g., Chaboureau
et al. 2004).
Weckwerth et al. (2011) collected a climatology of CI
events over a 9-yr period within the COPS domain,
which included the Vosges Mountains, Rhine Valley,
Black Forest Mountains, and Swabian Mountains. The
latter mountains extend east of the inset shown in Fig. 1.
The climatology showed that storms preferentially
formed during the daytime along the mountain slopes
and Rhine Valley. A possible explanation for the CI
location and timing is that boundary layer convergence
zones often formed and forced new deep, moist con-
vection. In previous studies of nonsynoptically forced
regions, low-level convergence zones have been shown
to be preferred locations for convective development
(e.g., Byers and Braham 1949; Purdom andMarcus 1982;
Wilson and Schreiber 1986). These convergence zones
may go undetected by the operational radar network
due to substantial low-level blockage by trees and ter-
rain and by the operational surface stations due to their
wide spacing. Such low-level convergence, combined
FIG. 1. COPS terrain-contoured base map showing locations of the three WRF domains (map size is outer domain). Shown are two
black squares (with the innermost square also enlarged) that are the twoWRF inner domains, dual-Doppler region to be shown in Fig. 11
(white square), GPS receivers (black dots), and DOW radar locations (red dots) on 6 Aug 2007. Supersite R (Achern; light blue dot)
hosted the sounding system, wind profiler, and theBASILRaman lidar. Light blue star is observedCI location; pink star isWRF simulated
CI location.
2688 MONTHLY WEATHER REV IEW VOLUME 142
Unauthenticated | Downloaded 11/12/21 10:27 AM UTC

with enhanced valley soil moisture (e.g., Kalthoff et al.
2011), may explain the frequent CI events in the valley.
One such orographically induced convergence zone is
the focus of this study.
Several COPS days illustrating the importance of low-
level convergence in CI case studies have been examined
in detail. For example, mountainous terrain commonly
induces thermally driven circulations that lead to
upslope flows that may influence CI via mesoscale con-
vergence regions (e.g., Kottmeier et al. 2008). In a multi-
scale observational study of CI on 20 July 2007,
Corsmeier et al. (2011) found that new storms occurred
in advance of a gust front over the Black Forest. The
interaction of orographic flow within the valleys of the
Black Forest with the gust front, a mesoscale conver-
gence line, and a synoptic-scale cold front led to the
development of a squall line. Bennett et al. (2011) used
Doppler on Wheels (DOW) radar data and Weather
Research and Forecasting (WRF) Model simulations
and further illustrated the importance of orographically
induced convergence lines and gust fronts in the de-
velopment of moderate convection on 12 August 2007.
Hagen et al. (2011) compared and contrasted several
COPS days with convection on the Vosges Mountains to
days with convection in the lee of the mountains. They
found that when the Froude number was low and the
winds split around the Vosges Mountains, the thermally
driven convergence at the ridge initiated convection.
When the Froude number was high, the flow passed over
the mountains and through the gaps and converged with
the Rhine Valley flow to create optimal regions for CI in
the valley.While the occurrenceof low-level convergence
zones helps to determine the preferred region of CI, all
convergence boundaries do not cause CI.
Simulations of CI in the Black Forest Mountains il-
lustrated the importance of background winds. For ex-
ample, Hanley et al. (2011) found that strong westerlies
enhanced CI potential by forcing moist air from the
Rhine Valley up and over the Black Forest Mountain
peaks. In contrast, Kirshbaum (2011) showed that strong
background winds suppressed CI by weakening low-
level convergence caused by differential heating and
shortening the time that clouds could grow over their
low-level convergence zone. This is consistent with ob-
servational results of Wilson and Megenhardt (1997),
who showed that the correspondence between low-level
convergence zone motion and the steering flow (e.g., 2–
4 km above mean sea level or MSL; hereafter all heights
are MSL) is essential for CI.
Additional remaining unknowns are the timing and
exact location along the convergence zone where CI will
occur. Thermodynamic information is often helpful in-
formation to combine with the wind fields. Van Baelen
et al. (2011) used GPS data and tomographic retrievals,
along with polarimetric Doppler radar (POLDIRAD)
data on 15 July 2007, to show that enhanced water vapor
on the crest of the mountains aided in ridge-top con-
vection while increased water vapor, combined with
local convergence in the Rhine Valley, produced con-
vection over the plains. Similarly, Labbouz et al. (2013)
found that enhanced moisture and convergence occurred
prior to CI on 18 July 2007. They showed that small
variations in the terrain also influenced the preferred CI
locations. Behrendt et al. (2011) showed that storms
formed on 15 July 2007 when a large-scale convergence
zone was collocated with a thermally driven local con-
vergence zone, creating enhanced low-level moisture flux
convergence in the southern Black Forest and allowing
the capping lids to be penetrated.
The 6 August 2007 case study presented in this paper
evaluates the first-ever combination of high-resolution
dual-Doppler wind fields with small-scale moisture
fields, along with high-resolution WRF simulations, to
show the combination of low-level winds, moisture, and
buoyancy leading to CI. The radar radial velocity data
were combined to obtain 3D wind fields and the GPS
data were used to produce 3D moisture fields. This
unique combination of winds and moisture allowed for
the evaluation of moisture transport and accumulation
prior to the initiation of convection. The WRF model
was used in a nested high-resolution mode to simulate
this case study and address the complicated kinematics
and thermodynamics occurring on this day.
Section 2 will describe the COPS data and the relevant
analysis methods and WRF simulations. Section 3 will
present a synoptic and mesoscale overview of 6 August
2007 and provide WRF–observational comparisons.
Section 4 will present details of the processes leading to
CI. A summary and conclusions will be given in section 5.
2. Observational data and numerical simulations
a. Data and methods
This paper will focus on a subset of the extensive suite
of COPS instruments. Meteosat Second Generation
(MSG) 1-km visible satellite images were obtained ev-
ery 15min on 6 August 2007. The illustration of the
cloud field development is a critical component for
nowcasting CI (e.g., Wilson andMueller 1993; Kingsmill
1995; Hane et al. 1987; May 1999). Composite radar
displays were created every 10min using the low-level
scans from the German Weather Service (DWD) op-
erational C-band radars. These composites were useful
for illustrating the evolution of the storms once they
formed, but they did not detect clear-air boundaries or
early storms due to low-level radar blockage and elevated
AUGUST 2014 WECKWERTH ET AL . 2689
Unauthenticated | Downloaded 11/12/21 10:27 AM UTC

radar beams at large distances. One of the DWD radars,
Feldberg, observed the convection highlighted in this
case study and will be shown. CI here is defined as the
time precipitation formed and the radar echoes ex-
ceeded 30 dBZ.
The supersite at Achern on the eastern side of the
Rhine River valley (Fig. 1) was equipped with radio-
sonde launching capabilities, a wind profiler and the
University of Basilicata Raman lidar system (BASIL)
that provided continuous vertical profiles of water vapor
mixing ratio (DiGirolamo et al. 2009).Measurements of
the water vapor mixing ratio are based on the applica-
tion of the roto-vibrational Raman lidar technique in the
ultraviolet region. In addition to water vapor, BASIL
provides measurements of atmospheric temperature,
particle backscatter at 355, 532, and 1064 nm, particle
extinction at 355 and 532 nm, and particle depolarization
at 355 and 532 nm (DiGirolamo et al. 2012). The BASIL
water vapor profiles must be precalibrated with an in-
dependent measurement, such as soundings, GPS, or
microwave radiometer measurements. For the purpose
of this current study the precalibration was performed
prior to operations on 6 August based on an extensive
comparison of the water vapormixing ratio profiles from
BASIL with .100 simultaneous radiosonde profiles.
The radiosondes were a combination of Vaisala RS80
and RS92 radiosondes. The moisture dry bias correction
was applied to all RS80 radiosondes using the technique
of Wang et al. (2002). The lidar calibration constant was
determined by using BASIL and radiosonde profiles in
the altitude region between 1 and 2 km. The consider-
ation of more than 100 radiosonde profiles for the de-
termination of the calibration constant prevents the
dependence of a single lidar vertical profile upon the
simultaneous radiosonde profile. The BASIL data used
in this study were integrated over 15min and have
a vertical resolution of 150m, starting at 150m AGL.
Through the application of Poisson statistics, the daytime
water vapor precision (randomerror) was 5%at 2kmand
20% at 4km (Bhawar et al. 2011). The systematic error
affecting the BASIL measurements did not exceed 3%–
5%. The resulting water vapor profiles were useful for
comparison with the WRF simulations to aid in assessing
the representativeness of the simulations.
GPS receivers are used worldwide for autonomous,
all-weather, and continuous observations of integrated
precipitable water vapor (PWV) along the path from the
satellite to the ground-based receiver (e.g., Bevis et al.
1992, 1994; Businger et al. 1996). These quasi-vertical
columns of PWV can be retrieved with high accuracy
(e.g., Van Baelen et al. 2005; Wang et al. 2007). With
a dense network of GPS receivers, a tomographic re-
trieval can be performed to obtain the three-dimensional
moisture field (e.g., Van Baelen et al. 2011). The spacing
of the 54 receivers in the COPS domain varied between
10 and 40km (see Fig. 1 for station distribution), which is
near the limit for performing high-quality tomographic
retrievals. The tomographic retrievals provided a gridded
moisture field with horizontal resolution of 18.5 km in the
meridional direction and 15.9km in the zonal direction.
The vertical resolution was 500m up to 4 km, increasing
to 750m up to 7 km and further increasing to 1 km up to
10km. Processing to obtain PWV and 3D tomographic
moisture fields was performed as in Van Baelen et al.
(2011).
Two DOW mobile radars (Wurman et al. 1997) were
positioned with a north–south-oriented 30.6-km base-
line on 6 August to obtain high-resolution dual-Doppler
wind measurements within the Rhine Valley and along
the eastern and western slopes of the Vosges and Black
Forest Mountains, respectively. Both DOWs are X-band
(3 cm; ;9.4GHz) Doppler radars that are sensitive to
backscattering from insects, nearby clouds, and precipi-
tation particles. The DOWs have 0.938 half-power beam-
widths and were operated with 150-m range-gate spacing
during COPS.
Once the radars were positioned early in the morning
(with DOW3 to the north and DOW2 to the south) and
leveled, solar scans were taken for aligning the azimuth
angles with true north. The radars were operated with
0.58 azimuthal spacing in coordinated 3608 surveillancescanning mode at several low-elevation angles from
1013 to 2116 UTC [hereinafter all times are UTC;
UTC 5 central European summer time (CEST) 2 2 h].
These constant-elevation-angle scans typically consisted
of 10 angles (nominally 18, 1.58, 28, 2.58, 38, 48, 58, 6.58, 88,and 108) during synchronized ;2.5-min periods. Volu-
metric scanning sequences covered much of the south-
ern Rhine Valley as well as the eastern slopes of the
Vosges Mountains, whose ridgeline is oriented roughly
along a northeast–southwest direction and whose max-
imum heights are ;1.5 km.
Themobile radar data were corrected for any pointing
errors and carefully edited to remove noise, ground
clutter, and second-trip echoes using the National Cen-
ter for Atmospheric Research (NCAR) SOLO II soft-
ware package (Oye et al. 1995). Edited data at spherical
locations were mapped with the NCAR Reorder soft-
ware onto a regular Cartesian grid with 500-m horizontal
and 250-m vertical grid spacings. The lowest level of the
grid was 0.25 km (;50m above the floor of the Rhine
Valley) and the highest level was 5 km. Cressman (1959)
distance-weighted averages of all data points within
nearby 0.5-km radius regions surrounding each of the
output grid points were used. The 0.5-km radii were
increased to 0.7 km beyond a 35-km range to ensure that
2690 MONTHLY WEATHER REV IEW VOLUME 142
Unauthenticated | Downloaded 11/12/21 10:27 AM UTC
at least two and no more than three azimuths and two
elevation angles were used in the mapping process. This
approach ensured that each output grid point was well
bounded by azimuth and elevation beams, included about
seven range gates, and allowed the radial velocities to be
treated as scalars. The number of radar measurements
included for estimating output grid values varied from
;60 near the radars to ;30 at the farthest slant ranges.
The Custom Editing and Display of Reduced In-
formation in Cartesian space (CEDRIC; Mohr et al.
1986) software package was used to perform the dual-
Doppler wind synthesis (e.g., Miller et al. 1988, 1990).
An examination of successive volumetric scans revealed
that overall flow patterns changed only slowly and ex-
hibited little or no advection. Therefore no time ad-
justments were made during the wind synthesis, a
procedure first suggested by Gal-Chen (1982). Little or
no intrinsic fall speeds of the air motion tracers or ver-
tical air motions were likely to contaminate the radial
velocity measurements because of the low elevation
angles scanned by the radars. This dual-Doppler (or
two-equation) solution was deemed to adequately rep-
resent the horizontal wind field. Before the winds were
synthesized, each of the radial velocity datasets were
edited in CEDRIC to remove some obvious outliers and
to fill in some small holes using linear-least squares
methods. Once radial data were cleaned up and filled,
a two-dimensional Hanning filter was applied over 53 5
horizontal regions. Much of this more heavy-handed
decimation, filling, and filtering was required to reduce
some obvious measurement errors from;(0.8–1.0)m s21
to something nearer to ;(0.1–0.2)m s21. Before pre-
cipitation developed, relatively weak radar signal
strength caused these large measurement errors. With
maximum radial velocities of ;5m s21, this amounts to
a noise reduction from about 20% down to near 1%.
Vertical velocities were estimated from derived hori-
zontal wind convergence using the O’Brien (1970) var-
iational scheme applied to the anelastic mass continuity
equation with boundary conditions of w 5 0 both at the
ground and at the top of the grid. This is roughly
equivalent to allowing the lowest z-level convergence to
represent a layer average between that level and the
ground. During the pre-CI period near the top of the
grid, radar echoes were consistently capped at ;4 km,
indicating no echo or vertical motion above that level.
Further two-dimensional Hanning filtering over hori-
zontal 3 3 3 regions of convergence was used prior to
vertical integration to eliminate noise amplification at
twice the horizontal grid spacing that is inherent in
centered finite-differencing schemes. Estimated errors
in retrieved horizontal and vertical motions are no more
than 0.1–0.2m s21.
Surface station gridded analyses were derived using
a mesoscale data analysis and downscaling method,
named theViennaEnhancedResolutionAnalysis (VERA;
e.g., Steinacker et al. 2000, 2006;Gorgas et al. 2009). VERA
utilizes more than 12000 Global Telecommunication
System (GTS) and non-GTS surface station datasets to
provide an 8-km gridded field every hour. The VERA
technique calculates gridded fields of potential tempera-
ture, equivalent potential temperature, water vapor
mixing ratio, mean sea level pressure, horizontal winds,
and precipitation. These VERA fields will be used for
comparison with the tomography, DOW winds, and
WRF simulated fields, as well as a method for evaluating
the large-scale surface conditions.
b. WRF simulations
TheWRFModel version 3.1.1 (Skamarock et al. 2008)
was used with two-way nested domains of 6.3-, 2.1-, and
0.7-km grid spacing and 121 vertical levels. The inner
domain covered the Vosges Mountains, the Rhine Val-
ley, and the western part of the Black Forest Mountains
(Fig. 1). The simulation was initialized at 0000 by Global
Forecast System (GFS) 18 analyses, which also provided
the lateral boundary conditions updated every 6h. A
control simulation used the following subgrid parame-
terization schemes, described in Skamarock et al. (2008):
Thompson microphysics, Dudhia shortwave radiation
and Rapid Radiative Transfer Model (RRTM) longwave
radiation, Mellor–Yamada–Janjic (MYJ) turbulent ki-
netic energy (TKE), Monin–Obukhov surface layer
physics, and the Noah land surface model (LSM). The
Noah LSM carries soil moisture and temperature at four
levels. The Betts–Miller–Janjic cumulus parameteriza-
tion scheme was applied on the outer 6.3-km domain
only. A series of sensitivity studies were performed by
varying the input analyses fields and parameterization
schemes and showed that the simulation results were
robust, all producing similar wind, cloud, and rain fields.
3. Overview of 6 August 2007
In this section, the broader-scale context will be de-
scribed using weather maps, satellite imagery, and sur-
face observations. These observations will be compared
with the WRF outer domain simulations.
a. Synoptic discussion
At 1200 on 6August 2007 there was a weak 500-hPa low
pressure region over eastern Europe, an elongated ridge
stretching from northern Africa through France and
Germany to the Baltic Sea, and a deep trough extending
from Iceland south to Ireland (not shown). At the surface
a low pressure system was centered over northeast
AUGUST 2014 WECKWERTH ET AL . 2691
Unauthenticated | Downloaded 11/12/21 10:27 AM UTC

Scotland with a weak cold front extending south over the
North Sea, central France, and into northern Spain (Fig.
2). There was a narrow band of precipitation associated
with this front, but deeper convection developed ahead of
it during the morning, organizing into a north–south-ori-
ented line by 1200. The clouds and precipitation were
sandwiched between the cold front boundary and pre-
frontal trough of Fig. 2. The convection formed within an
850-mb (1mb 5 1hPa) plume of high-ue air with its
western boundary marked by the cold front. A prefrontal
trough and convergence zone formed within this plume,
perhaps in response to a 500-mb vorticity maximum mov-
ing northeastward over France. This slow-moving front and
its associated precipitation remained west of the Vosges
Mountains throughout the case study presented herein.
b. Satellite and surface observations
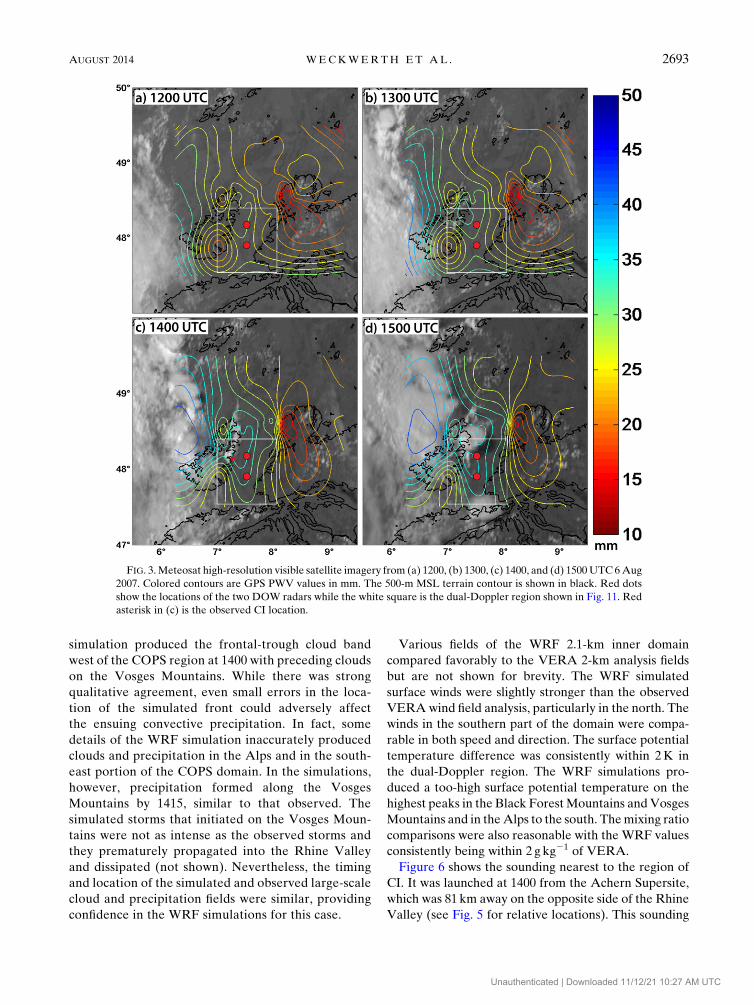
Hourly MSG visible satellite imagery showed a wide
band of clouds and precipitation approaching the
COPS region. The cloudiness in advance of the frontal-
trough region was apparent along the western edge of
the 1200 image (Fig. 3a). The GPS PWV overlaid on the
visible satellite image showed a large-scale moisture
gradient with moist air occurring east of the cloud field
but west of the Vosges Mountains. As the synoptic-scale
system slowly approached the COPS domain, there were
some scattered shallow cumulus clouds along the eastern
slopes of the Vosges Mountains at 1300 (Fig. 3b). These
early clouds were in the region where the largest
convective storms eventually developed. It is possible
that these small convective clouds may have been in-
strumental in vertical mixing and moistening of the re-
gion prior to the formation of deeper convection. The
PWV field suggested that the enhanced moisture ahead
of the front also advected into the COPS domain, ap-
parent by the higher PWV values in the Vosges Moun-
tains and the western Rhine Valley. At 1400 a thin line
of small cumulus formed along the Vosges Mountains
within higher PWV air that had further advected from the
west (Fig. 3c). The storms growing on the Vosges Moun-
tains continued to develop by 1500 as the frontal-trough
system continued its slow approach from the west (Fig.
3d). By 1600 theVosgesMountains convectionwas among
the strongest precipitation in the region as it formed an
anvil andmergedwith the precipitation associatedwith the
prefrontal trough (see Fig. 7d).
The VERA 8-km surface analyses showed cool (darker
blues in Fig. 4, left panels), relatively dry air associated
with the advancing frontal-trough system to thewest of the
COPS dual-Doppler box. The 1000 potential tempera-
ture field (Fig. 4a) also illustrated a broad warm region
within and surrounding the dual-Doppler box with sev-
eral hotter pockets along the peaks of the Black Forest
Mountains and the Alps. These warm regions at higher
elevations would be expected in a statically stable en-
vironment. In advance of the cold, dry front, a plume of
moisture extended north-northeastward from the
northwestern Mediterranean Sea through France west
of the Vosges Mountains and northward to the Neth-
erlands (Fig. 4b). This moisture east of the frontal-
trough region was also observed in the PWV fields (Fig.
3). By 1200 the cool, moist prefrontal air advected
eastward to just west of the Vosges Mountains, while
the COPS region had warmed and moistened. Note
that the area within the dual-Doppler box became
warmer (more yellow; Fig. 4c) and moister (more blue;
Fig. 4d) at 1200. At 1400 the cool air associated with the
front and trough was pushed up against the western
slope of the VosgesMountains (Fig. 4e). The prefrontal
moisture was distributed throughout the dual-Doppler
box as the region continued to becomemoister (Fig. 4f)
by the time of CI, which occurred at 1400.
c. WRF–observation comparisons
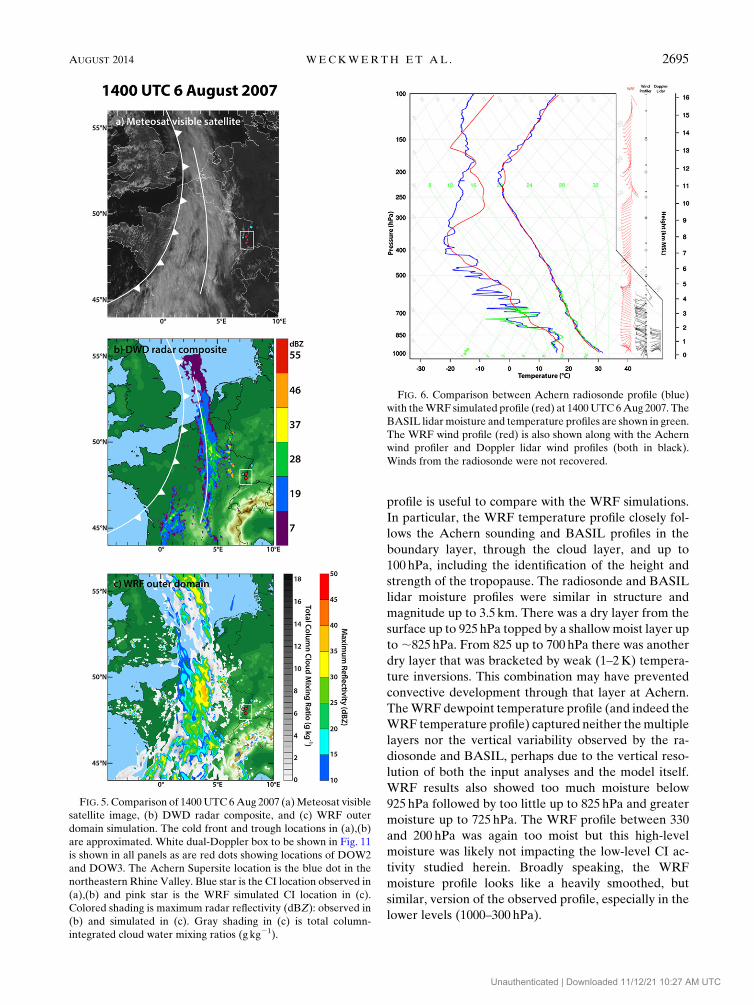
The 1400 visible satellite image (Fig. 5a) and the 1400
European composite radar image (Fig. 5b) respectively
illustrate the cloud and moderate precipitation bands
associated with the frontal-trough system. The location,
extent, and timing of the front and associated clouds and
rainfall were well represented within the WRF 6.3-km
outer domain (Fig. 5c). As in the observations, the
FIG. 2. Synoptic surface map at 1200 UTC 6 Aug 2007. Black
square (just south of 508N and west of 108E) indicates the dual-
Doppler radar domain to be shown in Fig. 11. The cold front ap-
proaching from the west is preceded by a trough line (black line).
The3s mark the low or high pressure locations with the L or H and
associated number designating the pressure values in hPa. Chart
courtesy of the Met Office.
2692 MONTHLY WEATHER REV IEW VOLUME 142
Unauthenticated | Downloaded 11/12/21 10:27 AM UTC
simulation produced the frontal-trough cloud band
west of the COPS region at 1400 with preceding clouds
on the Vosges Mountains. While there was strong
qualitative agreement, even small errors in the loca-
tion of the simulated front could adversely affect
the ensuing convective precipitation. In fact, some
details of the WRF simulation inaccurately produced
clouds and precipitation in the Alps and in the south-
east portion of the COPS domain. In the simulations,
however, precipitation formed along the Vosges
Mountains by 1415, similar to that observed. The
simulated storms that initiated on the Vosges Moun-
tains were not as intense as the observed storms and
they prematurely propagated into the Rhine Valley
and dissipated (not shown). Nevertheless, the timing
and location of the simulated and observed large-scale
cloud and precipitation fields were similar, providing
confidence in the WRF simulations for this case.
Various fields of the WRF 2.1-km inner domain
compared favorably to the VERA 2-km analysis fields
but are not shown for brevity. The WRF simulated
surface winds were slightly stronger than the observed
VERAwind field analysis, particularly in the north. The
winds in the southern part of the domain were compa-
rable in both speed and direction. The surface potential
temperature difference was consistently within 2K in
the dual-Doppler region. The WRF simulations pro-
duced a too-high surface potential temperature on the
highest peaks in the Black ForestMountains andVosges
Mountains and in theAlps to the south. Themixing ratio
comparisons were also reasonable with the WRF values
consistently being within 2 g kg21 of VERA.
Figure 6 shows the sounding nearest to the region of
CI. It was launched at 1400 from the Achern Supersite,
which was 81 km away on the opposite side of the Rhine
Valley (see Fig. 5 for relative locations). This sounding
FIG. 3.Meteosat high-resolution visible satellite imagery from (a) 1200, (b) 1300, (c) 1400, and (d) 1500UTC 6Aug
2007. Colored contours are GPS PWV values in mm. The 500-m MSL terrain contour is shown in black. Red dots
show the locations of the two DOW radars while the white square is the dual-Doppler region shown in Fig. 11. Red
asterisk in (c) is the observed CI location.
AUGUST 2014 WECKWERTH ET AL . 2693
Unauthenticated | Downloaded 11/12/21 10:27 AM UTC

FIG. 4. VERA surface analyses of (left) potential temperature (K) and (right) mixing ratio (g kg21) with wind
vectors (m s21) overlaid. Times shown are (top) 1000, (middle) 1200, and (bottom) 1400 UTC. Black square near
center is dual-Doppler region to be shown in Fig. 11.
2694 MONTHLY WEATHER REV IEW VOLUME 142
Unauthenticated | Downloaded 11/12/21 10:27 AM UTC
profile is useful to compare with the WRF simulations.
In particular, the WRF temperature profile closely fol-
lows the Achern sounding and BASIL profiles in the
boundary layer, through the cloud layer, and up to
100 hPa, including the identification of the height and
strength of the tropopause. The radiosonde and BASIL
lidar moisture profiles were similar in structure and
magnitude up to 3.5 km. There was a dry layer from the
surface up to 925 hPa topped by a shallowmoist layer up
to ;825 hPa. From 825 up to 700 hPa there was another
dry layer that was bracketed by weak (1–2K) tempera-
ture inversions. This combination may have prevented
convective development through that layer at Achern.
TheWRF dewpoint temperature profile (and indeed the
WRF temperature profile) captured neither themultiple
layers nor the vertical variability observed by the ra-
diosonde and BASIL, perhaps due to the vertical reso-
lution of both the input analyses and the model itself.
WRF results also showed too much moisture below
925 hPa followed by too little up to 825 hPa and greater
moisture up to 725 hPa. The WRF profile between 330
and 200 hPa was again too moist but this high-level
moisture was likely not impacting the low-level CI ac-
tivity studied herein. Broadly speaking, the WRF
moisture profile looks like a heavily smoothed, but
similar, version of the observed profile, especially in the
lower levels (1000–300 hPa).
FIG. 5. Comparison of 1400UTC 6Aug 2007 (a)Meteosat visible
satellite image, (b) DWD radar composite, and (c) WRF outer
domain simulation. The cold front and trough locations in (a),(b)
are approximated. White dual-Doppler box to be shown in Fig. 11
is shown in all panels as are red dots showing locations of DOW2
and DOW3. The Achern Supersite location is the blue dot in the
northeastern Rhine Valley. Blue star is the CI location observed in
(a),(b) and pink star is the WRF simulated CI location in (c).
Colored shading is maximum radar reflectivity (dBZ): observed in
(b) and simulated in (c). Gray shading in (c) is total column-
integrated cloud water mixing ratios (g kg21).
FIG. 6. Comparison between Achern radiosonde profile (blue)
with theWRF simulated profile (red) at 1400UTC 6Aug 2007. The
BASIL lidar moisture and temperature profiles are shown in green.
The WRF wind profile (red) is also shown along with the Achern
wind profiler and Doppler lidar wind profiles (both in black).
Winds from the radiosonde were not recovered.
AUGUST 2014 WECKWERTH ET AL . 2695
Unauthenticated | Downloaded 11/12/21 10:27 AM UTC

The Achern sounding showed minimal convective
available potential energy (CAPE) of 5Jkg21 and a sub-
stantial amount of convective inhibition (CIN;2180Jkg21)
with a level of free convection (LFC) of 4.8km. These sta-
bility parameters were calculated assuming parcel ascent
from the lowest 50-mb-averaged temperature andmoisture
values. Primarily owing to the WRF simulation’s over-
prediction of low-level moisture at Achern at 1400, the
WRF stability parameters were different than the obser-
vations (i.e., CAPE of 377Jkg21, CIN of 294Jkg21, and
LFC of 3.0km) but both the observations and simulations
suggested limited CI potential at Achern. Indeed, convec-
tion was not initiated at the Achern site.
Winds were not retrieved by this sounding, so the
wind profilers from two Achern instruments are shown:
the U.K. National Centre for Atmospheric Science
(NCAS) wind profiler and the University of Salford
Doppler lidar. The WRF wind profile was consistent
with the observed wind profiles up to 4 km.
There were some detailed and minor differences be-
tween the WRF and observed soundings. However, the
fact that the main features of the 1400 Achern temper-
ature, moisture, and wind profiles were all generally well
reproduced in the WRF simulation justifies the use of
WRF to extend the observational capabilities of this
6 August 2007 CI case study.
4. Convection initiation
A combination of radar, GPS tomography, and WRF
0.7-km inner domain simulation results will be used to
evaluate the precursors to CI. A detailed model repro-
duction of the CI event will be presented in section 4b(2).
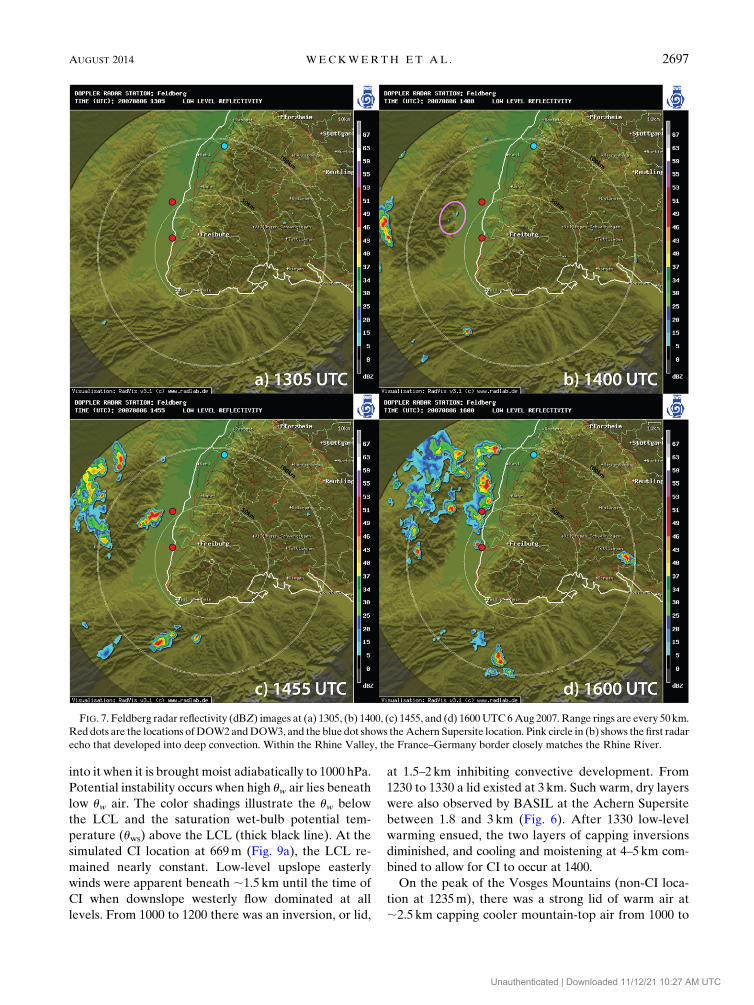
The Feldberg radar reflectivity field showed no echoes at
1305 (Fig. 7a). Precipitation with radar reflectivities of
50dBZ associated with the frontal-trough system was
observed in northern France by 1400 (Fig. 7b). In advance
of the front, two small, weak radar echoes formed on the
eastern Vosges Mountains in the same region as the
Meteosat clouds that were initially observed 1h earlier
(Fig. 3b). These represent the first radar echoes for the CI
studied herein. By 1455 the echoes in this region merged
into a small convective system that produced strong
precipitation with reflectivities.50dBZ along the slopes
of the Vosges Mountains (Fig. 7c). An inspection of the
more frequent Feldberg radar scans (not shown) showed
that the synoptic-scale band of frontal-trough pre-
cipitation merged with the Vosges Mountains pre-
cipitation by 1600 as the entire system advected into the
Rhine Valley (Fig. 7d).
a. Static stability and buoyancy
Figure 8 presents a skewT–logp time series of theWRF
soundings taken at the location of the first WRF
precipitation echo (at the pink star in Figs. 1 and 5c). At
0800 there was substantial CIN (2320 Jkg21) and mini-
malCAPE (26 Jkg21) with anLFCat;5.3km. Thewinds
were southwesterly below 2km veering to westerly up to
4.5km and then backing to southwesterly up to ;7km.
The convective boundary layer (CBL) formed by 1000,
apparent by nearly constant potential temperature and
mixing ratio profiles up to;1km. The LFC descended to
;2.9km, theCINdecreased to278 Jkg21, and theCAPE
increased to 748 Jkg21. There was a suggestion of low-
level easterly flow as the differential heating allowed for
upslope (anabatic) flow into the Vosges Mountains. Such
mountain-valley anabatic flows are common (e.g., Banta
1984; Neiman et al. 2002; Geerts et al. 2008).
At 1200 the CBL was well mixed up to ;1.8 km,
topped by a slight capping inversion creating a small
amount of CIN of 217 J kg21. The LFC was 813 hPa
(1.8 km) with a CAPE of 1228 J kg21. Easterly winds
were clearly evident below ;1 km with westerly winds
above. A continuing increase in midlevel moisture (800–
500 hPa) may be attributed to large-scale ascent and/or
moisture advection associated with the approaching
front/trough system.
The sounding at 1400 showed a well-mixed ;1.8-km-
deep CBL topped by a weak capping inversion and in-
crease in CBL moisture. There was very little CIN
(22Jkg21), anLFCat;1.5km, andCAPEof 1800 Jkg21.
Although low-level winds were northeasterly, there re-
mained a sufficient upslope component to collide with
the westerly flow over the ridge top and maintain con-
vergence along the slopes. This upslope–downslope flow
continued to maintain a region conducive to convective
development.
Overall, the simulated profiles at the CI location
trended toward a more unstable environment charac-
terized by an increase in boundary layer moisture and
temperature, along with an increase in midlevel (800–
500 hPa) moisture and a corresponding decrease in the
midlevel temperature.
The WRF simulations were extended further to
compare buoyancy and lids between the CI location and
a non-CI grid point 6.4 km to the west along the ridge-
line. The ridge top was chosen for the non-CI location
because the Froude number calculated from the up-
stream operational sounding at Nancy, France, was 0.5
and presumably should have led to ridge-top CI (Hagen
et al. 2011). Following the analyses performed with ob-
servational soundings by Morcrette et al. (2007), time–
height plots of simulatedwet-bulb potential temperatures
(uw) were used to assess temporal and spatial bulk
buoyancy potential and lid variations (Fig. 9). The
quantity uw is the temperature to which a parcel of air at
constant pressure cools through evaporation of water
2696 MONTHLY WEATHER REV IEW VOLUME 142
Unauthenticated | Downloaded 11/12/21 10:27 AM UTC
into it when it is brought moist adiabatically to 1000 hPa.
Potential instability occurs when high uw air lies beneath
low uw air. The color shadings illustrate the uw below
the LCL and the saturation wet-bulb potential tem-
perature (uws) above the LCL (thick black line). At the
simulated CI location at 669m (Fig. 9a), the LCL re-
mained nearly constant. Low-level upslope easterly
winds were apparent beneath ;1.5 km until the time of
CI when downslope westerly flow dominated at all
levels. From 1000 to 1200 there was an inversion, or lid,
at 1.5–2 km inhibiting convective development. From
1230 to 1330 a lid existed at 3 km. Such warm, dry layers
were also observed by BASIL at the Achern Supersite
between 1.8 and 3 km (Fig. 6). After 1330 low-level
warming ensued, the two layers of capping inversions
diminished, and cooling and moistening at 4–5km com-
bined to allow for CI to occur at 1400.
On the peak of the Vosges Mountains (non-CI loca-
tion at 1235m), there was a strong lid of warm air at
;2.5 km capping cooler mountain-top air from 1000 to
FIG. 7. Feldberg radar reflectivity (dBZ) images at (a) 1305, (b) 1400, (c) 1455, and (d) 1600UTC6Aug 2007. Range rings are every 50km.
Red dots are the locations ofDOW2andDOW3, and the blue dot shows theAchern Supersite location. Pink circle in (b) shows the first radar
echo that developed into deep convection. Within the Rhine Valley, the France–Germany border closely matches the Rhine River.
AUGUST 2014 WECKWERTH ET AL . 2697
Unauthenticated | Downloaded 11/12/21 10:27 AM UTC

1200 (Fig. 9b). The surface air started to warm at 1200
and the intensity of the 2.5-km lid slightly decreased
until 1300 when a new lid at 2 km formed. There were
consistently moderate winds (5–7m s21) at 3 km and
enhanced speed shear beneath 3 km that may have
combined with the lids to inhibit the formation of deep
convection. Also note that there were no easterly
boundary layer winds at the peak so no low-level con-
vergence was established. Thus the small showers that
did form were quickly forced off the peak. This is con-
sistent with findings by Kirshbaum (2011).
Figures 9c and 9d show the same data but plotted as
difference fields to more clearly illustrate variations in
buoyancy of a parcel lifted from the surface. The dif-
ference fields depict the surface value of uwminus either
the uw or uws at each height aloft. The negative values
contribute to CIN and the positive values contribute to
CAPE. At the CI location, negative buoyancy domi-
nated up to 2.5 km through 1100 (Fig. 9c). Slight positive
buoyancy ensued until 1330 when positive buoyancy
clearly increased. This increase in positive buoyancy
allowed for CI in the simulations. At the ridgeline there
was a time period of positive buoyancy (1215–1400)
throughout the depth of the simulation due to the high
ridge-top surface temperatures. It is believed that the
vertical wind shear, moderate midlevel winds, and lack
of low-level convergence combined to inhibit ridge-top
CI during that time period.
b. Low-level winds and moisture
1) OBSERVATIONS
The DOW3 2.98 elevation angle scans roughly paral-
leled the upward sloping Vosges Mountains and covered
a depth of 250–500m.These terrain-parallel slabs (Fig. 10)
illustrate the evolution of the reflectivity and upslope/
downslope flow evident in the Doppler radial velocity
fields in the 1202–1401 period that led to the storm cell
shown at 1501 (Figs. 10g,h).
At 1202 the reflectivity field (Fig. 10a) was mostly
uniform exhibiting only clear-air return and no apparent
organized convective structures. The somewhat stronger
radar return over the Vosges Mountains (25 to 0 dBZ)
was presumably due to an increasing concentration of
insects caused by the broad low-level convergence and
preference of insects not to be lofted upward (Wilson
et al. 1994). This interpretation, rather than ground
clutter causing the enhanced echo, is supported by a
change in the location and intensity of the mountain-top
return from 1202 to 1401.
The radial velocity field showed light (;2.5m s21)
low-level southerly flow in the Rhine Valley (Fig. 10b)
increasing to 5m s21 southerly flow by 1501 (Fig. 10h).
Upslope flow was apparent at 1202 (Fig. 10b) extending
slightly west of the 500-m contour line. Note the complex
intertwining of upslope and downslope flows (positive and
negative radial velocities) within the northeast–southwest
band of terrain heights to either side of the 500-m contour
(Figs. 10b,d). Stronger westerly winds flowing over the
Vosges Mountains (;5ms21) clearly dominated this
band by 1401 (Fig. 10f). Thus there was convergence (as
seen in radial gradients of the radial velocities) along the
eastern slope prior to cloud formation at 1300 (Figs. 3b
and 10d) and it persisted as more convective cells and
eventually precipitation formed at 1401 (Figs. 3c and
10e). Convection that initiated above the convergence
region along the slopes grew to 55dBZ and was 13 km
deep by 1501. The storm produced a gust front and they
both moved eastward into the Rhine Valley (Figs. 10g,h).
Derived dual-Doppler wind and GPS moisture fields
were combined in Figs. 11 and 12. The 500-m retrieved
winds and surface stations winds are respectively added
in blue and red to complement the 1-kmwinds. Thewind
fields illustrate the predominant south-southwesterly
flow throughout most of the southern Rhine Valley at
1030 and 1100 (Figs. 11a,b). There was weak south-
southeasterly flow at 500m toward and up the slopes of
the Vosges Mountains in the region where the deep
convection eventually developed. Similarly there was
a slight westerly upslope flow into the Black Forest
Mountains on the eastern edge of the dual-Doppler box.
The vertical velocity field was somewhat noisy but
FIG. 8. Simulated sounding time series of dewpoint temperature
(left lines), temperature (right lines), andwind profiles from theWRF
CI location at 0800 (dark blue), 1000 (green), 1200 (red), and 1400
UTC (light blue) 6Aug 2007.WRFCI location is shown in Figs. 1, 6c,
and 13.
2698 MONTHLY WEATHER REV IEW VOLUME 142
Unauthenticated | Downloaded 11/12/21 10:27 AM UTC

showed small, weak updrafts that remained over time
within the northernVosgesMountains due to convergence
between the northerly winds in that region and the south-
erly valley and easterly upslope flows. The GPS tomogra-
phy results at 1km illustrated relatively dry air throughout
the Rhine Valley until 1300 but with enhanced moisture in
the northern Vosges Mountains. The observations from
1030 through 1400 (Figs. 11a–e) showed a clear progression
of intermittent, small updrafts and likely small clouds (also
seen in Fig. 3b), perhaps allowing for the enhancement of
moisture through vertical mixing by the continual forma-
tion and dissipation of small cells in the region. Eventually,
this ever-larger area of updraft and increasing moisture
encompassed the observedCI (blue star) shortly after 1400.
The easterly upslope flow persisted at 1200 (Fig. 11c).
A weak cyclonic turning of the winds, particularly obvi-
ous in the blue vectors at 500m, was apparent in the
southern Rhine Valley and extended from 250m through
1km. Additionally there was anticyclonic turning of the
westerly winds along the northern edge of the Vosges
Mountains to create northwesterly flow. This flow
structure around the ends of the mountain barrier was
expected from the low Froude number (0.5), indicating
that the low-level southwesterly flow should split
FIG. 9. (a),(b) Time–height plots of simulated wet-bulb potential temperature beneath the LCL (black line) and saturation wet-bulb
potential temperature above the LCL. Black contours are u-wind speeds. Gray contours are cloud water mixing ratio values, starting at
0.05 gm23 in increments of 0.5 gm23. (c),(d) Difference fields of surface wet-bulb potential temperatures minus wet-bulb (or saturated
wet-bulb) potential temperatures at the different heights. Profiles are shown at (left) the simulated CI location and (right) a non-CI
location at the ridge top of the Vosges Mountains 6.4 km to the west of the CI location.
AUGUST 2014 WECKWERTH ET AL . 2699
Unauthenticated | Downloaded 11/12/21 10:27 AM UTC

around the mountains and is consistent with simula-
tions by Smolarkiewicz and Rotunno (1989).
The east–west vertical cross sections along the latitude
of the observed CI show zonal winds and vertical mo-
tions in the plane of the figure (Fig. 12). They illustrate
weak upslope flow leading to low-level convergence and
a broad updraft from x 5 240 to 220 km between 1100
and 1200. This region also exhibited maximum low-level
moisture content (Figs. 12a,b). In addition to the mois-
ture advection over the mountains, there was a daytime
upward mixing of the surface moisture shown by the
increasing moisture depth throughout the period.
The trend in the moisture distribution continued with
persistent dry air throughout the Rhine Valley and
a further moisture increase in the northern and central
Vosges Mountains, spilling into the northwestern Rhine
Valley by 1300 (Fig. 11d). Thus in addition to surface
evaporation and vertical mixing apparent from the in-
creased moisture depth in Fig. 12c, this moisture in-
crease appears to be due to advection from the west in
advance of the trough. This is consistent with the 8-km
VERA moisture fields that showed an enhancement of
surface moisture in the Vosges Mountains by 1200 (Fig.
4d) and with the GPS PWV increase along the eastern
Vosges between 1200 and 1400 (Figs. 3a–c). The easterly
flow further increased into the CI region due to a com-
bination of anabatic winds and the intensification and
expansion of the cyclonic circulation in the southern
Rhine Valley. The northwesterly flow along the northern
VosgesMountains intensified contributing to a persistent
updraft in that region. Figure 12c illustrates enhanced
low-level easterlies from x 5 225 to 5. The bulge in the
depth of low-level moisture was coincident with the gen-
eral region of upward motion along the slopes of the
Vosges Mountains (Figs. 12a–c).
The cyclonic circulation in the southern Rhine Valley
increased in horizontal extent and magnitude and the
northwesterly flow north of the Vosges continued
through 1400 when CI occurred. The corresponding
low-level convergence and upward vertical velocity
expanded and strengthened as the low-level moisture
increased by 1400, thereby contributing to CI (Fig. 11e).
The vertical cross section (Fig. 12d) shows the enhanced
low-level moisture and the updrafts continuing into
the core of the new echo. Close examination of the
streamlines within numerous vertical cross sections nor-
mal to the Vosges Mountains showed the progression of
low-level convergence eastward down the slopes through
this time period (not shown). The westerly winds in the
steering level likely caused the cells to move eastward off
the mountains.
By 1500 the storm produced an outflow boundary as
shown by the radially outward-directed winds emanating
from the radar echo. That gust front exhibited a broad
band of updrafts along its leading edge. Both the gust
front and the convection had already begun to propagate
into the Rhine Valley (Fig. 11f). The associated moisture
increased substantially in the Rhine Valley.
The cells intensified as they entered the Rhine Valley
and they developed into a north–south-oriented line
FIG. 10. The 6 Aug 2007 DOW3 radar observations at 2.98 ele-vation angle: (left) reflectivity (dBZ, scale runs from 210 to 140)
and (right) Doppler velocity (m s21, scale runs from210 to110) at
(a),(b) 1202, (c),(d) 1301, (e),(f) 1401, and (g),(h) 1501UTC.Range
rings are every 10 km. The 500-mMSL contour is overlaid in black.
2700 MONTHLY WEATHER REV IEW VOLUME 142
Unauthenticated | Downloaded 11/12/21 10:27 AM UTC

FIG. 11. Dual-Doppler wind vectors andGPS tomography color contours–shading at 1 kmMSL from (a)
1030, (b) 1100, (c) 1200, (d) 1300, (e) 1400, and (f) 1500 UTC 6 Aug 2007. Blue vectors are winds at 500m
MSL. The black line is the 500-m MSL terrain contour and black shaded region depicts terrain . 1 km
MSL. White contours are updrafts. 0.3m s21. Red dots show the locations of the two DOW radars. Red
arrows are corresponding surface station wind observations. Blue star shows the observed CI location.
Gray contours at 1500 UTC show DOW3 reflectivity every 10 dBZ starting at 10 dBZ. Line A–B indicates
the cross-sectional location to be shown in Fig. 12.
AUGUST 2014 WECKWERTH ET AL . 2701
Unauthenticated | Downloaded 11/12/21 10:27 AM UTC
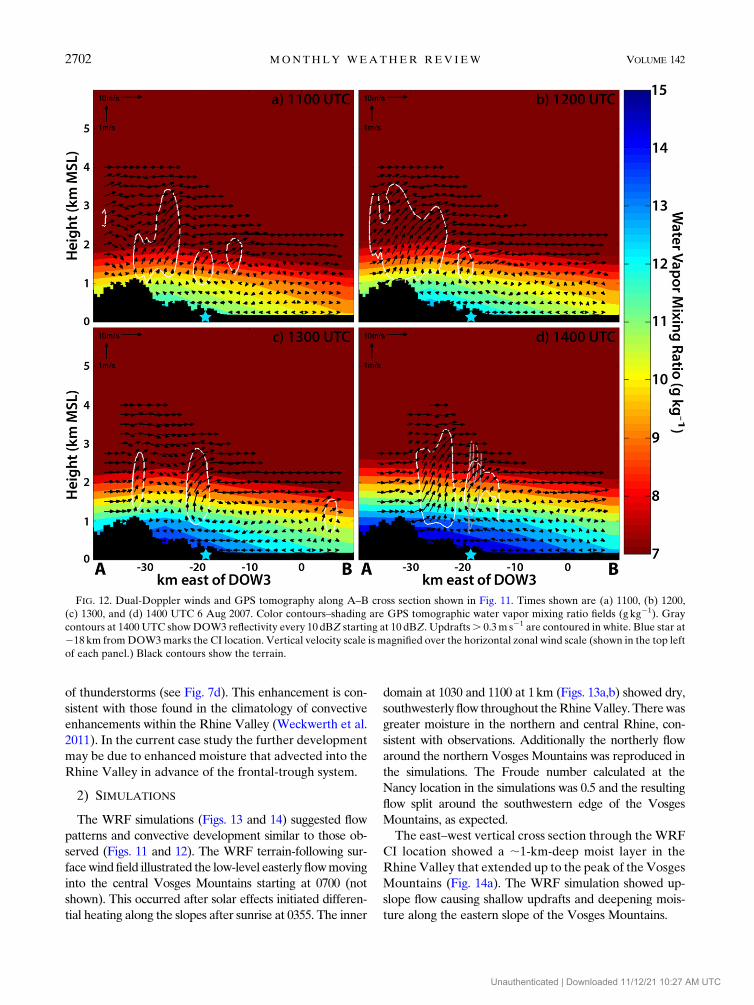
of thunderstorms (see Fig. 7d). This enhancement is con-
sistent with those found in the climatology of convective
enhancements within the Rhine Valley (Weckwerth et al.
2011). In the current case study the further development
may be due to enhanced moisture that advected into the
Rhine Valley in advance of the frontal-trough system.
2) SIMULATIONS
The WRF simulations (Figs. 13 and 14) suggested flow
patterns and convective development similar to those ob-
served (Figs. 11 and 12). The WRF terrain-following sur-
facewindfield illustrated the low-level easterly flowmoving
into the central Vosges Mountains starting at 0700 (not
shown). This occurred after solar effects initiated differen-
tial heating along the slopes after sunrise at 0355. The inner
domain at 1030 and 1100 at 1km (Figs. 13a,b) showed dry,
southwesterly flow throughout theRhineValley. Therewas
greater moisture in the northern and central Rhine, con-
sistent with observations. Additionally the northerly flow
around the northern Vosges Mountains was reproduced in
the simulations. The Froude number calculated at the
Nancy location in the simulations was 0.5 and the resulting
flow split around the southwestern edge of the Vosges
Mountains, as expected.
The east–west vertical cross section through theWRF
CI location showed a ;1-km-deep moist layer in the
RhineValley that extended up to the peak of the Vosges
Mountains (Fig. 14a). The WRF simulation showed up-
slope flow causing shallow updrafts and deepening mois-
ture along the eastern slope of the Vosges Mountains.
FIG. 12. Dual-Doppler winds and GPS tomography along A–B cross section shown in Fig. 11. Times shown are (a) 1100, (b) 1200,
(c) 1300, and (d) 1400 UTC 6 Aug 2007. Color contours–shading are GPS tomographic water vapor mixing ratio fields (g kg21). Gray
contours at 1400 UTC showDOW3 reflectivity every 10 dBZ starting at 10 dBZ. Updrafts. 0.3m s21 are contoured in white. Blue star at
218 km fromDOW3marks the CI location. Vertical velocity scale is magnified over the horizontal zonal wind scale (shown in the top left
of each panel.) Black contours show the terrain.
2702 MONTHLY WEATHER REV IEW VOLUME 142
Unauthenticated | Downloaded 11/12/21 10:27 AM UTC
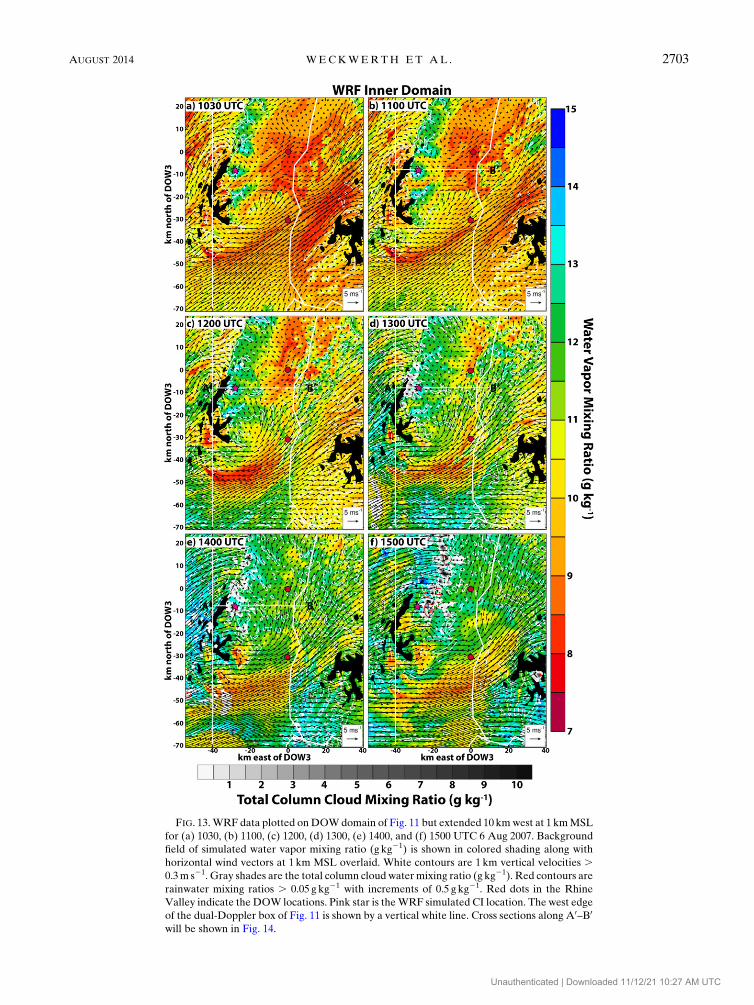
FIG. 13.WRF data plotted onDOWdomain of Fig. 11 but extended 10 kmwest at 1 kmMSL
for (a) 1030, (b) 1100, (c) 1200, (d) 1300, (e) 1400, and (f) 1500 UTC 6 Aug 2007. Background
field of simulated water vapor mixing ratio (g kg21) is shown in colored shading along with
horizontal wind vectors at 1 km MSL overlaid. White contours are 1 km vertical velocities .0.3m s21. Gray shades are the total column cloud watermixing ratio (g kg21). Red contours are
rainwater mixing ratios . 0.05 g kg21 with increments of 0.5 g kg21. Red dots in the Rhine
Valley indicate the DOW locations. Pink star is theWRF simulated CI location. The west edge
of the dual-Doppler box of Fig. 11 is shown by a vertical white line. Cross sections along A0–B0
will be shown in Fig. 14.
AUGUST 2014 WECKWERTH ET AL . 2703
Unauthenticated | Downloaded 11/12/21 10:27 AM UTC
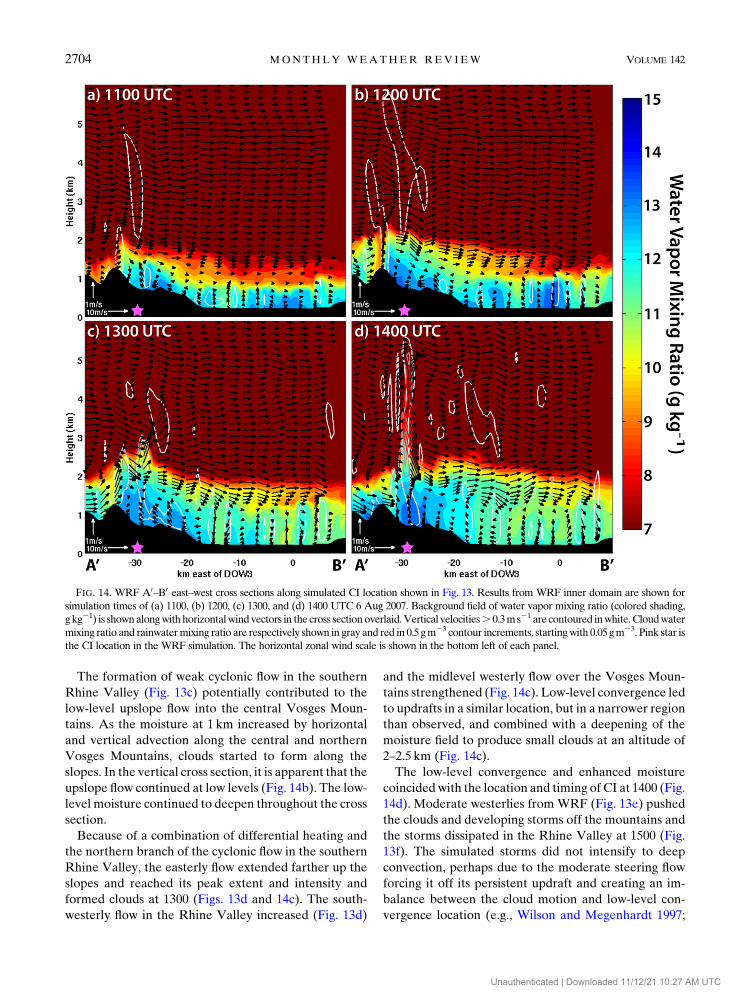
The formation of weak cyclonic flow in the southern
Rhine Valley (Fig. 13c) potentially contributed to the
low-level upslope flow into the central Vosges Moun-
tains. As the moisture at 1 km increased by horizontal
and vertical advection along the central and northern
Vosges Mountains, clouds started to form along the
slopes. In the vertical cross section, it is apparent that the
upslope flow continued at low levels (Fig. 14b). The low-
level moisture continued to deepen throughout the cross
section.
Because of a combination of differential heating and
the northern branch of the cyclonic flow in the southern
Rhine Valley, the easterly flow extended farther up the
slopes and reached its peak extent and intensity and
formed clouds at 1300 (Figs. 13d and 14c). The south-
westerly flow in the Rhine Valley increased (Fig. 13d)
and the midlevel westerly flow over the Vosges Moun-
tains strengthened (Fig. 14c). Low-level convergence led
to updrafts in a similar location, but in a narrower region
than observed, and combined with a deepening of the
moisture field to produce small clouds at an altitude of
2–2.5 km (Fig. 14c).
The low-level convergence and enhanced moisture
coincidedwith the location and timing of CI at 1400 (Fig.
14d). Moderate westerlies from WRF (Fig. 13e) pushed
the clouds and developing storms off the mountains and
the storms dissipated in the Rhine Valley at 1500 (Fig.
13f). The simulated storms did not intensify to deep
convection, perhaps due to the moderate steering flow
forcing it off its persistent updraft and creating an im-
balance between the cloud motion and low-level con-
vergence location (e.g., Wilson and Megenhardt 1997;
FIG. 14. WRF A0–B0 east–west cross sections along simulated CI location shown in Fig. 13. Results from WRF inner domain are shown for
simulation times of (a) 1100, (b) 1200, (c) 1300, and (d) 1400 UTC 6 Aug 2007. Background field of water vapor mixing ratio (colored shading,
gkg21) is shownalongwithhorizontalwindvectors in the cross sectionoverlaid.Vertical velocities. 0.3ms21 are contoured inwhite.Cloudwater
mixing ratio and rainwatermixing ratio are respectively shown in gray and red in 0.5gm23 contour increments, startingwith 0.05gm23. Pink star is
the CI location in the WRF simulation. The horizontal zonal wind scale is shown in the bottom left of each panel.
2704 MONTHLY WEATHER REV IEW VOLUME 142
Unauthenticated | Downloaded 11/12/21 10:27 AM UTC
Kirshbaum 2011). Thewesterlies in the steering level (2–
4 km) were stronger in the simulations than in the ob-
servations (cf. Figs. 12 and 14). It is also possible that the
interaction between the microphysics and dynamics in
the observed storms played a role in the intensity, which
WRF was unable to capture.
Many similarities exist between the high-resolution
observations and high-resolution simulations. These in-
clude upslope flow caused by differential heating along
the slopes and cyclonic (anticyclonic) flow in the southern
(northern) Rhine Valley. These upslope-generating flow
structures caused low-level convergence when they met
the large-scale westerly winds along the eastern slopes of
the Vosges Mountains. The resulting low-level conver-
gence zone occurred within a region of increasing and
deepeningmoisture due to advection and vertical mixing.
This coincided with a region that was unstable to parcel
ascent and led toCI in both observations and simulations.
The simulations, however, did not allow the storms to
develop into deep convection as the moderate westerlies
forced the cells off the mountains.
5. Summary and conclusions
The COPS field campaign was conducted in the
Rhine Valley bounded on the west by the Vosges and
on the east by the Black Forest Mountains. The specific
case of CI on 6 August 2007 studied herein occurred
along the eastern slopes of the Vosges Mountains in
France. Doppler radar and GPS observations were
used to obtain four-dimensional wind and water vapor
fields during COPS. This is the first known study
where such high-resolution wind (250-m vertical and
500-m horizontal) and water vapor (500-m vertical and
16–18 km horizontal) fields have been combined to
provide a detailed picture of processes leading to CI
in complex terrain. High-resolution WRF numerical
simulations (0.7 km) resulted in wind and moisture
fields that were remarkably similar to those observed.
Furthermore, there was very good agreement between
the observed and simulated time and location of CI.
The simulations did not produce a storm as strong as
that observed but the large- and small-scale conditions
were replicated quite well.
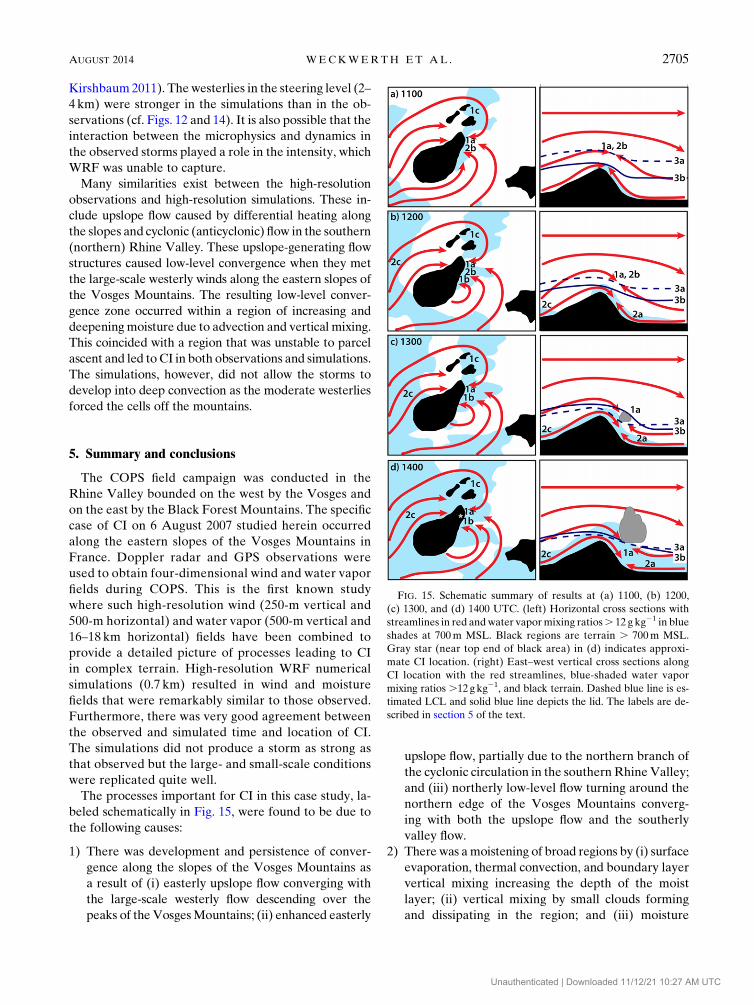
The processes important for CI in this case study, la-
beled schematically in Fig. 15, were found to be due to
the following causes:
1) There was development and persistence of conver-
gence along the slopes of the Vosges Mountains as
a result of (i) easterly upslope flow converging with
the large-scale westerly flow descending over the
peaks of the VosgesMountains; (ii) enhanced easterly
upslope flow, partially due to the northern branch of
the cyclonic circulation in the southernRhineValley;
and (iii) northerly low-level flow turning around the
northern edge of the Vosges Mountains converg-
ing with both the upslope flow and the southerly
valley flow.
2) There was amoistening of broad regions by (i) surface
evaporation, thermal convection, and boundary layer
vertical mixing increasing the depth of the moist
layer; (ii) vertical mixing by small clouds forming
and dissipating in the region; and (iii) moisture
FIG. 15. Schematic summary of results at (a) 1100, (b) 1200,
(c) 1300, and (d) 1400 UTC. (left) Horizontal cross sections with
streamlines in red andwater vapormixing ratios. 12 g kg21 in blue
shades at 700m MSL. Black regions are terrain . 700m MSL.
Gray star (near top end of black area) in (d) indicates approxi-
mate CI location. (right) East–west vertical cross sections along
CI location with the red streamlines, blue-shaded water vapor
mixing ratios .12gkg21, and black terrain. Dashed blue line is es-
timated LCL and solid blue line depicts the lid. The labels are de-
scribed in section 5 of the text.
AUGUST 2014 WECKWERTH ET AL . 2705
Unauthenticated | Downloaded 11/12/21 10:27 AM UTC

advection over the Vosges Mountains in advance of
a synoptic-scale frontal-trough system.
3) The WRF simulations suggested that spatial and
temporal variability of the (i) LCL and (ii) capping
layers, or lids, combined to influence the location and
timing of convective development.
These kinematic and thermodynamic processes were
observed over a period of 3.5 h as the amount of moisture
and its depth increased, creating an area ripe for the ini-
tiation of deep, moist convection. High-resolution ob-
servations of the low-level wind, moisture, and buoyancy
fields were helpful in understanding the CI on this day.
This study also showed that high-resolution simulations
can reproduce complicated flows in complex terrain and
can accurately simulate the timing and location of CI.
This unique combination of 3D winds and moisture
fields can be used for multiple purposes, such as for
observing the moisture field and moisture advection,
which are important for studying and forecasting con-
vective processes. Even higher-resolution observations
would be useful in complex terrain to better observe
valley flow andmoisture variations leading to convective
development. Such a combination could be valuable for
forecasting potential flash flood events in complex ter-
rain. Further research on combining dual-Doppler winds
with high-resolution tomographic retrievals is proposed
as part of the Front Range Observational Network Test
bed (FRONT) and may be evaluated in the Colorado
Front Range in the future.
Acknowledgments. The COPS PIs are gratefully ac-
knowledged for bringing together this rich and diverse
dataset. The DOW dataset was collected by the staff of
Center for Severe Weather Research (CSWR) through
the support of the Deutsche Forschungsgemeinschaft
(DFG) and Ministry of Science of Baden-W€urttemberg,
Germany. The VERA analyses were provided by Theresa
Gorgas (U. Vienna). The U.K. Facility for Ground-based
Atmospheric Measurement (FGAM) wind profiler data
were provided by Emily Norton and the Salford lidar data
by Fay Davies.
Fruitful discussions with Jim Wilson are much appre-
ciated. Constructive reviews by Wen-Chau Lee and Jim
Wilson greatly improved an earlier version of this man-
uscript. Two anonymous reviewers and Dan Kirshbaum
are gratefully acknowledged for their insightful, thor-
ough, and helpful comments.
The second (LJB) and sixth authors (AMB) acknowl-
edge support from the Natural Environment Research
Council Grant NE/E018483/1. The fourth author’s (JVB)
participation in the COPS campaign was financially sup-
ported by the ANR (Grant ANR-06-BLAN-0018-04: 648
COPS/France) and CNRS/INSU (LEFE/IDAO pro-
gram) in France. Support of the last author (TJH)
through the NCAR Short-Term Explicit Prediction
(STEP) program is greatly appreciated.
REFERENCES
Banta, R. M., 1984: Daytime boundary-layer evolution over moun-
tainous terrain. Part I: Observations of the dry circulations.Mon.
Wea. Rev., 112, 340–356, doi:10.1175/1520-0493(1984)112,0340:
DBLEOM.2.0.CO;2.
Behrendt, A., and Coauthors, 2011: Observation of convection
initiation processes with a suite of state-of-the-art research
instruments during COPS IOP 8b.Quart. J. Roy. Meteor. Soc.,
137, 81–100, doi:10.1002/qj.758.
Bennett, L. J., and Coauthors, 2011: Initiation of convection over
the Black Forest Mountains during COPS IOP15a. Quart.
J. Roy. Meteor. Soc., 137, 176–189, doi:10.1002/qj.760.
Bevis, M., S. Businger, T. A. Herring, C. Rocken, R. A. Anthes,
and R. H. Ware, 1992: GPS meteorology: Remote sensing of
atmospheric water vapour using the global positioning system.
J. Geophys. Res., 97, 15787–15801, doi:10.1029/92JD01517.
——,——, S. R. Chiswell, T. A. Herring, R. A. Anthes, C. Rocken,
and R. H. Ware, 1994: GPS meteorology: Mapping zenith wet
delay onto precipitable water. J. Appl. Meteor., 33, 379–386,
doi:10.1175/1520-0450(1994)033,0379:GMMZWD.2.0.CO;2.
Bhawar, R., andCoauthors, 2011: Thewater vapour intercomparison
effort in the framework of the Convective and Orographically-
induced Precipitation Study: Airborne-to-ground-based and
airborne-to airborne lidar systems. Quart. J. Roy. Meteor.
Soc., 137, 325–348, doi:10.1002/qj.697.
Businger, S., and Coauthors, 1996: The promise of GPS in atmo-
spheric monitoring. Bull. Amer. Meteor. Soc., 77, 5–18,
doi:10.1175/1520-0477(1996)077,0005:TPOGIA.2.0.CO;2.
Byers, H. R., and R. R. Braham Jr., 1949: The Thunderstorm.U.S.
Government Printing Office, 287 pp.
Chaboureau, J. P., F. Guichard, J. L. Redelsperger, and J. L. Lafore,
2004: The role of stability and moisture in the diurnal cycle of
convection over land. Quart. J. Roy. Meteor. Soc., 130, 3105–
3117, doi:10.1256/qj.03.132.
Corsmeier, U., and Coauthors, 2011: Processes driving deep con-
vection over complex terrain: A multi-scale analysis of ob-
servations from COPS IOP 9c. Quart. J. Roy. Meteor. Soc.,
137, 137–155, doi:10.1002/qj.754.Cressman,G. P., 1959: An operational objective analysis system.Mon.
Wea. Rev., 87, 367–384, doi:10.1175/1520-0493(1959)087,0367:
AOOAS.2.0.CO;2.
Di Girolamo, P., D. Summa, and R. Ferretti, 2009: Multiparameter
Raman lidar measurements for the characterization of a dry
stratospheric intrusion event. J. Atmos. Oceanic Technol., 26,
1742–1762, doi:10.1175/2009JTECHA1253.1.
——, ——, R. Bhawar, T. Di Iorio, M. Cacciani, I. Veselovskii,
O. Dubovik, and A. Kolgotin, 2012: Raman lidar observations
of a Saharan dust outbreak event: Characterization of the
dust optical properties and determination of particle size
and micropshysical parameters. Atmos. Environ., 50, 66–78,
doi:10.1016/j.atmosenv.2011.12.061.
Gal-Chen, T., 1982: Errors in fixed and moving frames of references:
Applications for conventional and Doppler radar analysis. J. At-
mos. Sci., 39, 2279–2300, doi:10.1175/1520-0469(1982)039,2279:
EIFAMF.2.0.CO;2.
2706 MONTHLY WEATHER REV IEW VOLUME 142
Unauthenticated | Downloaded 11/12/21 10:27 AM UTC

Geerts, B., Q.Miao, and J. C. Demko, 2008: Pressure perturbations
and upslope flow over a heated, isolated mountain.Mon. Wea.
Rev., 136, 4272–4288, doi:10.1175/2008MWR2546.1.
Gorgas, T., M.Dorninger, andR. Steinacker, 2009: High resolution
analyses based on the D_PHASE and COPS GTS and non-
GTS data set. Ann. Meteor., 44, 94–95.Hagen, M., J. van Baelen, and E. Richard, 2011: Influence of the
wind profile on the initiation of convection in mountainous
terrain. Quart. J. Roy. Meteor. Soc., 137, 224–235, doi:10.1002/
qj.784.
Hane, C. E., C. J. Kessinger, and P. S. Ray, 1987: The Oklahoma
squall line of 19May 1977. Part II: Mechanisms for maintenance
of the region of strong convection. J. Atmos. Sci., 44, 2866–2883,
doi:10.1175/1520-0469(1987)044,2866:TOSLOM.2.0.CO;2.
Hanley, K. E., D. J. Kirshbaum, S. E. Belcher, N. M. Roberts, and
G. Leoncini, 2011: Ensemble predictability of an isolated
mountain thunderstorm in a high-resolution model. Quart.
J. Roy. Meteor. Soc., 137, 2124–2137, doi:10.1002/qj.877.
Kalthoff, N., and Coauthors, 2011: The dependence of convection-
related parameters on surface and boundary-layer conditions
over complex terrain. Quart. J. Roy. Meteor. Soc., 137, 70–80,
doi:10.1002/qj.686.
Kingsmill, D. E., 1995: Convection initiation associated with
a sea-breeze front, a gust front, and their collision.Mon.Wea.
Rev., 123, 2913–2933, doi:10.1175/1520-0493(1995)123,2913:
CIAWAS.2.0.CO;2.
Kirshbaum, D. J., 2011: Cloud-resolving simulations of deep con-
vection over a heated mountain. J. Atmos. Sci., 68, 361–378,
doi:10.1175/2010JAS3642.1.
Kottmeier, C., and Coauthors, 2008: Mechanisms initiating deep
convection over complex terrain during COPS.Meteor. Z., 17,
931–948, doi:10.1127/0941-2948/2008/0348.
Labbouz, L., and Coauthors, 2013: Precipitation on the lee side
of the Vosges Mountains: Multi-instrumental study of one
case from the COPS campaign. Meteor. Z., 22, 413–432,
doi:10.1127/0941-2948/2013/0413.
May, P. T., 1999: Thermodynamic and vertical velocity structure
of two gust fronts observed with a wind profiler/RASS dur-
ing MCTEX. Mon. Wea. Rev., 127, 1796–1807, doi:10.1175/
1520-0493(1999)127,1796:TAVVSO.2.0.CO;2.
Miller, L. J., J. D. Tuttle, and C. K. Knight, 1988: Airflow and hail
growth in a severe northern high plains supercell. J. Atmos.
Sci., 45, 736–762, doi:10.1175/1520-0469(1988)045,0736:
AAHGIA.2.0.CO;2.
——, ——, and G. B. Foote, 1990: Precipitation production in
a large Montana hailstorm: Airflow and particle growth
trajectories. J. Atmos. Sci., 47, 1619–1646, doi:10.1175/
1520-0469(1990)047,1619:PPIALM.2.0.CO;2.
Mohr, C. G., L. J. Miller, R. L. Vaughan, and H. W. Frank, 1986:
The merger of mesoscale datasets into a common Cartesian
format for efficient and systematic analysis. J. Atmos. Oceanic
Technol., 3, 143–161, doi:10.1175/1520-0426(1986)003,0143:
TMOMDI.2.0.CO;2.
Morcrette, C., H. Lean,K. Browning, J. Nicol, N. Roberts, P. Clark,
A. Russell, and A. Blyth, 2007: Combination of mesoscale and
synoptic mechanisms for triggering an isolated thunderstorm:
Observational case study of CSIP IOP 1.Mon. Wea. Rev., 135,
3728–3749, doi:10.1175/2007MWR2067.1.
Neiman, P. J., F.M.Ralph,A.B.White,D.E.Kingsmill, andP.O.G.
Persson, 2002: The statistical relationship between upslope flow
and rainfall in California’s coastal mountains: Observations
during CALJET.Mon. Wea. Rev., 130, 1468–1492, doi:10.1175/
1520-0493(2002)130,1468:TSRBUF.2.0.CO;2.
O’Brien, J. J., 1970: Alternative solutions to the classical vertical
velocity problem. J. Appl. Meteor., 9, 197–203, doi:10.1175/
1520-0450(1970)009,0197:ASTTCV.2.0.CO;2.
Oye, R., C. Mueller, and S. Smith, 1995: Software for radar trans-
lation, visualization, editing, and interpolation. Preprints, 27th
Conf. on Radar Meteorology, Vail, CO, Amer. Meteor. Soc.,
359–361.
Purdom, J. F. W., and K. Marcus, 1982: Thunderstorm trigger
mechanisms over the southeast U.S. Preprints, 12th Conf. on
Severe Local Storms, San Antonio, TX, Amer. Meteor. Soc.,
487–488.
Rotach,M.W., and Coauthors, 2009a:MAPD-PHASE: Real-time
demonstration of weather forecast quality in the Alpine re-
gion. Bull. Amer. Meteor. Soc., 90, 1321–1336, doi:10.1175/
2009BAMS2776.1.
——, and Coauthors, 2009b: Supplement to MAP D-PHASE:
Real-time demonstration of weather forecast quality in the
Alpine region: Additional applications of the D-Phase data-
sets. Bull. Amer. Meteor. Soc., 90, S28–S32, doi:10.1175/
2009BAMS2776.2.
Skamarock, W. C., and Coauthors, 2008: A description of the
Advanced Research WRF version 3. NCAR Tech. Rep.
NCAR/TN-4751STR, 113 pp., doi:10.5065/D68S4MVH.
Smolarkiewicz, P., and R. Rotunno, 1989: Low Froude number
flow past three-dimensional obstacles. Part I: Baroclinically
generated lee vortices. J. Atmos. Sci., 46, 1154–1164,
doi:10.1175/1520-0469(1989)046,1154:LFNFPT.2.0.CO;2.
Steinacker, R., C. H€aberli, and W. P€ottschacher, 2000: A trans-
parent method for the analysis and quality evaluation of ir-
regularly distributed and noisy observational data.Mon. Wea.
Rev., 128, 2303–2316, doi:10.1175/1520-0493(2000)128,2303:
ATMFTA.2.0.CO;2.
——, and Coauthors, 2006: A mesoscale data analysis and down-
scaling method over complex terrain. Mon. Wea. Rev., 134,
2758–2771, doi:10.1175/MWR3196.1.
Van Baelen, J., J.-P. Aubagnac, and A. Dabas, 2005: Compari-
son of near-real-time estimates of integrated water vapour
derived with GPS, radiosondes, and microwave radiometer.
J. Atmos. Oceanic Technol., 22, 201–210, doi:10.1175/
JTECH-1697.1.
——, M. Reverdy, F. Tridon, L. Labbouz, G. Dick, M. Bender,
and M. Hagen, 2011: On the relationship between water va-
pour field evolution and the life cycle of precipitation sys-
tems. Quart. J. Roy. Meteor. Soc., 137, 204–223, doi:10.1002/
qj.785.
Wang, J., H. L. Cole, D. J. Carlson, E. R. Miller, K. Beierle,
A. Paukkunen, and T. K. Laine, 2002: Corrections of humidity
measurement errors from the Vaisala RS80 radiosonde—
Application to TOGA-COARE data. J. Atmos. Oceanic
Technol., 19, 981–1002, doi:10.1175/1520-0426(2002)019,0981:
COHMEF.2.0.CO;2.
——, L. Zhang, A. Dai, T. Van Hove, and J. Van Baelen, 2007:
A near-global two-hourly data set of atmospheric precipitable
water from ground-based GPS measurements. J. Geophys.
Res., 112, D11107, doi:10.1029/2006JD007529.
Weckwerth, T. M., J. W. Wilson, M. Hagen, T. J. Emerson, J. O.
Pinto, D. L. Rife, and L. Grebe, 2011: Radar climatology of
the COPS region. Quart. J. Roy. Meteor. Soc., 137, 31–41,
doi:10.1002/qj.747.
Wilson, J.W., andW.E. Schreiber, 1986: Initiationof convective storms
at radar-observed boundary-layer convergence lines. Mon. Wea.
Rev., 114, 2516–2536, doi:10.1175/1520-0493(1986)114,2516:
IOCSAR.2.0.CO;2.
AUGUST 2014 WECKWERTH ET AL . 2707
Unauthenticated | Downloaded 11/12/21 10:27 AM UTC
——, and C. K. Mueller, 1993: Nowcasts of thunderstorm initia-
tion and evolution. Wea. Forecasting, 8, 113–131, doi:10.1175/
1520-0434(1993)008,0113:NOTIAE.2.0.CO;2.
——, and D. L. Megenhardt, 1997: Thunderstorm initia-
tion, organization, and lifetime associated with Florida
boundary layer convergence lines. Mon. Wea. Rev.,
125, 1507–1525, doi:10.1175/1520-0493(1997)125,1507:
TIOALA.2.0.CO;2.
——, T. M. Weckwerth, J. Vivekanandan, R. M. Wakimoto, and
R. W. Russell, 1994: Boundary layer clear-air radar echoes:
Origin of echoes and accuracy of derivedwinds. J. Atmos.Oceanic
Technol., 11, 1184–1206, doi:10.1175/1520-0426(1994)011,1184:
BLCARE.2.0.CO;2.
Wulfmeyer, V., and Coauthors, 2008: The Convective and Oro-
graphically Induced Precipitation Study: A research and
development project of the World Weather Research Pro-
gram for improving quantitative precipitation forecasting in
low-mountain regions. Bull. Amer. Meteor. Soc., 89, 1477–
1486, doi:10.1175/2008BAMS2367.1.
——, and Coauthors, 2011: The Convective and Orographically-
induced Precipitation Study (COPS): The scientific strategy,
the field phase and first highlights.Quart. J. Roy. Meteor. Soc.,
137, 3–30, doi:10.1002/qj.752.
Wurman, J., J. Straka, E. Rasmussen,M. Randall, andA. Zahrai, 1997:
Design and deployment of a portable, pencil-beam, pulsed, 3-cm
Doppler radar. J. Atmos. Oceanic Technol., 14, 1502–1512,
doi:10.1175/1520-0426(1997)014,1502:DADOAP.2.0.CO;2.
2708 MONTHLY WEATHER REV IEW VOLUME 142
Unauthenticated | Downloaded 11/12/21 10:27 AM UTC