observational and modeling constraints on global
TRANSCRIPT
Observational and Modeling Constraints on Global AnthropogenicEnrichment of MercuryHelen M. Amos,*,† Jeroen E. Sonke,‡ Daniel Obrist,§ Nicholas Robins,∥ Nicole Hagan,⊥
Hannah M. Horowitz,# Robert P. Mason,∇ Melanie Witt,○ Ian M. Hedgecock,◆ Elizabeth S. Corbitt,#
and Elsie M. Sunderland†,¶
†Department of Environmental Health, Harvard T. H. Chan School of Public Health , Boston, Massachusetts 02115, United States‡Laboratoire Geosciences Environnement Toulouse, Observatoire Midi-Pyrenees, CNRS-IRD-Universite Paul Sabatier, 31062Toulouse, France§Desert Research Institute, Reno, Nevada 89512, United States∥Department of History, North Carolina State University, Raleigh, North Carolina 27695, United States⊥Environmental Health Council, Durham, North Carolina 27701, United States#Department of Earth and Planetary Sciences, Harvard University, Cambridge, Massachusetts 02138, United States∇Department of Marine Sciences, University of Connecticut, Groton, Connecticut 06340, United States○Department of Physiology, Anatomy and Genetics, University of Oxford, Oxford OX1 3QX, United Kingdom◆Rende Division, CNR-Institute of Atmospheric Pollution Research, 87036 Rende, Italy¶School of Engineering and Applied Sciences, Harvard University, Cambridge, Massachusetts 02138, United States
*S Supporting Information
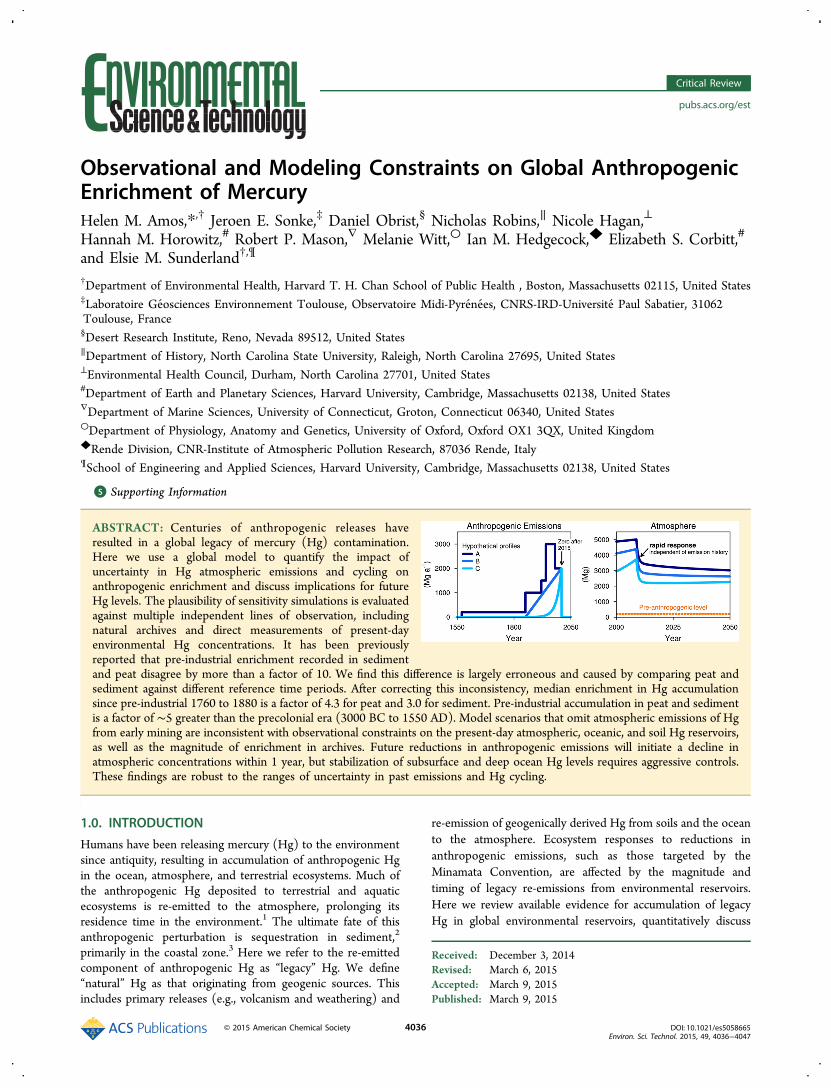
ABSTRACT: Centuries of anthropogenic releases haveresulted in a global legacy of mercury (Hg) contamination.Here we use a global model to quantify the impact ofuncertainty in Hg atmospheric emissions and cycling onanthropogenic enrichment and discuss implications for futureHg levels. The plausibility of sensitivity simulations is evaluatedagainst multiple independent lines of observation, includingnatural archives and direct measurements of present-dayenvironmental Hg concentrations. It has been previouslyreported that pre-industrial enrichment recorded in sedimentand peat disagree by more than a factor of 10. We find this difference is largely erroneous and caused by comparing peat andsediment against different reference time periods. After correcting this inconsistency, median enrichment in Hg accumulationsince pre-industrial 1760 to 1880 is a factor of 4.3 for peat and 3.0 for sediment. Pre-industrial accumulation in peat and sedimentis a factor of ∼5 greater than the precolonial era (3000 BC to 1550 AD). Model scenarios that omit atmospheric emissions of Hgfrom early mining are inconsistent with observational constraints on the present-day atmospheric, oceanic, and soil Hg reservoirs,as well as the magnitude of enrichment in archives. Future reductions in anthropogenic emissions will initiate a decline inatmospheric concentrations within 1 year, but stabilization of subsurface and deep ocean Hg levels requires aggressive controls.These findings are robust to the ranges of uncertainty in past emissions and Hg cycling.
1.0. INTRODUCTION
Humans have been releasing mercury (Hg) to the environmentsince antiquity, resulting in accumulation of anthropogenic Hgin the ocean, atmosphere, and terrestrial ecosystems. Much ofthe anthropogenic Hg deposited to terrestrial and aquaticecosystems is re-emitted to the atmosphere, prolonging itsresidence time in the environment.1 The ultimate fate of thisanthropogenic perturbation is sequestration in sediment,2
primarily in the coastal zone.3 Here we refer to the re-emittedcomponent of anthropogenic Hg as “legacy” Hg. We define“natural” Hg as that originating from geogenic sources. Thisincludes primary releases (e.g., volcanism and weathering) and
re-emission of geogenically derived Hg from soils and the oceanto the atmosphere. Ecosystem responses to reductions inanthropogenic emissions, such as those targeted by theMinamata Convention, are affected by the magnitude andtiming of legacy re-emissions from environmental reservoirs.Here we review available evidence for accumulation of legacyHg in global environmental reservoirs, quantitatively discuss
Received: December 3, 2014Revised: March 6, 2015Accepted: March 9, 2015Published: March 9, 2015
Critical Review
pubs.acs.org/est
© 2015 American Chemical Society 4036 DOI: 10.1021/es5058665Environ. Sci. Technol. 2015, 49, 4036−4047

uncertainties in the global Hg budget, and analyze implicationsfor future environmental responses.Information on historical Hg accumulation can be drawn
from multiple natural archives, including aquatic sediment,ombrotrophic peat, glacial ice, and biological tissues.4−8 Lakesediment and peat archives are commonly used to indicatechanges in Hg accumulation. Each archive reflects differenttime intervals of accumulation and can be disturbed by a varietyof postdepositional processes.9,10 In both cases, carefulselection of sampling sites and analysis of evidence fordisturbance by investigators establishes reliability as anindicator of historical pollution.11
Remote lake sediments have been widely reported toconverge around a 3-fold increase in Hg accumulation in themodern era relative to the pre-industrial (1850) period aftercorrecting for sediment focusing, watershed inputs, and otherfactors.12−14 Prior work reported a 40-fold pre-industrial topresent increase in peat Hg accumulation rates,15 but we findthe temporal periods of accumulation being compared were notthe same. This has artificially inflated the apparent discrepancyacross archives, and we correct for this here to revisit thecomparison of Hg accumulation in remote lake sediment andpeat records.Global biogeochemical Hg models extend observations in
space and time and provide complementary information tonatural archives of Hg accumulation. The first generation ofmodels prescribed a factor of 3 pre-industrial-to-presentenrichment of atmospheric deposition to estimate Hgaccumulation in the ocean and terrestrial ecosystems.1,16−18
Recently, the availability of historical inventories of globalanthropogenic Hg releases19,20 and accounting for longer timescales of coupling among the atmosphere, terrestrialecosystems, and the ocean have allowed an independent,alternate method for characterizing the global Hg cycle.3,21
Multiple historical inventories of atmospheric Hg emis-sions19,22−25 point to substantial pre-1850 and late 19th centuryHg emissions to the atmosphere associated with the massivequantities of Hg consumed for early gold and silver miningactivities.24,26−28 The proportion of Hg released to theatmosphere during pre-1850 and late 19th century miningactivities and the spatial extent of these impacts is a subject ofongoing debate. Some recent work suggests releases to theatmosphere are only a small fraction of the total Hgconsumed13,29 and impacts are restricted to the localenvironment.30,31
The objective of this review is to bracket plausible scenariosfor global anthropogenic enrichment of Hg based on currentestimates of primary emissions and rates of exchange betweenenvironmental reservoirs. Global anthropogenic Hg enrichmentis important because it directly affects future environmental
responses to changes in anthropogenic emissions, and wediscuss the implications of various uncertainty scenarios here.We re-examine evidence for anthropogenic enrichment ofatmospheric deposition in published peat records and compareresults to recent reviews of lake sediment data. We use a globalgeochemical model for Hg cycling to explore impacts ofhistorical Hg emissions scenarios on global anthropogenicenrichment and evaluate consistency of modeling scenarioswith archival data and contemporary measurements. Implica-tions of various historical Hg emissions scenarios for futureenvironmental concentrations and responses to emissionsreductions are presented.
2.0. METHODS
2.1. Model Description. We use the global biogeochemicalbox model developed by Amos et al.21 and updated to includeburial in coastal sediments3 to investigate the environmentalimplications of major uncertainties in Hg emissions and cycling.The model represents Hg cycling as a set of coupled ordinarydifferential equations based on first-order rate coefficients (k)for Hg exchange between seven global reservoirs, as describedin previous work. Model reservoirs represent three types ofterrestrial Hg pools, three ocean compartments, and theatmosphere. The model is initialized from a natural steady-statesimulation without anthropogenic Hg releases and then forcedfrom 2000 BC to present day (2008 AD) with anthropogenicHg releases. The size of modeled present-day Hg reservoirs andthe magnitude of anthropogenic enrichment are compared toobservations. All parameter values are provided in theSupporting Information of Amos et al.,3 and the model ispublicly available at http://bgc.seas.harvard.edu/models.html.Table 1 describes six sensitivity simulations that explore
uncertainty in historical atmospheric Hg emissions and modelrate coefficients that describe how Hg cycles through theenvironment. Sensitivity simulations include scenarios: (1 and2) reduced anthropogenic emissions from pre-1900s mining,(3) increased geogenic emissions, (4) elevated oceanic evasion,(5) reduced terrestrial re-emissions, and (6) greater burial atocean margins. We evaluate the plausibility of each modelscenario using observational constraints on the following: (a)anthropogenic enrichment factors from archival records, (b)the timing of peak Hg inputs, and (c) the size of present-dayglobal Hg reservoirs derived from contemporary measurementsof Hg concentrations in the atmosphere, ocean, and soils.
2.2. Constraints on Anthropogenic Enrichment fromNatural Archives. We compile available data from remoteombrotrophic peat bogs (Supporting Information (SI) TableS1) to investigate changes in historical atmospheric Hgdeposition and anthropogenic enrichment across archivesfrom different regions. This includes the compilation of peat
Table 1. Description of Model Sensitivity Simulations
scenario numbers short name description of changes made relative to Amos et al.3 model
1 mining decreased 3× forced by Streets et al.19 inventory with 1570-to-1920 large-scale Hg, Ag, and Au mining emissions decreased by afactor of 3 as in Zhang et al.32
2 zero pre-1850 emissions forced by Streets et al.19 inventory with 1850-to-1920 large-scale Hg, Ag, and Au mining emissions decreased by50% and zero pre-1850 emissions
3 greater geogenic emissions increase geogenic emissions from 76 to 300 Mg year−1
4 increased ocean evasion increase the rate coefficient for ocean evasion by +30%5 greater soil retention decrease the rate coefficients for Hg(0) evasion from the slow and armored organic soil reservoirs by a factor of 56 greater burial 90% of total particle-bound Hg discharged by rivers buried in benthic sediment at ocean margins
The time history of emission scenarios 1 and 2 are shown in SI Figure S1.
Environmental Science & Technology Critical Review
DOI: 10.1021/es5058665Environ. Sci. Technol. 2015, 49, 4036−4047
4037
data from Biester et al.15 and other recent studies. Varved or14C dated lake sediment records covering the centuries beforeHg use in large-scale mining (i.e., pre-16th century) areincluded as well (SI Table S1). Shorter sediment records (∼150years) have been recently reviewed elsewhere.13,32 We do notconduct an additional review of 210Pb dated cores, except todiscuss the Biester compilation of sediment data as it relates toprevious interpretation of peat.We calculate a series of enrichment factors (EFs), defined as
the ratio of Hg accumulation rates (μg m−2 year−1) from twotime intervals. EFs are calculated for four periods based on twohistorical reference periods: (a) “pre-industrial” (1760 to 1880)and (b) before the rise of large-scale gold, silver, and Hg mining(3000 BC to 1550 AD).33 Longer, varved or 14C datedlacustrine sediment records and multimillennial 14C dated peatrecords are used to derive EFs relative to 3000 BC to 1550 AD.Relative accumulation is calculated for two modern periods: (a)contemporary (ca. post-1990) Hg accumulation and (b) theextended 20th century maximum (“20Cmax”) observed in mostarchival records (SI Tables S1). These intervals are determinedempirically based on the temporal resolution of the archives.We average Hg accumulation rates across the most pronounced20th century peak, which is typically between the 1940s and1980s. Supporting Information Table S1 documents the onsetand end of the 20Cmax in peat and sediment archives. The Hgaccumulation rates and EFs for each core are documented in SITable S1, as well as the onset and end of the 20Cmax. Weperform the Shapiro−Wilk test for normality. We average EFsfor studies with multiple cores per site. If data are normallydistributed, we report mean ± standard deviation (SD). If dataare not normally distributed, we report the median and 95%confidence intervals.2.3. Constraints on Present-Day Global Hg Reservoirs.
Direct measurements of contemporary Hg concentrations inthe atmosphere, ocean, and soils can be used to constrainmodeled sizes of Hg reservoirs. Recent models evaluatedagainst direct measurements of atmospheric Hg estimate thatthe atmosphere contains approximately 5000 Mg of Hg (range,4600−5600 Mg; reviewed in Amos et al.21). Atmospheric Hg ismeasured with a time resolution of minutes to hours at morethan 30 land-based stations.34,35 Other data include measure-ments from ship cruises36−39 and aircraft measurementsspanning the globe,40−44 as well as numerous field studies(e.g., see Rutter et al.45and Jaffe et al.46). Given the abundanceof atmospheric Hg measurements, the size of the present-dayatmospheric reservoir is one of the strongest constraints on theglobal Hg budget.Mean seawater Hg concentrations range between 0.6 and 2.9
pM in the upper 1000 m of the ocean and between 0.5 and 2.4pM below 1000 m and can be used to constrain thecontemporary oceanic Hg reservoir.29,47,48 Sunderland andMason17 compiled all available seawater Hg measurementsprior to 2005 and estimated the Hg reservoir in the globalocean at 350 Gg (90% confidence interval, 270−450 Gg), ofwhich approximately 18% (63−120 Mg) is above 1000 m.Lamborg et al.29 synthesized more recent observations, mainlyfrom GEOTRACES cruises post-2005, and estimated the totaloceanic reservoir at 280 Gg. This is similar to the recentmodeling results (260 Gg) by Zhang et al.32 The upper oceanreservoir estimate from Lamborg et al.29 falls on the low end ofthe earlier estimates of Sunderland and Mason17 at 63 Mg,indicating a general pattern of lower Hg concentrationsmeasured in recent cruises. This could be either a temporal
trend or a result of contamination of earlier samples andremains an open question.48
The size of the global soil Hg reservoir is less certain due tosparser observational coverage and large variability acrossecosystems and soil profiles. There have been two independentmodel estimates of global Hg storage in soils. Smith-Downey etal.49 developed a mechanistic model for terrestrial Hg cyclingbased on soil organic carbon dynamics that builds on theirstrong association50−55 and evaluated the model against twocontinental scale transects across the United States andCanada.56 This study estimated the terrestrial Hg reservoir tobe ∼240 Gg globally. Hararuk et al.57 estimated a reservoir ofapproximately 15 Gg in the upper 40 cm of U.S. soils usingmore recent field measurements. Extrapolating measuredorganic carbon-to-Hg ratios globally results in more than 300Gg suggesting results from Smith-Downey et al.49 may haveunderestimated Hg contained in the terrestrial environment. Anumber of additional studies from a diversity of geographiclocations have reported soil Hg concentrations from uplandsoils (SI Table S2). Mean Hg concentrations in NorthAmerican and European soils distant from point sourcesgenerally fall between 20 and 50 ng g−1 dry weight (SI TableS2), which is in the range of the two studies previously used toestimate magnitudes of global reservoirs. Recently reported soilconcentrations from east Asia are higher on average (SI TableS2), implying even 300 Gg may be biased low.
2.4. Primary Anthropogenic Emissions. Enrichment ofanthropogenic Hg in environmental reservoirs is determined bythe magnitude of historical anthropogenic releases and the timescales of coupling among reservoirs that affect reemissions andsequestration. Uncertainty in historical anthropogenic emis-sions plays a large role in modeled enrichment of environ-mental reservoirs. Horowitz et al.20 estimated that globally 320Gg of Hg has been cumulatively released to the atmospheresince 1850 by including environmental releases associated withintentional uses of Hg in commercial products and processes(Figure 1; Table 2). The earlier inventory developed by Streetset al.19 estimated 130 Gg (80% CI, 70−260 Gg) was releasedprior to 1850, primarily associated with silver mining in colonialSpanish America between the 16th and 19th centuries. Themodel from Amos et al.3 is forced by the inventory fromHorowitz et al.,20 which suggests global emissions to theatmosphere peaked in the 1970s at the height of Hg use inproducts such as batteries and paint.We investigate the environmental implications of uncertainty
in historical Hg emissions from large-scale mining prior to the20th century by considering alternate emissions scenariosproposed in recent work. Over the past several centuries,mining has been the dominant anthropogenic source of Hg tothe environment and the principal driver of early enrichment.Historical mining emissions are uncertain, especially withregard to the proportion of Hg used in mining that was lost tothe atmosphere as Hg(0). Scenario 1 decreases pre-1920mining emissions from Streets et al.19 by a factor of 3 assuggested by Zhang et al.32 (SI Figure S1). Scenario 2 reduces1850-to-1920 mining emissions by 50% and eliminates pre-1850 emissions (SI Figure S1). Large-scale mining contributes arelatively small portion to global anthropogenic emissions afterthe 1920s when Hg amalgamation was largely replaced bycyanide extraction.58
2.5. Sources of Geogenic Emissions. The magnitude ofgeogenic emissions establishes natural levels of Hg in theatmosphere. Geogenic emissions were 90 Mg year−1 in Amos et
Environmental Science & Technology Critical Review
DOI: 10.1021/es5058665Environ. Sci. Technol. 2015, 49, 4036−4047
4038

al.3 based on passively degassing volcanoes59 and are updatedto 76 ± 30 Mg year−1 here based on the most recent work from
the same group.60 We investigate the biogeochemicalimplications of the upper end of uncertainty in total geogenicemissions (300 Mg year−1)21 as our third uncertainty scenario.The contribution from large eruptions (2000−5000 Mg of Hgper event, 1−2 times per century61) is small when integratedover time. Cumulative release from large eruptions since 1850comprise <5% of total anthropogenic emissions over the sametime period, which is similar to the fraction estimated bySchuster et al.62 using ice core data. Hydrothermal vents are asmall source to marine waters48,63 and are not considered here.The upper range estimate for total geogenic emissions thusdepends on substantial emissions from naturally enriched soils,which is constrained based only on data from Nevada, USA.64
2.6. Variability in Oceanic Evasion Rates. Themagnitude of air−sea exchange has a major influence on thereservoir of Hg retained in the ocean and available forconversion to bioaccumulative MeHg.36 Concentrations ofdissolved Hg(0) in seawater are driven by (1) the supply ofinorganic Hg(II), (2) biological and photochemical reactionrates mediated by light availability and bacterial activity, and (3)the stability of Hg(II) complexes in seawater.65 Air−seaexchange measurements from multiple marine waters andinland seas36,66−72 suggest net fluxes range from 0.4 to 4.2 ngm−2 h−1 (SI Table S3). Environmental drivers of variability inphotochemical and biological Hg redox reactions have onlybeen measured in a few studies.73−77 Modeled net globalevasion based on this work is approximately 3000 Mg year−1
(90% confidence interval,17 2000−4000 Mg year−1), whichresults in a spatial and annual average of 0.9 ng m−2 h−1.65
Using observational constraints, Amos et al.21 estimated
Figure 1. Published estimates of global Hg production andconsumption (top panel) and primary anthropogenic emissions ofHg to the atmosphere (bottom panel).19,20,22−25,27,28,121−123,125
Table 2. Literature Estimates of Primary Hg Sources to the Environmenta
source annual release (Mg year−1) cumulative release (Gg)
Geogenicemissions to the atmosphere
volcanoes, passive degassing 76 ± 30b 12 ± 5c
∼100d ∼16c
volcanoes, large sporadic eruptions 2000−5000 Mg per evente >4f
geothermal 60g 9.6c
releases to watersea floor hydrothermal vents <20h <3.2c
Anthropogenicemissions to the atmosphere
2005 1900i, 2000j
2008 2000 (1300−3200)k, 1300l
2010 2000 (1000−4100)m, 1600n, 2400o
since 1850 220 (140−370)k,p, 320o
all time 350 (230−790)k,p
releases to land and water2010 1100 (550−1900)m,q, 1400o,r
since 1850 310o,s
aPyle and Mather61 estimate small sporadic volcanic eruptions release 500 (60−2000) Mg of Hg year−1. Emissions from geologically enriched soilsalong the world’s mercuriferrous belts have been estimated to be between 500 and 750 Mg year−1.64 The analysis here suggests these may beoverestimated based on empirical constraints on the global Hg cycle (see Figure 4 and text in Section 3.0). bBagnato et al.60 cAssuming a constantemission rate between 1850 and 2010. dBagnato et al.;59 Mather et al.;117 Andren and Nriagu2 ePyle and Mather61 fFor four large eruptions between1850 and 2010. Large eruptions occur at a frequency of 1−2 times per century.61 gVarekamp and Buseck118 hLamborg et al.63 for total dissolved Hg(and MMHg) inputs. iWilson et al.119 jPacyna et al.120 kStreets et al.19 lMuntean et al.121 mAMAP/UNEP122 nRafaj et al.123 oHorowitz et al.20 Notethis inventory includes commercial products missing from previous emission estimates. pRange represents 80% confidence intervals. qIncludesprimary anthropogenic releases of 190 (range, 40−580) Mg year−1 to water, plus ASGM releases to land and water of 880 (range, 500−1300) Mgyear−1. rReleases to water are 560 Mg year−1, and releases to land are 790 Mg year−1. sCumulative releases to water are 160 Gg, and releases to landare 150 Gg.
Environmental Science & Technology Critical Review
DOI: 10.1021/es5058665Environ. Sci. Technol. 2015, 49, 4036−4047
4039

uncertainty in the first-order rate coefficient for Hg(0) evasionfrom the surface ocean is ±30% and we explore this as thefourth uncertainty scenario.2.7. Variability in Atmospheric−Terrestrial Exchange
of Hg(0). A substantial proportion of the atmosphericallydeposited Hg(II) to soils, on leaf surfaces and vegetation, ice,and snow is photochemically, abiotically, and/or biologicallyreduced and evaded back to the atmosphere as Hg(0).78−82 Forexample, Graydon et al.83 found that 45−70% of isotopicallylabeled Hg(II) wet deposited to a forested watershed had beenre-emitted to the atmosphere after 1 year. No study hasexperimentally assessed the re-emission potential for otherforms of deposition such as stomatal uptake and re-release ofHg(0) or the fate of particulate-bound Hg. Using a globalmodel, Smith-Downey et al.49 estimated 56% of annualatmospheric deposition is re-emitted. Recent observationssuggest less evasion of Hg(0) from soils and therefore higherstorage than previously thought.84 This implies smaller first-order rate coefficients for Hg(0) evasion from soils to theatmosphere globally, which we explore as a fifth model scenario.2.9. Sequestration of Hg in Marine Sediments.
Sediment burial at ocean margins is the largest sink ofanthropogenic Hg globally.3 Present-day global mean Hgdischarges from rivers based on Hg concentrations measured ator near river mouths range from 1000 to 5500 Mg year−1.3,17,85
Settling and burial of 70−90% of the suspended particle load inrivers prior to reaching the open ocean3,86 is equivalent to adeposition flux of 20−130 μg m−2 year−1, within the range ofobserved Hg settling fluxes in estuaries and on the shelf (60−700 μg m−2 year−1).85,87−95 The upper estimate of global Hgdischarge (5500 Mg year−1)3 reflects the inclusion of recentmeasurements from large, highly contaminated Asian rivers.Burial in deep ocean sediments is estimated to be 190 Mgyear−1 (90% confidence interval, 180−260 Mg year−1)17 and isa comparatively less important sink. As the sixth uncertaintyscenario, we increase the percent of permanent burial at oceanmargins from 70% to 90% to accommodate previouslypublished ranges. Disturbance of buried estuarine and shelfsediments through benthic trawling, dredging, and coastlinedevelopment has been widespread in recent decades and mayeffectively lower this sequestration term. However, thetemporal and spatial extent of these effects has not beenquantified and thus cannot be considered here.
3.0. RESULTS AND DISCUSSION3.1. Pre-industrial-to-Present Enrichment. Supporting
Information Table S1 summarizes relative changes in Hgaccumulation rates in peat records for the four time periodsconsidered in this analysis. We refer to the period of maximalHg accumulation as the extended 20th century maximum(abbreviated 20Cmax). Median 20Cmax occurs in 1960 (95%confidence interval, 1940 to 1977; n = 20) in peat records and1960 (95% CI, 1953 to 1982; n = 70) in lake sediments (SITable S1).Our analysis of peat records suggests the choice of pre-
industrial reference period explains most of the previouslyreported discrepancy between lake sediment and peat. Biesteret al.15 reported median pre-industrial-to-present enrichment of3 ± 1 for lake sediments and 40 for peat. The authors used1760 to 1880 as a reference period for sediment and 3000 BCto 1550 AD as a reference for peat, leading to more than afactor of 10 difference in reported EFs. Correcting the referenceperiod for peat to 1760 to 1880, we calculate a median
enrichment factor of 4.6 (2.3−14; n = 19) with all data includedand 4.3 if the Shotyk et al.96 outlier is excluded (2SD outliertest; see SI Table S1). There is still a statistically significantdifference (p < 0.001) in enrichment between sediment andpeat. Differences between sediment and peat enrichment maybe explained by the delayed release of Hg from catchment soilsand longer time scales of accumulation associated withwatershed dynamics10,97,98 or by potential 210Pb dating issueswith both peat15 and sediment cores.99,100 It has been argued210Pb is mobile in the surface layers in some bogs, introducingbias in age dating and overestimation of recent Hgaccumulation rates.15 Establishing a reliable 210Pb chronologyin any archive requires validation by an independent timemarker (e.g., 14C, 137Cs, 239,240Pu, varves, known episodicevents)101−103 but is lacking for many sediment records.Figure 2 illustrates how the signal of atmospheric Hg
deposition can be dampened by longer time scales ofaccumulation. Figure 2 shows modeled atmospheric deposition,the fast terrestrial reservoir and slow terrestrial reservoir forseveral model scenarios (Table 1) to characterize a range ofpossible histories of Hg accumulation. The signal of enrichmentdiminishes as the temporal integration of inputs increases from
Figure 2. Modeled effects of variable time scales of integration on thesignal of atmospheric Hg deposition recorded in terrestrial ecosystems.Atmospheric deposition (panel A) is based on the model scenariosdescribed in Table 1. Panel B shows the response of the fast terrestrialreservoir with a lifetime of less than a decade, which is analogous tothe temporal resolution of peat archives. The slow terrestrial reservoirshown in panel C has a lifetime of decades or more and is analogousthe time scales of accumulation for most lake sediment records.
Environmental Science & Technology Critical Review
DOI: 10.1021/es5058665Environ. Sci. Technol. 2015, 49, 4036−4047
4040

years (fast terrestrial reservoir) to decades (slow terrestrialreservoir). In Amos et al.3 (Figure 2, orange line), theenrichment from 1760 to 1880 to 20Cmax is a factor of 4.4for atmospheric deposition, 4.0 for the fast terrestrial reservoir,and 2.9 for the slow terrestrial reservoir. This pattern supportsthe premise that differences in median peat and sedimentenrichment may in large part reflect differences in time scales ofHg accumulation and associated coupling with the atmosphericdeposition signal.3.2. Evidence for Pre-1850 Anthropogenic Impacts. In
peat records, pre-industrial (1760 to 1880) Hg accumulationrates are a factor of 5 greater than pre-mining accumulation(3000 BC to 1550 AD). The mean increase in Hg accumulationfrom the pre-mining era to the 20Cmax in peat is a factor of 27(SD, ±14; median = 26; n = 14). Mean enrichment fromvarved or 14C lake sediment is a factor of 17 (SD, ±17; median= 14; n = 7). Mean sediment and peat enrichment factors arenot significantly different (t test, p = 0.21), but there issubstantial variability in the precolonial Hg accumulation in theseven lake sediment records. Modeled enrichment inatmospheric deposition from Amos et al.3 over the sameperiod is 18 and ranges from 6 to 19 across uncertaintyscenarios (Figure 3C). Multiple lines of evidence for enrich-ment in atmospheric Hg deposition before the pre-industrial
(1760 to 1880) era from sediment, peat, and modeling allsupport early anthropogenic enrichment of the global Hg cycle.The historical pattern of Hg consumption is well
documented (Figure 1). Associated emissions to the atmos-phere are more uncertain, as illustrated by the range ofproposed historical emission profiles (Figures 1 and S1(Supporting Information)). Hg consumed for large-scale silvermining in colonial South America grew rapidly following thediscovery of the patio amalgamation process in the 1550s.104
Mercury use for amalgamation in large-scale mining peaked inthe late 1800s23,28 at approximately 4600 Mg of Hg year−1,24
which is comparable to contemporary global consumption.58
Variability in the emission factor for historical silver miningand uncertainty about calomel (Hg2Cl2(s)) formation duringthe processing of silver ores are the major contributors touncertainty in pre-1900s atmospheric emissions. The amalga-mation process began by crushing silver ore, combining it withwater, Hg, salt, and other ingredients, and spreading it out on apatio. Humans tread on the mixture to accelerate amalga-mation. The paste was rinsed and runoff was recaptured andreused. Once separated, the amalgam was squeezed throughcloth to further remove excess Hg. The amalgam was fired inkilns, leaving behind pure silver and releasing Hg(0) vapor.More detail on the amalgamation process can be foundelsewhere.26,105
Figure 3. Observational constraints (gray bars) on model sensitivity simulations (symbols). Thick black horizontal lines indicate the observationalmean or best estimate and median ±95% confidence intervals for panel B (see text). For panels B and C, EFs from peat are shown as the darker graybar and lighter gray bar for lake sediments. Table 1 describes each model scenario. For archives, EFpreind = the ratio of mean Hg accumulation ratefrom the extended 20th century maximum (“20Cmax”) relative to pre-industrial (1760 to 1880) and EFalltime is the ratio 20Cmax relative to pre-large-scale mining (3000 BC to 1550 AD). Model EFs are calculated from atmospheric deposition, and 20Cmax is taken as 1950 to 1975 based onpeak emissions in Horowitz et al.20 (Figure 1).
Table 3. Emission Factors Associated with Mercury, Silvera, and Golda mining
type of miningb region time period % emitted to the atmosphere ref
Hg, large scale Huancavelica, Peru colonial 25 Robins and Hagan26
Ag, large scale Potosi, Bolovia colonial 85c Robins105
Ag, large scale colonial 7−34d Guerrero106
Ag and Au, large scale Americas colonial−gold rush 60−65 Nriagu28,108
Ag and Au, large scale global 1850−1880 40e Streets et al.19
Ag and Au, large scale global post-1880 15−39f Streets et al.19
Au, artisanal Amazon modern 65−87e Lacerda104
Au, artisanal global modern 45e AMAP/UNEP122
Hg, artisanal Guizhou, China modern 7−32 Li et al.124
aFor Hg amalgamation methods only. bHg = mercury, Ag = silver, and Au = gold. cLost to the atmosphere in the initial or one of the subsequentfirings. dAssumes 100% recovery of Hg during firing and washing without losses to the environment but does not include reprocessing of recoveredHg. eAssumes no recovery of Hg. fIncludes some recovery of Hg.
Environmental Science & Technology Critical Review
DOI: 10.1021/es5058665Environ. Sci. Technol. 2015, 49, 4036−4047
4041

Estimated atmospheric releases range from 7 to 85% of totalHg consumed (Table 3).26,105−108 The low end of this range(7−34%) favors extensive calomel formation and assumes100% recovery of Hg during washing without losses to theenvironment.106 This is unlikely given the porous ceramicmaterials used in smelting that would release substantialquantities of Hg as vapor105,107,109 and ignores the extensivereprocessing of refining byproducts enriched in silver and Hg,as well as the use of Hg captured in the smelting process.Substantial quantities of Hg are known to leach from wastedcalcines (roasted ores).110−112 Leaching and subsequentvolatilization from mine wastes are currently not accountedfor in loss estimates.3.3. Changes in the Modern Era. Archival observations
and geochemical modeling both provide evidence for peakatmospheric Hg concentrations during the second half of the20th century and declines in more recent decades. Peat recordsindicate Hg accumulation has declined by a factor of 2.2(median; 1.5−9.0; n = 14) from the 20C max to the modernera (post-1990s). Most lake sediments show a more gradualdecrease, or no decrease, in Hg accumulation since the 20Cmax(factor, 0.9; 95% CI, 0.7−1.5; n = 70), which was also foundindependently by Zhang et al.32 (n > 100 cores). As shown inFigure 2, greater temporal integration of Hg accumulatedthrough both watershed influences and in-lake processes canexplain time averaged or slow changes in sediment Hgaccumulation rates in response to changes in atmospheric Hgemissions.Variability in Hg concentrations over the past several decades
recorded in an ice core,62 firn air,6 and snow from centralGreenland113 corroborate the occurrence of a 20Cmax betweenthe 1940s and 1980s and a subsequent decline. Greenland snowcores at Summit revealed Hg concentrations that were 1.7-foldhigher in 1948−1965 than in 1965−1988.113 Interstitial air infirn from Summit, Greenland shows a 2-fold increase in Hg(0)from 1940 to 1970, followed by a 1.8-fold decrease to modernlevels.6 This 20th century peak in anthropogenic emissions isalso accounted for in the global inventory from Horowitz etal.20
3.4. Uncertainty in Anthropogenic Hg Emissions andBiogeochemical Cycling. Here we present six sensitivitysimulations that explore the impact of uncertainty in Hg cyclingand atmospheric emissions on anthropogenic enrichment. Theplausibility of each scenario is assessed against multipleindependent lines of observation. Figure 3 shows the modeloutcomes from the six uncertainty scenarios (Table 1)evaluated against the observational constraints described insection 2.0. Historical emissions scenarios that decrease releasesfrom mining by a factor of 3 or exclude pre-1850 anthropogenicemissions (SI Figure S1) fall below the observationalconstraints for the atmosphere, terrestrial ecosystems, anddeep ocean (Figure 3A,E,F). All-time enrichment in atmos-pheric deposition from these low historical emissions scenariosalso fall outside the 95% confidence intervals of observed peatenrichment factors (“EFalltime” in Figure 3C) and are biased lowrelative to the mean enrichment from lake sediments. Aproposed rationale for decreasing global emissions from earlymining by 50−66% (scenarios 1 and 2, SI Figure S1) is thatmost Hg used for amalgamation ended up as calomel instead ofbeing volatized to the atmosphere.106 The comparison inFigure 3 demonstrates that making this assumption worsensagreement with multiple independent measurements and by
extension suggests the fraction of Hg emitted must have beenlarge and the impact global.Figure 3A shows that increasing geogenic emissions to the
atmosphere to their upper limit (300 Mg year−1) in the modelbiases the present-day atmosphere outside the observationalrange. High geogenic emissions bias the upper oceanconcentrations high with respect to mean concentrations(Figure 3D). Field observations suggest that global Hgemissions from volcanoes are 76 ± 30 Mg year−1,60 suggestingthe additional contribution from Hg enriched soils is 200 Mgyear−1 or less.Recent research on Hg contained in terrestrial ecosys-
tems57,114 suggests greater Hg retention in soils on a globalscale than previously realized (scenario 5, Table 1). Figure 3shows that decreased Hg emissions from soils are consistentwith the range of available observational constraints. IncreasingHg retention in soils also implies a reduction in oceanic Hgaccumulation, which is consistent with lower Hg concentrationsin seawater from recent measurements (see section 2.3). Thescenario for increased oceanic evasion lowers modeled surfaceocean concentrations but results in an atmospheric reservoirand deep ocean that fall outside observational constraints.Similarly, increasing burial of Hg in ocean margins lowersmodeled seawater Hg concentrations in the upper ocean(Figure 3D) but results in a large low bias with respect to theatmosphere, deep ocean, and soil reservoirs (Figure 3A,E,F).
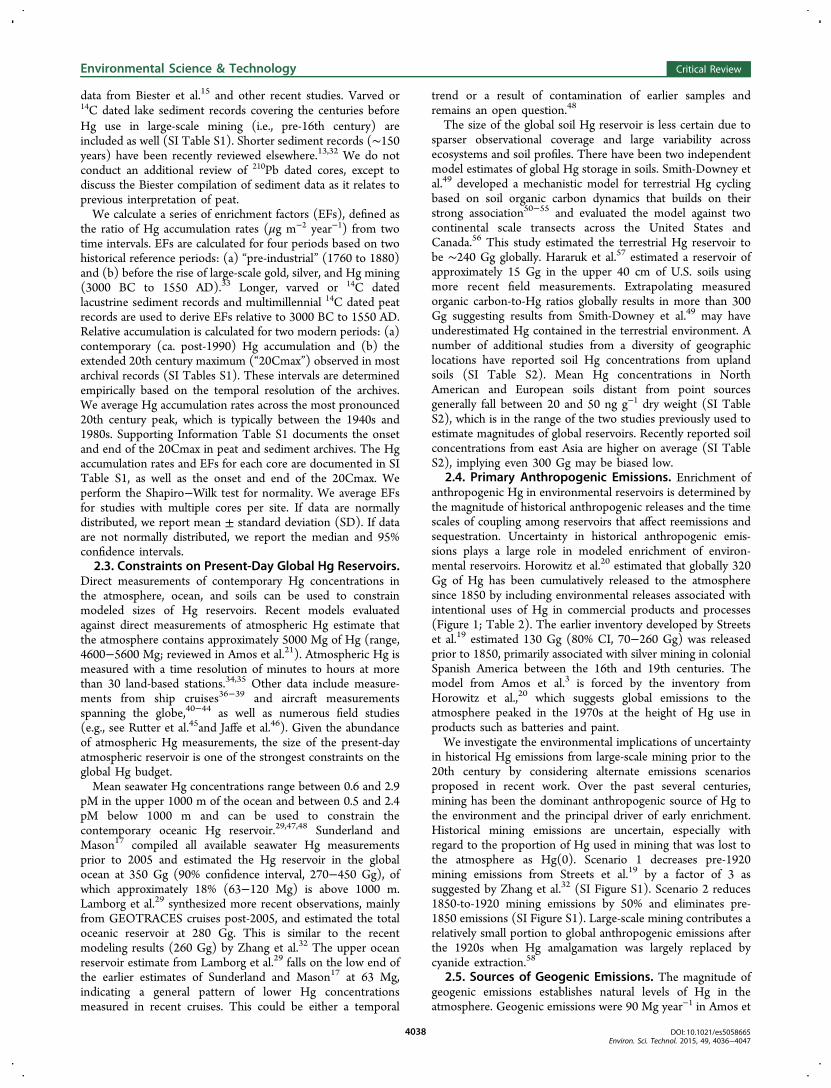
3.5. Implications for Future Responses. Figure 4 showsrelative changes in atmospheric and oceanic Hg concentrationfollowing the elimination of all primary anthropogenic Hgemissions to the atmosphere in 2015 for several modeluncertainty scenarios. Although eliminating emissions inhypothetical, it allows us to directly compare environmentalresponses across sensitivity simulations. Results show relativelylittle difference among base-case model scenario and lower Hgemissions from mining, increased Hg removal through burial,and high air−sea exchange on future responses. Theatmosphere responds immediately under all emissions scenariosto the termination of future emissions, which is consistent withcontemporary measurements showing rapid decreases inatmospheric deposition in response to decreasing emis-sions.115,116 This reflects the relatively short lifetime of Hgagainst removal (0.5−1 year). Removing the full anthropogenicperturbation to the global biogeochemical requires longer timescales as reflected by the growth of the Hg reservoir in the deepocean over the 21st century. The amount of Hg sequestered inocean margin sediments (burial) has the greatest impact onfuture concentration trends across all geochemical reservoirs(Figure 4).Figure 4 also illustrates how the profile (i.e., shape) of past
emissions impacts future trajectories. Amos et al.3 (Figure 4,orange line) is forced by the Horowitz et al.20 emissioninventory, where there is a rapid drop in global anthropogenicemissions after the 1970s and emissions only begin to increaseafter 2000 (Figure 1) due to growth in Asia. Conversely, thescenario labeled “mining decreased 3×” (cyan line) is based onStreets et al.,19 which does not include commercial products,and global emissions have monotonically increased since the1970s. Even though upper ocean concentrations start lower in2016 under the decreased mining emission scenario, therecovery after terminating emissions is notably slower becauseglobal emissions steadily climbed from the 1970s to present.The implication is that the near-term response of upper oceanconcentrations to future regulations is particularly sensitive to
Environmental Science & Technology Critical Review
DOI: 10.1021/es5058665Environ. Sci. Technol. 2015, 49, 4036−4047
4042
the profile (i.e., shape) of anthropogenic emissions in recentdecades.Rapid declines in atmospheric and surface ocean concen-
trations in response to changes in anthropogenic Hg emissionsto the atmosphere are robust to the uncertainties considered inthis analysis. Aggressive reduction of global Hg emissions isneeded to stabilize subsurface and deep oceanic Hg levelsirrespective of the uncertainty in historical emissions andbiogeochemical cycling considered.Using a combination of measurements and modeling, this
analysis shows early mining emissions have had a substantialimpact on global all-time anthropogenic enrichment. Mercuryaccumulation rates in peat increased by a factor of 4.3 (median)from pre-industrial (1760−1880) to the 20Cmax, compared toa factor of 3.0 (median) for lake sediment. Median Hgaccumulation rates in both peat and sediment are a factor of ∼5lower during the precolonial period (3000 BC to 1550 AD)than during the pre-industrial period (1760 to 1880), which isin agreement with model simulations that have also beenconstrained by contemporary measurements. Importantresearch directions for better anticipating the impacts of legacyanthropogenic Hg in coming decades include improvedquantification of the retention of atmospherically depositedHg in soils, disturbance of Hg buried in coastal sediment, andair−sea exchange.
■ ASSOCIATED CONTENT*S Supporting InformationTables listing a summary of Hg accumulation rates for each lakesediment and peat record used in this analysis and empiricalranges of Hg concentrations in soils, terrestrial Hg(0) evasion,and ocean Hg(0) evasion, figure showing plot of alternatehistorical emission scenarios, and text giving accompanyingreferences. This material is available free of charge via theInternet at http://pubs.acs.org.
■ AUTHOR INFORMATIONCorresponding Author*Phone: +1 (617) 496-5348; fax: +1 (617) 495-4551; e-mail:[email protected].
NotesThe authors declare no competing financial interest.
■ ACKNOWLEDGMENTSWe thank the Editor and anonymous reviewers for theirthoughtful comments. This manuscript was initiated by thespecial session entitled “Defining Natural and AnthropogenicMercury” convened at the 11th International Conference onMercury as a Global Pollutant in Edinburgh, Scotland in July,2013. Financial support for work at Harvard was from the U.S.Environmental Protection Agency Contract No. EP-11-H-0013646. J.E.S. acknowledges funding from the EuropeanResearch Council (Grant ERC-2010-StG_20091028). H.M.A.acknowledges use of NCL software version 6.1.2 (http://www.ncl.ucar.edu/) to create Figures 1−4 and the table of contents/abstract artwork.
■ REFERENCES(1) Mason, R. P.; Fitzgerald, W. F.; Morel, F. M. M. Thebiogeochemical cycling of element mercuryAnthropogenic influen-ces. Geochim. Cosmochim. Acta 1994, 58 (15), 3191−3198.(2) Andren, M. O.; Nriagu, J. O. The global cycle of mercury; Elsevier:Amsterdam, 1979.(3) Amos, H. M.; Jacob, D. J.; Kocman, D.; Horowitz, H. M.; Zhang,Y.; Dutkiewicz, S.; Horvat, M.; Corbitt, E. S.; Krabbenhoft, D. P.;Sunderland, E. M. Global biogeochemical implications of mercurydischarges from rivers and sediment burial. Environ. Sci. Technol. 2014,48 (16), 9514−9522.(4) Dietz, R.; Outridge, P. M.; Hobson, K. A. Anthropogeniccontributions to mercury levels in present-day Arctic animalsAreview. Sci. Total Environ. 2009, 407 (24), 6120−6131.(5) Swain, E. B.; Engstrom, D. R.; Brigham, M. E.; Henning, T. A.;Brezonik, P. L. Increasing rates of atmospheric mercury deposition inmidcontinental North America. Science 1992, 257 (5071), 784−787.(6) Fain, X.; Ferrari, C. P.; Dommergue, A.; Albert, M. R.; Battle, M.;Severinghaus, J.; Arnaud, L.; Barnola, J. M.; Cairns, W.; Barbante, C.;Boutron, C. Polar firn air reveals large-scale impact of anthropogenicmercury emissions during the 1970s. Proc. Natl. Acad. Sci. U. S. A.2009, 106 (38), 16114−16119.(7) Givelet, N.; Roos-Barraclough, F.; Shotyk, W. Predominantanthropogenic sources and rates of atmospheric mercury accumulationin southern Ontario recorded by peat cores from three bogs:Comparison with natural ″background’’ values (past 8000 years). J.Environ. Monit. 2003, 5 (6), 935−949.(8) Vandal, G. M.; Fitzgerald, W. F.; Boutron, C. F.; Candelone, J. P.Mercury in ancient ice and recent snow from the Antarctic. Springer-Verlag: Berlin, 1995; Vol. 30, p 401−415.(9) Goodsite, M. E.; Outridge, P. M.; Christensen, J. H.; Dastoor, A.;Muir, D.; Travnikov, O.; Wilson, S. How well do environmentalarchives of atmospheric mercury deposition in the Arctic reproduce
Figure 4. Modeled relative changes in Hg concentrations in theatmosphere and ocean following termination of all primaryanthropogenic emissions in 2016. Results are normalized to 2015and expressed as percent (%) change in concentrations. Relativeresponses of the atmosphere (A), upper ocean (B), and deep ocean(D) are shown for the base-case simulation developed by Amos et al.3
and scenarios that increase oceanic mercury evasion by 30%, decreasemining emissions by a factor of 3, and increase sequestration of Hg inocean margin sediments from 70% to 90% as described in Table 1.
Environmental Science & Technology Critical Review
DOI: 10.1021/es5058665Environ. Sci. Technol. 2015, 49, 4036−4047
4043
rates and trends depicted by atmospheric models and measurements?Sci. Total Environ. 2013, 452, 196−207.(10) Outridge, P. M.; Rausch, N.; Percival, J. B.; Shotyk, W.;McNeely, R. Comparison of mercury and zinc profiles in peat and lakesediment archives with historical changes in emissions from the FlinFlon metal smelter, Manitoba, Canada. Sci. Total Environ. 2011, 409(3), 548−563.(11) Sunderland, E. M.; Cohen, M. D.; Selin, N. E.; Chmura, G. L.Reconciling models and measurements to assess trends in atmosphericmercury deposition. Environ. Pollut. 2008, 156 (2), 526−535.(12) Lindberg, S.; Bullock, R.; Ebinghaus, R.; Engstrom, D.; Feng, X.;Fitzgerald, W.; Pirrone, N.; Prestbo, E.; Seigneur, C. A synthesis ofprogress and uncertainties in attributing the sources of mercurydeposition. Ambio 2007, 36, 19−32.(13) Engstrom, D. R.; Fitzgerald, W. F.; Cooke, C. A.; Lamborg, C.H.; Drevnick, P. E.; Swain, E. B.; Balogh, S. J.; Balcom, P. H.Atmospheric Hg emissions from preindustrial gold and silverextraction in the Americas: A reevaluation from lake-sedimentarchives. Environ. Sci. Technol. 2014, 48 (12), 6533−6543.(14) Drevnick, P. E.; Yang, H. D.; Lamborg, C. H.; Rose, N. L. Netatmospheric mercury deposition to Svalbard: Estimates from lacustrinesediments. Atmos. Environ. 2012, 59, 509−513.(15) Biester, H.; Bindler, R.; Martinez-Cortizas, A.; Engstrom, D. R.Modeling the past atmospheric deposition of mercury using naturalarchives. Environ. Sci. Technol. 2007, 41 (14), 4851−4860.(16) Mason, R. P.; Sheu, G. R. Role of the ocean in the globalmercury cycle. Global Biogeochem. Cycles 2002, 16 (4), No. 1093.(17) Sunderland, E. M.; Mason, R. P. Human impacts on open oceanmercury concentrations. Global Biogeochem. Cycles 2007, 21 (4),No. GB4022.(18) Selin, N. E.; Jacob, D. J.; Yantosca, R. M.; Strode, S.; Jaegle, L.;Sunderland, E. M. Global 3-D land-ocean-atmosphere model formercury: Present-day versus preindustrial cycles and anthropogenicenrichment factors for deposition. Global Biogeochem. Cycles 2008, 22(3), No. GB3099.(19) Streets, D. G.; Devane, M. K.; Lu, Z. F.; Bond, T. C.;Sunderland, E. M.; Jacob, D. J. All-time releases of mercury to theatmosphere from human activities. Environ. Sci. Technol. 2011, 45 (24),10485−10491.(20) Horowitz, H. M.; Jacob, D. J.; Amos, H. M.; Streets, D. G.;Sunderland, E. M. Historical mercury releases from commercialproducts: Global environmental implications. Environ. Sci. Technol.2014, 48 (17), 10242−10250.(21) Amos, H. M.; Jacob, D. J.; Streets, D. G.; Sunderland, E. M.Legacy impacts of all-time anthropogenic emissions on the globalmercury cycle. Global Biogeochem. Cycles 2013, 27 (2), 410−421.(22) Strode, S.; Jaegle, L.; Selin, N. E. Impact of mercury emissionsfrom historic gold and silver mining: Global modeling. Atmos. Environ.2009, 43 (12), 2012−2017.(23) Pirrone, N.; Allegrini, I.; Keeler, G. J.; Nriagu, J. O.; Rossmann,R.; Robbins, J. A. Historical atmospheric mercury emissions anddepositions in North America compared to mercury accumulations insedimentary records. Atmos. Environ. 1998, 32 (5), 929−940.(24) Hylander, L. D.; Meili, M. 500 years of mercury production:global annual inventory by region until 2000 and associated emissions.Sci. Total Environ. 2003, 304 (1−3), 13−27.(25) Hudson, R. J. M.; Gherini, S. A.; Fitzgerald, W. F.; Porcella, D.B. Anthropogenic influences on the global mercury cycleA model-based analysis. Water, Air, Soil Pollut. 1995, 80 (1−4), 265−272.(26) Robins, N. A.; Hagan, N. A. Mercury production and use incolonial andean silver production: Emissions and health implications.Environ. Health Perspect. 2012, 120 (5), 627−631.(27) Camargo, J. A. Contribution of Spanish-American silver mines(1570−1820) to the present high mercury concentrations in the globalenvironment: A review. Chemosphere 2002, 48 (1), 51−57.(28) Nriagu, J. O. Mercury pollution from the past mining of goldand silver in the Americas. Sci. Total Environ. 1994, 149 (3), 167−181.(29) Lamborg, C. H.; Hammerschmidt, C. R.; Bowman, K. L.; Swarr,G. J.; Munson, K. M.; Ohnemus, D. C.; Lam, P. J.; Heimburger, L. E.;
Rijkenberg, M. J. A.; Saito, M. A. A global ocean inventory ofanthropogenic mercury based on water column measurements. Nature2014, 512 (7512), 65−+.(30) Cooke, C. A.; Hintelmann, H.; Ague, J. J.; Burger, R.; Biester,H.; Sachs, J. P.; Engstrom, D. R. Use and Legacy of mercury in theAndes. Environ. Sci. Technol. 2013, 47 (9), 4181−4188.(31) Beal, S. A.; Jackson, B. P.; Kelly, M. A.; Stroup, J. S.; Landis, J. D.Effects of historical and modern mining on mercury deposition inSoutheastern Peru. Environ. Sci. Technol. 2013, 47 (22), 12715−12720.(32) Zhang, Y.; Jaegle, L.; Thompson, L.; Streets, D. Six centuries ofchanging oceanic mercury. Global Biogeochem. Cycles 2014,No. 2014GB004939.(33) Goldwater, L. Mercury: A history of quicksilver. York Press:Baltimore, MD, USA, 1972.(34) Gay, D. A.; Schmeltz, D.; Prestbo, E.; Olson, M.; Sharac, T.;Tordon, R. The Atmospheric Mercury Network: measurement andinitial examination of an ongoing atmospheric mercury record acrossNorth America. Atmos. Chem. Phys. 2013, 13 (22), 11339−11349.(35) GMOS. Global Mercury Observing System (GMOS): Mid-termResults, 2014.(36) Soerensen, A. L.; Mason, R. P.; Balcom, P. H.; Sunderland, E.M. Drivers of surface ocean mercury concentrations and air−seaexchange in the west Atlantic Ocean. Environ. Sci. Technol. 2013, 47(14), 7757−7765.(37) Lamborg, C. H.; Rolfhus, K. R.; Fitzgerald, W. F.; Kim, G. Theatmospheric cycling and air-sea exchange of mercury species in theSouth and equatorial Atlantic Ocean. Deep Sea Res., Part II 1999, 46(5), 957−977.(38) Temme, C.; Slemr, F.; Ebinghaus, R.; Einax, J. W. Distributionof mercury over the Atlantic Ocean in 1996 and 1999−2001. Atmos.Environ. 2003, 37 (14), 1889−1897.(39) Laurier, F. J. G.; Mason, R. P.; Whalin, L.; Kato, S. Reactivegaseous mercury formation in the North Pacific Ocean’s marineboundary layer: A potential role of halogen chemistry. J. Geophys. Res.:Atmos. 2003, 108 (D17), No. 12.(40) Holmes, C. D.; Jacob, D. J.; Corbitt, E. S.; Mao, J.; Yang, X.;Talbot, R.; Slemr, F. Global atmospheric model for mercury includingoxidation by bromine atoms. Atmos. Chem. Phys. 2010, 10, 12037−12057.(41) Lyman, S. N.; Jaffe, D. A. Formation and fate of oxidizedmercury in the upper troposphere and lower stratosphere. Nat. Geosci.2012, 5 (2), 114−117.(42) Brenninkmeijer, C. A. M.; Crutzen, P.; Boumard, F.; Dauer, T.;Dix, B.; Ebinghaus, R.; Filippi, D.; Fischer, H.; Franke, H.; Friess, U.;Heintzenberg, J.; Helleis, F.; Hermann, M.; Kock, H. H.; Koeppel, C.;Lelieveld, J.; Leuenberger, M.; Martinsson, B. G.; Miemczyk, S.;Moret, H. P.; Nguyen, H. N.; Nyfeler, P.; Oram, D.; O’Sullivan, D.;Penkett, S.; Platt, U.; Pupek, M.; Ramonet, M.; Randa, B.; Reichelt,M.; Rhee, T. S.; Rohwer, J.; Rosenfeld, K.; Scharffe, D.; Schlager, H.;Schumann, U.; Slemr, F.; Sprung, D.; Stock, P.; Thaler, R.; Valentino,F.; van Velthoven, P.; Waibel, A.; Wandel, A.; Waschitschek, K.;Wiedensohler, A.; Xueref-Remy, I.; Zahn, A.; Zech, U.; Ziereis, H.Civil aircraft for the regular investigation of the atmosphere based onan instrumented container: The new CARIBIC system. Atmos. Chem.Phys. 2007, 7 (18), 4953−4976.(43) Slemr, F.; Weigelt, A.; Ebinghaus, R.; Brenninkmeijer, C.; Baker,A.; Schuck, T.; Rauthe-Schoch, A.; Riede, H.; Leedham, E.; Hermann,M.; van Velthoven, P.; Oram, D.; O’Sullivan, D.; Dyroff, C.; Zahn, A.;Ziereis, H. Mercury plumes in the global upper troposphere observedduring flights with the CARIBIC Observatory from May 2005 untilJune 2013. Atmosphere 2014, 5 (2), 342−369.(44) Swartzendruber, P. C.; Chand, D.; Jaffe, D. A.; Smith, J.;Reidmiller, D.; Gratz, L.; Keeler, J.; Strode, S.; Jaegle, L.; Talbot, R.Vertical distribution of mercury, CO, ozone, and aerosol scatteringcoefficient in the Pacific Northwest during the spring 2006 INTEX-Bcampaign. J. Geophys. Res.: Atmos. 2008, 113 (D10), No. 15.(45) Rutter, A. P.; Schauer, J. J.; Lough, G. C.; Snyder, D. C.; Kolb,C. J.; Von Klooster, S.; Rudolf, T.; Manolopoulos, H.; Olson, M. L. A
Environmental Science & Technology Critical Review
DOI: 10.1021/es5058665Environ. Sci. Technol. 2015, 49, 4036−4047
4044
comparison of speciated atmospheric mercury at an urban center andan upwind rural location. J. Environ. Monit. 2008, 10 (1), 102−108.(46) Jaffe, D.; Prestbo, E.; Swartzendruber, P.; Weiss-Penzias, P.;Kato, S.; Takami, A.; Hatakeyama, S.; Kajii, Y. Export of atmosphericmercury from Asia. Atmos. Environ. 2005, 39 (17), 3029−3038.(47) Bowman, K. L.; Hammerschmidt, C. R.; Lamborg, C. H.; Swarr,G. Mercury in the North Atlantic Ocean: The U.S. GEOTRACESzonal and meridional sections. Deep Sea Res., Part II 2014, in press.(48) Mason, R. P.; Choi, A. L.; Fitzgerald, W. F.; Hammerschmidt, C.R.; Lamborg, C. H.; Soerensen, A. L.; Sunderland, E. M. Mercurybiogeochemical cycling in the ocean and policy implications. Environ.Res. 2012, 119, 101−117.(49) Smith-Downey, N. V.; Sunderland, E. M.; Jacob, D. J.Anthropogenic impacts on global storage and emissions of mercuryfrom terrestrial soils: Insights from a new global model. J. Geophys.Res.: Biogeosci. 2010, 115, No. G03008.(50) Grigal, D. F. Mercury sequestration in forests and peatlands: Areview. J. Environ. Qual. 2003, 32 (2), 393−405.(51) Obrist, D.; Johnson, D.; Lindberg, S.; Luo, Y.; Hararuk, O.;Bracho, R.; Battles, J.; Dail, D.; Edmonds, R.; Monson, R.; Ollinger, S.;Pallardy, S.; Pregitzer, K.; Todd, D. Mercury distribution across 14U.S. forests. Part I: Spatial patterns of concentrations in biomass, litter,and soils. Environ. Sci. Technol. 2011, 45, 3974−3981.(52) Meili, M. The coupling of mercury and organic matter in thebiogeochemical cycleTowards a mechanistic model for the borealforest zone. Water, Air, Soil Pollut. 1991, 56, 333−347.(53) Potter, C. S.; Randerson, J. T.; Field, C. B.; Matson, P. A.;Vitousek, P. M.; Mooney, H. A.; Klooster, S. A. Terrestrial ecosystemproductionA process model based on global satellite and surfacedata. Global Biogeochem. Cycles 1993, 7 (4), 811−841.(54) van der Werf, G. R.; Randerson, J. T.; Collatz, G. J.; Giglio, L.Carbon emissions from fires in tropical and subtropical ecosystems.Global Change Biol. 2003, 9 (4), 547−562.(55) van der Werf, G. R.; Randerson, J. T.; Giglio, L.; Collatz, G. J.;Kasibhatla, P. S.; Arellano, A. F. Interannual variability in globalbiomass burning emissions from 1997 to 2004. Atmos. Chem. Phys.2006, 6, 3423−3441.(56) Smith, D. B.; Cannon, W. F.; Woodruff, L. G.; Garrett, R. G.;Klassen, R.; Kilburn, J. E.; Horton, J. D.; King, H. D.; Goldhaber, M.B.; Morrison, J. M. Major- and Trace-Element Concentrations in Soilsfrom Two Continental-Scale Transects of the United States and Canada,USGS Open File Report2005-1253; U.S. Geological Survey: Reston,VA, USA, 2005.(57) Hararuk, O.; Obrist, D.; Luo, Y. Modeling the sensitivity of soilmercury storage to climate-induced changes in soil carbon pools.Biogeosciences 2013, 10, 2393−2407.(58) Hylander, L. D.; Meili, M. The rise and fall of mercury:Converting a resource to refuse after 500 years of mining andpollution. Crit. Rev. Environ. Sci. Technol. 2005, 35 (1), 1−36.(59) Bagnato, E.; Aiuppa, A.; Parello, F.; Allard, P.; Shinohara, H.;Liuzzo, M.; Giudice, G. New clues on the contribution of Earth’svolcanism to the global mercury cycle. Bull. Volcanol. 2011, 73 (5),497−510.(60) Bagnato, E.; Tamburello, G.; Avard, G.; Martinez-Cruz, M.;Enrico, M.; Fu, X.; Sprovieri, M.; Sonke, J. E. Mercury fluxes fromvolcanic and geothermal sources: An update In Volatiles and Their Rolein Petrogenetic and Eruptive Processes at Subduction Zones, TheGeological Society of London Special Publication; Zellmer, G.,Edmonds, M., Straub, S., Eds.; The Geological Society of London:London, 2014; Vol. 410.(61) Pyle, D. M.; Mather, T. A. The importance of volcanic emissionsfor the global atmospheric mercury cycle. Atmos. Environ. 2003, 37(36), 5115−5124.(62) Schuster, P. F.; Krabbenhoft, D. P.; Naftz, D. L.; Cecil, L. D.;Olson, M. L.; Dewild, J. F.; Susong, D. D.; Green, J. R.; Abbott, M. L.Atmospheric mercury deposition during the last 270 years: A glacialice core record of natural and anthropogenic sources. Environ. Sci.Technol. 2002, 36 (11), 2303−2310.
(63) Lamborg, C. H.; Von Damm, K. L.; Fitzgerald, W. F.;Hammerschmidt, C. R.; Zierenberg, R. Mercury and monomethylmer-cury in fluids from Sea Cliff submarine hydrothermal field, GordaRidge. Geophys. Res. Lett. 2006, 33 (17), 4.(64) Gustin, M. S.; Lindberg, S. E.; Weisberg, P. J. An update on thenatural sources and sinks of atmospheric mercury. Appl. Geochem.2008, 23 (3), 482−493.(65) Soerensen, A. L.; Sunderland, E. M.; Holmes, C. D.; Jacob, D. J.;Yantosca, R. M.; Skov, H.; Christensen, J. H.; Strode, S. A.; Mason, R.P. An improved global model for air−sea exchange of mercury: Highconcentrations over the North Atlantic. Environ. Sci. Technol. 2010, 44(22), 8574−8580.(66) Kuss, J.; Zulicke, C.; Pohl, C.; Schneider, B. Atlantic mercuryemission determined from continuous analysis of the elementalmercury sea-air concentration difference within transects between 50degrees N and 50 degrees S. Global Biogeochem. Cycles 2011, 25, No. 9.(67) Andersson, M. E.; Sommar, J.; Gardfeldt, K.; Lindqvist, O.Enhanced concentrations of dissolved gaseous mercury in the surfacewaters of the Arctic Ocean. Mar. Chem. 2008, 110 (3−4), 190−194.(68) Soerensen, A. L.; Mason, R. P.; Balcom, P. H.; Jacob, D. J.;Zhang, Y.; Kuss, J.; Sunderland, E. M. Elemental mercuryconcentrations and fluxes in the tropical atmosphere and ocean.Environ. Sci. Technol. 2014, 48 (19), 11312−11319.(69) Tseng, C. M.; Lamborg, C. H.; Hsu, S. C. A unique seasonalpattern in dissolved elemental mercury in the South China Sea, atropical and monsoon-dominated marginal sea. Geophys. Res. Lett.2013, 40 (1), 167−172.(70) Andersson, M. E.; Gardfeldt, K.; Wangberg, I.; Sprovieri, F.;Pirrone, N.; Lindqvist, O. Seasonal and daily variation of mercuryevasion at coastal and off shore sites from the Mediterranean Sea. Mar.Chem. 2007, 104 (3−4), 214−226.(71) Fantozzi, L.; Ferrara, R.; Frontini, F. P.; Dini, F. Factorsinfluencing the daily behaviour of dissolved gaseous mercuryconcentration in the Mediterranean Sea. Mar. Chem. 2007, 107 (1),4−12.(72) Bagnato, E.; Sproveri, M.; Barra, M.; Bitetto, M.; Bonsignore,M.; Calabrese, S.; Di Stefano, V.; Oliveri, E.; Parello, F.; Mazzola, S.The sea-air exchange of mercury (Hg) in the marine boundary layer ofthe Augusta basin (southern Italy): Concentrations and evasion flux.Chemosphere 2013, 93 (9), 2024−2032.(73) Whalin, L.; Kim, E. H.; Mason, R. Factors influencing theoxidation, reduction, methylation and demethylation of mercuryspecies in coastal waters. Mar. Chem. 2007, 107 (3), 278−294.(74) Rolfhus, K. R.; Fitzgerald, W. F. Mechanisms and temporalvariability of dissolved gaseous mercury production in coastal seawater.Mar. Chem. 2004, 90 (1−4), 125−136.(75) Amyot, M.; Gill, G. A.; Morel, F. M. M. Production and loss ofdissolved gaseous mercury in coastal seawater. Environ. Sci. Technol.1997, 31 (12), 3606−3611.(76) Qureshi, A.; O’Driscoll, N. J.; MacLeod, M.; Neuhold, Y. M.;Hungerbuhler, K. Photoreactions of mercury in surface ocean water:Gross reaction kinetics and possible pathways. Environ. Sci. Technol.2010, 44 (2), 644−649.(77) Lalonde, J. D.; Amyot, M.; Kraepiel, A. M. L.; Morel, F. M. M.Photooxidation of Hg(0) in artificial and natural waters. Environ. Sci.Technol. 2001, 35 (7), 1367−1372.(78) Carpi, A.; Lindberg, S. E. Sunlight-mediated emission ofelemental mercury from soil amended with municipal sewage sludge.Environ. Sci. Technol. 1997, 31 (7), 2085−2091.(79) Allard, B.; Arsenie, I. Abiotic reduction of mercury by humicsubstances in aquatic systemAn important process for the mercurycycle. Water, Air, Soil Pollut. 1991, 56, 457−464.(80) Amyot, M.; Mierle, G.; Lean, D. R. S.; McQueen, D. J. Sunlight-induced formation of dissolved gaseous mercury in lake waters.Environ. Sci. Technol. 1994, 28 (13), 2366−2371.(81) Hines, N. A.; Brezonik, P. L. Mercury dynamics in a smallNorthern Minnesota lake: Water to air exchange and photoreactionsof mercury. Mar. Chem. 2004, 90 (1−4), 137−149.
Environmental Science & Technology Critical Review
DOI: 10.1021/es5058665Environ. Sci. Technol. 2015, 49, 4036−4047
4045

(82) Hines, N. A.; Brezonik, P. L. Mercury inputs and outputs at asmall lake in northern Minnesota. Biogeochemistry 2007, 84 (3), 265−284.(83) Graydon, J. A.; St. Louis, V. L.; Lindberg, S. E.; Sandilands, K.A.; Rudd, J. W. M.; Kelly, C. A.; Harris, R.; Tate, M. T.; Krabbenhoft,D. P.; Emmerton, C. A.; Asmath, H.; Richardson, M. The role ofterrestrial vegetation in atmospheric Hg deposition: Pools and fluxes ofspike and ambient Hg from the METAALICUS experiment. GlobalBiogeochem. Cycles 2012, 2610.1029/2011GB004031.(84) Obrist, D.; Pokharel, A. K.; Moore, C. Vertical profilemeasurements of soil air suggest immobilization of gaseous elementalmercury in mineral soil. Environ. Sci. Technol. 2014, 48 (4), 2242−2252.(85) Cossa, D.; Coquery, M.; Gobeil, C.; Martin, J. M. Mercury fluxesat the ocean margins. In Global and Regional Mercury Cycles: Sources,Fluxes and Mass Balances; Baeyens, W., Ebinghaus, R.; Vasiliev, O.,Eds.; Springer: Dordrecht, The Netherlands, 1996; Vol. 21, pp 229−247.(86) Chester, R., The transport of material to the oceans: Relativeflux magnitudes. In Marine Geochemistry, 2nd ed.; Chester, R., Ed.;Blackwell Science: Oxford, U.K., 2003; pp 98−134.(87) Mason, R. P.; Lawrence, A. L. Concentration, distribution, andbioavailability of mercury and methylmercury in sediments ofBaltimore Harbor and Chesapeake Bay, Maryland, USA. Environ.Toxicol. Chem. 1999, 18 (11), 2438−2447.(88) Balcom, P. H.; Hammerschmidt, C. R.; Fitzgerald, W. F.;Lamborg, C. H.; O’Connor, J. S. Seasonal distributions and cycling ofmercury and methylmercury in the waters of New York/New Jerseyharbor estuary. Mar. Chem. 2008, 109 (1−2), 1−17.(89) Balcom, P. H.; Fitzgerald, W. F.; Vandal, G. M.; Lamborg, C. H.;Rolfllus, K. R.; Langer, C. S.; Hammerschmidt, C. R. Mercury sourcesand cycling in the Connecticut River and Long Island Sound. Mar.Chem. 2004, 90 (1−4), 53−74.(90) Sunderland, E. M.; Dalziel, J.; Heyes, A.; Branfireun, B. A.;Krabbenhoft, D. P.; Gobas, F. Response of a macrotidal estuary tochanges in anthropogenic mercury loading between 1850 and 2000.Environ. Sci. Technol. 2010, 44 (5), 1698−1704.(91) Macleod, M.; McKone, T. E.; Mackay, D. Mass balance formercury in the San Francisco Bay Area. Environ. Sci. Technol. 2005, 39(17), 6721−6729.(92) Balcom, P. H.; Fitzgerald, W. F.; Mason, R. P. Synthesis andAssessment of Heavy Metal Contamination in the Hudson River and NewYork/New Jersey Harbor Estuary; Hudson River Foundation: NewYork, 2010.(93) Hammerschmidt, C. R.; Fitzgerald, W. F. Methylmercurycycling in sediments on the continental shelf of southern NewEngland. Geochim. Cosmochim. Acta 2006, 70 (4), 918−930.(94) Harris, R.; Pollman, C.; Hutchinson, D.; Landing, W.; Axelrad,D.; Morey, S. L.; Dukhovskoy, D.; Vijayaraghavan, K. A screeningmodel analysis of mercury sources, fate and bioaccumulation in theGulf of Mexico. Environ. Res. 2012, 119, 53−63.(95) Hollweg, T. A.; Gilmour, C. C.; Mason, R. P. Mercury andmethylmercury cycling in sediments of the mid-Atlantic continentalshelf and slope. Limnol. Oceanogr. 2010, 55 (6), 2703−2722.(96) Shotyk, W.; Goodsite, M. E.; Roos-Barraclough, F.; Frei, R.;Heinemeier, J.; Asmund, G.; Lohse, C.; Hansen, T. S. Anthropogeniccontributions to atmospheric Hg, Pb and As accumulation recorded bypeat cores from southern Greenland and Denmark dated using the14C ″bomb pulse curve″. Geochim. Cosmochim. Acta 2003, 67 (21),3991−4011.(97) Nriagu, J. O.; Wong, H. K. T.; Lawson, G.; Daniel, P. Saturationof ecosystems with toxic metals in Sudbury basin, Ontario, Canada. Sci.Total Environ. 1998, 223 (2−3), 99−117.(98) Munthe, J.; Hultberg, H. Mercury and methylmercury in runofffrom a forested catchmentConcentrations, fluxes, and their responseto manipulations. Water, Air, Soil Pollut.: Focus 2004, 4 (2−3), 607−618.(99) Cooke, C. A.; Hobbs, W. O.; Michelutti, N.; Wolfe, A. P.Reliance on Pb-210 chronology can compromise the inference of
preindustrial Hg flux to lake sediments. Environ. Sci. Technol. 2010, 44(6), 1998−2003.(100) Abril, J. M.; Brunskill, G. J. Evidence that excess Pb-210 fluxvaries with sediment accumulation rate and implications for datingrecent sediments. J. Paleolimnol. 2014, 52 (3), 121−137.(101) Baskaran, M.; Nix, J.; Kuyper, C.; Karunakara, N. Problemswith the dating of sediment core using excess Pb-210 in a freshwatersystem impacted by large scale watershed changes. J. Environ. Radioact.2014, 138, 355−363.(102) Smith, J. N. Why should we believe Pb-210 sedimentgeochronologies? J. Environ. Radioact. 2001, 55 (2), 121−123.(103) Hancock, G.; Edgington, D. N.; Robbins, J. A.; Smith, J. N.;Bunskill, G.; Pfitzner, K. Workshop on radiological techniques insedimentation studies: Methods and applications. In Proceedings of theSouth Pacific Environmental Radioactivity Association, Paris; Fernandez,J. M., Fiches, R., Eds.; IRD Editions: Paris, France, 2002; p 423.(104) Lacerda, L. D. Global mercury emissions from gold and silvermining. Water, Air, Soil Pollut. 1997, 97 (3−4), 209−221.(105) Robins, N. Mercury, mining, and empire: The human andecologicial costs of colonial silver mining in the Andes; Indiana UniversityPress: Bloomington, IN, USA, 2011.(106) Guerrero, S. Chemistry as a tool for historical research:Indentifying paths of historical mercury pollution in the Hispanic NewWorld. Bull. Hist. Chem. 2012, 37 (2), 61−70.(107) Hagan, N.; Robins, N.; Hsu-Kim, H.; Halabi, S.; Morris, M.;Woodall, G.; Zhang, T.; Bacon, A.; Richter, D. D.; Vandenberg, J.Estimating historical atmospheric mercury concentrations from silvermining and their legacies in present-day surface soil in Potosi, Bolivia.Atmos. Environ. 2011, 45 (40), 7619−7626.(108) Nriagu, J. O. Legacy of mercury pollution. Nature 1993, 363(6430), 589−589.(109) Cooke, C. A.; Balcom, P. H.; Kerfoot, C.; Abbott, M. B.; Wolfe,A. P. Pre-Colombian mercury pollution associated with the smelting ofArgentiferous ores in the Bolivian Andes. Ambio 2011, 40 (1), 18−25.(110) Kim, C. S.; Rytuba, J. J.; Brown, G. E., Jr Geological andanthropogenic factors influencing mercury speciation in mine wastes:An EXAFS spectroscopy study. Appl. Geochem. 2004, 19 (3), 379−393.(111) Gray, J. E.; Crock, J. G.; Fey, D. L. Environmentalgeochemistry of abandoned mercury mines in West-Central Nevada,USA. Appl. Geochem. 2002, 17 (8), 1069−1079.(112) Maramba, N. P. C.; Reyes, J. P.; Francisco-Rivera, A. T.;Panganiban, L. C. R.; Dioquino, C.; Dando, N.; Timbang, R.; Akagi,H.; Castillo, M. T.; Quitoriano, C.; Afuang, M.; Matsuyama, A.;Eguchi, T.; Fuchigami, Y. Environmental and human exposureassessment monitoring of communities near an abandoned mercurymine in the Philippines: A toxic legacy. J. Environ. Manage. 2006, 81(2), 135−145.(113) Boutron, C. F.; Vandal, G. M.; Fitzgerald, W. F.; Ferrari, C. P.A forty year record of mercury in central Greenland snow. Geophys.Res. Lett. 1998, 25 (17), 3315−3318.(114) Obrist, D.; Johnson, D. W.; Lindberg, S. E.; Luo, Y.; Hararuk,O.; Bracho, R.; Battles, J. J.; Dail, D. B.; Edmonds, R. L.; Monson, R.K.; Ollinger, S. V.; Pallardy, S. G.; Pregitzer, K. S.; Todd, D. E.Mercury distribution across 14 U.S. forests. Part I: Spatial patterns ofconcentrations in biomass, litter, and soils. Environ. Sci. Technol. 2011,45 (9), 3974−3981.(115) Eckley, C. S.; Parsons, M. T.; Mintz, R.; Lapalme, M.; Mazur,M.; Tordon, R.; Elleman, R.; Graydon, J. A.; Blanchard, P.; St. Louis,V. Impact of closing Canada’s largest point-source of mercuryemissions on local atmospheric mercury concentrations. Environ. Sci.Technol. 2013, 47 (18), 10339−10348.(116) Iverfeldt, A.; Munthe, J.; Brosset, C.; Pacyna, J. Long-termchanges in concentration and deposition of atmospheric mercury overScandinavia. Water, Air, Soil Pollut. 1995, 80 (1−4), 227−233.(117) Mather, T. A.; Witt, M. L. I.; Pyle, D. M.; Quayle, B. M.;Aiuppa, A.; Bagnato, E.; Martin, R. S.; Sims, K. W. W.; Edmonds, M.;Sutton, A. J.; Ilyinskaya, E. Halogens and trace metal emissions from
Environmental Science & Technology Critical Review
DOI: 10.1021/es5058665Environ. Sci. Technol. 2015, 49, 4036−4047
4046

the ongoing 2008 summit eruption of Kilauea volcano, Hawaii.Geochim. Cosmochim. Acta 2012, 83, 292−323.(118) Varekamp, J. C.; Buseck, P. R. Global mercury flux fromvolcanic and geothermal sources. Appl. Geochem. 1986, 1 (1), 65−73.(119) Wilson, S.; Munthe, K.; Sundseth, K.; Kindbom, K.; Maxson,P.; Pacyna, P.; Steenhuisen, F. Updating historical global inventories ofanthropogenic mercury emissions to air; Arctic Monitoring andAssessment Programme (AMAP): Oslo, Norway, 2010; p 14.(120) Pacyna, E. G.; Pacyna, J. M.; Sundseth, K.; Munthe, J.;Kindbom, K.; Wilson, S.; Steenhuisen, F.; Maxson, P. Global emissionof mercury to the atmosphere from anthropogenic sources in 2005 andprojections to 2020. Atmos. Environ. 2010, 44 (20), 2487−2499.(121) Muntean, M.; Janssens-Maenhout, G.; Song, S. J.; Selin, N. E.;Olivier, J. G. J.; Guizzardi, D.; Maas, R.; Dentener, F. Trend analysisfrom 1970 to 2008 and model evaluation of EDGARv4 global griddedanthropogenic mercury emissions. Sci. Total Environ. 2014, 494, 337−350.(122) AMAP/UNEP. Technical Background Report for the GlobalMercury Assessment 2013.; Arctic Monitoring and Assessment Program(AMAP)/UNEP Chemicals Branch: Oslo, Norway/Geneva, Switzer-land, 2013; p vi + 263 pp.(123) Rafaj, P.; Bertok, I.; Cofala, J.; Schopp, W. Scenarios of globalmercury emissions from anthropogenic sources. Atmos. Environ. 2013,79 (0), 472−479.(124) Li, P.; Feng, X. B.; Qiu, G. L.; Li, Z. G.; Fu, X. W.; Sakamoto,M. S.; Liu, X. J.; Wanga, D. Y. Mercury exposures and symptoms insmelting workers of artisanal mercury mines in Wuchuan, Guizhou,China. Environ. Res. 2008, 107 (1), 108−114.(125) Maxson, P. Mercury Flows in Europe and the World: Impact ofDecommissioned Chlor-alkali Plants; European Commission, Direc-torate General for Environment: Brussels, Belgium, 2004; p 104.
Environmental Science & Technology Critical Review
DOI: 10.1021/es5058665Environ. Sci. Technol. 2015, 49, 4036−4047
4047