an-najah national university faculty of graduate studies socio … maraka_1.pdf · dania mohammad...
TRANSCRIPT
An-Najah National University
Faculty of Graduate Studies
Socio Economic Evaluation and Feasibility Assessment of Small Scale
Biogas Units for Rural Communities in Palestine
By
Dania Mohammad Faiz Mohammad Saeed Maraka
Supervisor
Prof. Marwan Haddad
This Thesis is Submitted in Partial Fulfillment of the Requirements for
the Degree of Master of Environmental Science, Faculty of Graduate
Studies, An-Najah National University, Nablus - Palestine.
2014


iii
Dedication
To my parents, Faiz and Sabah,
My husband and my son, Ibrahim and Khalil,
And all of my family and friends.

iv
Acknowledgments
There are number of people without whom this thesis might not have been
written, and to whom I am greatly indebted.
I wish to express profound gratitude to Prof. Dr Marwan Haddad for his
invaluable support, encouragement, supervision and useful suggestions
throughout this research study. His moral support and continuous guidance
enabled me to complete my work successfully.
And I would like to thank Dr Jihad Abdallah for his help.
I acknowledge the assistance of all the faculty members of An-Najah
National University especially water and environmental studies institute.
This research was funded through the American Consulate General in East
Jerusalem. I am grateful for their support and for Fadia Diabes fund
provided by the American Consulate General in East Jerusalem.
Last but not least, I am thankful and indebted to all those who helped me
directly or indirectly in completion of this research study.
Dania Maraka

v
االقرار
:انا الموقع ادناه مقدم الرسالة التي تحمل عنوان
Socio Economic Evaluation and Feasibility Assessment of Small Scale
Biogas Units for Rural Communities in Palestine
باستثناء ما تمت االشارة اليه , يه هذه الرسالة انما هو نتاج جهدي الخاصاقر بان ما اشتملت عل
حيثما ورد وان هذه الرسالة ككل من او جزء منها لم يقدم من قبل لنيل أي درجة او بحث علمي او
.بحثي لدى أي مؤسسة تعليمية او بحثية اخرى
Declaration
The work provided in this thesis, unless otherwise referenced, is the
researcher's own work, and has not been submitted elsewhere for any other
degree or qualification.
Student's name: اسم الطالب:
Signature: التوقيع:
Date:
:التاريخ

vi
Table of Content
No. Contents Page
Dedication iii
Acknowledgments iv
List of Tables viii
List of Figures x
Declaration v
Abstract xi
1 Introduction 1
1.1 General 2
1.2 Objectives 3
1.3 Importance and Motivation 4
1.4 Hypothesis 5
2 Literature Review 6
2.1 Anaerobic Digestion 7
2.2 The Aim of Anaerobic Digestion Plants 7
2.3 Digester Material and Pretreatment Processes 8
2.4 Operational Temperatures 10
2.5 System Classifications 10
2.6 Important Parameters for Anaerobic Treatment 11
2.7 Advantages and Disadvantages of Anaerobic Digestion 14
2.8 Biogas Composition 15
2.9 Economic Merit of Anaerobic Digestion 17
2.10 Human Toxicity 18
2.11 Studies of biogas units around the world 19
2.12 Summry 21
3 Research Methodology 24
3.1 Social Survey 25
3.1.1 Study Society 25
3.1.2 Survey Objectives 25
3.1.3 Sample 26
3.1.4 Questionnaire content 26
3.1.5 Statistical Analysis 31
3.2 Experimental Setup 32
3.3 Experiment Program and field work 37
3.3.1 Experiment stages and input waste preparation 37
3.3.2 Gas collection and weighing 38
3.3.3 Temperature measurements 38
3.3.4 Biogas versus Liquefied Petroleum Gas (LPG) flaring 39

vii
3.4 Experiment site 39
3.5 Lab analysis 39
4 Results and Discussion 41
4.1 Socio-economic Survey Results and Discussion 42
4.1.1 First domain 42
4.1.2 Second domain 48
4.1.3 Third domain 56
4.1.4 Fourth domain 63
4.1.5 Fifth domain 67
4.1.6 Sixth domain 69
4.2 Experimental Results and Discussion 70
4.2.1 Phase 1 results: Cow manure mixed with household waste 70
4.2.2 Phase 2 results: Cow manure 72
4.2.3 Phase 3 results: Sheep manure 73
4.2.4 Phase 4 results: poultry manure 75
4.2.5 Comparison between biogas productions at all phases 76
4.2.6 Biogas versus Liquefied Petroleum Gas (LPG) 82
4.2.7 Biogas coverage ratio for the needs of the family 84
4.2.8 Theoretical estimation of methane content by weight in
biogas
85
5 Financial Evaluation of a Biogas Digester 87
5.1 Initial investment 89
5.2 Monthly Running cost 90
5.3 Biogas and organic fertilizer profit 90
5.4 Total profit 92
5.5 The simple payback period 93
6 Main Findings and Recommendations 95
6.1 Main Findings 96
6.2 Recommendations 97
References 99
Appendix I 100
Appendix II 115
Appendix III 119
Appendix IV 123
ب الملخص

viii
List of Tables
No. Contents Page
1 Biogas composition for different waste 61
2 Scoring the questionnaire choices 28
3 Scoring the questionnaire choices 29
4 Experimental stages 38
5 Methods of dealing with animal waste 45
6 Methods of dealing with household waste 46
7 Methods of dealing with wastewater 47
8 Methods of dealing with agricultural waste 48
9 Analysis of second domain 51
10 The result of (T. test) to identify differences in knowledge
about biogas 53
11 The result of (ANOVA. test) about differences in
participant's knowledge about biogas
54
12 Analysis of third domain 57
13 The results of (T. test) to identify differences in participants
acceptance and willing to use biogas technology 60
14 The results of (ANOVA test) about differences in
participants acceptance and willing to use biogas technology 62
15 Analysis of fourth domain 64
16 Results of (T. test) to identify differences in utilizing
preferability 65
17 The result of (ANOVA. test) about differences in utilizing
preferability 66
18 Analysis of fifth domain 68
19 Analysis of sixth domain 69
20 Average biogas quantity produced from different waste
mixtures 76
21 Detailed biogas quantities produced from different waste
mixtures 77
22 ANCOVA test results 79

ix
23 Nonlinear analyses results 81
24 Requirements and cost for constructing family biogas unit 89
25 Phase 1 experiment results 115
26 Phase 2 experiment results 116
27 Phase 3 experiment results 117
28 Phase 4 experiment result 118

x
List of Figures No. Contents Page
1 The sustainable cycle of biogas from anaerobic digestion 8
2 An illustration of the biogas unit 34
3 Setting up the biogas unit 35
4 Starting to operate the biogas unit 35
5 Weighing the compressor using the electronic balance 36
6 The biogas unit inside the greenhouse 37
7 Work sectors of the participants 42
8 Frequency of cleaning animal waste 43
9 The way that the participants hear about biogas 49
10 Participants belief about the origin of biogas 50
11 Payback period condition for biogas – willing to use 59
12 Participants preferability of using biogas 63
13 Biogas quantity produced by time at phase 1 71
14 Biogas quantity produced by time at phase 2 72
15 Biogas quantity produced per time at phase 3 74
16 Biogas quantity produced by time at phase 4 75
17 Comparing biogas produced at all phases 78
18 Total biogas production for different waste mixtures 78
19 Plot of predicted biogas production vs. measured biogas values
(ANCOVA analysis model) 80
20 Plot of predicted biogas production vs. measured biogas values
(Nonlinear analysis model)
82
21 The proposed biogas plant design 88

xi
Socio Economic Evaluation and Feasibility Assessment of Small Scale
Biogas Units for Rural Communities in Palestine
by
Dania Mohammad Faiz Mohammad Saeed Maraka
Supervisor
Prof. Dr. Marwan Haddad
Abstract
Any green energy utilizing scheme should support environmental
sustainability, economic feasibility and social acceptability. The aim of this
research study is to evaluate the economic feasibility and social
acceptability of using floating tank biogas units at the household level in
Palestine. In order to evaluate social acceptability, a social survey was
performed to evaluate Palestinians knowledge, acceptance and trends
toward biogas technology. In addition to that, practical experiments were
performed on a floating tank biogas unit in order to estimate the biogas
production from different waste mixtures , and perform economic
feasibility study.
The social survey results indicated that 80% of the participants have known
about biogas technology especially through schools and universities.
Results have also shown positive trends in awareness toward biogas
technology (average percentage, 80%).
Most farmers are willing to use biogas technology in their farms or homes
if it has a financial profit (average percentage, 85.8%), but they also think
that operating a biogas unit in the house or farm will require a lot of time

xii
and effort (average percentage, 56.6%). There is a good level of acceptance
and willing to use biogas technology but with some insurance such as
providing support and help in terms of unit maintenance and operation. So,
it seems that people do not have experience with the system.
The experiment was conducted using 1500 L floating tank biogas unit.
Four different waste mixtures were tested for their biogas production in a
continuous flow system. Results obtained from this experiment show that
the highest biogas yields during 16 days of experiment are respectively
sheep manure (22.9 kg), cow manure (22.6 kg), poultry manure (20.8 kg)
and food residues mixed with cow manure (19 kg).
Non-linear procedure analysis was used to create a model of gas quantity
produced as a function of mixture type, temperature and time. And a plot of
measured versus predicted biogas quantity was drawn.
An experiment was performed in order to estimate a conversion factor for
the family requirements of biogas if it replaced LPG. Results of the
experiment show that the conversion factor is 3; this means that the 12 kg
bottle of LPG is equivalent to 36 kg of biogas. This should cover on
average 70% of the Palestinian family needs of cooking fuel.
In the economic evaluation of the biogas unit, the initial investment to
construct a floating tank biogas unit is 1100 NIS and the monthly running
cost is 12 NIS. The simple payback period is 1 year if the fertilizer is sold
in the market and 2 years if the fertilizer is not sold.

xiii
In recommendations, it is encouraged to use biogas technology in rural
Palestinian areas were feedstock is available and biogas unit outputs are
usable. It is also recommended to carry out promotional programs aiming
at educating people at rural areas about benefits of biogas technology.

1
Chapter One
Introduction

2
1.1 General
The past century witnessed high demand for energy due to the rapid
increase in the world’s population and the level of luxury. Researchers and
scientists explore various methods to provide sufficient amounts of energy
where needed. In the other hand, environmentalists are always concerned in
finding an energy source that has the lowest negative influence on the
environment. One of the innovative methods for producing green energy is
to use a biogas plant that digests organic solid waste and animal manure to
produce biogas and soil fertilizers. The biogas plant does not only represent
a source of energy but it also represents an efficient method for organic
solid waste disposal. The purpose of this research is to evaluate the
potential of utilizing small scale biogas plants to serve rural Palestinian
communities.
The basic technology of Anaerobic Digestion involves anaerobic
fermentation of wet organic waste feedstocks to produce biogas (methane
and carbon dioxide) and organic fertilizer, the methane is used for heating,
electricity generation or as a transport fuel.
Biogas technology is increasingly used worldwide and plays an important
role in producing energy for several uses like cooking, electricity
production and heating.
Biogas units are in general designed and built to provide the
microorganisms with the suitable conditions to digest organic material and

3
produce biogas. Due to continuous improvements and developments in
biogas technology, the applicability and the benefits of biogas units have
frown in importance, especially in the developing countries.
Biogas production in the West Bank has not been given enough care and
few intensive studies have been done. Biogas units in the West Bank were
limited to a few small scale units that were constructed mainly for
educational and demonstrational purposes. However, recently water and
environmental studies institute at An-Najah National University have
constructed and distributed number of floating tank biogas units under the
fund of the American consulate at Jerusalem.
This research study aims to gain an understanding of socio-economic and
feasibility aspects of the introduction of biogas technology in rural
Palestinian communities. This is achieved through experimenting the
operation of a small-scale floating tank biogas unit using different organic
waste mixtures. And also, collecting and analyzing socio-economic data
regarding biogas technology via especially designed questionnaire.
1.2 Objectives
The objective of this research study is to evaluate the potential of small
scale biogas plants as an alternative source of energy for rural Palestinian
communities. Such evaluation can be utilized in the development of best
management practices that can be adopted to manage organic solid waste

4
and lead toward understanding one of the possible energy sources that can
be extracted from organic waste in rural Palestinian areas.
In the light of the above, the following objectives are considered:
To investigate the level of Palestinians knowledge and awareness regarding
biogas technology and their willingness to use biogas technology in their
homes or farms.
To compare the biogas quantity produced from different waste mixtures in
a biogas unit.
To develop initial financial feasibility evaluation of the use of small scale
biogas plants in rural Palestinian communities.
Modeling of biogas production as a function of operating parameters
(temperature, time and waste type).
1.3 Importance and Motivation
One of the main challenges facing the world is to harness the energy
sources which are environmental friendly and ecologically balanced. This
compiled the motivation to search for other alternate sources of green
energy. But unfortunately the new alternative renewable energy sources
like the hydro, solar or wind energy sources require huge economical
investment and technical power to operate, which seems to be very difficult
for the developing countries like Palestine. This research aims to
investigate whether we can consider the biogas energy - extracted from

5
small scale biogas units - one reliable, easily available, socially acceptable
and economically feasible source of alternative and renewable source.
1.4 Hypothesis
The biogas production from small biogas unit is sufficient to provide
energy for one average Palestinian family.
Biogas quantity produced from a biogas unit differs depending on the type
of the waste used.
Palestinians in rural communities show willingness to operate biogas units.

6
Chapter Tow
Literature Review

7
2.1 Anaerobic Digestion
Anaerobic digestion (AD) is a process in which microorganisms break
down biodegradable material in the absence of oxygen. Anaerobic
digestion can be used to treat various organic wastes and recover bio-
energy in the form of biogas, which contains mainly CH4 and CO2.
Methane could be used as a source of renewable energy producing
electricity in combined heat and power plants. (Clemens, et al., 1999)
The process of anaerobic digestion can take place in uncontrolled systems -
for example at waste dumps - and in controlled systems -for example in
reactors, also known as anaerobic digesters -. In reactors especially human
and animal waste are used as raw materials (Lardinois, et al., 1993). The
process of anaerobic digestion in enclosed reactors is effectively a
controlled and enclosed version of the anaerobic breakdown of organic
waste in landfill which releases methane (Friends of the earth, 2007).
2.2 The Aim of Anaerobic Digestion Plants
There are two possible aims of using anaerobic digesters. It can be used
either to treat biodegradable wastes or produce saleable products –
heat/electricity, soil amendment -. Energy crops can be grown and then
used for anaerobic digestion process. In this case, the aim is to produce as
much biogas as possible and good quality soil amendment. Nevertheless
the most valuable use of anaerobic digesters is to combine both waste
management and by-products use. Especially for waste management, it is

8
unlikely that anaerobic digesters will be a viable treatment without using
the biogas and the digestate. Their qualities will vary depending on the
feedstock and its contamination. The use of biogas and digestate can also
involve further treatments, such as composting of the digestate and biogas
upgrading (Monet, 2003).
Figure 1: The sustainable cycle of biogas from anaerobic digestion (Al Seadi, 2001)
2.3 Digester Material and Pretreatment Processes
Only waste of organic origin can be processed in an anaerobic digester. As
this makes up almost 60% of household waste in Palestine there is a
considerable benefit in diverting this waste from landfill. The MSW
contains organic waste as well as inorganic waste, the anaerobic digestion
feedstock needs to be only organic material, moreover some of the organic
matter such as coarser wood, paper and cardboard are slowly digestible.

9
These are lignocellulosic materials which do not readily degrade under
anaerobic conditions and are better suited to aerobic digestion, i.e.
composting (White, et al., 1995).
Mechanical separation can be used to separate an organic fraction of the
waste if source separation is not available. The fraction obtained is more
contaminated which will affect the heavy metal and plastic content of the
final digestate composting product. In many countries compost derived
from mechanical separation will not meet standards required for a soil
conditioner product.
Joint treatment of municipal solid waste with animal manure/sewage slurry
is a popular method in existing plants, the process tends to be simpler and
is economically more viable than MSW only treatment system.
Having separated any recyclable or unwanted materials from the waste, the
organic material must be chopped or shredded before it is fed into the
digester. The organic matter is also diluted with a liquid, ranging from
sewage slurry, to recycled water from the digestate, to clean water. In some
systems an aerobic pre-treatment allows organic matter to be partly
decomposed under aerobic conditions before undergoing anaerobic
digestion (White, et al., 1995).

10
2.4 Operational Temperatures
The two conventional operational temperature levels for anaerobic
digesters are determined by the species of methanogens in the digesters:
Mesophilic digestion takes place optimally around 30 to 38 °C, or at
ambient temperatures between 20 and 45 °C, where mesophiles are the
primary microorganism present.
Thermophilic digestion takes place optimally around 49 to 57 °C, or at
elevated temperatures up to 70 °C, where thermophiles are the primary
microorganisms present. (Song, et al., 2004)
2.5 System Classifications
A wide variety of systems have been developed to anaerobically treat
MSW. They can be split into a variety of categories such as:
Wet or Dry: in wet systems the waste feedstock is slurried with a large
amount of water to provide a dilute feedstock of 10-15% dry solids. While
in dry system the feedstock used has a dry solids content of 20 – 40%.
Batch or Continuous: in batch systems the reactor vessel is loaded with raw
feedstock and inoculated with digestate from another reactor. It is then
sealed and left until thorough degradation has occurred. The digester is
then emptied and a new batch of organic mixture is added. Whereas in
continuous systems the reactor vessel is fed continuously with digestate
11
material, fully degraded material is continuously removed from the bottom
of the reactor.
Single-Step or Multi-Step: In single step all the digestion occurs in one
reactor vessel, while in multi step the process consists of several reactors,
often the organic acid forming stage (methanogenesis). This results in
increased efficiency as the two microorganisms are separate in terms of
nutrient needs, growth capacity and ability to cope with environmental
stress. Some multistage systems also use a preliminary aerobic stage to
raise the temperature and increase the degradation of the organic material.
In other systems the reactors are separated into a mesophilic stage and a
thermophilic stage.
Co-digestion with animal manure or digestion of solid waste alone: during
co-digestion with animal manure the organic fraction of the waste is mixed
with animal manure and the two fractions are co-digested. This improves
the carbon/nitrogen ratio and improves gas production. But in digestion of
solid waste alone the feedstock contains the organic fraction of solid waste
alone, slurried with liquid, no other materials are added. (RISE-AT, 1998)
2.6 Important Parameters for Anaerobic Treatment
C/N Ratio: The relationship between the amount of carbon and nitrogen
present in organic materials is expressed in terms of the Carbon/Nitrogen
ratio. A C/N ratio of 20-30 is considered to be optimum for an anaerobic
digester. If C/N ratio is very high, the nitrogen will be consumed rapidly by

12
the methanogens to meet their protein requirement and will no longer react
on the left over carbon content in the material. As a result the gas
production will be low. In the other hand if the C/N ratio is very low,
nitrogen will be liberated and accumulate in the form of ammonia. This
will increase the pH value of the material, a pH value higher than 8.5 will
start to show a toxic effect on the methanogenic bacterial population. To
maintain the C/N level of the digester material at acceptable levels,
materials with high C/N ratio can be mixed with those with a low C/N
ratio, i.e. organic solid waste can be mixed with sewage or animal manure.
(Monet, 2003)
Dilution: Different systems can handle different percentages of solid to
liquid, average ratios are 10-25%, but some systems can cope with solids
up to 30%.
pH Value: Optimum biogas production is achieved when the pH value of
the input mixture is between 6 and 7 (Hassan, 2004).
Temperature: Methanogenic bacteria are inactive at extremes of high and
low temperature. When the ambient temperature goes down to 10 ˚C, gas
production virtually stops. Two temperature ranges provide optimum
digestion conditions for the production of methane, those are the
mesophilic and thermophilic ranges discussed above. (Verma, 2002)
Loading Rate: It is the amount of waste fed to the biogas unit per day per
unit volume of digester capacity. This is an important process control

13
parameter in continuous systems. Many plants have reported system
failures due to overloading. This is often caused by inadequate mixing of
the waste with slurry. If there is a significant rise in volatile fatty acids this
normally requires that the feed rate to the system be reduced.
Retention Time: Wastes remain in a digester that is operating in the
mesophilic range for a varying period of 10 – 40 days, the duration being
dictated by differing technologies, temperature fluctuations and waste
composition.
Toxicity: Mineral ions, heavy metals and detergents are some of the toxic
materials that inhibit the normal growth of bacteria in the digester. Small
quantities of minerals, (sodium, potassium, calcium, magnesium,
ammonium and sulphur), also stimulate the bacterial growth, but heavy
concentrations will have a toxic effect. Heavy metals such as copper,
nickel, chromium, zinc, lead are essential for bacterial growth in small
quantities, but higher quantities will also have a toxic effect. Detergents
such as soap, antibiotics, and organic solvents also inhibit the bacteria.
Recovery of digesters following toxic substances inhibiting the system can
only be achieved by cessation of feeding and diluting the contents to below
the toxic level (Verma, 2002).
Mixing/Agitation: Results from existing systems tend to show that a level
of mixing is required to maintain the process stability within the digester.
The objectives of mixing are to combine the fresh material with the

14
bacteria, to stop the formation of scum and to avoid pronounced
temperature gradients within the digester. Over frequent mixing can disrupt
the bacterial community and it is generally considered that slow mixing is
better than rapid mixing. The amount of mixing required is also dependent
on the content of the digestion mixture (White, et al., 1995).
2.7 Advantages and Disadvantages of Anaerobic Digestion
Anaerobic digesters contribute to reducing the greenhouse gases by
maximizing methane production but without releasing it to the atmosphere,
thereby reducing overall emissions. Also it provides a source of energy
with no net increase in atmospheric carbon which contributes to climate
change (Yu, 2008).
Biogas stoves fueled by anaerobic digesters of animal, human and crop
waste have been shown in laboratory studies to reduce health-damaging air
pollution by up to 90% with a very low climate impact, and are being used
widely in China and south-east Asia for household cooking and lighting
(Smith, 2000). If the digester is also linked to a latrine, the resulting
improvement in sanitation could help prevent worm infestation, diarrheal
disease and malnutrition (Remais, et al., 2009) The feedback for anaerobic
digesters is a renewable resource and thus does not deplete finite fossil
fuels. On financial aspects, the advantage of anaerobic digestion is that it
turns waste into useful products.

15
Disadvantages of anaerobic digesters arise from the fact that anaerobic
digestion systems, as with many developments, will create some risks and
have some potential negative impacts.
Anaerobic digestion has significant capital and operational costs. It is
unlikely that anaerobic digestion will be viable as an energy source alone, it
is likely to be effective for those who can use the resulting fertilizers.
About health and safety, there may be some risks to human health with the
pathogenic content of feedstock but it can be avoided with an appropriate
plant design and feedstock handling procedures. There may also be some
risks of fire and explosion although no longer than natural gas installation
(Monet, 2003).
2.8 Biogas Composition
Biogas is characterized based on its chemical composition and the physical
characteristics which result from it. It is primarily a mixture of methane
(CH4) and inert carbonic gas (CO2). However the name “biogas” gathers a
large variety of gases resulting from specific treatment processes, starting
from various organic waste - industries, animal or domestic origin waste
etc.
Different sources of production lead to different specific compositions.
The composition of a gas issued from a digester depends on the substrate,
of its organic matter load, and the feeding rate of the digester (Naskeo

16
Environement, n.d). Table 1 shows the biogas composition for the biogas
produced from different waste.
Table 1: Biogas composition for different waste (Naskeo
Environement, n.d).
Components Househo
ld waste
Waste
treatment
plants
sludge
Agricultura
l waste
Waste of
agrifood
industry
CH4 % volume 50-60 60-75 60-75 68
CO2 % volume 38-34 33-19 33-19 26
N2 % volume 5-0 1-0 1-0 -
O2 % volume 1-0 < 0.5 < 0.5 -
H2O % volume 6 6 6 6
Total % volume 100 100 100 100
H2S (mg/m3) 100-90 1000-4000 3000-10000 400
NH3 (mg/m3) - - 50-100 -
Aromatic
(mg/m3)
0-200 - - -
Organochlorinate
d or
organofluorated
(mg/m3)
100-800 - - -

17
2.9 Economic Merit of Anaerobic Digestion
The success of biogas plants (projects) at an area depends on availability of
organic materials, cost of constructing, founded energy sources and its
costs, experience, knowledge, ambient climate conditions especially
temperature, and acceptability for people constructing these plants (Hassan,
2004).
Anaerobic digestion is a technically feasible option for converting organic
residues. It provides benefits to the environment through energy and
nutrient recycling, while also mitigating odours, pathogens and
atmospheric methane. However, like most renewable energy options, its
economic merit relies on conditions dependent on a variety of factors. The
decision to use anaerobic digestion for treating MSW rather than alternative
technologies depends on a number of factors; such as waste quality, site
specific circumstances, availability of outlets for the energy produced,
energy prices and taxes, energy purchase tariffs, costs of alternatives/taxes
on alternatives, policy, land prices, markets for compost and digestate and
Level of capital and labour costs in each country.
Discussion of the economics of the digestion of MSW is complex due the
wide range of parameters that affect the costs and the number of “external”
benefits that are accrued. In addition to this, each country has different
circumstances, infrastructure and fiscal arrangements that affect the relative

18
and absolute costs of various waste management options. Even within a
single country these costs will vary considerably (IEA Bioenergy, 2011).
A single farmer, a consortium of farmers or a municipality are usually the
entrepreneurs likely to implement successful biogas projects. The success
of the project depends on some factors that can be controlled and
influenced by strategic decisions concerning investment and operational
costs (Al Seadi, et al., 2008).
Al Seadi and others reported that in case of the single farmer biogas project
– small scale biogas units- the project developer is forced to have a very
close view to the different aspects of the project and, in case of cancelling
the project, no external costs have occurred. (Al Seadi, et al., 2008)
2.10 Human Toxicity
Like most treatment processes, there will be some emissions from
anaerobic digestion. Air emissions are low due to the enclosed nature of the
process, though combustion of the biogas will produce some nitrogen
oxides. However, emissions from anaerobic digesters are generally lower
than other forms of waste disposal.
The health risk from the solid and liquid residue from the AD plant should
be low as long as source-separated waste is being used - i.e. no chemical
contaminants are entering the system from other waste- (DEFRA, 2004).

19
2.11 Studies of biogas units around the world
Understanding the factors that affect the success or failure of operation of
biogas units has motivated several studies that have been carried out around
the world. In most of the studies the success or failure were based on the
economic benefits arising from operating biogas units.
A study was conducted in Hungary and Germany that examined whether
small farms will benefit from participating in biogas production. Large
industrial biogas plants ranging into the megawatt-scale dominate in
Hungary, while in Germany, farm-scale biogas units continue to prevail.
They concluded that despite the stronger focus of both tariff systems on
small biogas plants since 2007, investments in small scale biogas
agricultural units are no longer economically attractive for farms smaller
than 5 ha. This is mainly due to the high fixed investment costs and rising
prices of biogas feedstock. The key explanatory factors for different
production scales in Germany and Hungary are the farm size distribution
and the motivation behind national support schemes. (Buchenrieder, et al.,
2009)
One research studied the impact of single versus multiple policy options on
the economic feasibility of biogas energy production for Swine and dairy
operations in Nova Scotia. This study concluded that combinations of
multiple policies that included cost-share and green energy credit incentive

20
schemes generated the most improvement in financial feasibility of on-farm
biogas energy production, for both swine and dairy operations.
Without incentive schemes, on-farm biogas energy production was not
economically feasible across the farm size ranges studied, except for 600-
and 800-sow operations. Among single policy schemes investigated, green
energy credit policy schemes generated the highest financial returns,
compared to cost-share and low-interest loan schemes (Brown, et al.,
2007).
In Germany, a study has evaluated energy efficiency management
strategies of different biogas systems, including single and co-digestion of
multiple feedstock, different biogas utilization pathways, and waste-stream
in Germany. The method of Primary Energy Input to Output (PEIO) ratio
was used to evaluate the energy balance and figure out the energy
efficiency, hence, the potential sustainability. Results of their study showed
that energy input was highly influenced by the characteristics of feedstock
used. For example, agricultural waste, in most part, did not require pre-
treatment. Energy crop feedstock required pre-treatment in order to meet
stipulated hygiene standards. Energy balance depended on biogas yield, the
utilization efficiency, and energy value of intended fossil fuel substitution.
(Pöschl, et al., 2010)
An economic assessment of biogas to electricity generation was performed
in small pig farms with and without the H2S removal prior to biogas

21
utilization. The main findings of the evaluation are that the payback period
for the system without H2S removal was about 4 years. With H2S removal,
the payback period was twice that of the case without H2S removal. For
both treated and untreated biogas, the governmental subsidy was the
important factor determining the economics of the biogas-to-electricity
systems. Without subsidy, the payback period increased to almost 7 years
and about 11 years for the case of untreated and treated biogas,
respectively, at the reference electricity price at Thiland (0.06 Euro/kWh).
(Pipatmanomai, et al., 2009)
2.12 Summry
Biogas technology has become widely used around the world due to its
environmental, social and economical benefits. So, a lot of studies were
directed toward studying the anaerobic digestion of organic matter to
produce biogas. Several system classifications and types of organic matter
input were used in the biogas systems. The system can be either wet or dry,
batch or continuous and single step or multi step. The digester material can
be either animal manure mixed with solid waste or solid waste alone.
There are many factors that influence the process of organic matter
digestion in the biogas unit. Some of these factors are related to:
The surrounding environment – temperature-.
Digestate characteristics – C/N ratio, dilution, pH and toxicity-.

22
Operational conditions –loading rate, mixing and retention time.
Since the biogas yield is affected by these factors; in this research study,
the biogas yield from a biogas unit was measured taking these factors under
consideration.
Using biogas technology has advantages that can be classified according to
the scale of biogas technology usage. That is, if biogas technology is
implemented at micro level the following advantages are noticed:
The production of energy at low cost.
A crop yield increase in agriculture by the production of bio fertilizer.
An increase in the quality of agricultural production due to using the
organic fertilizer instead of the manufactured fertilizers for producing
ecologically pure products.
The improvement of social conditions of rural population.
Creating a solution for organic waste disposal in areas were municipal
services are not covered.
Whereas at the macro level, the following advantages become more
obvious:
The conservation of tree and forest reserves and a reduction in soil erosion.
Poverty reduction of the rural population.

23
Reduction in importing fuel and fertilizers.
Provision of skills enhancement and employment for rural areas.
The success or failure of biogas projects were based on the social
acceptance to the system and the economic benefits arising from operating
biogas units. This fact has motivated the researcher to conduct a socio –
financial evaluation of using biogas technology in rural Palestinian
communities.
Most of the Palestinian energy needs are met by importing oil products
from Israeli companies. The prices are high and usually not affected by
international market prices especially when the international prices drop
(Al Sadi, 2010). Al Sadi stated that the theoretical amount of biogas that
could be produced in north of Palestine is 8,640,000 kg/year based on the
115,200 ton of waste that Zahret Al-Finjan landfill receives at an annual
rate (Al Sadi, 2010)
Each country has different circumstances, infrastructure and fiscal
arrangements that affect the relative and absolute costs of various waste
management options (IEA Bioenergy, 2011). So, the success or failure of
any biogas system depend largely on the country or region where it is
conducted. The value of this research study is that it shows the feasibility
of biogas technology in the Palestinan communities in particular, taking
into account the cost of constructing and operating biogas units and the
social trends toward this technology.

24
Chapter Three
Research Methodology

25
To achieve the objectives of this research study, firstly research needs and
objectives were defined. Data collection was conducted depending on
literature review, questionnaire and field experiments. The collected data
were analyzed and processed using Excel software. This leads to setup of
the socio-economic evaluation of small biogas digesters in rural Palestinian
communities.
3.1 Social Survey
3.1.1 Study Society
The society of the study is the Palestinian rural families in West Bank.
3.1.2 Survey Objectives
The following objectives were intended from the questionnaire:
To gather data about the methods used by rural family in dealing with their
wastewater, household waste, animal waste and agricultural waste.
To investigate the level of knowledge about biogas technology.
To determine the acceptance and willingness to use biogas technology.
To determine the most preferred management and financial options
regarding biogas technology.

26
3.1.3 Sample
200 copies of the questionnaire (in Arabic language, see appendix I) were
distributed on 200 families who live at different Palestinian rural areas. The
questionnaire were distributed and gathered in workshops aimed at
introducing and promoting the concept of biogas technology among
Palestinian people (the workshops was led by Prof. Dr Marwan Haddad –
head of WESI at An-Najah University- and funded by the American
Consulate at Jerusalem). The questionnaire domains and questions were
explained to the participants for removing any misunderstanding. The
participants answered the questionnaire before the beginning of the
workshops to ensure the impartiality and neutrality of the answers. Then,
the filled questionnaires were collected and the obtained data were
organized and statistically analyzed.
3.1.4 Questionnaire content
The design of the questionnaire was based on the experiences of similar
researches in Palestine and other countries, taking into account the special
situation of this research study.
The questionnaire is divided into six main domains: general information,
participants knowledge about biogas, participants acceptance and
willingness to use biogas technology, participants utilizing preferability of
biogas and the organic fertilizer, management aspects and financial aspects.

27
3.1.4.1 First domain: general information
In this domain, the participant is required to answer some general questions
regarding him and his family. In some of the questions the participant
chooses the answer that fits his condition from the listed choices
(statements from 1-12 and 14) , these questions collects data about name of
village/ city, gender, age, number of family members, housing, work type,
educational level, average family income, garden availability, garden type,
animals raising and frequency of cleaning animals farm.
In other questions (statements 13 and 19) the participant is required to fill
tables regarding: Animals type and numbers, area of each planting type and
the irrigation method used.
In one question (statement 16) the participant is required to write the
distance between his house and the nearest waste disposal site.
The remaining questions (questions 15, 17, 18, 20) consist of several
statements for each. These questions are regarding: Methods of dealing
with animal manure (statements 15.a – 15.e), methods of dealing with
household waste (statements 17.a – 15.f), methods of dealing with
wastewater (statements 18.a – 18.d) and methods of dealing with
agricultural waste (statements 20.a – 20.g). For each statement there were
four possible choices: All, most, some and none. And the participant was
asked to write X in front of the choice that applies. The choices were
28
scored as indicated in Table 2 below to simplify statistical analysis of the
data.
Table 2: Scoring the questionnaire choices
Choice All Most Some None
Score 3 2 1 0
3.1.4.2 Second domain: participants knowledge and understanding
This domain was designed to obtain data about the level of the participants
previous knowledge about biogas. It consists of 8 multiple choice
questions.
In three questions (statement 1, 2 and 3) the participant is asked to circle
the answer that best fits his condition. While in the remaining questions
(statements from 4–8) the participant is asked to circle the suitable option
(strongly agree, agree, no opinion, disagree, strongly disagree) that agrees
with his belief.
Some of the questionnaire statements were classified according to their
positivity or negativity in order to simplify statistical analysis of the data.
The options scores if the direction of statement is positive or negative are
shown in Table 3 below.
Statements 4, 5, 6, 7 and 8 of the second domain are considered positive.

29
Table 3: Scoring the questionnaire choices
Statement
direction
strongly
agree agree
no
opinion disagree
strongly
disagree
Score
Negative 1 2 3 4 5
Positive 5 4 3 2 1
3.1.4.3 Third domain: participants acceptance and willingness to use
biogas technology
This domain was designed to investigate the participant acceptance, willing
and opinion toward biogas technology. It consists of 9 multiple choice
questions. In 8 of them (statement 1 and from 3-9) the participant is asked
to circle the suitable option (strongly agree, agree, no opinion, disagree,
strongly disagree) that agrees with his belief as in domain two. While the
remaining question (statement 2) the participant chooses between 3
choices.
The options for statements 1 and 3-9 were scored according to Table 3 to
simplify statistical analysis of the data. Statements 1, 3 and 5 are positive,
while statements 4, 6, 7, 8 and 9 are negative.

30
3.1.4.4 Fourth domain: participants utilizing preferability of biogas
and the organic fertilizer
This domain aims at collecting data about the participants direction of the
way they prefer to utilize biogas and the resulting organic fertilizer. It
consists of 4 multiple choice questions. The first question (statement 1)
consists of 4 choices.
While the remaining other questions (statements 2-4) the participant is
asked to circle the suitable option (strongly agree, agree, no opinion,
disagree, strongly disagree) that agrees with his belief. The options were
scored according to Table 3 to simplify statistical analysis of the data.
Statements 2-4 are positive.
3.1.4.5 Fifth domain: unit management aspects
This domain investigates the participants opinion toward management
aspects of the biogas technology. This includes participants opinion on
whether the biogas technology should be managed individually, through
private company, the government or joint stock company. This domain
consists of 6 multiple choice questions. The first question (statement 1)
consists of two choices.
While the remaining other questions (statements 2-6) the participant is
asked to circle the suitable option (strongly agree, agree, no opinion,

31
disagree, strongly disagree) that agrees with his belief. The options were
scored according to Table 3 to simplify statistical analysis of the data.
3.1.4.6 Sixth domain: financial aspects
The sixth domain is the last domain. It is mainly concerned with the
participants recommendation of the best financial management of biogas
technology income. It consists of 5 multiple choice question. The first and
last question (statements 1 and 5) consists of three choices.
While the remaining other questions (statements 2-4) the participant is
asked to circle the suitable option (strongly agree, agree, no opinion,
disagree, strongly disagree) that agrees with his belief. The options were
scored according to Table 3 to simplify statistical analysis of the data.
3.1.5 Statistical Analysis
3.1.5.1 Data processing
The data processing stage consisted of the following operations:
Editing and coding before data entry: All questionnaires were edited and
coded.
Data entry: At this stage, data was entered into the computer using a data
entry template written in Microsoft Excel software. The data entry template
was prepared to satisfy a number of requirements such as:
To prevent the duplication of the questionnaires during data entry.
32
The ability to transfer captured data to another format for data analysis
using other statistical analytic systems such as SPSS.
3.1.5.2 Calculation and the estimation
The following softwares were used to perform statistical analyses on the
questionnaire data:
Microsoft Office excel.
Statistical Package for the Social Sciences software (SPSS).
SAS software.
The critical percent for evaluating the positivity or negativity of the
questionnaire results is considered 60%.
The following formulas were used in questionnaire analysis:
3.2 Experimental Setup
Biogas unit preparation
A floating tank biogas unit was prepared. Figure 2 is an illustration of the
used biogas unit. The unit consists of two PVC black tanks of sizes 1000 L

33
and 1500 L. The 1500 L tank is the digestion tank. The 1000 L tank is the
gas collection tank.
Preparing the 1500 L tank (the digestion tank): The top of the tank was cut,
two holes were drilled at the tanks sides, one at the bottom and one at the
top. Then holes adapters were connected. The holes are used as digestate
outlets. 2” tube was attached to the inside of the tank and reaches to the
bottom (this is the feeding tube).
Preparing the 1000L tank (the gas collector tank): This tank is smaller in
diameter than the digestion tank. At the top of the tank, several big holes
were made. 1/4” hole was cut in the bottom of this tank (this hole is the gas
outlet) and fitting were added.
Putting small stones at the bottom of the digestion tank: those small stones
serve as adequate surface for bacteria growth (White, et al., 1995).
Placing the digestion tank on a metal base: The metal base was designed
with a holder to carry the waste shredder.
Placing the gas collector tank inside the digestion tank: The gas collector
tank was placed upside down inside the digestion tank having the gas outlet
hole directed upwards.
Placing the waste shredder in its holder: The waste shredder is originally a
garbage disposer powered by electricity and is used to shred waste.

34
The gas collector tank will move downward and upward as long as biogas
is generated. The height that the gas collector at a certain moment indicate
the gas quantity formed.
Figure 2: An illustration of the biogas unit

35
Figure 3: Setting up the biogas unit.
Figure 4: Starting to operate the biogas unit.
The unit was prepared at Royal factory in Hebron and the pluming work
was performed at An-Najah National University.
An air compressor was used to collect and store the gas after it was formed.

36
An electronic balance was used to weigh the biogas stored in the
compressor.
Figure 5: Weighing the compressor using the electronic balance
The biogas unit was connected to the air compressor using 1/4” gas tube.
It is important to notice that the biogas unit was placed inside a greenhouse
located at Hebron city where the experiment was performed.

37
Figure 6: The biogas unit inside the greenhouse
3.3 Experiment Program and field work
Half of the biogas unit was filled with cow manure and water on 1:1 ratio.
And no waste was added for 30 days to stabilize the unit. During this
period the unit generated biogas and it was emptied several times.
3.3.1 Experiment stages and input waste preparation
The experiment was divided into four stages. Each stage has distinct waste
type. Table 4 shows the waste mixture used at each stage. The purpose of

38
these stages is to quantify the continued biogas generation from operating
the biogas digester using different mixtures.
Table 4: Experimental stages
Stage
number
Waste added Water
added
(kg /
day)
Addition
period
(day) Type Quantity
(kg / day)
1 Cow manure 6
12 16 Food residues 6
2 Cow manure 12 12 16
3 Sheep manure 12 12 16
4 Poultry manure 12 12 16
Waste was mixed with water before feeding it to the biogas unit on a 1:1
ratio. 12 kg of the used waste type was added to the unit daily for 14 days.
3.3.2 Gas collection and weighing
As the waste digests, the biogas forms and rises up. Most of the generated
biogas ends up in the upper tank (the gas collector tank). In order to weigh
the biogas, an air compressor was used. The biogas was collected using the
air compressor four times a day and weighted using digital balance.
Temperature of the digestate and the surrounding air was recorded daily.
3.3.3 Temperature measurements
The surrounding temperature was measured using thermometer fixed on the
greenhouse, while the digestate temperature was measured by taking a
small sample of the digestate from the bottom outlet and measuring the
temperature immediately using a thermometer.

39
3.3.4 Biogas versus Liquefied Petroleum Gas (LPG) flaring
An experiment was conducted in order to estimate a conversion factor
between the family requirements of biogas if it replaced LPG.
The idea used is to compare the weight of biogas and LPG that are required
to generate a flame for the same period of time.
Two samples were used during this step:
A sample of biogas was collected using the gas compressor and then
weighted.
A sample of LPG brought from a pressurized gas cylinder.
Both samples were flared for an hour and a half at the same pressure. Then
the remaining gas of each sample was weighted and recorded. The amount
of biogas and LPG required to produce similar flame for the same period of
time was calculated.
3.4 Experiment site
The experiment was performed in Hebron city, West Bank. The biogas unit
was placed at the earth’s. surface level inside a greenhouse.
3.5 Lab analysis
A biogas sample was taken from the biogas generated from each stage. The
samples were supposed to be tested to measure their methane content using

40
GC (Gas Chromotography) present at Poison Control and Chemical
/Biological Analysis Center at An-Najah University. The results were
found incomplete due to technical specifications and of the analytical
equipment. Accordingly, an assumption for methane content was made
based on previous studies and literature (biogas is 60% by volume methane
(White, et al., 1995)) in order to theoretically estimate the mass content of
methane in biogas.

41
Chapter Four
Results and Discussion

42
4.1 Socio-economic Survey Results and Discussion
To simplify results analysis and getting out conclusions for the
questionnaire, the obtained data is arranged according to the questionnaire
domains.
4.1.1 First domain
The results indicate that the sample was composed of 70% males. The
average age of the participants was 36.7years with standard deviation of 16.
Almost 85% live in separate houses while the remaining live in apartments.
It is of great importance in terms of biogas technology for a family to live
separately, because living in apartments may not give enough space for
placing and operating biogas units, unless operating the biogas unit is
meant to be a joint process between the building members.
29% of the participants work in the agricultural sector, the percentage of
work sectors of the participants is shown in Figure 7.
Figure 7: Work sectors of the participants

43
It is expected that the biogas technology will be most effective for people
working in agriculture, especially if they raise animals. This is because this
category of people is more likely to have the required input material,
enough space and can use the output soil fertilizer in their farms. As
previously indicated, 29% of the participants only work in agricultural
sector. But 57% of the participants raise animals near their houses (i.e. the
animal manure is a potential input of the digester). More than 72% of the
participants own home garden (i.e. enough space for placing the digester is
more likely to be available and the output fertilizer can be used in the
garden).
Answers to statement 14 (Figure 8) indicate that almost 70% of the
participants clean the animal waste in less than 7 days. This behavior is
considered positive. Continuous animal waste cleaning indicates the ability
of feeding the biogas digester, if constructed, with the required waste input.
Figure 8: Frequency of cleaning animal waste

44
Table 5, Table 6, Table7 and Table 8 show the methods followed by
participants for dealing with their wastes associated with the averages,
percentages and rank.
The averages and percentages are calculated in order to rank the methods of
dealing with waste by rural families - rank 1 - to the most followed way.
Table 5 shows the average, percentage and rank corresponding to the
participants answers to the methods used for dealing with animal waste.
The most followed method is using the waste as fertilizer to their plants.
Using animal waste to fertilizer crops is an eco friendly solution and
provide nutrients for the plants, but it should be treated first. Using raw
manure without treatment as a fertilizer to plants has negative health
effects, and is even prohibited by some legislation around the world such as
the US legislation for organic production which prohibits using raw manure
without composting or treatment. So, it is of great importance to treat
animal waste before using it to fertilize the land.
The next ranked method is leaving animal waste on its place. This method
is unacceptable due to the negative impacts on health of the surrounding
people and on the environment. This option creates nuisance and spreads
disease vectors.
The remaining methods ordered according to their ranks are disposing in
waste containers, selling to fertilizer factories and producing biogas.

45
Producing biogas from waste had the lowest rank with a very small
percentage.
Table 5: Methods of dealing with animal waste:
Method Average * Percentage Rank
a. Selling it to fertilizers
factories 0.36 12.0% 4
b. Using it as a fertilizer
to my plants 1.99 66.3% 1
c. Producing biogas
from it 0.19 6.4% 5
d. Disposing it in waste
containers 0.40 13.5% 3
e. Leaving it in place 0.41 13.7% 2
* maximum range and score is 3
Table 6 shows the average, percentage and rank corresponding to the
participants answers to the methods used for dealing with household waste.
The method that took rank 1 of household waste disposal is disposal in
public containers. This means that most household waste will end up in
solid waste landfills. Using other eco-friendly alternatives of dealing with
household waste such as biogas production technology reduces the amount
of waste that is diverted to landfills and reduces the cost of disposal.
The second and third ranked household waste disposal methods are
disposal in a nearby land and waste burning. These methods have a lot of

46
environmental, economical and health adverse effects. They should be
stopped and prohibited.
The remaining two methods are feeding the organic waste to animals and
waste fermentation to produce biogas and/ or organic fertilizer. These
methods are considered environmentally friendly and should be promoted
and encouraged to increase their percentage.
Table 6: Methods of dealing with household waste
Method Average * Percentage Rank
a. Burning the waste 0.55 18.3% 3
b. Disposal in public
containers 2.18 72.8% 1
c. Feeding organic waste
to the animals 0.52 17.5% 4
d.
Fermenting household
organic waste to
obtain biogas and / or
organic fertilizer
0.3 9.9% 5
e. Disposal in a nearby
land 0.56 18.7% 2
*maximum range and score is 3
Table 7Tabel 7 shows the average, percentage and rank corresponding to
the participants answers to the methods used for dealing with wastewater.
The two most popular methods of disposing wastewater are draining off to
the absorption pit and draining off through wastewater networks.

47
Table 7: Methods of dealing with wastewater
Method Average * Percentage Rank
a. Drained off through
wastewater network 1.16 38.5% 2
b. Drained off to the
absorption pit 1.64 54.7% 1
c. Drained off through
open canal 0.19 6.3% 4
d. Using it to irrigate
plants 0.43 14.5% 3
*maximum range and score is 3
Table 8 shows the average, percentage and rank corresponding to the
participants answers to the methods used for dealing with agricultural
waste.
The two most popular methods of dealing with agricultural waste are using
it to feed animals and leaving it on the land or in its borders.

48
Table 8: Methods of dealing with agricultural waste
Method Average * Percentage Rank
a. Burn it in the farm 0.5 16.8% 4
b. Use it as animal feed 1.08 36.1% 1
c. Left it at the land or
its borders 0.82 27.4% 2
d. Burn it to get energy 0.43 14.2% 5
e. Gather the straw in
the form of molds 0.52 17.4% 3
f.
Fermenting the plant
remains to obtain
biogas and / or
organic fertilizer
0.39 13.0% 6
*maximum range and score is 3
4.1.2 Second domain
The result of the first statement in this domain shows that only 20% of the
participants have not previously heard about biogas. This reflects that the
level of biogas technology popularity is significant and the concept of
producing biogas from waste is already available to Palestinian
communities. Figure 9 below is a chart that translates the results for
statement 2 (i.e. where did the participant hear about biogas). As obvious
that 43% heard about biogas from school or universities, 28% through the
media, 24% through workshops and finally 5% through the internet. This
reflects the importance of such places in increasing Palestinian people
knowledge about this important technology. The largest percentage was

49
through schools and universities, so it is important to ensure that the school
teachers are well informed about biogas technology aspects in order to
transfer their knowledge to the students. The media also have a great role in
spreading any concept to people, so it is important to plan and perform
campaigns that promote such eco-friendly projects. The small percentage
was for the internet, although the internet is considered one of the most
important tools nowadays in spreading any information. This may be due to
several reasons, some of the participants may not have permanent access to
the internet or they do not use internet for the purpose of gaining such
knowledge.
Figure 9: The way that the participants hear about biogas
Figure 10 shows the results of the participants answer to statement 3 (their
belief about the origin of biogas). 78% thinks that biogas is produced from
organic waste digestion, while the remaining 22% think that it is produced
from petroleum, burning organic waste or had no opinion. The result of this
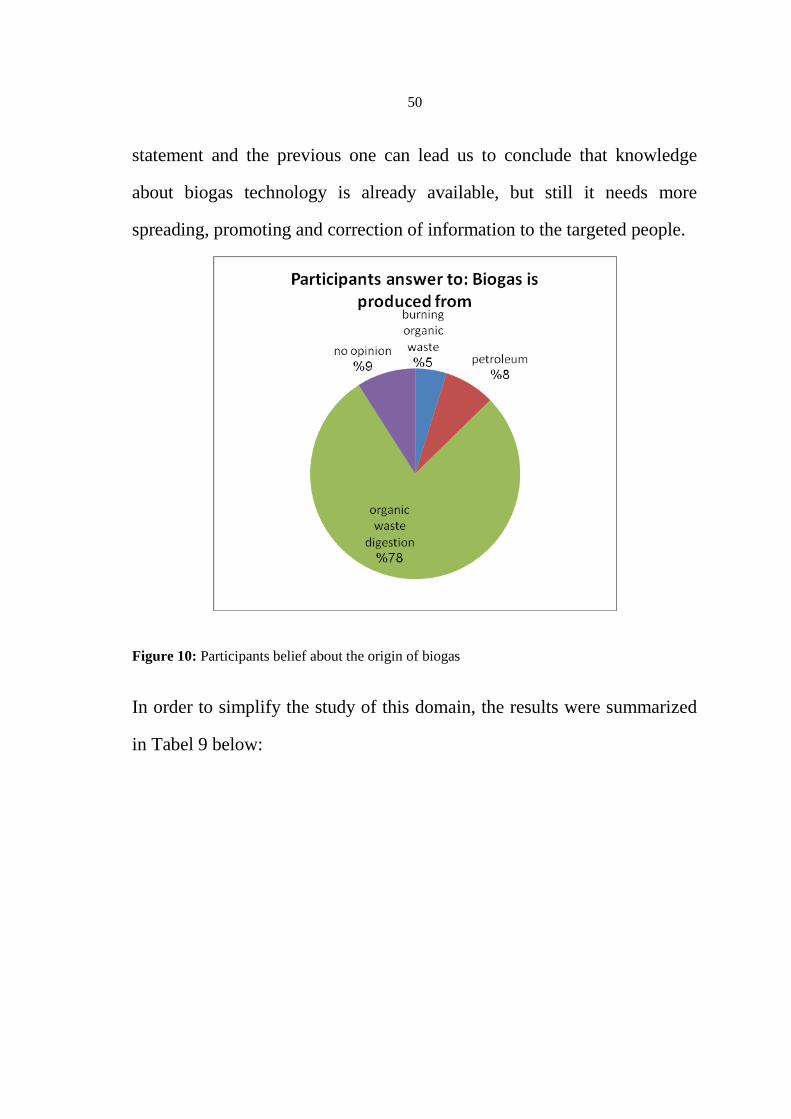
50
statement and the previous one can lead us to conclude that knowledge
about biogas technology is already available, but still it needs more
spreading, promoting and correction of information to the targeted people.
Figure 10: Participants belief about the origin of biogas
In order to simplify the study of this domain, the results were summarized
in Tabel 9 below:

51
Table 9: Analysis of second domain
#
statement Statement
Direction
of
statement
Average* Percentage Result
4
Using biogas
technology
reduces the final
waste volume.
+ve 4.30 86.1% +ve
5
The primary cost
of construction a
biogas unit is
high
+ve 3.50 70.1% +ve
6
The digestion of
organic waste
through biogas
technology
produces solid
and liquid
output.
+ve 3.75 75.0% +ve
7
The digestion of
organic waste
produces a
fertilizer for
plants.
+ve 4.14 82.8% +ve
8
Using biogas
technology had
positive impacts
on the
environment.
+ve 4.25 84.9% +ve
Average 3.99 79.8% +ve
* Max. Range and score is 5.
All the statements had positive results indicating that participants
knowledge about biogas technology is good.

52
In order to test whether there are significant differences between
participants knowledge about biogas and some variables (like gender, age,
housing, etc) the following research question was used:
Is there a statistically significant difference at level (0.05) in participant's
knowledge and understanding according to the following variables (gender,
age, number of family members, housing, work type, educational level,
average family income, home garden availability, raising animals near the
house, cleaning animals’ farm, and distance between the house and the
nearest household waste disposal site)?
To validate this question (T. test) was used to identify differences in
participant's knowledge about biogas according to the following variables
(gender, housing, home garden availability, raising animals near the house),
as shown in Table 10.

53
Table 10: The result of (T. test) to identify differences in knowledge
about biogas
Variables Mean Std. D Df t Sig.
(2-ailed)
Gender male 4.02 0.50 166
1.06
0.29
female 3.94 0.37
Housing separate house 4.00 0.45
154
0.54
0.59
apartment 3.94 0.50
Home
garden
availability
Yes 3.96 0.45 168
-1.27
0.20
No 4.07 0.50
Raising
animals
near the
house
Yes 4.02 0.50
159
0.49
0.63
No
3.99 0.41
The previous table indicates that there are no statistically significant
differences at the significance level (α = 0.05) in participant's knowledge
about biogas according to the following variables (gender, housing, home
garden availability, raising animals near the house), the value of statistical
significance respectively (0.29, 0.59, 0.20, 0.63), which are larger than
(0.05). ANOVA test was used to identify differences in participant's
knowledge about biogas according to the following variables (age, number
of family members, work type, educational level, average family income,
cleaning animals’ farm, distance between the house and the nearest
household waste disposal site) , as shown in Tabel 11.
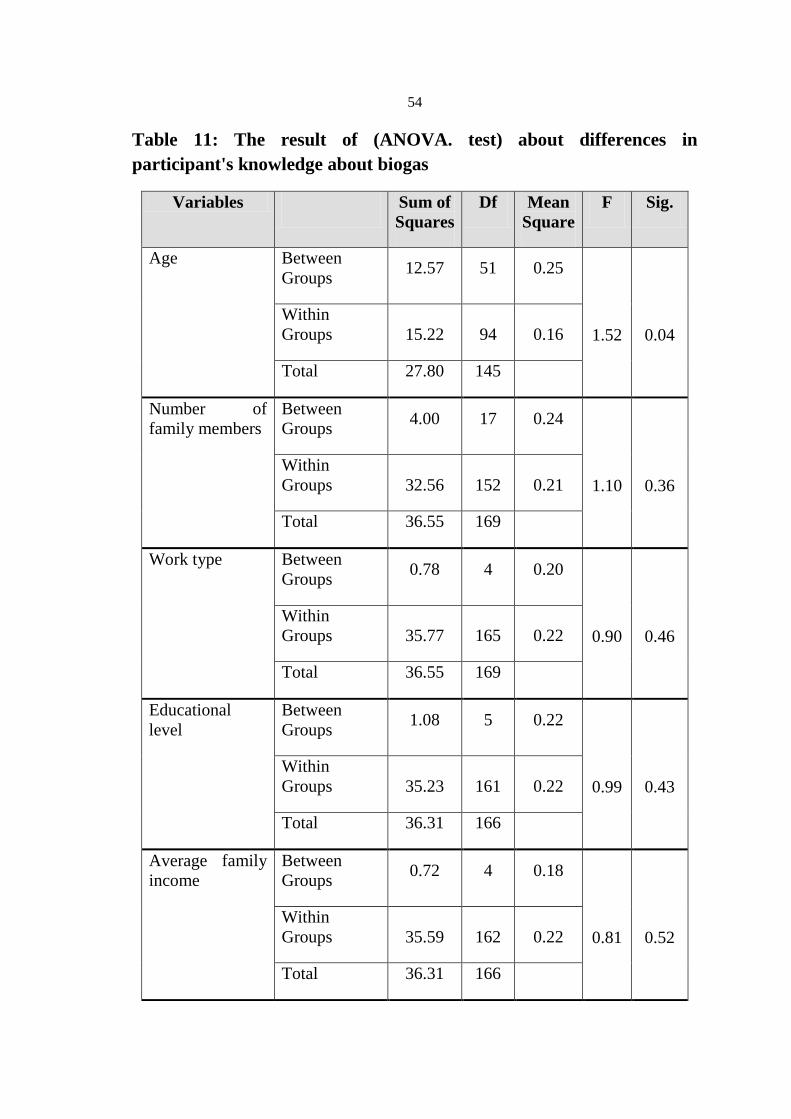
54
Table 11: The result of (ANOVA. test) about differences in
participant's knowledge about biogas
Variables Sum of
Squares
Df Mean
Square
F Sig.
Age Between
Groups 12.57 51 0.25
1.52
0.04
Within
Groups 15.22 94 0.16
Total 27.80 145
Number of
family members
Between
Groups 4.00 17 0.24
1.10
0.36
Within
Groups 32.56 152 0.21
Total 36.55 169
Work type Between
Groups 0.78 4 0.20
0.90
0.46
Within
Groups 35.77 165 0.22
Total 36.55 169
Educational
level
Between
Groups 1.08 5 0.22
0.99
0.43
Within
Groups 35.23 161 0.22
Total 36.31 166
Average family
income
Between
Groups 0.72 4 0.18
0.81
0.52
Within
Groups 35.59 162 0.22
Total 36.31 166

55
Cleaning
animals’ farm
Between
Groups 0.79 4 0.20
0.91
0.46
Within
Groups 35.77 165 0.22
Total 36.55 169
Distance
between the
house and
household waste
disposal site
Between
Groups 5.64 24 0.23
1.10
0.35
Within
Groups 30.92 145 0.21
Total 36.55 169
The previous table indicates that there are no statistically significant
differences at the significance level (α = 0.05) in participant's knowledge
about biogas according to the following variables (number of family
members, work type, educational level, average family income, cleaning
animals’ farm, distance between the house and the nearest household waste
disposal site), The value of statistical significance respectively are (0.36,
0.46, 0.43, 0.52, 0.46, 0.35), which are larger than (0.05).
And the previous table indicates that there is statistically significant
difference at the significance level (α = 0.05) in participant's knowledge
about biogas according to age, and this value of statistical significance is
(0.04), this value is less than (0.05). Younger participants seem to have
better knowledge about the biogas.

56
4.1.3 Third domain
This domain investigates the acceptance and willing to use biogas
technology. In order to simplify the study of this domain, the results were
summarized in Table 12 below.

57
Table 12: Analysis of third domain
#
statement Statement
Direction
of
statement
Average* Percentage Result
1
like to buy
and use
biogas unit
for the house
or farm.
+ve 4.18 83.6% +ve
3
will use
biogas
technology if
it will have
financial
profit on the
family.
+ve 4.29 85.8% +ve
4
there are
other
alternatives
better than
biogas
technology to
treat organic
waste
-ve 2.91 58.2% -ve
5
Do not mind
the
separation of
organic
waste
(kitchen and
garden
waste) from
other
household
waste.
+ve 4.11 82.2% +ve
6
operating a
biogas unit in
the house or
farm will
require a lot
time and
effort.
-ve 2.83 56.5% -ve

58
7
have fears
regarding the
quality of the
fertilizer
quality
resulting
from biogas
unit.
-ve 3.08 61.5% +ve
8
have fears
regarding my
ability to fix
it by my own
in case any
damage
occurs.
-ve 3.64 52.8% -ve
9
have fears
regarding the
unavailability
of
appropriate
expertise
capable of
following up
the unit and
its
maintenance.
-ve 2.59 51.8% -ve
Average 3.33 66.5% +ve
* maximum range and score is 5
The results of this domain indicate that most farmers are willing to use
biogas technology in their farms or homes if it has a financial profit, but
they also think that operating a biogas unit in the house or farm will require
a lot of time and effort.
Most participants have fears regarding their ability to fix the biogas unit in
case any damage occurred, in addition to their fears from the unavailability

59
of appropriate expertise capable of following up the unit and its
maintenance.
Most of the participants are willing to use biogas technology if its initial
construction cost is compensated within 1 year of operation. This requires
developing a biogas digester design that is considered cost efficient.
Figure 11: Payback period condition for biogas – willing to use
The overall result of this domain is positive indicating acceptance and
willing to use biogas technology but with some insurances such as
providing support and help in terms of unit maintenance and operation.
In order to test whether there are significant differences between
participants acceptance and willing to use biogas technology and some
variables (like gender, age, housing, etc) the following research question
was used:

60
Is there a statistically significant difference at level (0.05) in participants
acceptance and willing to use biogas technology according to the following
variables (gender, age, number of family members, housing, work type,
educational level, average family income, home garden availability, raising
animals near the house, cleaning animals’ farm, and distance between the
house and the nearest household waste disposal site)?
To validate this question (T. test) was used to identify differences in
participant's knowledge about participants acceptance and willing to use
biogas technology according to the following variables (gender, housing,
home garden availability, raising animals near the house), as shown in
Table 13.
Table 13: The results of (T. test) to identify differences in participants
acceptance and willing to use biogas technology.
Variables Mea
n
Std.
D
df t Sig.
(2-ailed)
Gender male 3.37 0.60
165 0.92 0.36 Female 3.29 0.47
Housing separate
house 3.37 0.55
154 0.68 0.50 apartment 3.28 0.58
Home garden
availability
Yes 3.34 0.51
167 -0.05 0.96 No 3.35 0.69
Raising
animals near
the house
Yes 3.35 0.60
159
0.18
0.86
No
3.33 0.53
The previous table indicates that there is no statistically significant
differences at the significance level (α = 0.05) in participants acceptance
and willing to use biogas technology according to the following variables

61
(gender, housing, home garden availability, raising animals near the house),
the value of statistical significances are respectively (0.36, 0.50, 0.96,
0.86), which are larger than (0.05).
ANOVA test was used to identify differences in participants acceptance
and willing to use biogas technology according to the following variables
(age, number of family members, work type, educational level, average
family income, cleaning animals’ farm, distance between my house and the
nearest household waste disposal site), as shown in Table 14.

62
Table 14: The results of (ANOVA test) about differences in
participants acceptance and willing to use biogas technology.
Variables Sum of
Squares
df Mean
Square
F Sig.
Age Between
Groups 14.47 25 0.28
0.94
0.60
Within
Groups 27.66 39 0.30
Total 42.13 542
Number of
family members
Between
Groups 8.37 17 0.49
1.67
0.06
Within
Groups 44.62 151 0.30
Total 53.00 168
Work type Between
Groups 1.16 4 0.29
0.92
0.46
Within
Groups 51.84 164 0.32
Total 53.00 168
Educational
level
Between
Groups 0.92 5 0.18
0.57
0.72
Within
Groups 51.97 160 0.32
Total 52.89 165
Average family
income
Between
Groups 0.16 4 0.04
0.12
0.98
Within
Groups 52.73 161 0.33
Total 52.89 165
Cleaning
animals’ farm
Between
Groups 0.40 4 0.10
0.31
0.87
Within
Groups 52.60 164 0.32
Total 53.00 168
Distance
between the
house and
household waste
disposal site
Between
Groups 8.53 24 0.36
1.15
0.30
Within
Groups 44.47 144 0.31
Total 53.00 168

63
The previous table indicates that there are no statistically significant
differences at the significance level (α = 0.05) in participants acceptance
and willing to use biogas technology according to the following variables
(age, number of family members , work type, educational level, average
family income, cleaning animals’ farm, distance between the house and the
nearest household waste disposal site). The value of statistical significances
are respectively (0.60,0.06, 0.46, 0.72, 0.98, 0.87, 0.30), which are larger
than (0.05).
4.1.4 Fourth domain
Results show that most of the participants prefer to use biogas in cooking
(68%) which is considered one of the easiest and simplest ways to use
biogas. Figure 12 below shows the distribution of the participants opinion
toward the preferred use of biogas.
Figure 12: Participants preferability of using biogas.

64
Table 15: Analysis of fourth domain
#
statement Statement
Direction
of
statement
Average* Percentage Average
2
Would like to
use the fertilizer
resulting from
biogas
technology at the
farm or garden.
+ve 4.21 84.2% +ve
3
Using biogas is
preferred on the
house level.
+ve 4.21 84.3% +ve
4
Using biogas is
environmentally
and
economically
feasible.
+ve 14.32 86.4% +ve
Average 4.25 85.0% +ve
In order to test whether there are significant differences between utilizing
preferability and some variables (like gender, age, housing, etc) the
following research question was used:
Is there a statistically significant difference at level (0.05) in utilizing
preferability according to the following variables (gender, age, number of
family members, housing, work type, educational level, average family
income, home garden availability, raising animals near the house, cleaning
animals’ farm, and distance between the house and the nearest household
waste disposal site)?
To validate this question (T. test) was used to identify differences in
utilizing preferability according to the following variables (Gender,
Housing, Home garden availability, Raising animals near the house), as

65
shown in Table 16.
Table 16: Results of (T. test) to identify differences in utilizing
preferability
Variables Mean Std. D Df T Sig.
(2-ailed)
Gender Male 4.32 0.51 159 2.53 0.01
Female 4.10 0.47
Housing separate
house 4.24 0.48
148 0.43 0.67
apartment 4.19 0.59
Home
garden
availability
Yes 4.26 0.49
161 0.65 0.52 No 4.21 0.54
Raising
animals
near the
house
Yes 4.27 0.50
153 0.36 0.72 No
4.24 0.51
The previous table indicates that there are no statistically significant
differences at the significance level (α = 0.05) in utilizing preferability
according to the following variables (housing, home garden availability,
raising animals near the house), The value of statistical significances are
respectively (0.67, 0.52, 0.72), which are larger than (0.05).
And the previous table indicates that there is statistically significant
difference at the significance level (α = 0.05) in utilizing preferability
according the variable gender, and this value is of statistical significance
(0.01), which is less than (0.05).
ANOVA test was used to identify differences in utilizing preferability
according to the following variables (age, number of family members,
work type, educational level, average family income, cleaning animals’

66
farm, distance between my house and the nearest household waste disposal
site) , as shown in Table 17.
Table 17: The result of (ANOVA. test) about differences in utilizing
preferability.
Variables Sum of
Squares
df Mean
Square
F Sig.
Age Between
Groups 15.48 50 0.31
1.61 0.02 Within
Groups 17.31 90 0.19
Total 32.80 140
Number of family
members
Between
Groups 4.54 17 0.27
1.06 0.40 Within
Groups 36.53 145 0.25
Total 41.08 162
Work type Between
Groups 0.52 4 0.13
0.51 0.73 Within
Groups 40.55 158 0.26
Total 41.08 162
Educational level Between
Groups 1.95 5 0.39
1.56 0.17 Within
Groups 38.32 154 0.25
Total 40.27 159
Average family
income
Between
Groups 0.36 4 0.09
0.35 0.84 Within
Groups 39.91 155 0.26
Total 40.27 159
Cleaning animals’
farm
Between
Groups 1.84 4 0.46
1.85 0.12 Within
Groups 39.24 158 0.25
Total 41.08 162
Distance between
my house and
household waste
disposal site
Between
Groups 4.86 24 0.20
0.77 0.77 Within
Groups 36.22 138 0.26
Total 41.08 162

67
The previous table indicates that there are no statistically significant
differences at the significance level (α = 0.05) in utilizing preferability
according to the following variables (number of family members, work
type, educational level, average family income, cleaning animals’ farm,
distance between my house and the nearest household waste disposal site),
The value of statistical significances are respectively (0.40,0.73, 0.17, 0.84,
0.12, 0.77), which are larger than (0.05).
And The previous table indicates that there is statistically significant
difference at the significance level (α = 0.05) in utilizing preferability
according to age, and this value is of statistical significance (0.02), this
value is less than (0.05).
4.1.5 Fifth domain
The results indicate that almost 41% of the participants prefer the biogas
technology to be managed individually, while the remaining 59% prefer it
to be jointly. Each management choice has its own advantages and
disadvantages. Table 18 below shows the analysis of this domain, the
average and percentage of each statement is calculated in order to compare
the result of statements 2, 4, 5 and 6. Each statement is then ranked to order
them according to the most preferred management options. The least
percentage took rank 1.

68
Table 18: Analysis of fifth domain
#
statement Statement Average* Percentage Rank
2
Would like to use
biogas unit in my
house and by house
management only.
2.31 46.3% 1
3
If biogas unit
management is
joint, I would like to
participate in a
management
committee
regarding it.
2.03 40.5% -
4
Recommend the
biogas technology
to be managed by
private company.
2.57 51.4% 3
5
recommend the
biogas technology
to be managed by
the government or
its local
representatives.
2.50 50% 2
6
recommend the
biogas technology
to be managed by
joint stock
company.
2.60 52% 4
Results of the statements answers to this domain are so close to each other,
but generally the most preferred management of biogas technology is by
house management only.

69
4.1.6 Sixth domain
The results indicate that 70% of the participants don’t know the family
income from using biogas technology.
Table 19: Analysis of sixth domain.
#
statement Statement Average* Percentage Rank
2 recommend the income
of biogas technology to
be distributed on the
village inhabitance.
2.21 44.2% 3
3 recommend the income
of biogas technology to
be distributed on the
village inhabitance
according to their
participation level.
2.08 41.5% 2
4 recommend that the
government participate
in biogas technology
establishment cost.
1.93 38.6% 1
As the previous table shows, the participants prefer the government to
participate in the establishment cost. Worldwide, studies have shown that
the most successful biogas projects are those subsidized by the government
or other NGOs. But the people who will benefit from the biogas should
have some financial stake in the construction or they may not have a
sufficient sense of ownership to maintain the plant.
70
4.2 Experimental Results and Discussion.
In order to simplify the analysis of the experimental results, each of the
phases were studied separately then the results of all the phases are
compared to the other.
4.2.1 Phase 1 results: Cow manure mixed with household waste.
At this phase a quantity of 6 kg of cow manure was mixed with 6 kg of
household waste (food residues) and 12 kg of water then added daily at the
early morning (at 7:00 AM). The biogas was collected almost 4 times a
day. The collection was 3 times at daytime and 1 time at night, this is
because it was noticed that the generation rate is higher during the day than
at night (this maybe due to the appropriate temperature when the sun is
present).
Appendix II have the detailed biogas quantities produced. The average
biogas production rate during 16 days was 1184.7 gm/day with 65.6
standard deviation.
Figure 13 below illustrates the biogas quantity produced by time at this
phase.

71
Figure 13: Biogas quantity produced by time at phase 1
The biogas production during this phase ranged from 1080-1300 gm/day.
With the minimum production at days the first and third days. The
maximum production was at day number 4. But in general the biogas
production can be considered almost stable with slight fluctuations. The
fluctuations are best explained due to the temperature fluctuations as it is
known that biogas production rate is affected by the temperature.
The total quantity of biogas produced during this phase is 18.955 kg
(almost 19 kg).
Based on daily feeding rate of the biogas digester, taking cow manure and
household waste as the waste input, the average kilograms of biogas
produced per kilograms of waste added is calculated:
Biogas in kg / kg of mixed waste = 19 / 192 = 0.099 kg biogas per kg
waste. This is almost 10% of the waste is converted into biogas.

72
4.2.2 Phase 2 results: Cow manure.
At this phase a quantity of 12 kg of cow manure and 12 kg of water where
mixed and added daily. The biogas was collected almost 4 times a day. The
collection was 3 times at daytime and 1 time at night.
Appendix II have the detailed biogas quantities produced. The average
biogas production rate during 16 days was 1414.1 gm/day with a 120.8
standard deviation.
Figure 14 below illustrates the biogas quantity produced by time at this
phase.
Figure 14: Biogas quantity produced by time at phase 2
The biogas production during this phase ranged from 1040-1520 gm/day.
With the minimum production at day number 1 and the maximum at day
number 5.

73
The total quantity of biogas produced during this phase is almost 22.6 kg
biogas.
Based on daily feeding rate of the biogas digester, taking cow manure and
household waste as the waste input, the average kilograms of biogas
produced per kilograms of waste added is calculated:
Biogas in kg / kg of mixed waste = 22.6 / 192 = 0.117 kg biogas per kg
waste. This is almost 11% of the waste is converted into biogas.
4.2.3 Phase 3 results: Sheep manure.
At this phase a quantity of 12 kg of sheep manure and 12 kg of water where
mixed and added daily. The biogas was collected almost 4 times a day. The
collection was 3 times at daytime and 1 time at night.
Appendix II have the detailed biogas quantities produced. The average
biogas production rate during 16 days was 1433.8 gm/day with a 105.2
standard deviation.
Figure 15 below illustrates the biogas quantity produced by time at this
phase.

74
Figure 15: Biogas quantity produced per time at phase 3
The biogas production during this phase ranged from 1240-1600 gm/day.
With the minimum production at day number 1 and the maximum at day
number 10.
The total quantity of biogas produced during this phase is almost 22.9 kg
biogas.
Based on daily feeding rate of the biogas digester, taking cow manure and
household waste as the waste input, the average kilograms of biogas
produced per kilograms of waste added is calculated:
Biogas in kg / kg of mixed waste = 22.9 / 192 = 0.119 kg biogas per kg
waste. This is almost 12% of the waste is converted into biogas.
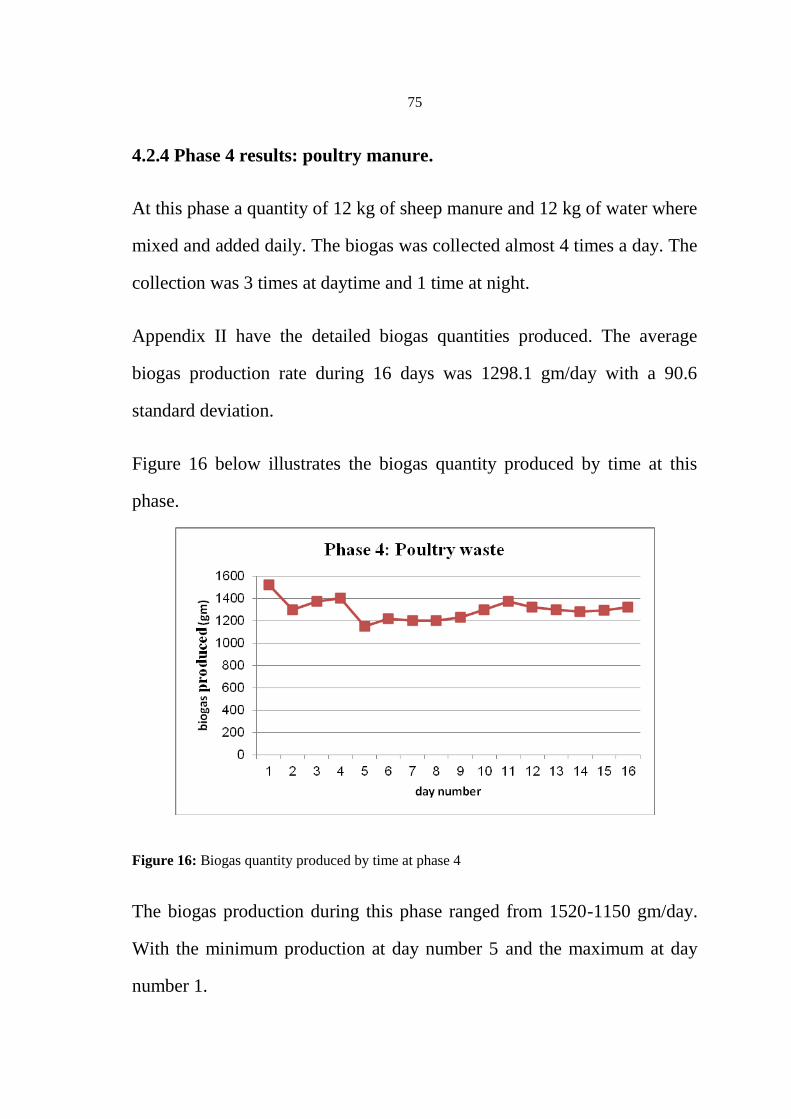
75
4.2.4 Phase 4 results: poultry manure.
At this phase a quantity of 12 kg of sheep manure and 12 kg of water where
mixed and added daily. The biogas was collected almost 4 times a day. The
collection was 3 times at daytime and 1 time at night.
Appendix II have the detailed biogas quantities produced. The average
biogas production rate during 16 days was 1298.1 gm/day with a 90.6
standard deviation.
Figure 16 below illustrates the biogas quantity produced by time at this
phase.
Figure 16: Biogas quantity produced by time at phase 4
The biogas production during this phase ranged from 1520-1150 gm/day.
With the minimum production at day number 5 and the maximum at day
number 1.

76
The total quantity of biogas produced during this phase is 20.8 kg.
Based on daily feeding rate of the biogas digester, taking cow manure and
household waste as the waste input, the average kilograms of biogas
produced per kilograms of waste added is calculated:
Biogas in kg / kg of mixed waste = 20.8 / 192 = 0.108 kg biogas per kg
waste. This is almost 11% of the waste is converted into biogas.
4.2.5 Comparison between biogas productions at all phases
The biogas produced from the digestion of each waste type is different
from the others. Table 20 below summarizes the average biogas quantity
produced from different waste mixtures through the experiment period.
Table 20: Average biogas quantity produced from different waste
mixtures
Phase # Waste added
Average biogas
produced
(gm/day)
Standard
deviation
1 Mixed cow manure and
food residues 1187.7 65.6
2 Cow manure 1414.1 120.8
3 Sheep manure 1433.8 105.2
4 Poultry manure 1298.1 90.6
Table 21 below compares between the total biogas produced from each
phase and their ranks. It is apparent that phase 3 (sheep manure) produced
the largest biogas quantity during the experiment followed by phase 2 (cow

77
manure), phase 4 (poultry manure) and phase 1 (mixed cow and food
residues) respectively.
Table 21: Detailed biogas quantities produced from different waste
mixtures
Biogas quantity produced (gm/day)
day
number
Phase1
(mixed cow +
food)
phase 2
(cow)
phase 3
(sheep)
phase4
(poultry)
1 1080 1040 1240 1520
2 1120 1425 1320 1300
3 1095 1330 1250 1370
4 1300 1505 1420 1400
5 1120 1520 1520 1150
6 1200 1460 1450 1220
7 1240 1390 1320 1200
8 1205 1400 1500 1200
9 1230 1425 1450 1230
10 1185 1290 1600 1300
11 1240 1380 1520 1370
12 1120 1530 1530 1320
13 1215 1485 1500 1300
14 1125 1470 1470 1280
15 1250 1500 1370 1290
16 1230 1475 1480 1320
Total
(gm)
18955 22625 22940 20770
Approx
Total
(kg)
19.0 22.6 22.9 20.8
Rank 4 2 1 3
The figure below (Figure 17) compares between the biogas produced from
different waste mixtures via time.

78
Figure 17: Comparing biogas produced at all phases
Figure 18: Total biogas production for different waste mixtures
SAS software was used to estimate the least square means of biogas
production from the four waste mixtures and to plot measured versus
predicted biogas production.

79
ANCOVA test was used to estimate the least squares means (adjusted
means) of gas production from four waste types. Table 22 shows the
results. (see Appendix II for the complete analysis).
Table 22: ANCOVA test results.
Waste type Least squares means
(LSMEANS)
Phase 1 1310.9 a
Phase 2 1349.2a
Phase 3 1344.3a
Phase 4 1326.2a
In Table 22 the means that are in the same column with similar superscripts
are not significantly different (P > 0.05) using Tukey-Kramer adjustment
for multiple comparisons.
The results indicate that there is no statistically significant differences at
the significance level (α = 0.05) in biogas production for the different waste
mixtures.

80
Y_Pr edi ct ed
1000
1100
1200
1300
1400
1500
1600
Y_measur ed
1000 1100 1200 1300 1400 1500 1600
Figure 19: Plot of predicted biogas production vs. measured biogas values (ANCOVA analysis
model)
In order to clarify the relationship between biogas production from the four
mixtures and the temperature and time statistically, nonlinear procedure of
SAS was used. The nonlinear analyses were based on the following model:
Y = C*(Time)X1
* (Temp)X2
, where Y is gas emission
Estimates and standard error (SE) are summarized in
Table 23 below. (Detailed analyses are in Appendix IV).
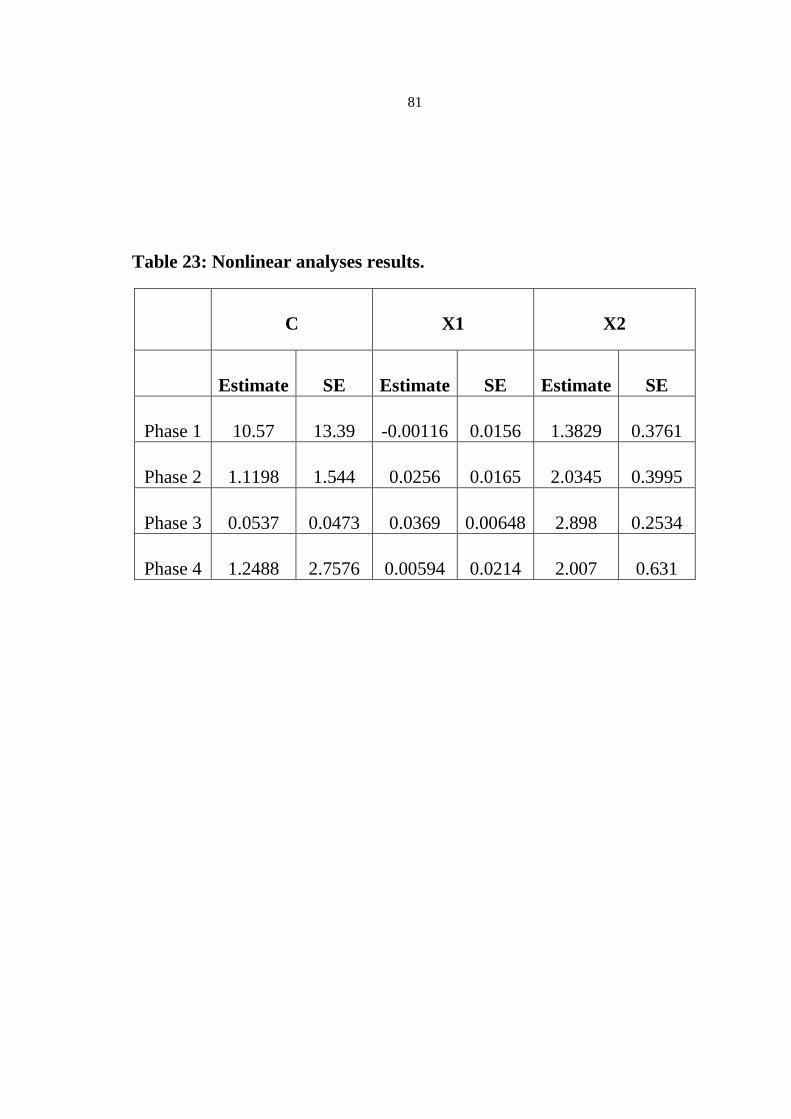
81
Table 23: Nonlinear analyses results.
C X1 X2
Estimate SE Estimate SE Estimate SE
Phase 1 10.57 13.39 -0.00116 0.0156 1.3829 0.3761
Phase 2 1.1198 1.544 0.0256 0.0165 2.0345 0.3995
Phase 3 0.0537 0.0473 0.0369 0.00648 2.898 0.2534
Phase 4 1.2488 2.7576 0.00594 0.0214 2.007 0.631

82
Y_Pr edi ct ed
900
1000
1100
1200
1300
1400
1500
1600
Y_measur ed
1000 1100 1200 1300 1400 1500 1600
Figure 20: Plot of predicted biogas production vs. measured biogas values (Nonlinear analysis
model).
4.2.6 Biogas versus Liquefied Petroleum Gas (LPG).
Cooking stoves can be designed to operate on various types of fuels, these
fuels are:
Solid fuels: for example wood and animal dung.
Liquid fuels: for example kerosene and alcohol.
Gaseous fuels: for example natural gas, LPG and biogas. (Center for
Energy Studies, 2001)

83
The fuels under this research study are biogas versus LPG because in
Palestine, LPG is the main fuel used for cooking. It is supplied to the
homes through pressurized cylinders.
The overall efficiency of any stove depends on various factors or
conditions:
Environmental conditions, such as wind, temperature, pressure
Shape, specific heat capacity and weight of vessel.
Burner size of stove and size of bottom face of cooking vessel.
Energy content of fuel and quality of fuel. (Center for Energy Studies,
2001)
LPG is composed primarily of propane and butane, while biogas contains
methane. LPG, vaporised and at atmospheric pressure, has a higher
calorific value (44 MJ/kg) than biogas (32-36 MJ/kg) (Mukunda, 2009),
which means that LPG cannot simply be substituted for biogas.
Taking the average of the heat value of biogas, the ratio between the heat
content of LPG to the heat content of methane is: (44 MJ/kg LPG) / (34
MJ/kg biogas) = 1.3.
An experiment was conducted in order to estimate a conversion factor
between the family requirements of biogas if it replaced LPG.

84
The results indicate that the biogas weight required for producing
continuous flame – strong enough to cook rice – for one and a half hour is
280 gm. While the weight of LPG required for producing the same
continuous flame for the same period of time is 120 gm.
The conversion factor= (LPG weight / biogas weight) * 1.3
= (280/120) * 1.3 = 2.99 ; approximated to 3.
This means that if a family needs 12 kg bottle of LPG every month, their
biogas requirements= 3 *12 = 36 kg biogas.
So, the 12 kg bottle of LPG is equivalent to 36 kg of biogas.
4.2.7 Biogas coverage ratio for the needs of the family.
According to the experimental results discussed in the previous sections,
operating the biogas unit at the same conditions carried out in this study
produces 19-23 kg of biogas. As estimated in the previous section, the 12kg
bottle of LPG is equivalent to 36 kg of biogas.
Assuming that the family needs 1 bottle (12 kg) of LPG to cover their
energy needs, the lowest and highest biogas coverage ratio for the needs of
the family are:
The lowest coverage ratio = 19/30 = 63%
The highest coverage ratio = 23/30 = 76%

85
Average coverage ratio is 69.5%.
4.2.8 Theoretical estimation of methane content by weight in biogas.
Methane content of biogas should be estimated. In order to do so, several
samples of the produced biogas from each waste mixture were gathered
then analyzed using gas chromatography. Unfortunately, the results were
irrational due to several possible reasons, among which is the unavailability
of lab technician experienced in gas analysis.
An assumption was made to overcome this problem; Biogas is generally
composed of 60% methane by volume. Since all the measurements taken
were based on weight of the produced biogas, the weight percentage of
methane in biogas can be calculated:
Calculate the mass fractions of CH4 and CO2:
The molecular weight of methane is:
1 (C) x 12 g/mol + 4 (H) x 1 g/mol = 16 g/mol
The molecular weight of carbon dioxide is:
1 (C) x 12 g/mol + 2 (O) x 16 g/mol = 44 g/mol
Calculate the mass quantities of CH4 and CO2:
From the ideal gas law, we know that mole fractions are essentially the
same as volume fractions. Using this approximation, we can calculate the

86
mass fraction of methane from the volume fraction and the molecular
weights (assuming that biogas is 60% by volume methane):
biogas g
CH g35.0
2.27
6.9
/molg 44 /molmol 0.4 /molg 16 /molmol 0.6
/molg 16 /molmol 0.6
mass CO mass CH
mass CH
mass biogas
mass methane
4
CO2CO2biogasCO2CH4CH4biogasCH4
CH4CH4biogasCH4
24
4
Thus, biogas is assumed to be 35% by weight methane.

87
Chapter Five
Financial Evaluation of a Biogas Digester

88
There are many economic considerations in biogas production projects
arising from the initial investment, operation and maintenance, and use of
the by-products.
The financial analysis for constructing family biogas unit is based on the
design of the biogas unit used in this research study and on a waste feeding
rate of 12 kg/day. Figure 21 below shows the unit used containing all the
components.
Figure 21: The proposed biogas plant design.

89
5.1 Initial investment
After consulting some experienced people in the market prices of the
material required in addition to the personal experience gained by the
researcher, the cost for constructing the used biogas unit may be estimated
as follows:
Table 24: Requirements and cost for constructing family biogas unit.
Requirements Cost (NIS)
1500 L tank 420
1000 L tank 370
Gas and fertilizer valves and connectors 200
Metal base 180
Plastic pipes 80
Miscellaneous 50
Total 1300
As shown in the previous table, the initial investment to construct a floating
tank biogas unit is 1300 NIS. The electric waste shredder was not included
in estimating the cost of a biogas unit, this is because from the researcher
experience it was concluded that using electric waste shredder is not
practical to deal with and it requires electricity source to operate.

90
5.2 Monthly Running cost
The monthly running cost for operating the family biogas plant may come
from replacing some of the used gas transporting pipes, replacing some
valves or hiring a laborer to fix or clean the unit. In addition to that, the
price of using water in the digester in the case of using clean water instead
of waste water.
The cost of hiring a laborer or fixing the biogas unit is approximated to 120
NIS/year; that is 10 NIS/month.
The water needed to operate the biogas unit in similar waste addition rate
as this study is 12 kg/day; that is 0.012 m3/day. According to Palestinian
Central Bureau of Statistics PCBS, the price of 1 m3 of water is 4-5 NIS.
(PCBS, 2013)
So, water monthly cost = water used per day* 30 day * water price per m3.
Monthly water cost= 0.012 m3/day * 30 days * 5NIS/m
3 = 1.8 NIS
To approximate the calculations 1.8 NIS is assumed approximately 2 NIS.
Total monthly running cost = 10 NIS + 2 NIS = 12 NIS.
5.3 Biogas and organic fertilizer profit
The biogas unit produces both biogas and organic fertilizer. The economic
benefits from biogas are difficult to define. Biogas as a fuel cannot be sold
on the open market, so its value must be defined in terms of other fuel, in

91
this research study biogas is assumed to replace LPG since it is the main
cooking fuel in Palestine. The profit from biogas and the organic ferilizer
can be estimated as follows:
Biogas profit: Based on the experiment results, the biogas produced is
sufficient to provide for the family needs of cooking fuel; this means it is
sufficient to replace the LPG that is usually used for cooking. An average
Palestinian family needs one 12 kg-bottle of LPG per month. The price of
LPG in West Bank- Palestine fluctuates due to some political reasons. But
on average the price of 12kg bottle is 65 NIS.
So, the biogas profit = 65 NIS/month.
Fertilizer profit: the biogas unit produces organic fertilizer. The fertilizer
produced can save the family the cost of buying fertilizers from the market
for their farm or garden and can sell the surplus to neighboring farmers.
According to (El-Jaber, 1993) as cited by (Hassan, 2004) the organic matter
contains from 65-90% volatile solids and 30-60% of the volatile solids
(depending on the type of the organic matter) is converted by anaerobic
digestion into biogas. If the averages for the previous percentages (77.5%
and 45% respectively) are taken for calculations then:
The amount of organic waste (introduced into the digester) that is
converted into biogas
= monthly loaded organic waste weight X 77.5% X 45%.

92
In the case of adding 12 kg organic waste per day, the amount of organic
waste that is converted to biogas monthly
= 12 kg/day * 30 days * 77.5% * 45% = 125.6 kg biogas / waste
Then; the amount of organic matter that is left as a fertilizer each month
= amount added monthly – converted amount into biogas
=12 kg/day * 30 day – 125.6 kg = 234.4 kg.
That is, almost 234 kg of fertilizer is produced per month from the biogas
unit.
According to Palestinian ministry of agriculture, the cheapest fertilizer
available at Palestinian markets is ammoniac which cost to consumer 62
NIS for the 25 kg bag. Assuming that the fertilizer produced can be sold at
10% of ammoniac price, this assumption is made because the produced
fertilizer is in a liquid form and is not processed enough to gain a higher
price, then the produced fertilizer is salable at:
62 NIS/ (25 kg) * 10% = 0.25 NIS/kg
So, the fertilizer profit = 234 kg/month * 0.25 NIS/kg = 58.5 NIS/month.
5.4 Total profit
The total monthly profit from running the biogas digester is the sum of
biogas profit and fertilizer profit subtracting the running cost. But to be

93
more realistic, some people may not sell the produced fertilizer. So, two
cases are made to find out the total profit from each, the cases are:
The first case: assumes selling the fertilizer in addition to using the biogas.
The second case: assumes using biogas only without selling the fertilizer.
In the first case (selling the fertilizer in addition to using biogas) the total
monthly profit = Biogas profit + fertilizer profit – running cost
= 65 NIS + 58.5 NIS – 12 NIS = 111.5 NIS
In the second case (using biogas only without seling the fertilizer) the total
monthly profit = Biogas profit – running cost
= 65 NIS – 12 NIS = 53 NIS
5.5 The simple payback period
The simple payback period is calculated for the two cases mentioned in the
previous section.
The simple payback period = initial investment / monthly profit
In the first case (selling the fertilizer in addition to using biogas) the simple
payback period = 1300 / 11.5 = 11.6 months, approximated to 1 year.
While in the second case (using biogas only without selling the fertilizer)
the simple payback period = 1300 / 53 = 24.5 months, approximated to 2
years.

94
This means that the Palestinian family will get back their initial investment
of constructing a floating tank biogas unit within 1-2 years. This time
period is considered reasonable.
Hassan and Al Sadi reported a close payback period for constructing family
sized biogas units in Palestine; they both reported 1.8 years as the payback
period (Hassan, 2004) (Al Sadi, 2010).

95
Chapter Six
Main Findings and Recommendations

96
6.1 Main Findings
The following are the main findings of this research study:
There is a relatively good knowledge about biogas in the Palestinian
communities, since 80% of the surveyed people have previously heard
about biogas and 78% of them knew that biogas is produced through the
digestion of organic waste.
Positive trends are detected toward knowledge, acceptance and willing to
use biogas technology in the rural Palestinian communities.
Results indicated that 68% of the surveyed population prefer to use biogas
as fuel for cooking – in case they adopted the technology-.
Results indicated that 60% of the surveyed population prefer to use biogas
if the payback period is within 1 year; it is concluded through the economic
evaluation that the payback period is 1-2 years. This is considered
reasonable and acceptable.
The biogas quantity produced from the four waste mixtures is 1.18-1.43
kg/day, which represents a financial added value to rural families.
The weight of biogas requirement is almost 3 times more than the
requirement of LPG, which indicates that the 12 kg bottle of LPG is
equivalent to 36 kg of biogas.

97
The initial investment to construct a floating tank biogas unit is 1300 NIS,
the monthly running cost is 12 NIS. The simple payback period is 1 year if
the fertilizer is sold in the market and 2 years if the fertilizer is not sold.
This time period is considered reasonable.
Using positive results obtained in this study, biogas technology should be
encouraged and promoted in rural Palestinian communities due to several
reasons:
The most followed method of disposing animal waste is through fertilizing
the plants; the adoption of biogas technology does not only provide energy
source, but also produces organic fertilizer for plants.
Using biogas technology reduces the amount of waste that is diverted to
landfills, abandoned or burned. Thus; reduces the cost of waste disposal,
save landfill space and reduces environmental and health subsequences
arising from inappropriate disposal.
6.2 Recommendations
Promotion and dissemination of the benefits of biogas should be carried out
and target the rural areas where feedstock is available.
Subsidies (from government or NGOs) should be provided for rural
families to help in constructing biogas plants, keeping in mind that those
who will use the biogas should have some financial stake in the

98
construction or they may not have a sufficient sense of ownership to
maintain the plant.
Encourage the private sector investment in biogas technology because this
will support sustainability.
Each biogas project should be economically and socially studied to ensure
its success and continuity.
Government should adopt green energy incentives scheme to ensure the
success of small scale biogas projects.

99
References
Al Sadi, Mansour. 2010. Design and building of biogas digester for
organic material gained from solid waste. Nablus, Palestine : An-
Najah National University, 2010. p. 151, Master Thesis.
Al Seadi, T. 2001. Good practice in quality management of AD
residues from biogas production. Oxfordshire : IEA Bioenergy and
AEA Technology Environment, 2001. Report made for the
International Energy Agency, Task 24- Energy from Biological
Conversion of Organic Waste.
Al Seadi, T, et al. 2008. Biogas handbook. [ed.] T Al Seadi. Denmark :
University of Southern Denmark Esbjerg, 2008.
Biogas as a potential renewable energy source: A Ghanaian case
study. Arthur, Richard, Baidoo, Martina Francisca and Antwi, Edward.
2011. 2011, ELSEVIER, pp. 1510-1516.
British Biogen. 1997. Anaerobic digestion of farm and food
proccessing residues. London : s.n., 1997.
Brown, B, Yiridoe, E and Gorden, R. 2007. Impact of single versus
multiple policy options on the economic feasibility of biogas energy
production: Swine and dairy operations in Nova Scotia. Energy
Policy. 2007, Vol. 35, pp. 4579-4610.
100
Buchenrieder, G and Mollers, J. 2009. Structural Change in Europe’s
Rural Regions – Farm Livelihoods Between Subsistence Orientation,
Modernization and Non-farm Diversification. 2009. pp. 113-133. Vol.
49 of IAMO Studies Series.
Center for Energy Studies. 2001. Efficiency Measurement of Biogas,
Kerosene and LPG Stoves. Institute of Engineering, Tribhuvan
University. Lalitpur, Nepal : Biogas Support Program , 2001. study
report.
Clemens, J., et al. 1999. Mitigation of greenhouse gas emissions by
anaerobic digestion of cattle slurry. 1999. pp. 171-177.
DEFRA. 2004. Review of Environmental and Health Effects of
Waste Management: Municipal Solid Waste and Similar Wastes.
[Online] 2004. [Cited: Dec 26, 2011.]
http://www.foe.co.uk/resource/briefings/anaerobic_digestion.pdf.
Friends of the earth. 2007. Briefing anaerobic digestion. UK : s.n.,
2007.
Fulford, David. 1988. Running a biogas programme: A handbook.
London : Intermediate technology publications, 1988.
Hassan, Medyan. 2004. The feasibility of family biogas production
from mixed organic wastes in Palestinian rural areas. Nablus,
Palestine : An-Najah National University, 2004. p. 178, Master Thesis.

101
IEA Bioenergy. 2011. Systems and markets overview of anaerobic
digestion. Oxfordshire : AEA Technology Environment, 2011.
Lardinois, Inge and van de Klundert, Arnold. 1993. Organic waste
options for small-scale resource recovery. 1st Edition. s.l. : TOOL,
Amsterdam and WASTE Consultants, Gouda, 1993.
Monet, Fabian. 2003. An Introduction to Anaerobic Digestion of
Organic Waste. Remade Scotland. 2003.
Mukunda, H. S. 2009. Understanding Combustion. India : Universities
Press, 2009. p. 184. Vol. 2.
Naskeo Environement. n.d. Biogas composition. Biogas renewable
energy. [Online] n.d. [Cited: April 6, 2013.] http://www.biogas-
renewable-energy.info/biogas_composition.html.
Nepal Ministry of Water Resources. 1993. Energy Sector Synopsis
Report. Water and Energy Commission Secretariat. Nepal : His
Majesty's Government of Nepal Ministry of Water Resources, 1993.
PCBS. 2013. Palestinian Central Bureau of Statistics Report.
Palestine : s.n., 2013.
Pipatmanomai, S, Kaewluan, S and Vitidsant, T. 2009. Economic
assessment of biogas-to-electricity generation system with H2S
removal by activated carbon in small pig farm. Applied Energy.
2009, Vol. 86, pp. 669–674.

102
Pöschl, M, Owende, Ph and Ward, Sh. 2010. Evaluation of energy
efficiency of various biogas production and utilization pathways.
Applied Energy. 2010, Vol. 87, pp. 3305–3321.
Remais, J, Chen, L and Seto, E. 2009. Leveraging rural energy
investment for parasitic disease control: schistosome ova
inactivation and energy co-benefits of anaerobic digesters in rural
China. PLoS One. 2009.
RISE-AT. 1998. Review of Current Status of Anaerobic Digestion
Technology for Treatment of Municipal Solid Waste. Chiang Mai
University. s.l. : Regional Information Service Center for South East
Asia on Appropriate Technology, 1998.
Smith, K. 2000. Greenhouse gases from small-scale combustion in
developing countries: an analysis for India. Annual Review of Energy
and the Environment. 2000.
Song, Y.C, Kwon, S.J and Woo, J.H. 2004. Mesophilic and
thermophilic temperature co-phase anaerobic diges tion compared
with single-stage mesophilic- and thermophilic digestion of sewage
sludge, Water Res. 2004.
Verma, Shefali. 2002. Anaerobic digestion of biodegradable organics
in municipal solid waste. s.l. : Columbia University, 2002. Master
thesis.

103
Wastesum. 2006. Management and Valorisation of Solid Domestic
Waste for the Small Urban Communities in Morocco. s.l. : Eurepean
Commission , 2006.
White, P, Franke, M and Hindle, P. 1995. Integrated solid waste
management: a life cycle inventory. London : Champman and Hall,
1995.
Yu, L. 2008. Popularizing household-scale biogas digesters for rural
sustainable energy development and greenhouse gas. Renewable
Energy. 2008.
53395
5339

100
Appendix I
In the name of God the Merciful
An-Najah National University
Faculty of Graduate Studies
Questionnaire
Peace be upon you and God's mercy and blessings
This questionnaire is designed to gather information about the knowledge
of the Palestinian community concerning biogas technology, and their
acceptance and willing to use biogas technology at the household level. It
also aims to gather information concerning your opinion in the methods
used to dispose household, animal and agricultural waste and its effects on
the surrounding environment at the study society.
Biogas is produced from the digestion of organic animal, plant, human and
some industrial waste in the absence of oxygen. This is performed in a
special chamber working under specified conditions. The produced biogas
can be used as a source of fuel (cooking fuel, electricity production,
running vehicles , etc).
In addition to biogas, this process produced organic fertilizer that can be
used to improve the production of agricultural crops.
The data that is collected will be kept confidential and will be used to
scientific research purposes only. So, please fill the required data truthfully
and objectively.
Thank you for your kind cooperation
Supervisor: Prof.Dr Marwan Haddad
Researcher: Dania Maraka
Date:

101
First domain: General information
1. Name of village/ city:
b. female a. male 2. Gender:
3. Age:
4. Number of family members:
b. apartment a. separate house 5. Housing:
d. Private
sector
c. government
sector
b. trade sector a. agricultural
sector
6. Work type
e. university
graduate
d.
secondar
y
c. preparatory b.
elementary
a. uneducated 7.
Educational
level:
d. more than
3500
c. 2000 - 3500 b. 1000 - 2000 a. less than
1000
8. Average
family
income (in
shekels)
b. no a. yes 9. Health
insurance
availability
b. no a. yes 10. Home
garden
availability
d. non fruit
trees
c. fruit trees b. vegetables a. flowers 11. Home
garden type?
(choose all
that apply)
b. no a. yes 12. Raising
animals near
the house?
13. If your previous answer is yes, please fill the following table:
Number Type
Poultry and rabbits
Birds
Sheep
Cows
Else (determine):
………….

102
14. Cleaning animals’ farm once every: a. day b. 2-4 days c. 5-7 days
d. more than 7 days
15. Methods of dealing with animal manure (put X in front of the choice
that applies):
None Some Most All Method
Selling it to fertilizers factories a.
Using it as a fertilizer to my
plants
b.
Producing biogas from it c.
Disposing it in waste containers d.
Leaving it in place e.
16. Distance between my house and the nearest household waste disposal
site is about … m.

103
17. Methods of dealing with household waste (put X in front of the choice
that applies):
None Some Most All Method
Burning the waste a.
Disposal in public containers b.
Feeding organic waste to the
animals
c.
Fermenting household organic
waste to obtain biogas and / or
organic fertilizer
d.
Disposal in a nearby land e.
Other (determine): ... f.
18. Methods of dealing with wastewater (put X in front of the choice that
applies):
None Some Most All Method
Drained off through wastewater
network
a.
Drained off to the absorption pit b.
Drained off through open canal c.
Using it to irrigate plants d.

104
19. If you work in the agricultural sector, fill the following table:
Irrigation type Area
(donum)
Planting type
Surface
irrigation (the
traditional
way)
Sprinkler
irrigation
Drip
irrigation
Greenhouse
Trees Outside
planting Vegetables
20. Methods of dealing with agricultural waste (put X in front of the choice
that applies):
none Some most all Method
Burn it in the farm a.
Use it as animal feed b.
Left it at the land or its borders c.
Burn it to get energy d.
Gather the straw in the form of
molds
e.
Fermenting the plant remains to
obtain biogas and / or organic
fertilizer
f.
Else (determine):….. g.
Second domain: participants knowledge about biogas
Have you ever heard about biogas?
b. no a. yes
If your previous answer is yes, where did you hear about biogas?
e. else
(determine….) d. workshops c. internet b. media
a. school or
university
What do you think biogas is produced from?
d. no opinion c. organic waste
digestion b. petroleum
a. burning organic
waste
I think that using biogas technology reduces the final waste volume.
e. strongly d. disagree c. no opinion b. agree a. strongly

105
disagree agree
I think that the primary cost of construction a biogas unit is high
e. strongly
disagree d. disagree c. no opinion b. agree
a. strongly
agree
I think that the digestion of organic waste through biogas technology produces solid
and liquid output.
e. strongly
disagree d. disagree c. no opinion b. agree
a. strongly
agree
I think that the digestion of organic waste produces a fertilizer for plants.
e. strongly
disagree d. disagree c. no opinion b. agree
a. strongly
agree
I think that using biogas technology had positive impacts on the environment.
e. strongly
disagree d. disagree c. no opinion b. agree
a. strongly
agree
Third domain: participants acceptance and willing to use biogas technology
I’d like to buy and use biogas unit in my house or farm.
e. strongly
disagree d. disagree c. no opinion b. agree
a. strongly
agree
I will use biogas technology if its initial construction cost is compensated in:
c. more than 5 years b. 2-5 years a. 1 year
I will use biogas technology if it will have financial profit on my family.
e. strongly
disagree d. disagree c. no opinion b. agree
a. strongly
agree
I think there are other alternatives better than biogas technology to treat organic
waste.
e. strongly
disagree d. disagree c. no opinion b. agree
a. strongly
agree
I don’t mind the separation of organic waste (kitchen and garden waste) from other
household waste.
e. strongly
disagree d. disagree c. no opinion b. agree
a. strongly
agree
I think that operating a biogas unit in the house or farm will require a lot time and
effort.
e. strongly
disagree d. disagree c. no opinion b. agree
a. strongly
agree
I have fears regarding the quality of the fertilizer quality resulting from biogas unit.
e. strongly
disagree d. disagree c. no opinion b. agree
a. strongly
agree

106
If I own a biogas unit, I have fears regarding my ability to fix it by my own in case
any damage occurs.
e. strongly
disagree d. disagree c. no opinion b. agree
a. strongly
agree
If I own a biogas unit, I have fears regarding the unavailability of appropriate
expertise capable of following up the unit and its maintenance.
e. strongly
disagree d. disagree c. no opinion b. agree
a. strongly
agree
Fourth domain: participants utilizing preferability of biogas and the organic
fertilizer
I prefer to utilize the energy resulting from biogas in:
d. house lightening c. house heating
b. generate
electricity to
operate a device
(ex: refrigerator)
a. providing gas for
cooking
I would like to use the fertilizer resulting from biogas technology at my farm or
garden.
e. strongly
disagree d. disagree c. no opinion b. agree
a. strongly
agree
3. Using biogas is preferred on my house level.
e. strongly
disagree d. disagree c. no opinion b. agree
a. strongly
agree
4. Using biogas is environmentally and economically feasible.
e. strongly
disagree d. disagree c. no opinion b. agree
a. strongly
agree
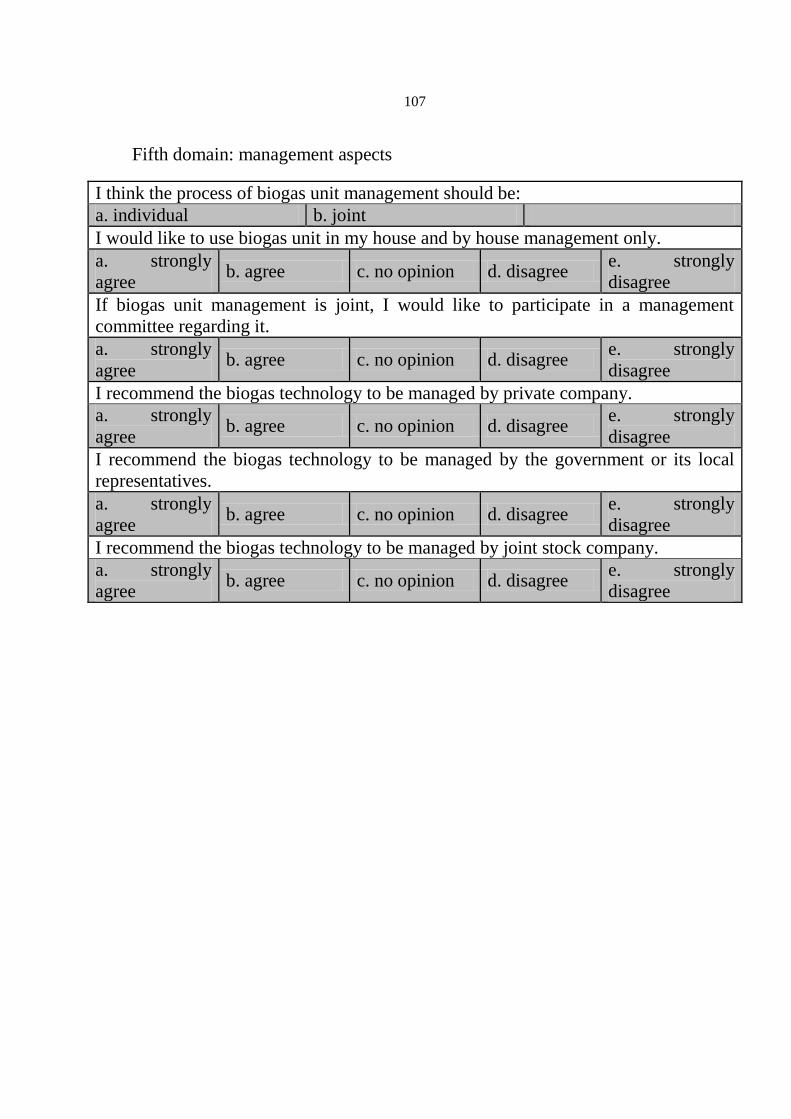
107
Fifth domain: management aspects
I think the process of biogas unit management should be:
b. joint a. individual
I would like to use biogas unit in my house and by house management only.
e. strongly
disagree d. disagree c. no opinion b. agree
a. strongly
agree
If biogas unit management is joint, I would like to participate in a management
committee regarding it.
e. strongly
disagree d. disagree c. no opinion b. agree
a. strongly
agree
I recommend the biogas technology to be managed by private company.
e. strongly
disagree d. disagree c. no opinion b. agree
a. strongly
agree
I recommend the biogas technology to be managed by the government or its local
representatives.
e. strongly
disagree d. disagree c. no opinion b. agree
a. strongly
agree
I recommend the biogas technology to be managed by joint stock company.
e. strongly
disagree d. disagree c. no opinion b. agree
a. strongly
agree

108
Sixth domain: financial aspects
Do you know the family’s income resulting from using biogas technology?
c. no opinion b. no a. yes
I recommend the income of biogas technology to be distributed on the village
inhabitance equally.
e. strongly
disagree d. disagree c. no opinion b. agree
a. strongly
agree
I recommend the income of biogas technology to be distributed on the village
inhabitance according to their participation level.
e. strongly
disagree d. disagree c. no opinion b. agree
a. strongly
agree
I recommend that the government participate in biogas technology establishment
cost.
e. strongly
disagree d. disagree c. no opinion b. agree
a. strongly
agree
What do you recommend to regain the biogas establishment cost out of the
following?
a. produce biogas and sell it collectively.
b. put fees on the inhabitants to contribute in the biogas technology, aiming at
reducing waste and preserving the environment.
c. reduce waste fees to those who participate in operating biogas technology.

109
بسم اهلل الرحمن الرحيم
جامعة النجاح الوطنية
كلية الدراسات العليا
استبيان
...السالم عليكم ورحمة اهلل وبركاته
يهدف هذا االستبيان إلى معرفة مدى وعي ومعرفة المجتمع الفلسطيني بتقنية الغاز الحيوي ومدى
المنزلي أو على مستوى المنزل، كما تقبلهم ورغبتهم في استخدام تقنية الغاز الحيوي لالستخدام
ويهدف إلى جمع المعلومات المتعلقة برأيكم حول الطرق المتبعة في التخلص من النفايات المنزلية
.والحيوانية والزراعية وتأثيراتها على البيئة المحيطة في مناطق الدراسة
البشرية وبعض المخلفات ينتج الغاز الحيوي عند تخمر المخلفات العضوية الحيوانية والنباتية و
يمكن . الصناعية بمعزل عن األكسجين، ويتم ذلك في حجرة خاصة تعمل تحت ظروف محددة
(. غاز للطبخ، توليد الكهرباء، تسيير المركبات وغيرها)استخدام الغاز الناتج كمصدر للطاقة
ن إنتاج باإلضافة للغاز الحيوي ينتج عن هذه العملية سماد عضوي يمكن استخدامه لتحسي
.المحاصيل الزراعية
وسيستخدم ألغراض البحث العلمي فقط، بالسرية التامة سيحاط إن ما سيتم جمعه من معلومات
.لذلك نرجو منكم تعبئة المعلومات المطلوبة بصدق وموضوعية
شاكرين لكم حسن تعاونكم
.البروفسور مروان حداد: المشرف
.دانيا مرقة: الباحثة
: التاريخ

110
معلومات عامة: األول المحور
: المدينة /اسم القرية
:الجنس ذكر. أ أنثى. ب
:العمر
:عدد أفراد العائلة
:طبيعة السكن منفصل. أ شقة بعمارة. ب
:نوع العمل قطاع زراعي. أ قطاع تجاري. ب قطاع حكومي. ج قطاع خاص. د
:المستوى التعليمي غير متعلم. أ ابتدائي. ب عداديإ. ج ثانوي. د جامعي. هـ
الشهري األسرةمتوسط دخل
(:بالشيكل)
5111أقل من . أ – 5111. ب
5111
– 5111. ج
9211
أعلى من . د
9211
نعم. أ توفر تأمين صحي للعائلة ال. ب
:توفر حديقة منزلية نعم. أ ال. ب
ما طبيعة الحديقة؟
(اختر كل ما ينطبق)
أزهار.أ خضروات. ب أشجار مثمرة. ج نباتات زينة. د
نعم. أ تربية حيوانات حول المنزل ال. ب
:السابقة نعم، امأل الجدول التالي إجابتكإذا كانت
العدد النوع
دواجن وأرانب
طيور
أغنام
أبقار
(: حدد)أخرى
.................

111
وانات يتنظيف مزرعة الح
:احد كلومرة
. أ
يوميامأ 4-2. ب أيام 7-5. ج أيام 7أكثر من . د
(أمام الخيار الذي ينطبق X إشارةضع : )طرق التعامل مع مخلفات الحيوانات
ال شيء بعضه معظمه جميعه الطريقة
.أ بيعه لمصانع األسمدة
.ب استخدامه كسماد لمزروعاتي
.ج تخميره النتاج الغاز الحيوي
.د نفاياتالقاءه في حاويات ال
.و تركه بالمكان
.م تقريبا...................المسافة ما بين منزلي وأقرب مكان للتخلص من النفايات المنزلية هو
(أمام الخيار الذي ينطبق X إشارةضع : )طرق التعامل مع المخلفات المنزلية
ال شيء بعضها معظمها جميعها الطريقة
.أ حرق النفايات
.ب التخلص منها في الحاويات العامة
.ج النفايات العضوية إطعام
للحيوانات
.د تخمير النفايات المنزلية العضوية
أو /للحصول على الغاز الحيوي و
السماد العضوي
.و في أرض قريبة إلقائها
(: حدد)أخرى هـ
.......................

112
(أمام الخيار الذي ينطبق X إشارةضع (: )المجاري)لعادمة طرق التعامل مع المياه ا
ال شيء بعضها معظمها جميعها الطريقة
تصريفها في شبكة الصرف .أ
الصحي
تصريفها في حفرة امتصاصية .ب
تصريفها من خالل قناة .ج
مفتوحة
استخدمها لري المزروعات .د
:امأل الجدول التالي إذا كنت تعمل بالقطاع الزراعي،
نوع الزراعةالمساحة
(دونم)
نوع الري
الري
بالتنقيط
الري
بالرشاشات
الري
بالقنوات
األسلوب )
(التقليدي
الزراعة
بعلية
مياه )
(االمطار
دفيئات بالستيكية
زراعة
خارجية
أشجار
خضروات
حبوب
(أمام الخيار الذي ينطبق X إشارةضع : )عيةطرق التعامل مع المخلفات الزرا
ال شيء بعضها معظمها جميعها الطريقة
تحرق في المزرعة .أ
تستخدم كطعام للحيوانات .ب
مباشرة
تترك في األرض أو على .ج
حدودها
تحرق للحصول على الطاقة .د
يجمع القش على شكل قوالب .و
النباتية للحصول تخمر البقايا .هـ
على سماد أو غاز حيوي
(: حدد)أخرى .ي
.......................

113
مدى معرفة المشارك حول الغاز الحيوي: المحور الثاني
هل سمعت عن الغاز الحيوي مسبقا؟
ال. ب نعم. أ
السابقة نعم، من أين سمعت عن الغاز الحيوي؟ إجابتكإذا كانت
المدرسة أو. أ
الجامعة ورشات عمل. د االنترنت. ج اإلعالموسائل . ب
أخرى . هـ
(:.....حدد)
باعتقادك، عن ماذا ينتج الغاز الحيوي؟
البترول. ب حرق النفايات العضوية. أتحلل النفايات . ج
العضوية ال رأي لي. د
.أعتقد أن استخدام تقنية الغاز الحيوي تقلل من حجم النفايات النهائي
أرفض بشدة. هـ أرفض. د ال رأي لي. ج أوافق. ب وافق بشدةأ. أ
.وحدة غاز حيوي مرتفعة إلنشاءأعتقد أن التكلفة األولية
أرفض بشدة. هـ أرفض. د ال رأي لي. ج أوافق. ب أوافق بشدة. أ
.باعتقادي،ينتج عن تحلل النفايات العضوية عبر تقنية الغاز الحيوي مخلفات سائلة وصلبة
أرفض بشدة. هـ أرفض. د ال رأي لي. ج أوافق. ب وافق بشدةأ. أ
.باعتقادي، ينتج عن تحلل النفايات العضوية سماد للنباتات
أرفض بشدة. هـ أرفض. د ال رأي لي. ج أوافق. ب أوافق بشدة. أ
أعتقد أن استخدام تقنية الغاز الحيوي له آثار ايجابية على البيئة؟
أرفض بشدة. هـ أرفض. د ال رأي لي. ج قأواف. ب أوافق بشدة. أ
:مدى تقبل المشارك لتقنية الغاز الحيوي ورغبته في استخدامها: المحور الثالث
.لدي االستعداد لشراء وحدة غاز حيوي واستخدامها في منزلي أو مزرعتي
أرفض بشدة. هـ أرفض. د ال رأي لي. ج أوافق. ب أوافق بشدة. أ
:األولية تعوض خالل إنشاءهاالحيوي إذا كانت تكلفة سأستخدم تقنية الغاز
سنوات 2أكثر من . ج سنوات 2-5. ب سنة. ب
.أعتقد أن تقنية الغاز الحيوي ستعود بالنفع المادي على أسرتي
أرفض بشدة. هـ أرفض. د ال رأي لي. ج أوافق. ب أوافق بشدة. أ
.حيوي لمعالجة النفايات العضويةأعتقد أن هناك بدائل أخرى أفضل من تقنية الغاز ال
أرفض بشدة .هـ أرفض. د ال رأي لي. ج أوافق. ب أوافق بشدة. أ
.عن باقي نفايات المنزل( نفايات المطبخ والحديقة)ال أمانع فصل النفايات العضوية
أرفض بشدة. هـ أرفض. د ال رأي لي. ج أوافق. ب أوافق بشدة. أ
.ي في المنزل أو المزرعة سيتطلب الكثير من الوقت والجهدأعتقد أن تشغيل وحدة غاز حيو
أرفض بشدة. هـ أرفض. د ال رأي لي. ج أوافق. ب أوافق بشدة. أ
.لدي مخاوف حول تدني نوعية السماد الناتج من استخدام تقنية الغاز الحيوي
أرفض بشدة. هـ أرفض. د ال رأي لي. ج أوافق. ب أوافق بشدة. أ
.ئي وحدة غاز حيوي، أخشى من عدم قدرتي على صيانتها في حال حدوث عطلفي حال اقتنا
أرفض بشدة. هـ أرفض. د ال رأي لي. ج أوافق. ب أوافق بشدة. أ
في حال اقتنائي وحدة غاز حيوي، أخشى من عدم توفر خبرات مالئمة قادرة على متابعة عمل الوحدة
.وصيانتها
أرفض بشدة. هـ أرفض. د لي ال رأي. ج أوافق. ب أوافق بشدة. أ

114
:توجه المشترك الستخدام الغاز الحيوي والسماد العضوي الناتج: المحور الرابع
:ُأفّضل استخدام الطاقة الناتجة من الغاز الحيوي في
تزويد غاز الطبخ. أتوليد الكهرباء لتشغيل . ب
(كالثالجة)جهاز في المنزل المنزل إنارة. د تدفئة المنزل. ج
:د استخدام السماد الناتج عن تقنية الغاز الحيوي في حديقة منزلي أو مزرعتيأو
أرفض بشدة. هـ أرفض. د ال رأي لي. ج أوافق. ب أوافق بشدة. أ
.استخدام الغاز الحيوي أمر محبذ على المستوى المنزلي. 3
أرفض بشدة. هـ أرفض. د ال رأي لي. ج أوافق. ب أوافق بشدة. أ
.ام الغاز الحيوي مجدي اقتصاديا وبيئيااستخد. 3
أرفض بشدة. هـ أرفض. د ال رأي لي. ج أوافق. ب أوافق بشدة. أ
:النواحي اإلدارية: المحور الخامس
:أعتقد أن إدارة تقنية الغاز الحيوي عملية
جماعية. ب فردية. أ
.أؤيد استخدام تقنية الغاز الحيوي في المنزل وبإدارة منزلية فقط
أرفض بشدة. هـ أرفض. د ال رأي لي. ج أوافق. ب أوافق بشدة. أ
.لو كانت إدارة تقنية الغاز الحيوي جماعية، أود المشاركة في لجنة إدارة بهذا الخصوص
أرفض بشدة. هـ أرفض. د ال رأي لي. ج أوافق. ب أوافق بشدة. أ
.شركة خاصةأوصي بأن تكون إدارة استخدام تقنية الغاز الحيوي من خالل
أرفض بشدة. هـ أرفض. د ال رأي لي. ج أوافق. ب أوافق بشدة. أ
.أوصي بأن تكون إدارة استخدام تقنية الغاز الحيوي من خالل الحكومة أو من يمثلها محليا
أرفض بشدة. هـ أرفض. د ال رأي لي. ج أوافق. ب أوافق بشدة. أ
.حيوي من خالل شركة مساهمةأوصي بأن تكون إدارة استخدام تقنية الغاز ال
أرفض بشدة. هـ أرفض. د ال رأي لي. ج أوافق. ب أوافق بشدة. أ
:النواحي المالية: المحور السادس
هل تعرف مقدار مدخول األسرة من استخدام تقنية الغاز الحيوي؟
ال رأي لي. ج ال. ب نعم. أ
.القرية بالتساوي أوصي بأن تكون عوائد تقنية الغاز الحيوي توزع على سكان
أرفض بشدة. هـ أرفض. د ال رأي لي. ج أوافق. ب أوافق بشدة. أ
.أوصي بأن تكون عوائد تقنية الغاز الحيوي توزع على المشاركين بالتقنية حسب نسب المشاركة
أرفض بشدة. هـ أرفض. د ال رأي لي. ج أوافق. ب أوافق بشدة. أ
.نشاء تقنية الغاز الحيويأوصي بأن تساهم الحكومة في تكلفة إ
أرفض بشدة. هـ أرفض. د ال رأي لي. ج أوافق. ب أوافق بشدة. أ
ما هي اإلجراءات التي توصي بها الستعادة تكلفة تقنية الغاز الحيوي؟
.الغاز وبيعه جماعيا إنتاج. أ
.لفات والحفاظ على البيئةضرائب على السكان للمساهمة في تقنية الغاز الحيوي بهدف تقليل المخ /وضع رسوم. ب
.تخفيض ضرائب النفايات لمن يشارك في تشغيل تقنية الغاز الحيوي. ج

115
Appendix II
Table 25: Phase 1 experiment results.
Phase 1: mixed cow manure and food
residues
date
day
number
biogas
produced
(gm)
Digestate
temperature
13-Jul 1 1080 28.5
14-Jul 2 1120 29.5
15-Jul 3 1095 28.5
16-Jul 4 1300 32
17-Jul 5 1120 30.5
18-Jul 6 1200 30.5
19-Jul 7 1240 31
20-Jul 8 1205 30
21-Jul 9 1230 30
22-Jul 10 1185 30
23-Jul 11 1240 31
24-Jul 12 1120 30
25-Jul 13 1215 31
26-Jul 14 1125 31
27-Jul 15 1250 31.5
28-Jul 16 1230 31

116
Table 26: Phase 2 experiment results
Phase 2: cow manure
Date
Day
number
Biogas
produced
(gm)
Digestate
temperature
31-Jul 1 1040 30.5
1-Aug 2 1425 32
2-Aug 3 1330 32
3-Aug 4 1505 33
4-Aug 5 1520 34
5-Aug 6 1460 33.5
6-Aug 7 1390 32
7-Aug 8 1400 32.5
8-Aug 9 1425 32.5
9-Aug 10 1290 31
10-
Aug 11 1380
32
11-
Aug 12 1530
34
12-
Aug 13 1485
34
13-
Aug 14 1470
33
14-
Aug 15 1500
33
15-
Aug 16 1475
33

117
Table 27: Phase 3 experiment results
Phase 3: Sheep manure
Date
Day
number
Biogas
produced
(gm)
Digestate
temperature
18-
Aug 1 1240
32
19-
Aug 2 1320
32.5
20-
Aug 3 1250
32
21-
Aug 4 1420
33
22-
Aug 5 1520
33.5
23-
Aug 6 1450
33
24-
Aug 7 1320
32
25-
Aug 8 1500
33
26-
Aug 9 1450
32.5
27-
Aug 10 1600
34
28-
Aug 11 1520
33.5
29-
Aug 12 1530
33.5
30-
Aug 13 1500
33
31-
Aug 14 1470
33
1-Sep 15 1370 32
2-Sep 16 1480 33

118
Table 28: Phase 4 experiment result
Phase 4: poultry manure
Date
Day
number
Biogas
produced
(gm)
Digestate
temperature
5-Sep 1 1520 33
6-Sep 2 1300 32.5
7-Sep 3 1370 33
8-Sep 4 1400 33
9-Sep 5 1150 31
10-Sep 6 1220 32
11-Sep 7 1200 3.5
12-Sep 8 1200 31
13-Sep 9 1230 31
14-Sep 10 1300 32
15-Sep 11 1370 32
16-Sep 12 1320 31.5
17-Sep 13 1300 31
18-Sep 14 1280 30.5
19-Sep 15 1290 31
20-Sep 16 1320 32

119
Appendix III
ANCOVA Analysis 1
The GLM Procedure
Class Level Information
Class Levels Values
TRT 4 1 2 3 4
Number of observations 64
ANCOVA Analysis 2
The GLM Procedure
Dependent Variable: gas
Sum of
Source DF Squares Mean Square F Value Pr > F
Model 8 1070881.423 133860.178 52.36 <.0001
Error 55 140617.015 2556.673
Corrected Total 63 1211498.438
R-Square Coeff Var Root MSE gas Mean
0.883931 3.794193 50.56355 1332.656
Source DF Type I SS Mean Square F Value Pr > F
TRT 3 638945.3125 212981.7708 83.30 <.0001
time 1 57395.0184 57395.0184 22.45 <.0001
time*time 1 10339.5002 10339.5002 4.04 0.0492
temp 1 320391.7376 320391.7376 125.32 <.0001
temp*temp 1 28979.6971 28979.6971 11.33 0.0014
temp*temp*temp 1 14830.1571 14830.1571 5.80 0.0194
Source DF Type III SS Mean Square F Value Pr > F
TRT 3 6541.71559 2180.57186 0.85 0.4711
time 1 20157.33205 20157.33205 7.88 0.0069
time*time 1 10972.09631 10972.09631 4.29 0.0430

120
temp 1 16068.25208 16068.25208 6.28 0.0152
temp*temp 1 15526.27343 15526.27343 6.07 0.0169
temp*temp*temp 1 14830.15712 14830.15712 5.80 0.0194
Standard
Parameter Estimate Error t Value Pr > |t|
Intercept 162251.5410 B 63493.41805 2.56 0.0134
TRT 1 -15.2587 B 21.58356 -0.71 0.4826
TRT 2 22.9581 B 19.58958 1.17 0.2463
TRT 3 18.0826 B 20.51380 0.88 0.3819
TRT 4 0.0000 B . . .
time 17.8664 6.36295 2.81 0.0069
time*time -0.7370 0.35577 -2.07 0.0430
temp -15267.0787 6089.88677 -2.51 0.0152
temp*temp 479.0511 194.39532 2.46 0.0169
temp*temp*temp -4.9746 2.06549 -2.41 0.0194
NOTE: The X'X matrix has been found to be singular, and a generalized inverse was used to
solve the normal equations. Terms whose estimates are followed by the letter 'B'
are not uniquely estimable.
ANCOVA Analysis 3
The GLM Procedure
Least Squares Means
Adjustment for Multiple Comparisons: Tukey-Kramer
LSMEAN
TRT gas LSMEAN Number
1 1310.95203 1
2 1349.16885 2
3 1344.29334 3
4 1326.21078 4
Least Squares Means for effect TRT
Pr > |t| for H0: LSMean(i)=LSMean(j)
Dependent Variable: gas
i/j 1 2 3 4
1 0.4290 0.6058 0.8939
2 0.4290 0.9933 0.6469
3 0.6058 0.9933 0.8144
4 0.8939 0.6469 0.8144

121
Measured and predicted values of gas emission based on the ANCOVA analysis model
ANCOVA Analysis 4
Obs TRT Y_measured Y_Predicted residual
1 1 1080 1093.31 -13.307
2 1 1120 1074.69 45.309
3 1 1095 1123.14 -28.144
4 1 1300 1290.10 9.900
5 1 1120 1156.14 -36.139
6 1 1200 1165.90 34.102
7 1 1240 1215.62 24.382
8 1 1205 1151.50 53.503
9 1 1230 1156.83 73.165
10 1 1185 1160.70 24.302
11 1 1240 1234.02 5.981
12 1 1120 1164.00 -44.002
13 1 1215 1234.38 -19.376
14 1 1125 1232.34 -107.343
15 1 1250 1278.48 -28.478
16 1 1230 1223.86 6.145
17 2 1040 1140.58 -100.578
18 2 1425 1301.43 123.572
19 2 1330 1315.61 14.391
20 2 1505 1435.05 69.945
21 2 1520 1526.16 -6.158
22 2 1460 1501.21 -41.206
23 2 1390 1357.59 32.406
24 2 1400 1419.27 -19.268
25 2 1425 1424.61 0.395
26 2 1290 1269.85 20.153
27 2 1380 1376.00 4.005
28 2 1530 1563.52 -33.519
29 2 1485 1562.96 -77.960
30 2 1470 1481.06 -11.057
31 2 1500 1477.55 22.450
32 2 1475 1472.57 2.431
33 3 1240 1280.90 -40.897
34 3 1320 1351.41 -31.415
35 3 1250 1310.73 -60.734
36 3 1420 1430.18 -10.179
37 3 1520 1486.57 33.428
38 3 1450 1451.17 -1.172
39 3 1320 1352.72 -32.719
40 3 1500 1466.27 33.731
41 3 1450 1419.73 30.270
42 3 1600 1555.34 44.661
43 3 1520 1523.02 -3.017
44 3 1530 1523.93 6.068
45 3 1500 1478.21 21.785
46 3 1470 1476.18 -6.182
47 3 1370 1365.94 4.064
48 3 1480 1467.69 12.306
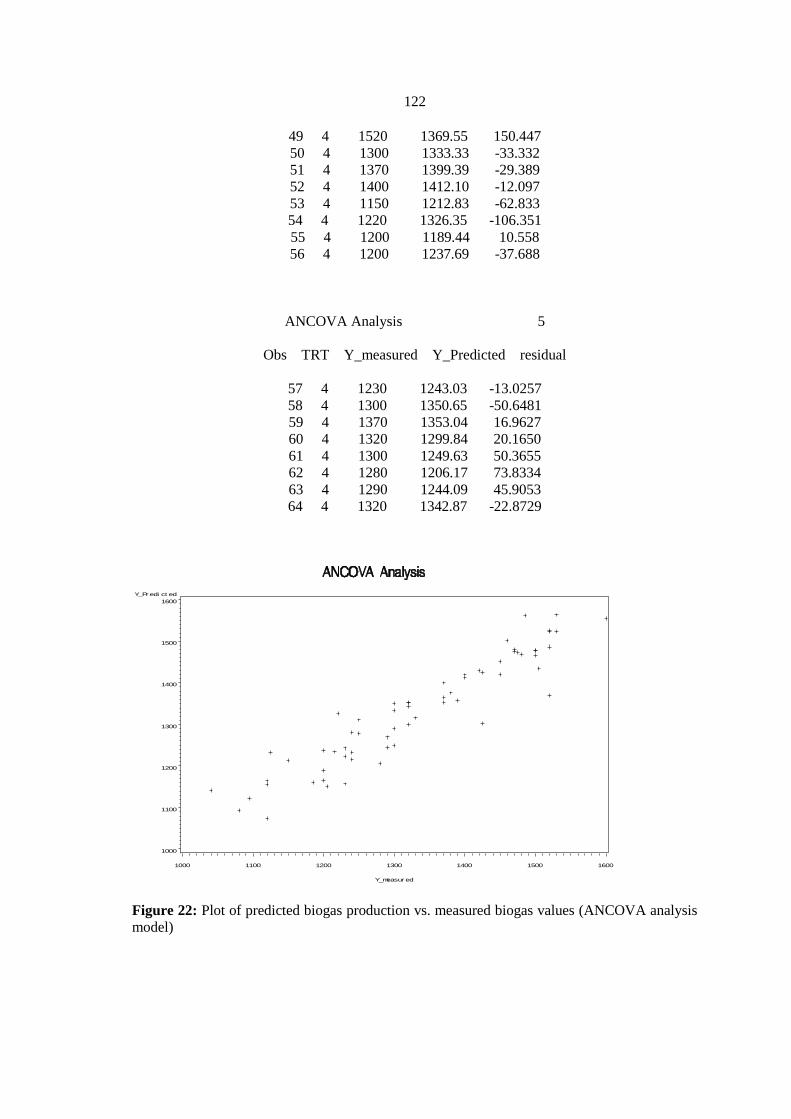
122
49 4 1520 1369.55 150.447
50 4 1300 1333.33 -33.332
51 4 1370 1399.39 -29.389
52 4 1400 1412.10 -12.097
53 4 1150 1212.83 -62.833
54 4 1220 1326.35 -106.351
55 4 1200 1189.44 10.558
56 4 1200 1237.69 -37.688
ANCOVA Analysis 5
Obs TRT Y_measured Y_Predicted residual
57 4 1230 1243.03 -13.0257
58 4 1300 1350.65 -50.6481
59 4 1370 1353.04 16.9627
60 4 1320 1299.84 20.1650
61 4 1300 1249.63 50.3655
62 4 1280 1206.17 73.8334
63 4 1290 1244.09 45.9053
64 4 1320 1342.87 -22.8729
Y_Pr edi ct ed
1000
1100
1200
1300
1400
1500
1600
Y_measur ed
1000 1100 1200 1300 1400 1500 1600
Figure 22: Plot of predicted biogas production vs. measured biogas values (ANCOVA analysis
model)

123
Appendix IV
The nonliniar analyses were based on the following model:
Y = C*(Time)X1
* (Temp)X2
, where Y is gas emission
ALL DATA
Nonlinear Analysis 6
The NLIN Procedure
Dependent Variable gas
Method: Gauss-Newton
Iterative Phase
Sum of
Iter c X1 X2 Squares
0 10.0000 2.0000 2.0000 1.034E14
1 0.0624 1.9973 2.0005 3.064E9
2 0.0626 1.5648 2.0731 3.6123E8
3 0.1132 0.7502 2.2478 19948900
4 0.2792 -0.1042 2.3763 15183770
5 0.4459 0.0742 2.2669 385774
6 0.4098 0.0151 2.3260 189226
7 0.4128 0.0167 2.3237 188349
8 0.4127 0.0167 2.3238 188349
NOTE: Convergence criterion met.
Estimation Summary
Method Gauss-Newton
Iterations 8
R 1.577E-6
PPC(c) 4.354E-6
RPC(c) 0.000281
Object 3.271E-7
Objective 188348.6
Observations Read 64
Observations Used 64
Observations Missing 0
NOTE: An intercept was not specified for this model.
Sum of Mean Approx
Source DF Squares Square F Value Pr > F
Model 3 1.1469E8 38228467 12381.0 <.0001
Error 61 188349 3087.7
Uncorrected Total 64 1.1487E8

124
Approx
Parameter Estimate Std Error Approximate 95% Confidence Limits
c 0.4127 0.1921 0.0286 0.7969
X1 0.0167 0.00708 0.00251 0.0308
X2 2.3238 0.1346 2.0547 2.5929
Nonlinear Analysis 7
The NLIN Procedure
Approximate Correlation Matrix
c X1 X2
c 1.0000000 0.0837981 -0.9995010
X1 0.0837981 1.0000000 -0.1132192
X2 -0.9995010 -0.1132192 1.0000000
Measured and predicted values of gas emission based on the NLIN analysis model
Nonlinear Analysis 8
Obs TRT Y_measured Y_Predicted RESIDUAL
1 1 1080 991.74 88.261
2 1 1120 1086.97 33.025
3 1 1095 1010.07 84.930
4 1 1300 1328.41 -28.411
5 1 1120 1192.61 -72.606
6 1 1200 1196.24 3.764
7 1 1240 1245.50 -5.498
8 1 1205 1156.69 48.307
9 1 1230 1158.97 71.033
10 1 1185 1161.00 23.996
11 1 1240 1254.92 -14.919
12 1 1120 1164.54 -44.539
13 1 1215 1258.42 -43.419
14 1 1125 1259.97 -134.974
15 1 1250 1309.21 -59.209
16 1 1230 1262.78 -32.782
17 2 1040 1161.03 -121.032
18 2 1425 1313.15 111.851
19 2 1330 1322.06 7.945
20 2 1505 1426.88 78.120
21 2 1520 1535.08 -15.079
22 2 1460 1487.65 -27.645
23 2 1390 1340.86 49.138
24 2 1400 1393.15 6.850
25 2 1425 1395.89 29.112
26 2 1290 1252.93 37.074
27 2 1380 1351.00 28.996
28 2 1530 1557.65 -27.648
29 2 1485 1559.73 -74.728
30 2 1470 1456.99 13.006
31 2 1500 1458.67 41.330
32 2 1475 1460.24 14.759
33 3 1240 1298.06 -58.062

125
34 3 1320 1361.32 -41.322
35 3 1250 1322.06 -72.055
36 3 1420 1426.88 -6.880
37 3 1520 1483.13 36.870
38 3 1450 1436.56 13.442
39 3 1320 1340.86 -20.862
40 3 1500 1443.46 56.536
41 3 1450 1395.89 54.112
42 3 1600 1552.92 47.079
43 3 1520 1502.75 17.246
44 3 1530 1504.94 25.065
45 3 1500 1455.19 44.805
46 3 1470 1456.99 13.006
47 3 1370 1358.01 11.992
48 3 1480 1460.24 19.759
49 4 1520 1394.28 125.719
50 4 1300 1361.32 -61.322
51 4 1370 1420.05 -50.053
52 4 1400 1426.88 -26.880
53 4 1150 1238.53 -88.531
54 4 1220 1337.42 -117.421
55 4 1200 1199.31 0.686
56 4 1200 1248.27 -48.274
Nonlinear Analysis 9
Obs TRT Y_measured Y_Predicted RESIDUAL
57 4 1230 1250.73 -20.7276
58 4 1300 1348.86 -48.8590
59 4 1370 1351.00 18.9961
60 4 1320 1304.35 15.6527
61 4 1300 1258.42 41.5814
62 4 1280 1213.25 66.7467
63 4 1290 1261.42 28.5757
64 4 1320 1359.47 -39.4695

126
Y_Pr edi ct ed
900
1000
1100
1200
1300
1400
1500
1600
Y_measur ed
1000 1100 1200 1300 1400 1500 1600
Figure 23: Plot of predicted biogas production vs. measured biogas values (Nonlinear analysis
model)

127
TRT1 10
The NLIN Procedure
Dependent Variable gas
Method: Gauss-Newton
Iterative Phase Sum of
Iter c X1 X2 Squares
0 20.0000 0.4100 2.0000 3.024E10
1 2.7761 0.3972 1.9755 3.0887E8
2 3.0242 0.2973 1.7843 29624602
3 5.5403 0.1378 1.4880 242989
4 7.9954 0.0637 1.4038 200498
5 10.4835 0.00165 1.3699 73421.4
6 10.5786 -0.00127 1.3830 24485.3
7 10.5759 -0.00115 1.3829 24478.8
8 10.5762 -0.00116 1.3829 24478.8
NOTE: Convergence criterion met.
Estimation Summary
Method Gauss-Newton
Iterations 8
Subiterations 1
Average Subiterations 0.125
R 1.398E-7
PPC(X1) 6.559E-6
RPC(X1) 0.000441
Object 5.53E-10
Objective 24478.75
Observations Read 16
Observations Used 16
Observations Missing 0
NOTE: An intercept was not specified for this model.
Sum of Mean Approx
Source DF Squares Square F Value Pr > F
Model 3 22495746 7498582 3982.29 <.0001
Error 13 24478.8 1883.0
Uncorrected Total 16 22520225

128
Approx
Parameter Estimate Std Error Approximate 95% Confidence Limits
c 10.5762 13.3934 -18.3584 39.5109
X1 -0.00116 0.0156 -0.0348 0.0325
X2 1.3829 0.3761 0.5704 2.1953
The NLIN Procedure
Approximate Correlation Matrix
c X1 X2
c 1.0000000 0.5895544 -0.9997902
X1 0.5895544 1.0000000 -0.6049445
X2 -0.9997902 -0.6049445 1.0000000
TRT2 12
The NLIN Procedure
Dependent Variable gas
Method: Gauss-Newton
Iterative Phase
Sum of
Iter c X1 X2 Squares
0 20.0000 2.0000 2.0000 1.163E14
1 0.0901 1.9986 1.9998 1.9526E9
2 0.0903 1.6960 1.9647 2.3675E8
3 0.1429 1.0514 2.0545 17489165
4 0.3946 0.1216 2.1002 6968388
5 0.8389 0.0283 1.9552 5961643
6 1.0362 0.0244 2.0738 156062
7 1.1108 0.0255 2.0366 44970.5
8 1.1198 0.0256 2.0345 44948.5
9 1.1198 0.0256 2.0345 44948.5
NOTE: Convergence criterion met.
Estimation Summary
Method Gauss-Newton
Iterations 9
Subiterations 1
Average Subiterations 0.111111
R 3.253E-7
PPC(c) 1.391E-6
RPC(c) 0.000061
Object 7.319E-7
Objective 44948.51
Observations Read 16
Observations Used 16

129
Observations Missing 0
NOTE: An intercept was not specified for this model.
Sum of Mean Approx
Source DF Squares Square F Value Pr > F
Model 3 32167076 10722359 3101.12 <.0001
Error 13 44948.5 3457.6
Uncorrected Total 16 32212025
Approx
Parameter Estimate Std Error Approximate 95% Confidence Limits
c 1.1198 1.5441 -2.2160 4.4556
X1 0.0256 0.0165 -0.0100 0.0613
X2 2.0345 0.3995 1.1713 2.8976
The NLIN Procedure
Approximate Correlation Matrix
c X1 X2
c 1.0000000 0.4499417 -0.9997505
X1 0.4499417 1.0000000 -0.4686391
X2 -0.9997505 -0.4686391 1.0000000
TRT3 14
The NLIN Procedure
Dependent Variable gas
Method: Gauss-Newton
Iterative Phase
Sum of
Iter c X1 X2 Squares
0 20.0000 2.0000 2.0000 1.141E14
1 0.2560 1.9986 1.9975 1.708E10
2 0.2589 1.8860 1.8011 2.2077E9
3 0.6424 1.6063 1.3237 59502426
4 5.5222 0.5625 -0.2556 32721898
5 4.3681 0.5341 -0.1643 32714333
6 3.2181 0.5015 -0.0518 32708739
7 2.1492 0.4642 0.0870 32708586
8 1.6958 0.4429 0.1733 32701984
9 1.2559 0.4182 0.2784 32696966
10 0.8558 0.3898 0.4064 32695990
11 0.6879 0.3736 0.4845 32688761
12 0.5246 0.3546 0.5787 32682126
13 0.3745 0.3328 0.6919 32677492
14 0.2458 0.3079 0.8276 32677227
15 0.1952 0.2937 0.9089 32668042
130
16 0.1477 0.2774 1.0054 32658779
17 0.1054 0.2589 1.1191 32650199
18 0.0704 0.2380 1.2517 32643278
19 0.0437 0.2150 1.4049 32638883
20 0.0251 0.1900 1.5797 32636826
21 0.0135 0.1635 1.7748 32633523
22 0.00713 0.1366 1.9843 32617562
23 0.00405 0.1114 2.1926 32565993
24 0.00144 0.0697 2.5568 32483424
25 0.00112 -0.00693 3.3211 27745144
26 0.00279 0.0208 3.0476 27691394
27 0.0130 0.0626 2.6596 26143577
28 0.0177 -0.00770 3.2863 1041304
29 0.0260 0.0108 3.1221 18598.0
30 0.0307 0.0172 3.0666 17460.8
31 0.0334 0.0204 3.0395 17381.8
32 0.0354 0.0224 3.0221 16470.1
33 0.0385 0.0255 2.9958 16107.5
34 0.0422 0.0288 2.9674 15412.0
35 0.0457 0.0316 2.9438 13341.3
36 0.0512 0.0356 2.9096 10933.1
37 0.0535 0.0368 2.8987 7769.7
38 0.0537 0.0369 2.8980 7699.8
39 0.0537 0.0369 2.8980 7699.8
NOTE: Convergence criterion met.
Estimation Summary
Method Gauss-Newton
Iterations 39
Subiterations 64
TRT3 15
The NLIN Procedure
Estimation Summary
Average Subiterations 1.641026
R 1.811E-6
PPC(c) 1.718E-7
RPC(c) 0.000058
Object 1.22E-6
Objective 7699.835
Observations Read 16
Observations Used 16
Observations Missing 0

131
NOTE: An intercept was not specified for this model.
Sum of Mean Approx
Source DF Squares Square F Value Pr > F
Model 3 33048500 11016167 18599.1 <.0001
Error 13 7699.8 592.3
Uncorrected Total 16 33056200
Approx
Parameter Estimate Std Error Approximate 95% Confidence Limits
c 0.0537 0.0473 -0.0485 0.1559
X1 0.0369 0.00648 0.0229 0.0509
X2 2.8980 0.2534 2.3506 3.4455
Approximate Correlation Matrix
c X1 X2
c 1.0000000 0.3887700 -0.9998985
X1 0.3887700 1.0000000 -0.4010988
X2 -0.9998985 -0.4010988 1.0000000
TRT4 16
The NLIN Procedure
Dependent Variable gas
Method: Gauss-Newton
Iterative Phase
Sum of
Iter c X1 X2 Squares
0 20.0000 0.4000 2.0000 3.203E10
1 0.5263 0.3878 2.0082 1771202
2 0.5638 -0.0608 2.2875 240132
3 0.7789 -0.0313 2.1542 105382
4 0.9535 -0.0146 2.0846 100168
5 1.1712 0.00201 2.0189 76975.0
6 1.2452 0.00577 2.0068 54903.0
7 1.2487 0.00594 2.0066 54738.5
8 1.2488 0.00594 2.0066 54738.5
NOTE: Convergence criterion met.
Estimation Summary
Method Gauss-Newton
Iterations 8
Subiterations 2
Average Subiterations 0.25
R 4.53E-6

132
PPC(X1) 0.000042
RPC(X1) 0.001113
Object 9.79E-8
Objective 54738.49
Observations Read 16
Observations Used 16
Observations Missing 0
NOTE: An intercept was not specified for this model.
Sum of Mean Approx
Source DF Squares Square F Value Pr > F
Model 3 27030562 9010187 2139.86 <.0001
Error 13 54738.5 4210.7
Uncorrected Total 16 27085300
Approx
Parameter Estimate Std Error Approximate 95% Confidence Limits
c 1.2488 2.7576 -4.7086 7.2061
X1 0.00594 0.0214 -0.0402 0.0521
X2 2.0066 0.6307 0.6441 3.3691
The NLIN Procedure
Approximate Correlation Matrix
c X1 X2
c 1.0000000 -0.6834661 -0.9998948
X1 -0.6834661 1.0000000 0.6736624
X2 -0.9998948 0.6736624 1.0000000

2164

ب
01
83.0
02.0
25.5

ج
5211
55
55.355.5
51.053
9
559581
55118
