an intoduction to r
TRANSCRIPT
An Introduction to R Programming Language Implementation and Design
PhD. Saied Farzi
Lecture by Mahmoud Shiri Varamini Amin Khaleghi
K.N.Toosi university of tech.autumn 2016
2
What is R
R is a language and environment for statistical computing and graphics. It is a GNU project which is similar to the S language.●Created in 1993, license: GNU GPL●Interpreted●C-like syntax●Functional programming language semantics (Lisp, APL)●Object oriented (3 different OO systems)●Garbage collector●Mostly call-by-value●Lexical scope●Function closure
3
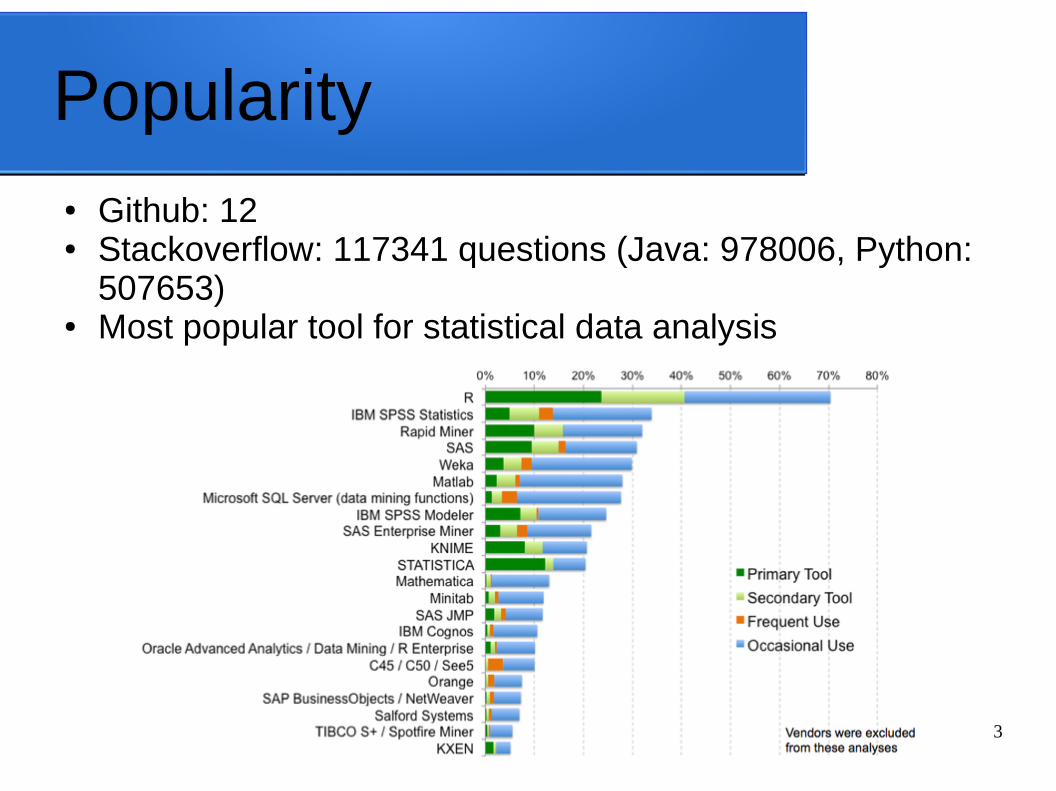
Popularity● Github: 12● Stackoverflow: 117341 questions (Java: 978006, Python:
507653)● Most popular tool for statistical data analysis
4
History
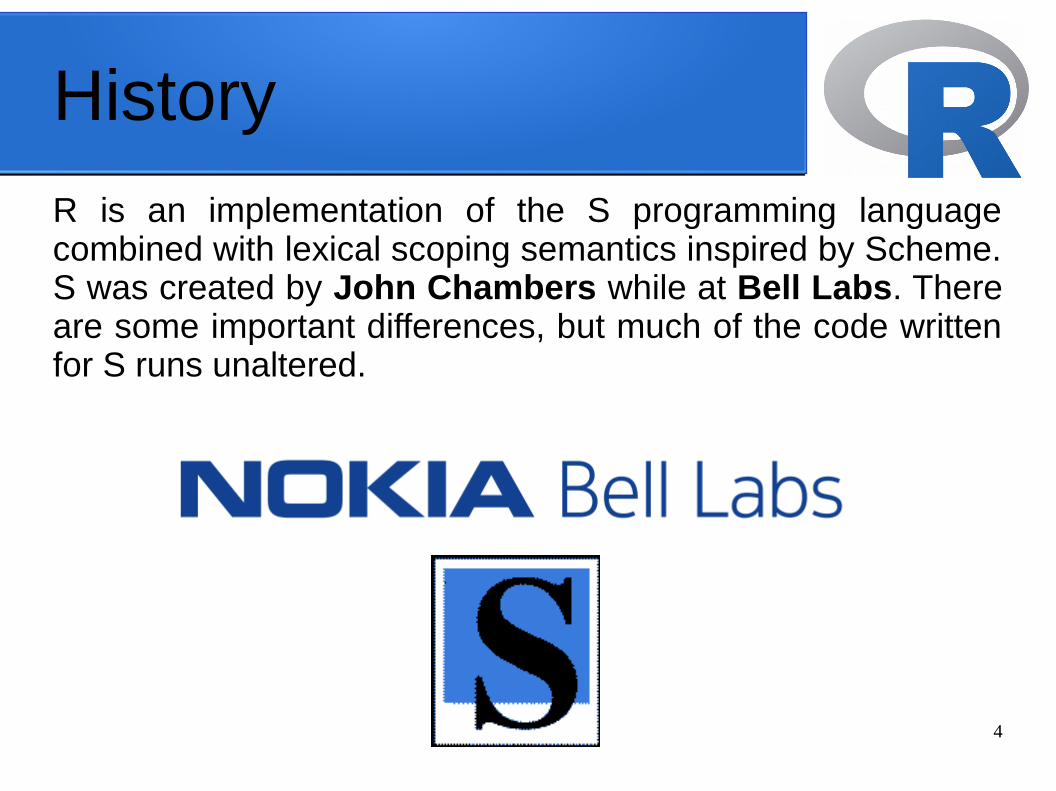
R is an implementation of the S programming language combined with lexical scoping semantics inspired by Scheme. S was created by John Chambers while at Bell Labs. There are some important differences, but much of the code written for S runs unaltered.
5
History
R was created by Ross Ihaka and Robert Gentleman at the University of Auckland, New Zealand, and is currently developed by the R Development Core Team, of which Chambers is a member. The project was conceived in 1992, with an initial version released in 1995 and a stable beta version in 2000.
6
Usage●Statistics (frequentist and bayesian)●Machine learning and data mining●Science (mathematics, chemistry, physics, medical, ecology, genetics,economy, history, …)●Finance●Natural Language Processing●Data visualization●Analyzing spatial, spatio-temporal data and time series●…
7
Applications
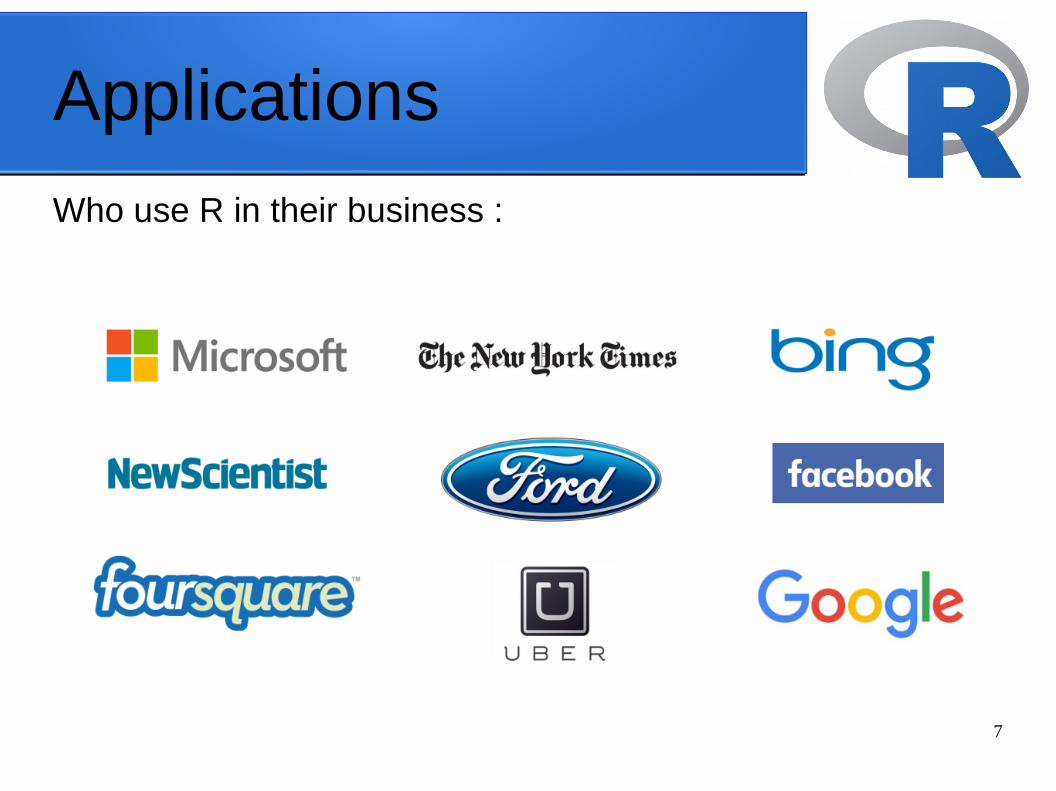
Who use R in their business :

8
competitors/colleagues
●SAS, SPSS, STATA, Mathematica and other statistical software●Python + Numpy + Pandas + matplotlib + …●Matlab/Octave●Julia●K/J and other APL like languages●Java (Weka), Clojure, .NET (F#), …
9
Calling R●command line●SAS, SPSS, Stata, Statistica, JMP●Java, C++, F#●Python, Perl, Ruby, Julia●PostgreSQL: PL/R
10
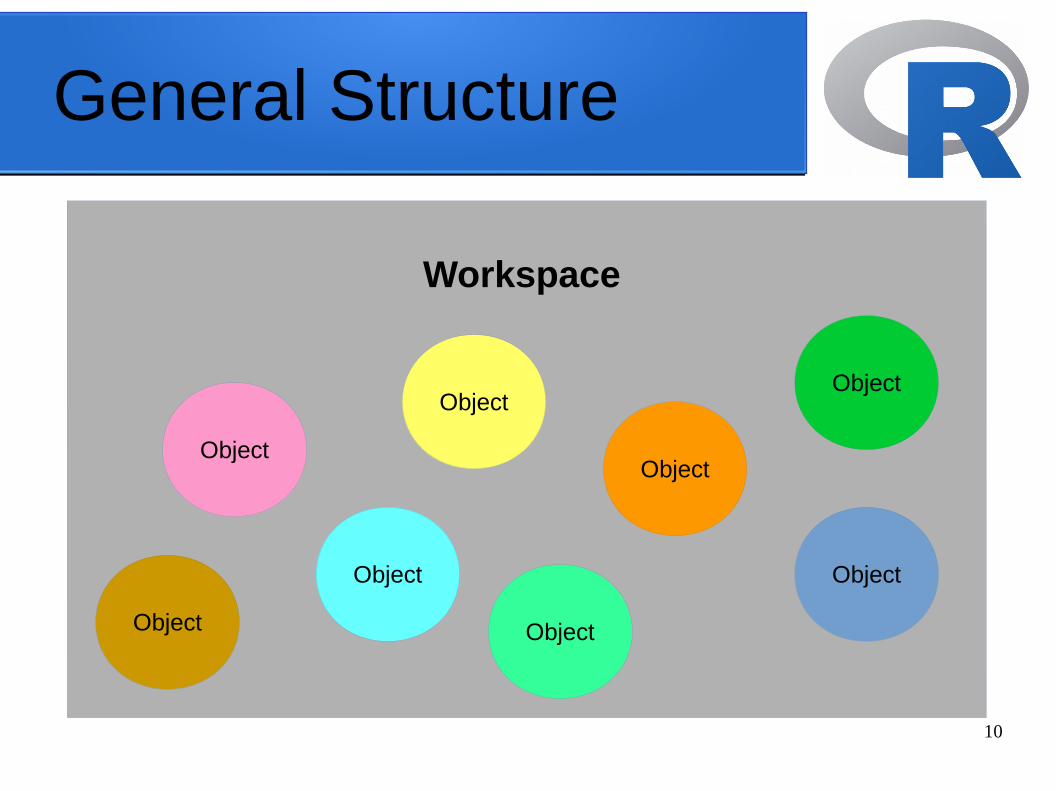
General Structure
Workspace
ObjectObject
Object
Object
Object
Object
ObjectObject
11
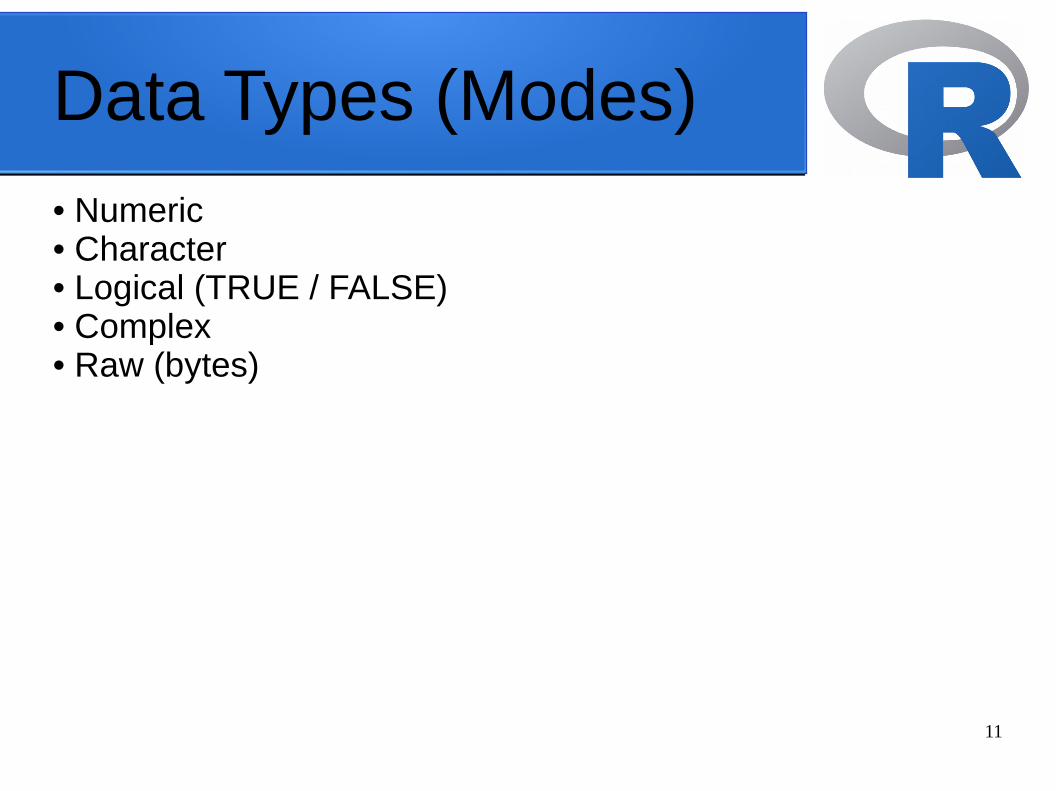
Data Types (Modes)
• Numeric• Character• Logical (TRUE / FALSE)• Complex• Raw (bytes)
12
Data structure
R is an object-oriented language: an object in R is anything (constants, data structures, functions, graphs) that can be assigned to a variable:
● Data Objects: used to store real or complex numerical values, logical values or characters. These objects are always vectors: there are no scalars in R.● Language Objects: functions, expressions
13
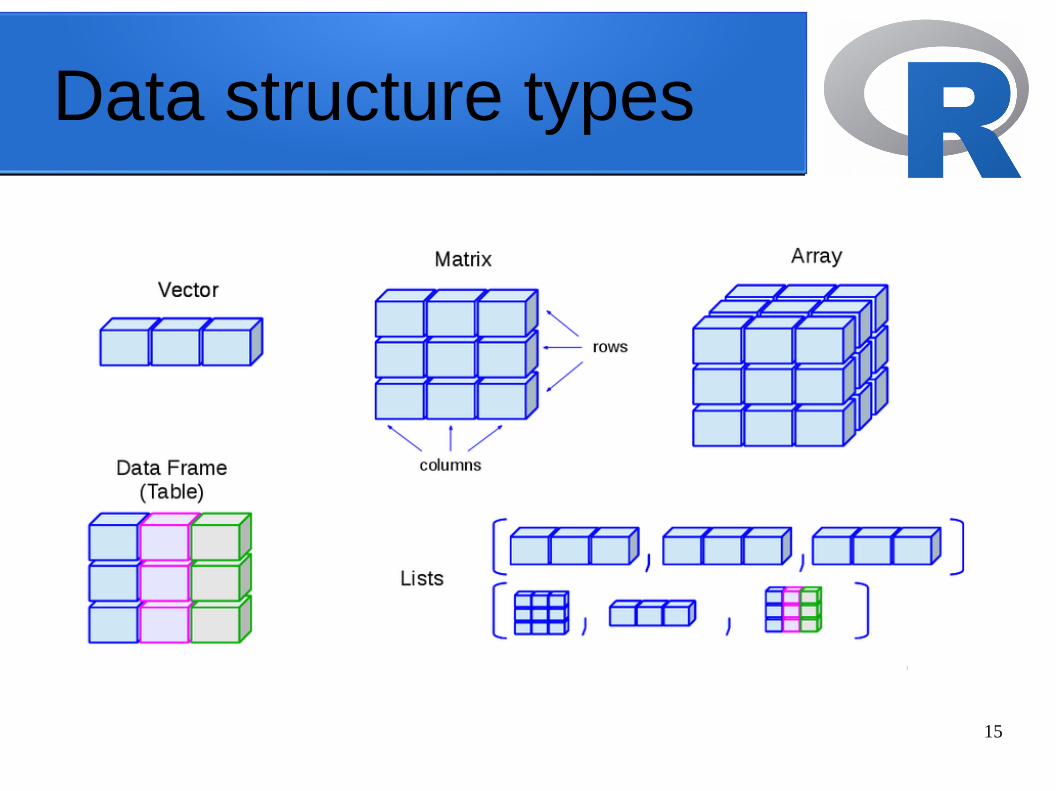
Data structure types
Vectors: one-dimensional arrays used to store collection data of the same mode●Numeric Vectors (mode: numeric)●Complex Vectors (mode: complex)●Logical Vectors (model: logical)●Character Vector or text strings (mode: character)Matrices: two-dimensional arrays to store collections of data of the same mode. They are accessed by two integer indices.
14
Data structure types
Arrays: similar to matrices but they can be multi-dimensional (more than two dimensions)Factors: vectors of categorical variables designed to group the components of another vector with the same sizeLists: ordered collection of objects, where the elements can be of different typesData Frames: generalization of matrices where different columns can store different mode data.Functions: objects created by the user and reused to make specific operations.
15
Data structure types
16
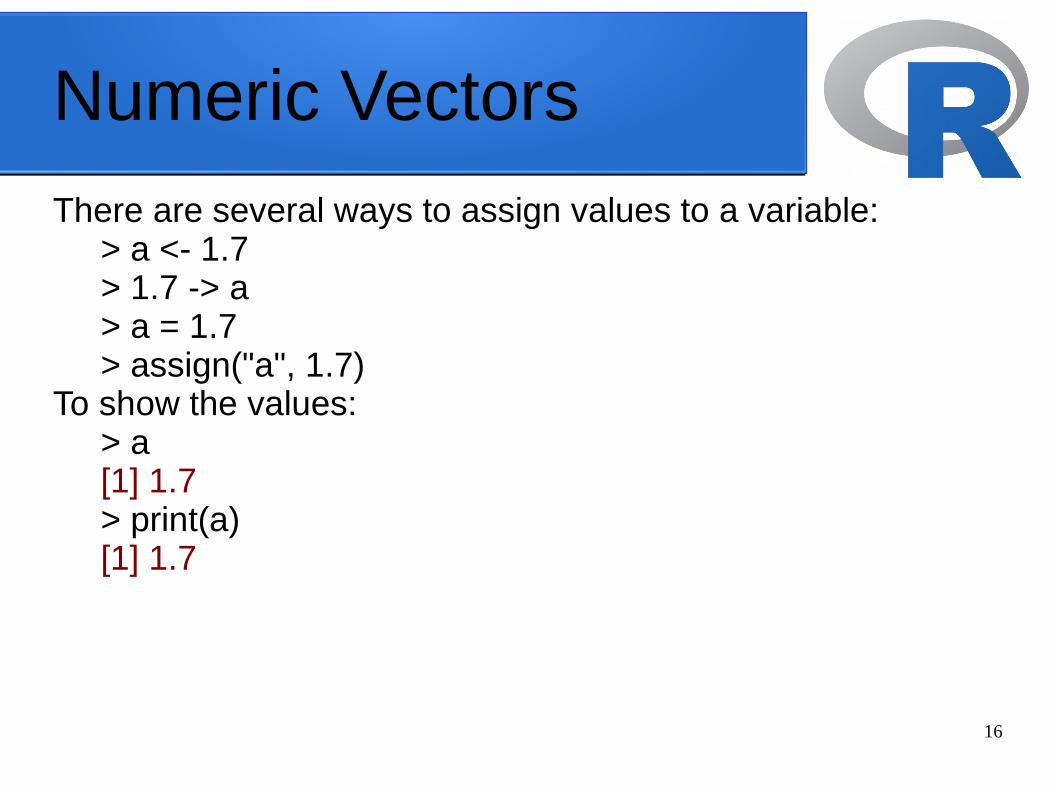
Numeric Vectors
There are several ways to assign values to a variable:> a <- 1.7 > 1.7 -> a > a = 1.7 > assign("a", 1.7)
To show the values:> a [1] 1.7> print(a) [1] 1.7
17
Numeric Vectors
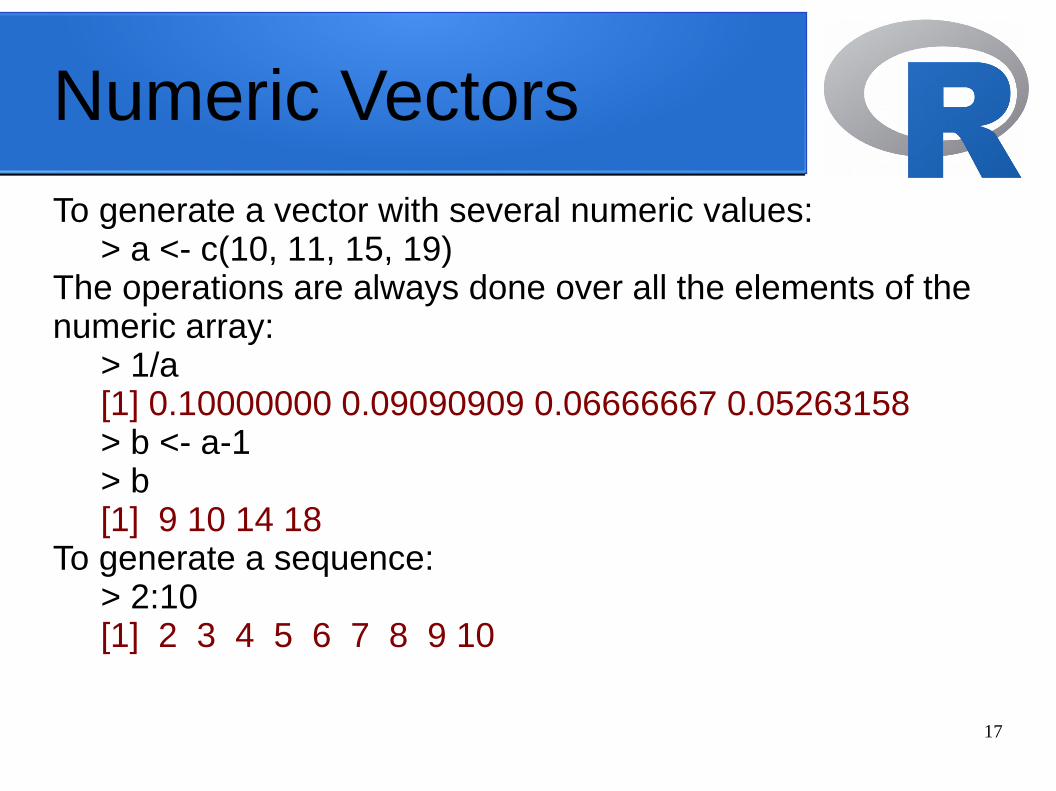
To generate a vector with several numeric values:> a <- c(10, 11, 15, 19)
The operations are always done over all the elements of the numeric array:
> 1/a[1] 0.10000000 0.09090909 0.06666667 0.05263158> b <- a-1> b[1] 9 10 14 18
To generate a sequence:> 2:10 [1] 2 3 4 5 6 7 8 9 10
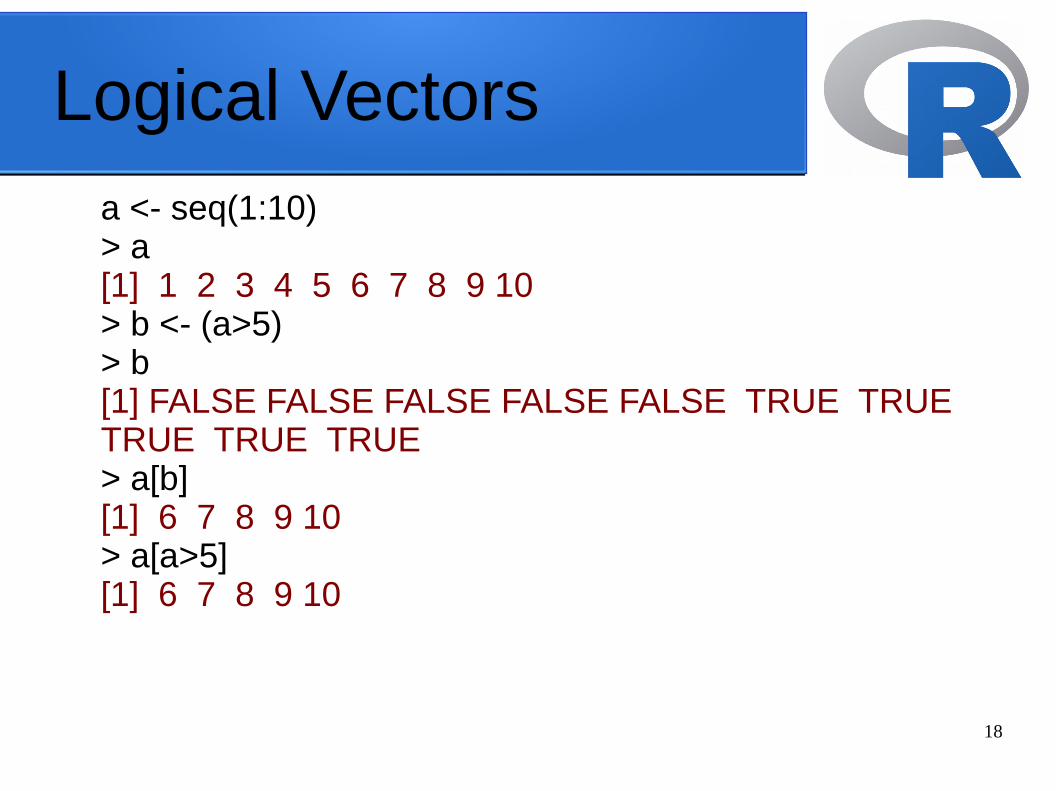
18
Logical Vectorsa <- seq(1:10) > a[1] 1 2 3 4 5 6 7 8 9 10 > b <- (a>5) > b [1] FALSE FALSE FALSE FALSE FALSE TRUE TRUE TRUE TRUE TRUE> a[b] [1] 6 7 8 9 10> a[a>5][1] 6 7 8 9 10
19
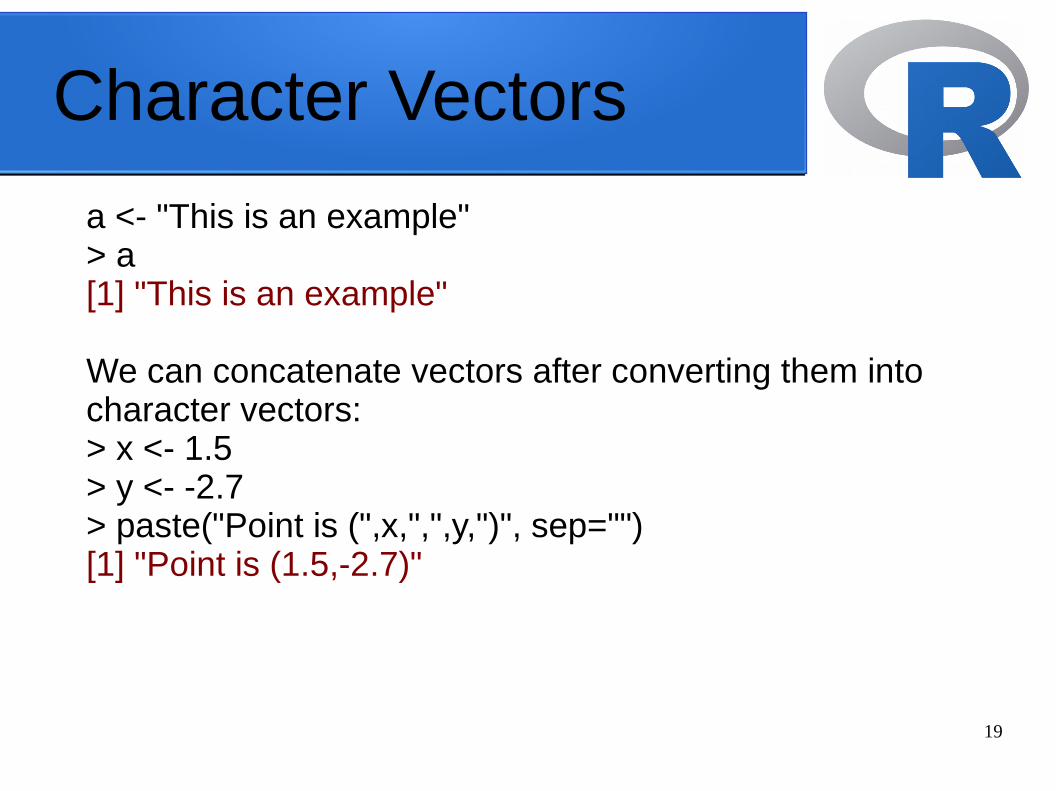
Character Vectors
a <- "This is an example" > a [1] "This is an example"
We can concatenate vectors after converting them into character vectors:> x <- 1.5> y <- -2.7> paste("Point is (",x,",",y,")", sep="") [1] "Point is (1.5,-2.7)"
20
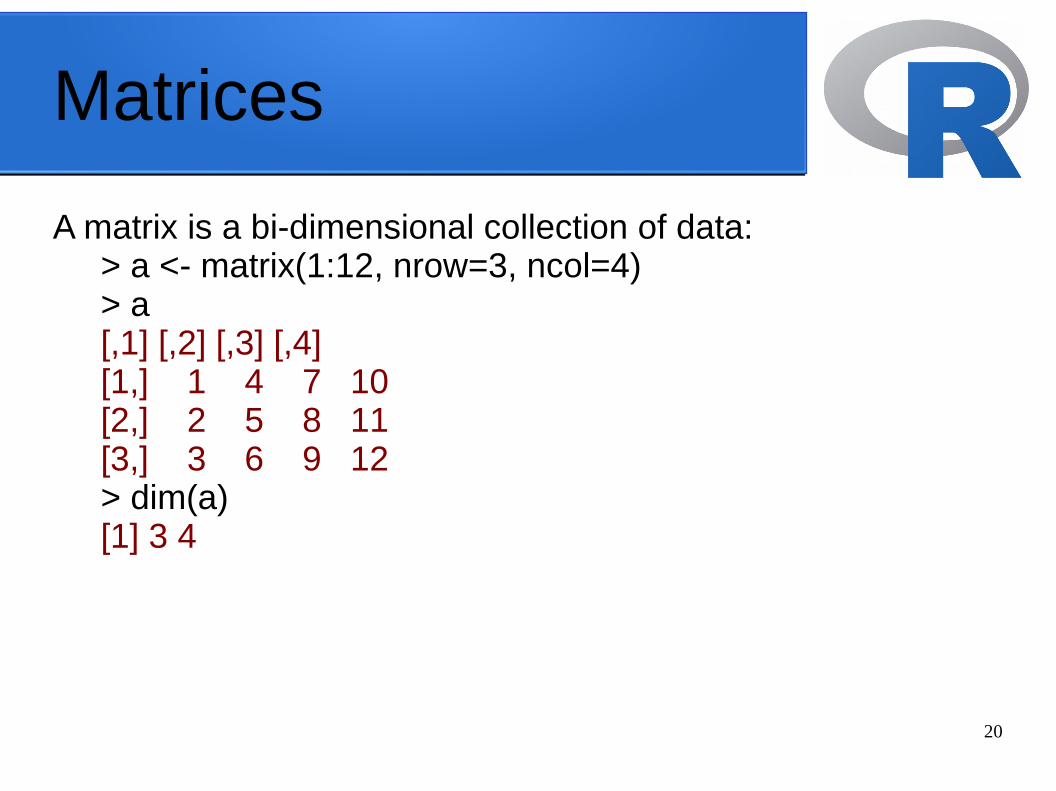
Matrices
A matrix is a bi-dimensional collection of data:> a <- matrix(1:12, nrow=3, ncol=4) > a
[,1] [,2] [,3] [,4][1,] 1 4 7 10[2,] 2 5 8 11[3,] 3 6 9 12> dim(a) [1] 3 4
21
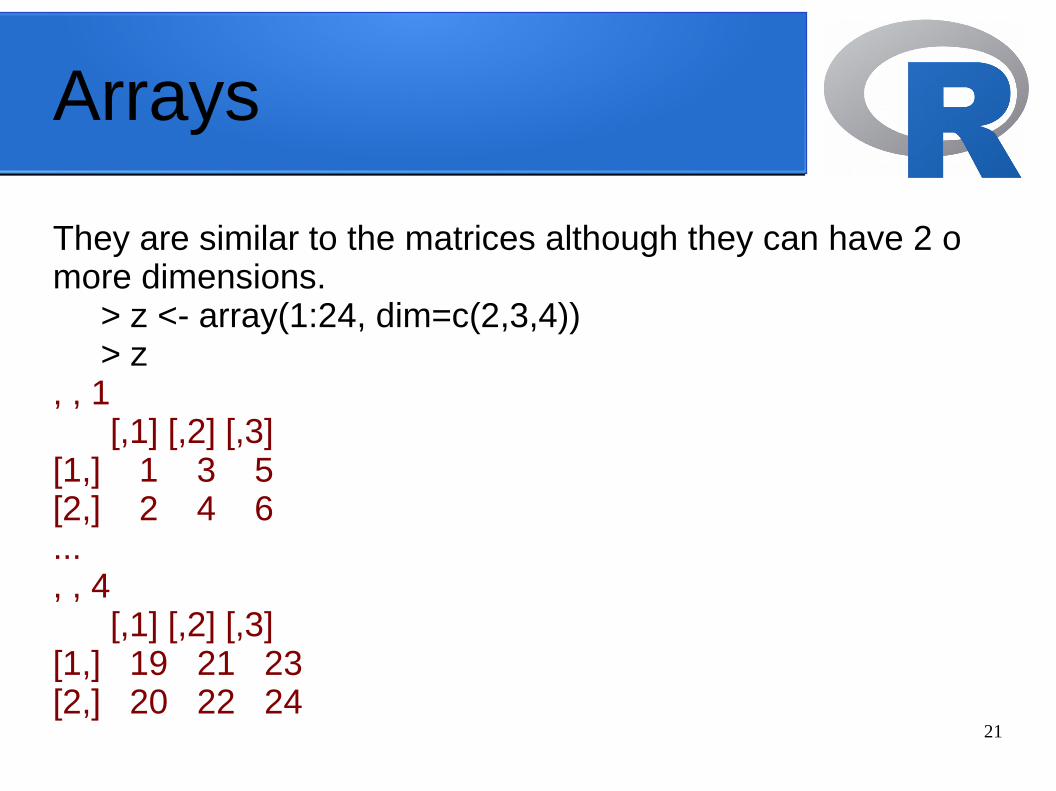
Arrays
They are similar to the matrices although they can have 2 o more dimensions.
> z <- array(1:24, dim=c(2,3,4))> z
, , 1 [,1] [,2] [,3][1,] 1 3 5[2,] 2 4 6..., , 4 [,1] [,2] [,3][1,] 19 21 23[2,] 20 22 24
22
Factors
Factors are vectors that contain categorical information useful to group the values of other vectors of the same size. Let’s see an example:
> bv <- c(0.92,0.97,0.87,0.91,0.92,1.04,0.91,0.94,0.96,+ 0.90,0.96,0.86,0.85) # (B-V) colours from 13 galaxies
23
Lists
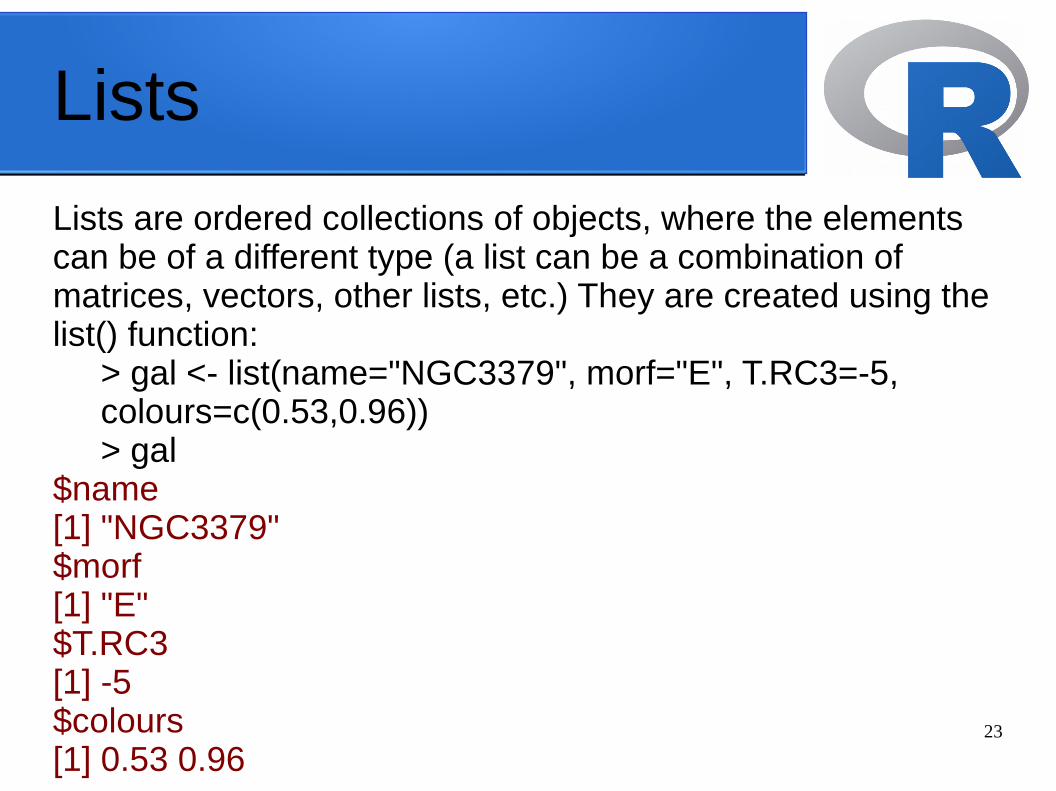
Lists are ordered collections of objects, where the elements can be of a different type (a list can be a combination of matrices, vectors, other lists, etc.) They are created using the list() function:
> gal <- list(name="NGC3379", morf="E", T.RC3=-5, colours=c(0.53,0.96))> gal
$name[1] "NGC3379"$morf[1] "E"$T.RC3[1] -5$colours[1] 0.53 0.96

24
Data Frames (Tables)
A Data Frame is an special type of list very useful for the statistical work. There are some restrictions to guarantee that they can be used for this statistical purpose.Among other restrictions, a Data Frame must verify that:●List components must be vectors (numeric, character or logical vectors), factors, numeric matrices or other data frames.●Vectors, which are the variables in the data frame, must be of the same length.
25
Control statements● Conditional execution : if statements● Repetitive execution: for loops, repeat and while
26
if statements
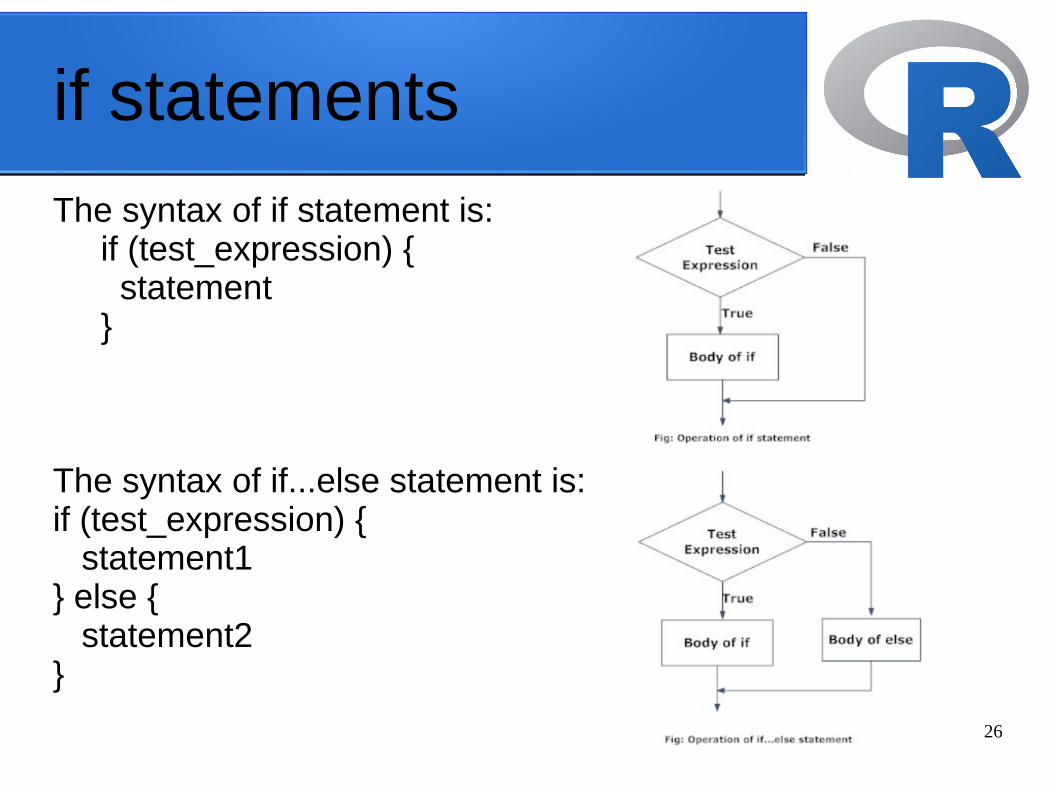
The syntax of if statement is:if (test_expression) {
statement}
The syntax of if...else statement is:if (test_expression) { statement1} else { statement2}
27
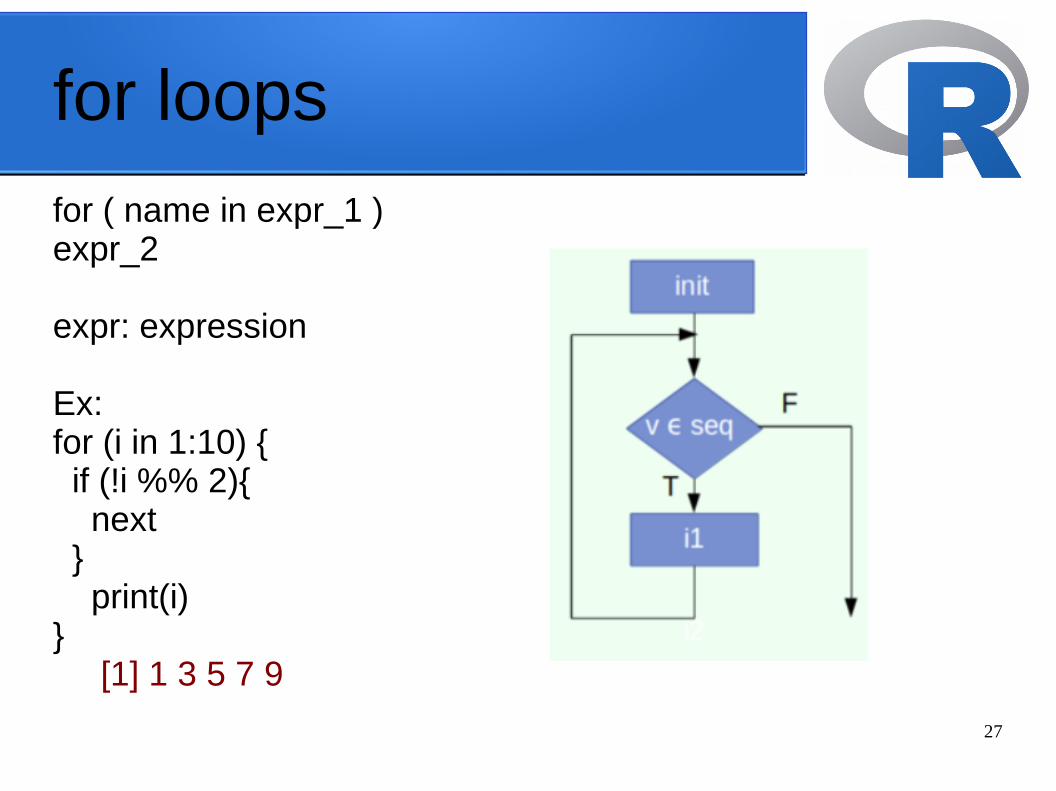
for loops
for ( name in expr_1 )expr_2
expr: expression
Ex:for (i in 1:10) { if (!i %% 2){ next } print(i)}
[1] 1 3 5 7 9
28
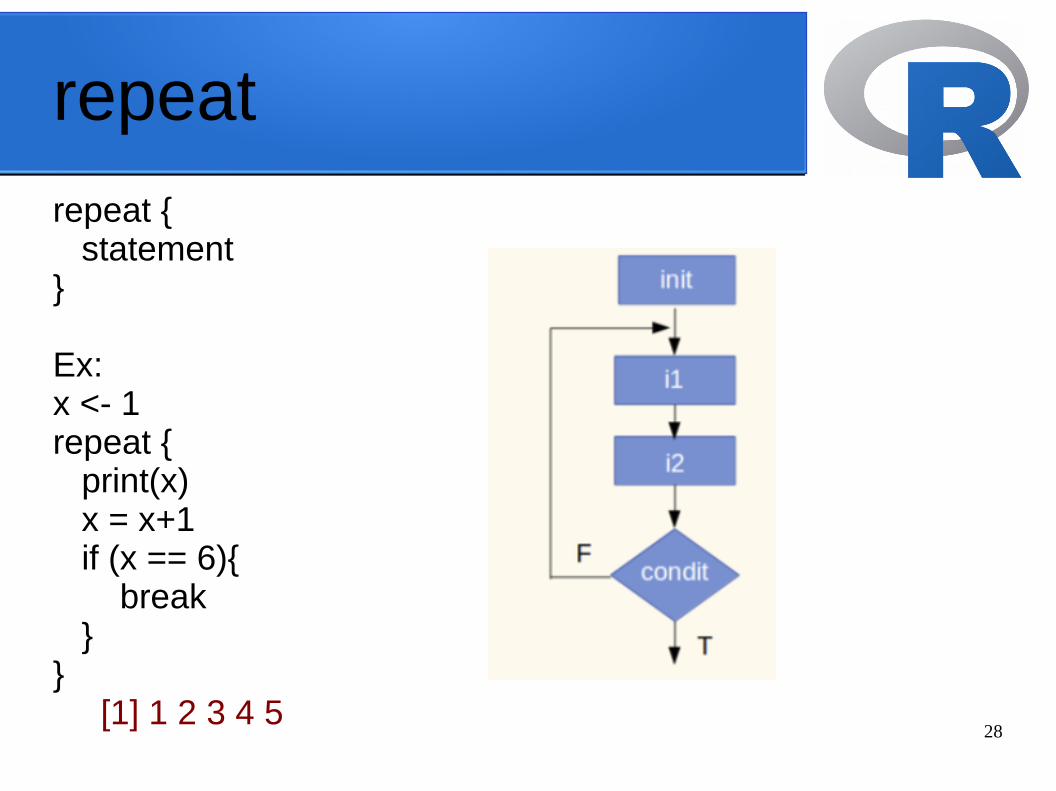
repeat
repeat { statement}
Ex:x <- 1repeat { print(x) x = x+1 if (x == 6){ break }}
[1] 1 2 3 4 5
29
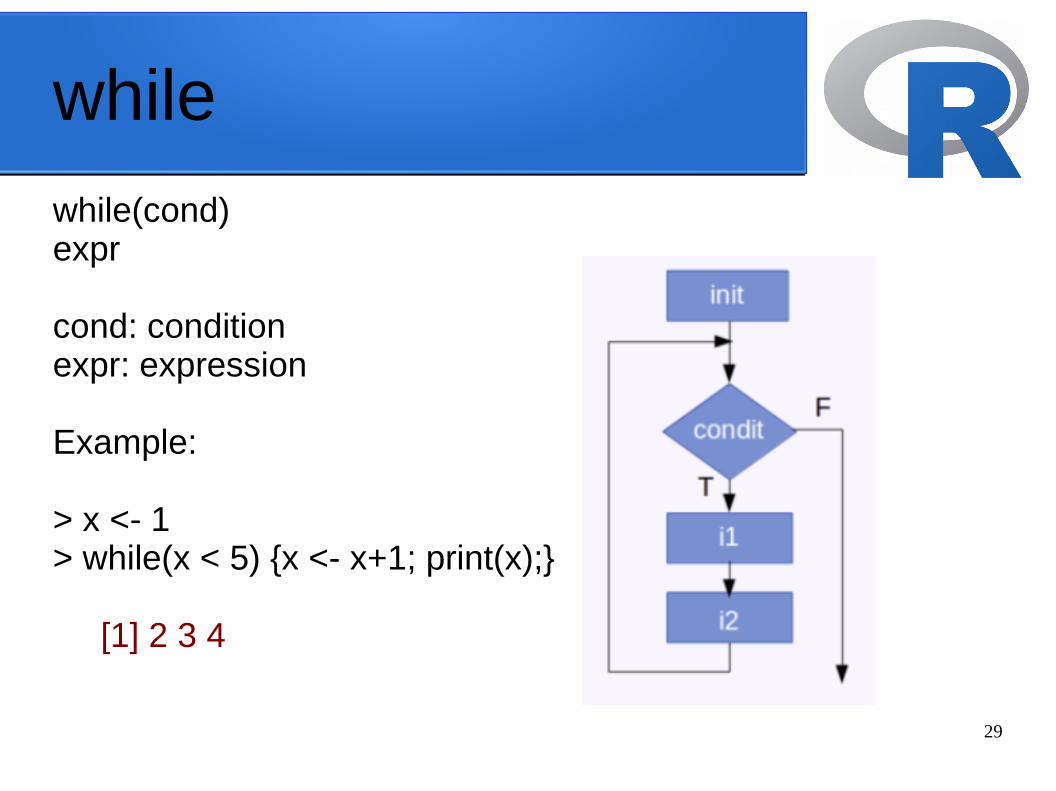
while
while(cond) expr
cond: conditionexpr: expression
Example:
> x <- 1> while(x < 5) {x <- x+1; print(x);}
[1] 2 3 4
30
Operators
We have the following types of operators in R programming:● Arithmetic Operators ( + , - , * , / , %% [give the remainder] , %/% [result of division or quotient] , ^ [exponent] )● Relational Operators ( > , < , == , <= , >= , != )● Logical Operators ( & , | , ! , && , || )● Assignment Operators ( ← or = or < [Called Left Assignment ] , → or →> [Called Right Assignment] )●Miscellaneous Operators ( : [creates the series of numbers in sequence for a vector] , %in% [This operator is used to identify if an element belongs to a vector] , %*% [multiply a matrix with its transpose] )
31
read and write
In R, we can read data from files stored outside the R environment. We can also write data into files which will be stored and accessed by the operating system. R can read and write into various file formats like csv, excel, xml etc.
read.table()Ex:Mydata ← read.table(“c:/test/data.txt”)if you want to use back slash you should do this:Mydata ← read.table(“c:\\test\\data.txt”)
write.table(x, file=” ”)write.csv2(x, file=”*.csv”)

32
User Interfaces for R
Rstudio Integrated development environment (IDE) for R Rattle Gnome cross platform GUI for Data Mining using RRed-R Open source visual programming interface for Rdeducer Intuitive, cross-platform graphical data analysis systemRKWard Easy to use, transparent frontendJGR Universal and unified graphical user interface for RR Commander Basic-Statistics GUI for Rterminal Linux terminal
33
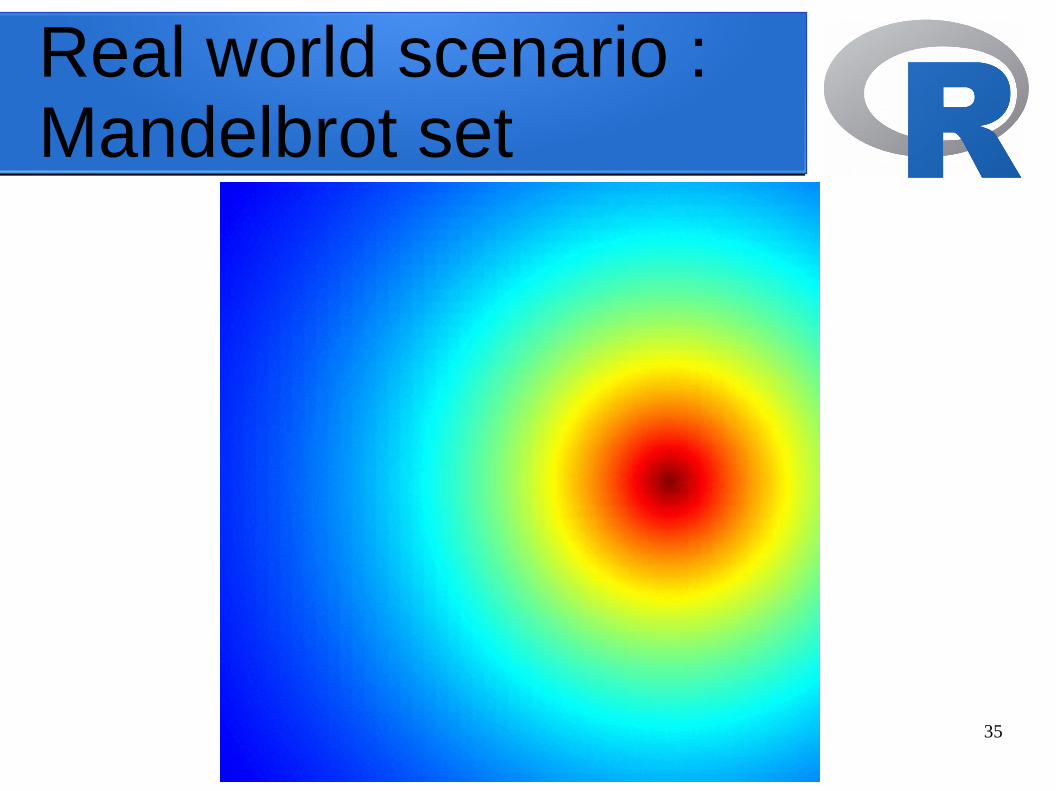
Real world scenario :Mandelbrot setShort R code calculating Mandelbrot set through the first 20 iterations of equation z = z^2 + c plotted for different complex constants c. This example demonstrates:● use of community-developed external libraries (called packages), in this case caTools package● handling of complex numbers● multidimensional arrays of numbers used as basic data type, see variables C, Z and X.
34
Real world scenario :Mandelbrot setinstall.packages("caTools") # install external packagelibrary(caTools) # external package providing write.gif functionjet.colors <- colorRampPalette(c("#00007F", "blue", "#007FFF", "cyan", "#7FFF7F", "yellow", "#FF7F00", "red", "#7F0000"))dx <- 400 # define widthdy <- 400 # define heightC <- complex( real=rep(seq(-2.2, 1.0, length.out=dx), each=dy ), imag=rep(seq(-1.2, 1.2, length.out=dy), dx ) )C <- matrix(C,dy,dx) # reshape as square matrix of complex numbersZ <- 0 # initialize Z to zeroX <- array(0, c(dy,dx,20)) # initialize output 3D arrayfor (k in 1:20) { # loop with 20 iterations Z <- Z^2+C # the central difference equation X[,,k] <- exp(-abs(Z)) # capture results}write.gif(X, "Mandelbrot.gif", col=jet.colors, delay=900)
35
Real world scenario :Mandelbrot set
36
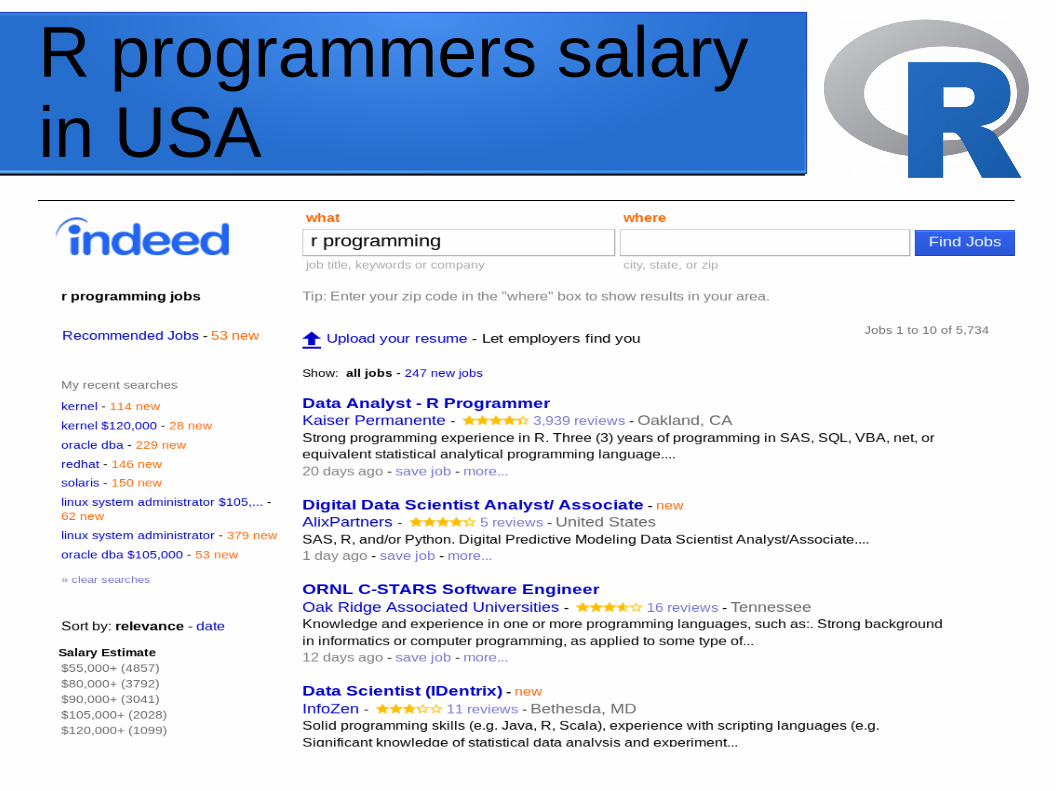
R programmers salary in USA
37
sources
1)http://ect.bell-labs.com/sl/S/2)http://adv-r.had.co.nz/Environments.html3)http://cran.ma.imperial.ac.uk/doc/contrib/Raeesi-SNA_in_R_
in_Farsi.pdf4)http://venus.ifca.unican.es/Rintro/dataStruct.html5)https://www.stat.auckland.ac.nz/~paul/ItDT/HTML/node64.h
tml6)http://www.ahschulz.de/pub/R/data_structures/Data_Struct
ures_in_R_web.pdf7)https://cran.r-project.org/doc/manuals/r-release/R-intro.pdf8)https://www.datacamp.com/community/tutorials/tutorial-on-l
oops-in-r#gs.i08v0N0