an economic welfare analysis of agricultural subsidies … · be effective at reducing excess...
TRANSCRIPT
International Journal of Food and Agricultural Economics
ISSN 2147-8988, E-ISSN: 2149-3766
Vol. 5, No. 4, 2017, pp. 63-79
63
AN ECONOMIC WELFARE ANALYSIS OF AGRICULTURAL
SUBSIDIES AND INVENTORY HOLDINGS: AN APPLICATION TO
THE HAZELNUT INDUSTRY1
Muhammet Yunus Şişman
Dumlupınar University, Faculty of Economics and Administrative Sciences,
Department of Economics, Kütahya, Turkey
Email: [email protected]
Abstract
This study presents an industry model developed to analyze the link between targeted
production subsidies and excess inventory holdings by using equilibrium displacement
modelling. A major question to be investigated is whether a targeted production subsidy can
be effective at reducing excess inventory while providing welfare gains to the domestic
producers. Monte Carlo simulation results suggest that the policy is expected to achieve its
objectives as it improves the welfare of targeted producers and reduces government
inventories. The average cost of an increase in the production subsidy to taxpayers would have
been 22 percent higher had treasury gains from reduced inventories not been taken into
account in the welfare analysis.
Key words: Applied welfare analysis, Hazelnut, Monte Carlo simulation, Partial equilibrium,
Storage
JEL Classifications: Q17, Q18
1. Introduction
Many countries provide agricultural support to their domestic producers by means of a
variety of policy measurements (i.e., production subsidies, price supports). The economic
consequences of these policies are well documented in the literature (e.g., Rucker and
Thurman, 1990; Houck, 1986). This study aims to provide a detailed view of the economic
impacts of targeted production subsidies on producer groups, domestic and export market
consumers in a large open economy where overproduction and excess inventory holdings are
significant concerns for the government and the industry in question. To accomplish this goal,
an industry model is developed to analyze the link between targeted production subsidies and
excess inventory holdings by using an equilibrium displacement model approach. The Turkish
hazelnut industry was selected to show welfare distribution effects of targeted production
subsidies and to outline the relationship between production subsidies and carry-over stocks
as the Turkish hazelnut industry is a highly relevant case to analyze this relationship.
Turkey is the leading supplier and exporter of hazelnuts (also known as filberts). The
country accounts for approximately 75% of the world hazelnut production and 81% of total
world exports during the last decade (International Nut Council, 2012). Despite having the
largest share of the global hazelnut trade, the Turkish treasury has had to finance the cost of
over production and excess inventory holdings.
The Turkish government has been supporting the hazelnut growers mainly through
guaranteed purchases to regulate the market price, particularly, in the high production years
since 1964, due to the socioeconomic and strategic importance of hazelnuts. After a record
An Economic Welfare Analysis of Agricultural Subsidies..
64
harvest in 2008, government inventories reached up to 95% of the domestic production in
2009. The financial burden of the guaranteed purchase policies led the state to initiate new
policies in 2009.
According to the new policies (The Official Gazette of the Turkish Republic, 2009), the
government ended guaranteed purchases and instead provided land-based subsidy payments
to licensed2 hazelnut growers only. The targeted production subsidy aimed to achieve two
objectives. The first objective was to provide support to licensed farmers who were highly
dependent on hazelnut production in native hazelnut farmlands. The second objective was to
decrease the standing inventories by stimulating exports and domestic consumption through
lowered market prices. At the same time, the government offered diversion payments to
unlicensed producers in effort to reduce the acreages of hazelnut grown by unlicensed
producers.
Findings of this research suggest that targeted production subsidies are effective policy tool
for increasing welfare surplus to targeted producer groups and reducing government
inventories. Particularly, the targeted production subsidy stimulates exports and domestic
market consumption associated with lowered market prices to a greater extent than the
domestic production, thereby, reducing the level of carry-over stocks. Although, the elasticity
of inventory with respect to the subsidy is inelastic at 0.05, the cost of the targeted production
subsidy might be less than the actual amount paid by taxpayers due to high volume of
government stocks.
The paper continues with an overview of the hazelnut industry and governmental policies,
as well as a brief literature review concerning the economic impacts of supply control and
support policies. The following sections contain a graphical analysis of the economics of the
targeted production subsidy and present an industry model to investigate the link between
targeted production subsidies and inventory holdings using an equilibrium displacement
model. After the model simulation and discussion of the welfare distribution effects of
production subsidy, the paper concludes with policy recommendations and a summary of
findings.
2. An Overview of Turkey’s Hazelnut Industry and the Government Policies
Hazelnut cultivation is native to the steep lands in the Black Sea region of Turkey. These
steep lands are referred to “The First Standard Region” where the local ecology generally is
not suitable for production of other crops. The Second Standard Region covers the western
part of the Black Sea region. The landscape in this region is flatter and includes more fertile
lowlands that are ecologically suitable for growing a variety of crops which would otherwise
be imported.
The government of Turkey intervened into the hazelnut market mainly by providing
guaranteed purchases at the farm level. Additionally, small amounts in the form of direct
income payments were often provided by the government to support hazelnut growers. From
1964 to 2009, the Hazelnut Growers Union (HGU) and the Turkish Grain Board (2006-2009)
made all purchases financed by the Turkish treasury (National Hazelnut Council, Hazelnut
Report 2012). The government did not set a production quota at the time, and the HGU was
required to make purchases from all growers (i.e., licensed and unlicensed farmers) at the price
set by the government.
Relatively high support prices have led to a major expansion in the area dedicated to
hazelnut cultivation and caused significant amounts of excess production and inventory
accumulation. Bozoglu (2005) reported average margins of the support prices with respect to
production costs at 38.1% and 68% for the periods of 1964-1993 and 1994-2000, respectively.
The price support system in the form of a price floor set by the government caused hazelnut
farmlands to double in acreage, resulting in a four-fold increase in hazelnut production
M. Y. Şişman
65
between 1964 and 2011. The total area dedicated to hazelnut production considerably
expanded from 253,000 (ha) in 1964 to around 650,000 (ha) in 2009 (Hazelnut Industry Report
2010, Department of Commerce). Parallel to this expansion in total acreage, hazelnut
production increased from 147,000 tons in 1964 to a record level of 800,000 tons in 2008,
primarily due to favorable climatic conditions coinciding with an on-production year. Bozoglu
(2009) reports 65 % of the total acreage expansion and 55% of the increase in total production,
occurred in the second standard region between 1964 and 2008.
Due to the guaranteed purchase policies, the government had to bear the financial costs of
excess production resulting in ending stocks that consistently increased until 2008. The
government converted surplus stocks into hazelnut oil, which has very low economic value
relative to the nut themselves. In order to control the industry output, the Turkish government
initiated new policy measurements that restricted subsidy payments to licensed producers and
offered diversion payments to unlicensed producers.
According to the new policies implemented in 2009, the government ended guaranteed
purchases, and provided a production subsidy to licensed producers and diversion payments
to unlicensed growers based on their planted acreages. Licensed producers received an annual
payment of 1,000 USD per hectare in the marketing years of 2009 and 2010, and 833 USD in
20113. The goals of the subsidy policy were to support farmers who were highly dependent on
hazelnut production due to the topographic characteristics of the first standard region and to
decrease ending inventories by stimulating exports and domestic consumption by lowering
market prices, in addition, the government.
The policy included diversion payments for unlicensed producers in effort to reduce the
acreage of unlicensed hazelnut farmlands and to promote alternative crop production in the
second standard region. This region is more suitable for growing a variety of produce as it is
flatter and fertile compared to the first standard region. Consequently, land based diversion
payments were offered to unlicensed producers. The diversion payments included a one-time
payment of 1,000 USD/ha for replacing hazelnut orchards with alternative crops and
associated inputs costs. Additionally, the government offered diversion payments of 1,000
USD/ha per year to unlicensed producers during the policy period.
However, the policy failed to achieve its goal of reducing hazelnut acreages in the second
standard region at the end of the effective policy period. According to the Department of
Agriculture, applications for diversion payments accounted for only 1,500 (ha) or 1% of the
targeted area (see Table 1).
Table 1. Hazelnut Planted Area and Production for Standard Regions (1,000 ha)
Years
I. Standard
Region
II. Standard
Region Total
% Change in II. Standard
Region
2000-2002 387 168 555 2.5
2003-2005 452 183 635 8.9
2006-2008 481 183 664 0
2009-2011 485 184 669 0.5
Source: Calculated from the Turkish Statistical Institute data.
Note: I. Region mostly consists of provinces in east part of the Black Sea territory with more
than 6% slope. Farmlands with less than 6% slope and that has altitude less than 750 meters
considered as 2nd standard region.
Since diversion payments only covered approximately 25% of producer prices, once the
land based diversion payments were converted into per kilogram value, they were insufficient
to result in the intended policy goals. Therefore, the regulation for diversion payments is not
included in the analysis.
An Economic Welfare Analysis of Agricultural Subsidies..
66
3. Contribution to Existing Literature
The applied literature provides a great amount of research that examined the economic
impacts of the supply control and support policies, particularly, for storable agricultural crops
as overproduction and excess inventory holdings are among the major concerns of policy
makers. For instance, the US peanut program employed a number of complex policy tools to
regulate the industry outcome and to increase and stabilize the producer prices since 1934.
Rucker and Thurman (1990) reviewed the history of US peanut program and provided an
economic analysis of supply control and support policies (i.e., poundage quota, the quota
support price, and buy-back provisions) in US peanut industry. McDonald and Sumner (2003)
investigated the crop supply response to support policies including direct payments in the form
of marketing loans and deficiency payments based on the choice of planted acreages. Sumner
and Wolf (1996) examined the economic impact of California dairy policies, a production
quota system which did not restrict production or marketing of the fluid milk but “modifies
how the end-use class prices affected milk prices faced by producers”. Authors concluded that
the California dairy program created more producer gains and less welfare losses compared to
the typical marketing quotas applied in other dairy markets.
This study employs an equilibrium displacement model as a way to conveniently measure
the economic impacts of supply shift due to a targeted production subsidy on producer groups,
domestic and export market consumers in a large open economy where overproduction and
excess inventory holdings are significant concerns for the government and the industry in
question. As Piggott (1992) suggested, the main strength of the EDM is its usefulness in
qualitative assessments of the impacts of changes in exogenous variables on endogenous
variables without having any assumptions about functional forms.
EDM has been widely used to analyze the impacts of various supply and demand shocks
for a wide range of agricultural products in the applied literature4. However, inventory
holdings were commonly considered as working inventories; thus, were suppressed in
economic analyses reported in these studies. For instances, Kinnucan and Belleza (1995)
developed an industry model to investigate the Canada’s dairy advertising programs while
accounting for the government purchases using equilibrium displacement model. Wohlgenant
and Clary (1993) employed an EDM approach to examine the link between government
purchases and advertising as well as the relationship between support prices and government
purchases in US dairy market. Both studies found advertising program significantly reduces
government costs. These analyses, however, did not explicitly consider the economic impacts
of the changes in inventory holdings.
Regarding the welfare impacts of subsidy programs, considerable attention has been
focused on the role of agricultural subsidies in the domestic and global markets (Gardner,
1983; Houck, 1986; Abbott et al., 1987). Yet, relatively few researches considered the ending
stocks in their welfare analysis.
Alston et al. (1993) investigated the implications of deadweight costs of agricultural
subsidy programs for optimal income distribution policies in a large open economy (i.e., able
to influence world price). Their analysis compared the welfare implications of export and
production subsidies and suggested that government outlays can be minimized by
implementing an appropriate subsidy program (i.e., export or production subsidy), depending
on domestic and export market shares and corresponding price elasticities. They additionally
noted that a subsidy for a storable product that is worth a dollar on the market may cost less
than a dollar to tax payers due to the reduction in government stocks.
Sadoulet and Janvry (1995) examined various types of production subsidies and found that
when a government supports farmers without production control, and lets the market clear
under the subsidized price, the financial burden on tax payers will be exceedingly high due to
M. Y. Şişman
67
the fact that the government subsidizes producers with higher prices and consumers with lower
market prices. They concluded that such subsidy policies will create a net social loss.
In a recent study, Koo and Kennedy (2006) investigated the effects of agricultural subsidies
on global welfare where they accounted for beginning and ending stocks in their analysis5.
Koo and Kennedy (2006) found that export subsidy programs caused larger trade distortions
compared to domestic production support. The authors also suggested that for a large exporting
country, production subsidies harm producers in other exporting countries, benefit the
consumers in the rest of the world, and result in net global welfare loss.
This research contributes to the existing literature by introducing an industry model to
analyze the link between targeted production subsidies and excess inventory holdings using an
equilibrium displacement model approach. Furthermore, welfare distribution effects of
targeted production subsidies are discussed, particularly, for treasury gains or losses associated
with the changes in inventory holdings. Thus, the analysis sheds light on the welfare
implications of the inventory holdings which are not addressed in the literature.
4. Graphical Analysis
The economics of a targeted production subsidy in a partial equilibrium setting is illustrated
in figure 1. The analysis is based on certain theoretical assumptions which are also applied in
the conceptual model. Following Kinnucan and Zhang (2004), these assumptions include: (a)
product in question is a homogenous good; (b) supply and demand curves are linear in the
relevant region; (c) policy in question is assumed to cause parallel shifts in supply and demand
curves; (d) competitive market conditions hold; (e) law of one price holds in all markets; and
(f) the country in question is sufficiently large in the sense that it can influence the world
prices.
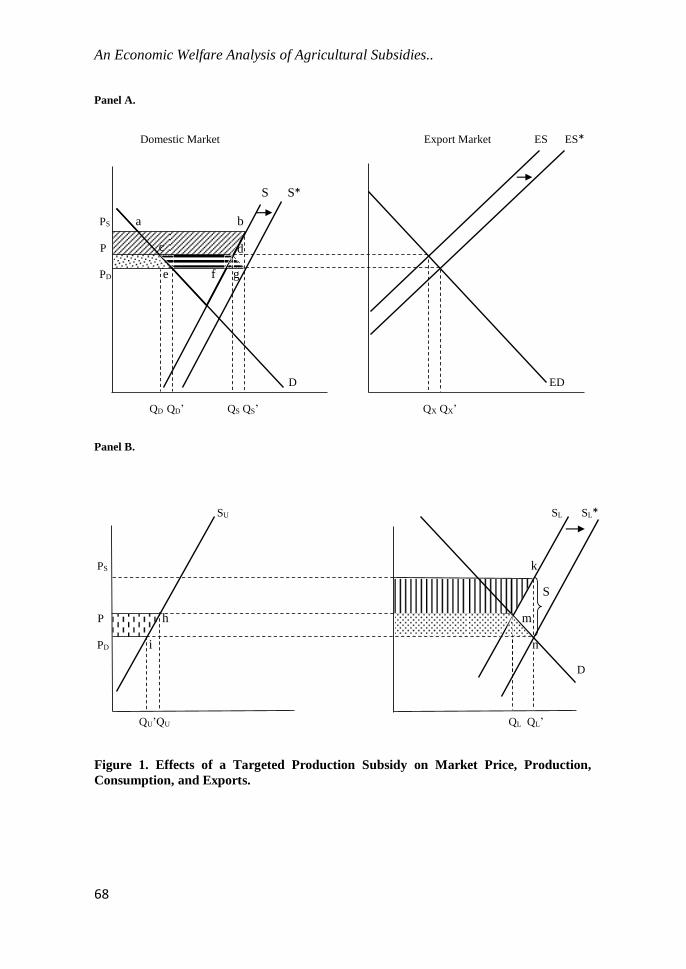
Figure 1 shows an aggregated supply curve (S), a domestic demand curve (D), an excess
supply curve to the rest of the world (ES), and an export demand curve (ED). Competitive
market clearing occurs at the initial world equilibrium price P with total domestic production
QS comprising domestic consumption QD and exports QX in panel A. The domestic supply is
disaggregated into unlicensed supply curve SU and licensed supply curve SL (where, QS = QU
+ QL) in panel B. When a targeted production subsidy of S per unit is introduced to the licensed
producers, the licensed supply curve shifts to SL*. The licensed producers expand the
production to QL’ as the subsidy lowers the cost of production, and, in turn, increases the
market supply price of the product to PS. The licensed producer surplus increases by the area
of trapezoid PPsmk. Under the new equilibrium, unlicensed producers decrease their
production to QU’ associated with lower market price PD. The welfare loss for unlicensed
producers is depicted by the dashed area PPd hi in panel B. The aggregate impact of the targeted
subsidy on total supply depends on whether the expanded production by the licensed producers
is less or greater than the reduced production by the unlicensed producers. The reduced-form
elasticities derived in the following section suggest that an increase in the targeted subsidy
expands the aggregate production.
The production subsidy causes the domestic consumer surplus and the net foreign surplus
to increase by the trapezoid PPd ec and by the lined area cdeg, respectively. Taxpayers finance
the cost of the program illustrated with rectangle PsPd kn. Thus, the net change in domestic
welfare6 is equal to the sum of welfare increases for licensed producers and domestic
consumers (PPsmk + PPd ec), the welfare loss of unlicensed producers (PPshi), and the
government outlays (rectangle PsPd kn).
An Economic Welfare Analysis of Agricultural Subsidies..
68
Figure 1. Effects of a Targeted Production Subsidy on Market Price, Production,
Consumption, and Exports.
Panel A.
Domestic Market Export Market ES ES*
S S*
PS a b
P c d
PD e f g
D ED
QD QD’ QS QS’ QX QX’
Panel B.
SU SL SL*
PS k
S
P i h m
PD i n
D
QU’QU QL QL’
c d
M. Y. Şişman
69
5. Conceptual Model
The nature of the subsidy program requires the disaggregation of the domestic hazelnut
production into acreage and yields because the subsidy payments are based on the planted
acreages. Following Houck and Gallagher (1976), the supply equation is specified as a
function of acreage and yield. Total production is calculated as the acreage multiplied by the
yield. Then, the elasticity of supply is equal to the sum of acreage and yield response
elasticities. This specification allows the analysis to disaggregate the total supply into licensed
and unlicensed farm productions. Thus, it is useful for a clear identification of the impacts of
the production subsidy provided for the licensed growers only.
Excess inventory is one of the main concerns in the domestic hazelnut market. Therefore,
the Turkish government aimed to reduce the ending stocks by stimulating exports and domestic
consumption via production subsidy. This study uses an industry model that accounts for
beginning and ending government stocks in the hazelnut market. Following Koo and Kennedy
(2006), ending inventories are expressed as a function of the market price which implicitly
reflects the impact of the subsidy payments. Although an increase in the current market price
reduces the consumption, it expands the production. The increased production and decreased
consumption cause the ending inventories to accumulate. Thus, the price elasticity of ending
inventories is positive. The targeted subsidy is expected to decrease the market price and
increase targeted producer prices. The magnitudes of changes in quantity demanded and
quantity supplied will determine the levels of ending inventory holdings.
Consider the following partial-equilibrium model for an industry that produces
homogeneous products for sale in domestic and export markets:
𝑄𝐷 = 𝐷(𝑃𝐷) (1)
𝑄𝑋 = 𝑋(𝑃𝐷) (2)
𝑄𝑆 = 𝑌𝐿𝐴𝐿 + 𝑌𝑈𝐴𝑈 (3)
𝐴𝐿 = 𝐴(𝑃𝐿) (4)
𝐴𝑈 = 𝐴(𝑃𝐷) (5)
𝑃𝐿 = 𝑃𝐷 ∗ 𝑃𝑆𝐿 (6)
where 𝑃𝑆𝐿 = 1 + 𝑃𝑆/𝑃𝐷
𝐼𝑁𝑉𝐸 = 𝑓(𝑃𝐷) (7)
𝑄𝑇𝑆 = 𝑄𝑆 + 𝐼𝑁𝑉𝐵 (8)
𝑄𝑇𝐷 = 𝑄𝐷 + 𝑄𝑋 + 𝐼𝑁𝑉𝐸 (9)
𝑄𝑇𝑆 = 𝑄𝑇𝐷 (10)
Equations (1)-(10) present the structural model for the hazelnut industry under the
competitive clearing assumption. 𝑃𝑆𝐿 is an operator for price linkage equation. The variable
definitions and corresponding values are presented in Table 2. The model contains ten
endogenous variables (𝑄𝐷, 𝑄𝑋, 𝑄𝑆,𝐴𝐿, 𝐴𝑈, 𝑃𝐿 , 𝑃𝐷, 𝐼𝑁𝑉𝐸 , 𝑄𝑇𝑆, 𝑄𝑇𝐷) and four exogenous
variables7 (𝑌𝐿, 𝑌𝑈, 𝑃𝑆, 𝐼𝑁𝑉𝐵). Exogenous variables other than primary interest are held
constant in the model and the analysis will focus on the impacts of the land based subsidy.
Equations (1) and (2) represent the consumer demand in the domestic and export markets.
Three supply equations (3)-(5) capture the domestic production with respect to the licensed
and unlicensed acreages. The price linkage equation (6) accounts for the relationship between
the proportional targeted production subsidy and the price received by licensed producers.
Equation (9) shows the total quantity demanded, which consists of the sum of consumer
demands in domestic and export markets and the ending inventories denoted in equation (7).
Market clearing is expressed in equation (10) where the total quantity demanded is equal to

An Economic Welfare Analysis of Agricultural Subsidies..
70
the total quantity supplied represented as the sum of domestic production and beginning
inventories in equation (8). Table 2 contains the variable values for the effective policy period
of 2009-2011.
Table 2. Turkey’s Hazelnut Industry, 2009-2011 Marketing Years
Item Definition 2009 2010 2011 Average
PL Licensed producer price (USD/Kg)a 4.09 4.17 4.60 4.29
PD Consumer price (USD/Kg) 5.87 6.25 5.78 5.97
PS
Subsidy for licensed producers
(USD/Kg) 1.51 1.35 1.61 1.49
INVB Beginning inventories (1,000MT) 525 425 350 433
QS Domestic production (1,000MT) 500 600 430 510
QTS Total quantity supplied including 1025 1025 780 943
beginning inventories (1,000MT)
INVE Ending inventories (1,000MT) 425 350 152 309
QD Domestic consumption (1,000MT) 90 110 100 100
QX Exports (1,000MT) 437 561 459 486
QTD Total quantity demanded including 527 673 711 637
ending inventories (1,000MT)
AL Licensed acreages (1,000 ha) 458 484 512 485
AU Unlicensed acreages (1,000 ha) 184 184 185 184
YL Yield for licensed farms (Kg/ha) 0.66 0.74 0.52 0.64
YU Yield for unlicensed farms (Kg/ha) 1.07 1.31 0.89 1.09
G Government outlays (Million USD) 458 484 427 1369b
Source: Turkish Statistical Institute, USDA
Note: The marketing years start in August 1st. Subsidy payments are converted into per kg
amounts according to regional production.
a Producer prices excluding subsidy payments were 2.58, 2.82, and 3.00 in 2009, 2010, and
2011, respectively.
b The number represents the total government subsidy payments.
To identify the impacts of the government intervention, the model is expressed in the
percentage changes (displaced form) as follows:
𝑄𝑑∗ = −ŋ𝑑 𝑃𝐷
∗ (9)
𝑄𝑥∗ = −ŋ𝑥 𝑃𝐷
∗ (10)
Quantity supplied is specified as a function of yield and acreage in the structural form to
account for the target production subsidy received by the licensed producers. Dividing the total
derivative of equation (3) by total supply provides a useful percentage change form and
converts the yield into a share component.
𝑄𝑠∗ = 𝑘𝐿𝐴𝐿
∗ + 𝑘𝑈𝐴𝑈∗ (11)
where the relative change in supply (𝑄𝑠∗) is represented by the share of licensed and
unlicensed hazelnuts to total production (𝑘𝐿 + 𝑘𝑈 = 1) and respective acreage response
elasticities.
𝐴𝐿∗ = 𝜀𝐿𝑃𝐿
∗ (12)
M. Y. Şişman
71
𝐴𝑈∗ = 𝜀𝑈𝑃𝐷
∗ (13)
𝑃𝐿∗ = 𝑃𝐷
∗ + 𝑃𝑆𝐿
∗ (14)
𝐼𝑁𝑉𝐸∗ = ŋ𝐼𝑁𝑉𝑃𝐷
∗ (15)
𝑄𝑇𝑆∗ = 𝑘𝑆𝑄𝑆
∗ + 𝑘𝐵𝐼𝑁𝑉𝐵
∗ (16)
𝑄𝑇𝐷∗ = 𝑘𝐷𝑄𝐷
∗ + 𝑘𝑋𝑄𝑋∗ + 𝑘𝐸𝐼𝑁𝑉𝐸
∗ (17)
𝑄𝑇𝑆∗ = 𝑄𝑇𝐷
∗ (18)
Variables with an asterisk represent percentage changes such as 𝑄𝑑∗ = d𝑄𝑑/𝑄𝑑. All
parameters are in absolute value including downward sloping demand elasticities. The
parameters in the displaced form are defined in Table 3 with their empirical values.
Table 3. Parameters and Baseline Values
Item Definition Value
ŋ𝑑 Domestic demand elasticity 0.32a
ŋ𝑥 Export demand elasticity 0.63a,b
ŋ𝐼𝑁𝑉 Ending stocks price elasticity 0.29
𝜀𝐿 Licensed acreage response elasticity 0.19
𝜀𝑈 Unlicensed acreage response elasticity 0.23
𝑘𝑑 Domestic quantity share (QD/QTD) 0.11
𝑘𝑥 Export quantity share (Qx/QTD) 0.55
𝑘𝐸 Ending stocks share (INVE/QTD) 0.34
𝑘𝐿 Licensed production share (YL*AL/QS) 0.61
𝑘𝑈 Unlicensed production share (YU*AU/QS) 0.39
𝑘𝑆 Domestic production share (QS/QTS) 0.54
𝑘𝐵 Beginning stocks share (InvB/QTS) 0.46
a Parameters are in absolute value.
b Calculated value based on Gopinath and Saito (2006). See the appendix for details.
Reduced-form elasticity formulas are calculated to illustrate the net effects of a percent
increase in subsidy on endogenous variables, in particular, to determine the effect of a change
in targeted subsidy on the net price received by licensed and unlicensed producers and the
ending government inventories. Solving the equations simultaneously to yield:
𝑃𝐷∗ = −
𝑘𝑆 𝑘𝐿 𝜀𝐿
𝜀+ŋ𝑃𝑆
∗ (19)
𝑃𝐿∗ =
𝜀+ŋ−𝑘𝑆 𝑘𝐿 𝜀𝐿
𝜀+ŋ 𝑃𝑆
∗ (20)
𝐼𝑁𝑉𝐸∗ = −
ŋ𝐼𝑁𝑉𝑘𝑆 𝑘𝐿 𝜀𝐿
𝜀+ŋ𝑃𝑆
∗ (21)
where 𝜀 = 𝑘𝑆 𝑘𝐿 𝜀𝐿 + 𝑘𝑆 𝑘𝑈 𝜀𝑈 and ŋ = 𝑘𝐷ŋ𝐷 + 𝑘𝑋ŋ𝑋 − 𝑘𝐸ŋ𝐸
An increase in production subsidy to licensed producers depresses the market price which
raises the domestic and global market consumptions and reduces the price received by
An Economic Welfare Analysis of Agricultural Subsidies..
72
unlicensed producers. Thus, ending inventories are reduced by increased total demand and
lowered unlicensed production. Conversely, the licensed producer price is positively affected
by an increase in targeted subsidy. The relative effect of the production subsidy on the producer
and consumer prices depends on the domestic and export market shares and corresponding
price elasticities. The more elastic licensed supply causes inventories to stay at higher levels.
For instance, 𝜀𝐿 and 𝜀𝑈 are perfectly inelastic in the short run. Thus, the licensed supply price
rises by the amount of subsidy increase (𝑃𝐿∗/𝑃𝑆
∗ = 1), but the demand price, and thus, the
unlicensed producer price, is unchanged (𝑃𝐷∗ /𝑃𝑆
∗ = 0).
To obtain reduced-form elasticities, the EDM setting is expressed in matrix notation8 as:
ΠY = ΓZ (22)
where Π is a 10 x 10 matrix of parameters (elasticities and shares) of endogenous variables,
Y is a 10 x 1 vector of endogenous variables, Γ is a 10 x 2 matrix of parameters for exogenous
variables, and Z is a 2 x 1 vector of exogenous variables. Pre-multiplying equation (22) by
inverse of Π yields:
Y = EZ (23)
where E = Π−1 Γ is a 10 x 1 matrix containing the reduced-form elasticities. The numerical
values of parameters are assigned in order to calculate the matrix E.
5.1. Model Parameters and Welfare Measures
The existing literature provides very few elasticity estimates for hazelnuts industry. The
domestic demand and inventory elasticities were obtained from Bozoglu (2009). The author
estimated domestic demand and inventory elasticities as 0.32 and 0.29, respectively. Hazelnut
export demand elasticity is one of the key parameters in the analysis owing to the countries
large export shares. Bozoglu (2009) estimated export demand elasticity to be -0.36. Export
demand elasticity for Turkish hazelnuts is recalculated in this study. The nature of the global
hazelnut industry allows derivation of a formula to approximate theoretically consistent export
demand elasticity. Due to Turkey’s very large production and export shares in the world
(approximately 75% and 80%, respectively), the analysis considers the global hazelnut market
consisting of two markets, Turkey and the rest of world (ROW). Thus, Turkey’s export
demand elasticity is equivalent to the ROW’s import demand elasticity which is calculated as
-0.63. (See Appendix for formulas and computational details). The world import demand
elasticity for hazelnuts ranged between -0.58 and -0.80 with an average of -0.63 during the
period of 1961-2011. It is also estimated as -0.63 for the effective policy period of 2009-2011.
Yavuz et al. (2004) estimated price elasticity of hazelnut acreage response between the
range of 0.19 - 0.23. It is expected for unlicensed farms to have a relatively more elastic
acreage response in the long run since the option for growing alternative crops is more
available to them than for licensed farms. Thus, unlicensed farmlands were assigned the upper
range of the elasticity estimates in Yavuz et al. (2004). Quantity shares used in the analysis
are calculated from Table 2. Houck and Gallagher (1976) concluded that total supply
elasticities are seriously underestimated when the yield response is ignored in the calculation.
The analysis includes deterministic and stochastic simulations to address parameter
uncertainty including supply elasticities used in the analysis.
Average prices and quantities for the period of 2009-2011 are used for defining an initial
equilibrium. The impact of any exogenous change to the system (i.e., targeted production
subsidy) is assumed to cause a parallel shift on the relevant market supply curve from the
M. Y. Şişman
73
initial equilibrium.
The welfare distribution effects of an increase in production subsidy on producer groups,
domestic and export market consumers, and treasury are calculated by equations (24) - (26)
adopted from Kinnucan and Cai (2011).
∆𝑃𝑆𝑖 = 𝑃𝑄𝑆𝑖(𝑃𝑖∗ − 𝑉𝑆)(1 + 0.5𝑄𝑆𝑖
∗ ) for i = licensed and unlicensed producers (24)
∆𝐶𝑆𝑖 = −𝑃𝑄𝐷𝑖𝑃𝐷∗ (1 + 0.5 𝑄𝐷𝑖
∗ ) for i = domestic and export market consumers (25)
∆𝐼𝑆 = −𝑃𝑄𝐸𝑃𝐷∗ (1 + 0.5 𝑄𝐸
∗ ) (26)
where ∆𝑃𝑆𝑖 is the change in surplus for a given producer; ∆𝐶𝑆𝑖 denotes the relative change
in consumer surplus in domestic and export markets; ∆𝐼𝑆 represents the change in treasury
surplus due to the potential savings from inventory reduction from increased subsidies;
𝑃, 𝑄𝑆, 𝑄𝐷, and 𝑄𝐸 are initial equilibrium values previously defined. Variables with an asterisk
are the reduced-form elasticities estimated by the displacement model earlier; 𝑃𝑄𝑆𝑖 is the
industry revenue at the farm level for a given producer; 𝑃𝑄𝐷𝑖 is the value of the Turkish farm
exports and domestic consumption; and 𝑉𝑆 is the relative vertical shift in the domestic supply
curve due to the production subsidy. The vertical shift parameter is obtained by solving
equations (11)-(14) simultaneously for 𝑃𝐷∗ with 𝑄𝑆
∗ set zero to yield:
𝑉𝑆 =−𝑘𝐿 𝜀𝐿
𝑘𝐿 𝜀𝐿 +𝑘𝑈 𝜀𝑈
𝑃𝑆
∗ (27)
Relative vertical distance |𝑉𝑆| identifies the vertical shift between S and S* in figure 1 panel
B. The variables in equation (27) are defined in Table 3. Setting 𝑃𝑆
∗ = 0.1 and assigning the
reduced-form elasticities derived from the displaced model into equations (24) - (26) yield the
welfare changes for a 10 % increase in the subsidy.
6. Simulation Results and Discussion
The analysis includes deterministic and stochastic simulations of Equation (25). Baseline
values in Table 3 are used to derive deterministic reduced-form elasticities, whereas they are
considered as random variables and are assumed to follow triangular distribution in stochastic
simulation. Most likely, minimum, and maximum values are required to define a triangular
distribution. The baseline values are used as most likely values. The minimum and maximum
values are set to 0.5 and 1.5 times the baseline values, respectively9.
Reduced-form elasticities simulated for the preceding parameter values are presented in
Table 4. Results conform to the expected incidence signs. Focusing first on supply side,
findings indicate that a 10 percent increase in targeted production subsidy increases licensed
producer price by 8.4 percent and reduces unlicensed producer price by 1.6 percent.
Accordingly, the licensed acreage increases by 1.6 percent and unlicensed acreages decreases
by 0.4 percent due to a 10 percent increase in subsidy. However, total production increases by
0.8 percent because licensed acreages have a larger share of total supply (61 percent) than
unlicensed acreages (39 percent).
A 10 percent increase in targeted production subsidy stimulates domestic and export
market consumption by 0.5 and 1 percent, respectively. However, ending inventories are
reduced by 0.5 percent since the increase in domestic and export consumption due to lower
market price (1.5 percent) is greater than the increase in total production (0.8 percent).

An Economic Welfare Analysis of Agricultural Subsidies..
74
Table 4. Reduced-form Elasticities for Targeted Production Subsidy
Endogenous Variables Mean 5% limit 95% limit
𝑃𝐷∗ -0.160 -0.095 -0.264
𝑃𝐿∗ 0.841 0.746 0.904
𝐼𝑁𝑉𝐸∗
-0.046 -0.079 -0.024
𝐴𝐿∗ 0.158 0.102 0.215
𝐴𝑈∗ -0.036 -0.019 -0.065
𝑄𝑆∗ 0.081 0.046 0.117
𝑄𝑋∗ 0.099 0.054 0.180
𝑄𝐷∗ 0.050 0.027 0.090
Note: Elasticities are calculated based on stochastic simulation of Equation 23. Refer to text
for detailed explanations.
The results of stochastic simulation suggest estimated reduced-form elasticities have
expected incidence signs and are inelastic at 5 percent and 95 percent confidence limits. A 10
percent increase in targeted subsidy would decrease (increase) the market price (licensed
producer price) between 1 percent and 2.6 percent (7.5 percent and 9 percent) at 5 percent and
95 percent confidence limits, respectively. Domestic (export) consumption increases by 0.3
and 0.9 percent (0.5 and 1.8 percent) at previously mentioned limits due to a 10 percent
increase in subsidy, while excess inventories decline between 0.2 and 0.8 percent because the
increase in total demand exceeds the change in total production.
The welfare distribution effects of a 10 percent increase in targeted production subsidy are
presented in Table 5. The welfare gains are split between licensed producers, domestic and
foreign consumers, and the Turkish treasury due to reduced inventory holdings.
Table 5. Welfare Effects of 10% Increase in Targeted Production Subsidy (in million
USD)
Item Mean 5 % limit 95 % limit
Licensed producer gain 74 49 90
Unlicensed producer loss 27 16 45
Domestic consumer gain 14 8 22
Foreign consumer gain 66 39 109
Treasury gain from inventory reduction 14 8 23
Net domestic welfare loss 63 87 46
Inventory impact ratio (%) 22 9 50
Note: Government outlays are 137 million USD for a 10 percent increase in subsidy.
Producer welfare changes are calculated at mean values for licensed and unlicensed
producers by inserting respective reduced-form elasticities and cumulative producer revenues
for 2009-2011 into equation (24). A 10 percent increase in targeted production subsidy causes
licensed producer surplus to increase by $74 million and unlicensed producer gain to decrease
$27 million.
An increase in production subsidy depresses market price, therefore, raises the welfare of
consumers in domestic and export markets. In particular, the domestic and export market
M. Y. Şişman
75
consumers surplus increase by $14 million and $66 million due to a 10 percent increase in
production subsidy, respectively. The result of welfare calculations for the government
inventory holdings indicates that the treasury surplus increases by $14 million following a 10
percent increase in subsidy as the subsidy stimulates total consumption to a greater extent than
domestic production.
The welfare distribution effects of the subsidy are computed at 5 percent and 95 percent
confidence limits. The results suggest that expected incidence signs are robust to parameter
uncertainty. Particularly, the licensed producer surplus ranges between $49 million and $90
million, while the welfare loss of unlicensed producers distributed from $16 million to $45
million at 5 percent and 95 percent limits, respectively. Domestic (export) market consumer
surplus increases by $8 million and $22 million ($39 million and $109 million). The net
welfare loss ranges between $46 million and $87 million at 5 percent and 95 percent levels,
respectively. These findings suggest that the major beneficiaries from the subsidy policy are
the licensed producers and foreign consumers.
Overall, the policy is expected to achieve its objectives as it improves the welfare of
licensed producer and reduces the government inventories; despite it causes a net domestic
welfare loss. However, the welfare loss of the production subsidy to taxpayers would have
been 22 percent higher had treasury gains from reduced inventories not been considered in the
welfare analysis.
7. Concluding Remarks
Overproduction and excess inventory accumulation are among the major concerns in
storable agricultural products. A number of policy tools including, but not limited to, acreage
allotments, poundage and marketing quotas, and price discrimination policies among producer
groups are employed to regulate industry output and to stabilize market price in many
industries (e.g., the US tobacco and peanut industries and the European Union sugar industry).
Economic evaluation of governmental policies should account for the inventory structure if
overproduction and excess inventory holdings are concerns of the industry in question.
This study examines the economic impacts of targeted production subsidies on producer
groups, domestic and export market consumers in a large open economy where overproduction
and excess inventory holdings are significant concerns for the government and the industry in
question. An industry model is developed to analyze the link between targeted production
subsidies and excess inventory holdings using an equilibrium displacement model approach.
The Turkish hazelnut industry was selected to demonstrate welfare distribution effects of
targeted production subsidies and to discuss the relationship between production subsidies and
left-over stocks as the Turkish hazelnut industry is a highly relevant case to analyze this
relationship.
The analysis includes deterministic and stochastic simulations to address parameter
uncertainty. Simulation results indicated that expected incidence signs of reduced-form
elasticities and calculated welfare effects are robust to the parameter uncertainty. In particular,
an increase in targeted subsidy raises the price received by licensed producers and depressed
the market price to unlicensed producers at 5 percent and 95 percent confidence limits. Total
production increases because licensed acreages have a larger share of total production (61
percent) than unlicensed acreages (39 percent). However, ending inventories decline as the
increase in domestic and export market consumptions (due to lower market price) is greater
than the increase in total production.
Welfare gains due to an increase in subsidy payments are split between licensed producers,
domestic consumers, and particularly, global consumers. Unlicensed producer as well as the
treasury welfare decline following an increase in the subsidy. However, ignoring the gains
from reduced inventories would exaggerate the net cost of the policy as much as 22 percent.
An Economic Welfare Analysis of Agricultural Subsidies..
76
This indicates the cost of the targeted production subsidy is less than the actual amount paid
by taxpayers due to the reduction in government stocks.
Despite net domestic welfare loss, increasing targeted production subsidy will effectively
accomplish the policy goals, namely, generating producer surplus to licensed producers and
reducing the cost of government inventories. In addition, an increase in the targeted production
subsidy decreases unlicensed acreages. This was the primary objective of the diversion
payment policy which failed as the applications for diversion payments were limited to 1
percent of total unlicensed acreages.
Findings suggest that targeted production subsidies may be effective policy tools for
increasing welfare of the selected producer groups and reducing inventory holdings depending
on inventory, domestic and export market shares and corresponding price elasticities. The
industry model introduced in this paper is a static economic model. Thus, incorporating
dynamics of inventory holdings into policy analysis would be an appropriate step for future
research.
Acknowledgements
I gratefully acknowledge and thank Prof. Dr. Henry Kinnucan for his invaluable
supervision and constructive comments during my research in Auburn University.
Responsibility with the final content, however, rests strictly with the author.
References
Abbott, P., P. Paarlberg, & Sharples, J. (1987). “Targeted Export Subsidies and Social
Welfare.” American Journal of Agricultural Economics 69:723-732.
Alston, J.M., Carter, C. & Smith, V. H. (1993). “Rationalizing Agricultural Export Subsidies.”
American Journal of Agricultural Economics 75: 1000-1009.
Alston, J.M., Norton, G.W. & Paradey, P. G. (1995). Science Under Scarcity: Principles and
Practice for Agricultural Research and Priority Setting. Ithaca, NY: Cornell University
Press.
Alston, J.M., Freebrain, J. W. & James, J. S. (2001). “Beggar-Thy-Neighbor Advertising:
Theory and Application to Generic Commodity Promotion Programs.” American Journal
of Agricultural Economics 83: 888-902.
Bozoglu, M. (2005). “The Reform of the Hazelnut Policy.” 6th International Congress on
Hazelnut Proceedings, pp.517-524.
Bozoglu, M. (2009). “Effects of Turkey’s Accession to the European Union on Hazelnut
Market.” 7th International Congress on Hazelnut Proceedings, pp.763-768.
Food and Agriculture Organization of the United Nations – FAOSTAT. Available at:
http://faostat3.fao.org/home/index.html (Accessed December 17, 2014).
Gardner, B.L. 1983. “Efficient Redistribution through Commodity Markets.” American
Journal of Agricultural Economics 65: 225-234.
Gopinath, M., & Saito, H. (2006). “Evaluation of the Promotion Program of the Hazelnut
Marketing Board, Oregon.” Unpublished Report, Oregon State University Corvallis, OR.,
October.
Houck, J.P., & Gallagher, P. W. (1976). “The price Responsiveness of U.S. Corn Yields.”
American Journal of Agricultural Economics 58: 731-734.
Houck, J.P. 1986. Elements of Agricultural Trade Policies. Prospect Heights, IL: Waveland
Press.
International Nut Council - Database. Available at:
http://www.nutfruit.org/en/global-statistical-review_13653 (Accessed September 12,
2014).
Kinnucan, H.W., & Belleza, E. (1995). “Price and Quantity Effects of Canada’s Dairy
M. Y. Şişman
77
Advertising Programs.” Agricultural and Resource Economics Review 24:199-210.
Kinnucan, H.W., & Zhang, D. (2004). “Incidence of the 1996 Canada-U.S. Softwood Lumber
Agreement and the Optimal Export Tax.” Canadian Journal of Agricultural Economics
52:73-88.
Kinnucan, H.W., & Myrland, ∅. (2002). “The Relative Impact of the Norway-EU Salmon
Agreement: A Midterm Assessment.” European Review of Agricultural Economics 53:
195-219.
Kinnucan, H.W., & Myrland, ∅. (2005). “Effects of Income Growth and Tariffs on the World
Salmon Market.” Applied Economics 37:1967-1968.
Koo, W.W., & Kennedy, P.L. (2006). “The Impact of Agricultural Subsidies on Global
Welfare.” American Journal of Agricultural Economics 88: 1219:1226.
Marongiu, S. 2005. “An Econometric Model for Evaluating the International Hazelnuts
Market.” 6th International. Congress on Hazelnut Proceedings, pp. 539-546
McDonald, J.D., & Sumner, D.A. (2003). “The influence of commodity programs on acreage
response to market price: with an illustration concerning rice policy in the United States.”
American Journal of Agricultural Economics 85(4): 857-871.
Mutondo, J.E., Brorsen, B.W. & Henneberry, S.R. (2009). “Welfare Impacts of BSE-Driven
Trade Bans.” Agricultural and Resource Economics Review 38:324-329.
National Council of Hazelnut. (2012). Hazelnut Report.2012, Turkey, April.
Piggott, R.R. (1992). “Some Old Truths Revisited.” Australian Journal of Agricultural
Economics 36: 117-140.
Rucker, R.R. & Thurman, W. N. (1990). “The economic effects of supply controls: The simple
analytics of the US peanut program.” The Journal of Law & Economics 33(2): 483-515.
Sadoulet, E., & Janvry, A. (1995). “Quantitative development Policy Analysis.”. Baltimore:
Johns Hopkins University Press.
Sumner, D.A., & Wolf, C.A.. (1996). “Quotas without supply control: effects of dairy quota
policy in California.” American Journal of Agricultural Economics 78(2): 354-366.
Turkey, Republic of, Department of Commerce. (2010). Hazelnut Industry Report. Ankara:
Government Printing Department.
Turkey, Republic of, Office of Prime Ministry. (2009). The Official Gazette of the Turkish
Republic No 27389. Ankara: Government Printing Department.
Turkish Statistical Institute – Agriculture Service. Available at:
http://www.turkstat.gov.tr/PreTablo.do?alt_id=45 (Accessed July 20, 2014).
U.S. Department of Agriculture. 2012. Tree nuts: World Markets and Trade. 2012,
Washington DC, October.
Wohlgenant, M.K., & Clary, C. R. (1993). “Development and Measurement of Farm-to-Retail
Price Linkage for Evaluating Dairy Advertising Effectiveness.” The Journal of
Agricultural Economics Research 44: 18-27
Wohlgenant, M. K. (2011). “Consumer Demand and Welfare in Equilibrium Displacement
Models.” Handbook on the Economics of Food Consumption and Policy. J. L. Lusk, J.
Roosen, and J. F Shogren, eds: Oxford University Press.
Yavuz, F., Birinci, A. Peker, K. & Atsan, T. (2004). Econometric Modeling of Turkey’s
Hazelnut Market and Its Use in Policy Analysis. Erzurum, Turkey: Institute of Agricultural
Economics Research, Pub.No. TEAE 113..
Yavuz, F., Birinci, A., Peker K., & Atsan, T. (2005). “Econometric Modeling of Turkey’s
Hazelnut Sector: Implications on Recent Policies” Turkish Journal of Agriculture and
Forestry 291: 1-7.
An Economic Welfare Analysis of Agricultural Subsidies..
78
Appendix
Global hazelnut trade statistics shows that Turkey is the largest hazelnut exporter and the
rest of the world (ROW) is a net hazelnut importer. Thus, the ROW total demand is defined as
the sum of ROW supply and imports. Equation (A1) presents the ROW’s imports.
QWM = QW
D - QWS (A1)
where QWM is the ROW’s imports; QW
D is the ROW’s total demand; QWS is the ROW’s total
supply. Taking the total derivative of equation (A1) and converting it into percentage changes
to yield:
𝑘𝑀 ŋ𝑊 = ŋ𝑊 – 𝜀𝑊 𝑘𝑆 (A2)
where ŋ𝑊 is the import demand elasticity; 𝜀𝑊 is supply elasticity; 𝑘𝑀 is the import share
(i.e., QWM / Q
WD ); 𝑘𝑆 is the supply share (i.e., QW
S / QW
D ) Solving (A2) for ŋ𝑊 gives the
following formula to calculate the export demand elasticity of Turkey.
ŋ𝑊 = ŋ𝑋 = ŋ𝑊 – 𝜀𝑊 𝑘𝑆
𝑘𝑀 (A3)
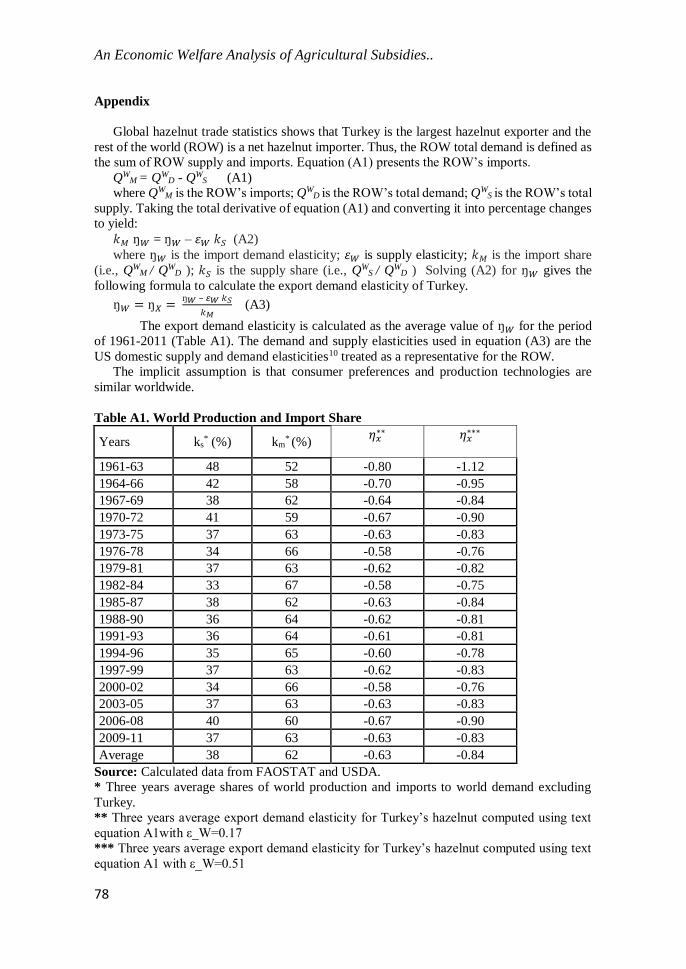
The export demand elasticity is calculated as the average value of ŋ𝑊 for the period
of 1961-2011 (Table A1). The demand and supply elasticities used in equation (A3) are the
US domestic supply and demand elasticities10 treated as a representative for the ROW.
The implicit assumption is that consumer preferences and production technologies are
similar worldwide.
Table A1. World Production and Import Share
Years ks* (%) km
* (%) 𝜂𝑥
∗∗
𝜂𝑥∗∗∗
1961-63 48 52 -0.80 -1.12
1964-66 42 58 -0.70 -0.95
1967-69 38 62 -0.64 -0.84
1970-72 41 59 -0.67 -0.90
1973-75 37 63 -0.63 -0.83
1976-78 34 66 -0.58 -0.76
1979-81 37 63 -0.62 -0.82
1982-84 33 67 -0.58 -0.75
1985-87 38 62 -0.63 -0.84
1988-90 36 64 -0.62 -0.81
1991-93 36 64 -0.61 -0.81
1994-96 35 65 -0.60 -0.78
1997-99 37 63 -0.62 -0.83
2000-02 34 66 -0.58 -0.76
2003-05 37 63 -0.63 -0.83
2006-08 40 60 -0.67 -0.90
2009-11 37 63 -0.63 -0.83
Average 38 62 -0.63 -0.84
Source: Calculated data from FAOSTAT and USDA.
* Three years average shares of world production and imports to world demand excluding
Turkey.
** Three years average export demand elasticity for Turkey’s hazelnut computed using text
equation A1with ε_W=0.17
*** Three years average export demand elasticity for Turkey’s hazelnut computed using text
equation A1 with ε_W=0.51
M. Y. Şişman
79
1 This research is a part of the doctoral dissertation submitted to Auburn University, USA. It
was presented in International Conference on Food and Agricultural Economics held in
Alanya, Turkey on April 27-28, 2017. 2 The government provides a license for hazelnut farms based on location. To be eligible to
receive a license, the producers must have farms located in the steep lands in the Black Sea
region of Turkey (i.e., the first standard region). The terms “licensed producers” and “licensed
farms” are used interchangeably. First and second standard regions refer to licensed and
unlicensed acreages, respectively. 3 Licensed producers received subsidy payments in local currency (i.e., Turkish Lira) in March
and April of each marketing year. Therefore, the subsidy amounts were converted to US
Dollars by averaging the monthly exchange rates for March and April of each year considered.
The exchange rates used in the analysis are obtained from OECD database (1 USD=1.5 TL for
2009 and 2010, and 1.8 for 2011). 4 Wohlgenant (2011) and Piggott (1992) provided a detailed discussion of EDM applications
in policy analysis. 5 Koo and Kennedy (2006) did not address the link between subsidy policies and inventory
holdings and the welfare impacts of stocks on trade flow. 6 Following section presents an industry model which addresses the welfare impacts of the
ending stocks on producers and domestic and global market consumers. Thus, the net welfare
estimates include the treasury gains/ losses due to changes in ending inventories driven by the
percentage change of subsidy payments. 7 Yields are treated as exogenous in the analysis based on the findings in Yavuz et al. (2005) 8 The approach is adopted from Kinnucan and Myrland (2002, 2005). 9 Mean values and confidence intervals are calculated from a Monte Carlo simulation of 1000
random draws using the software Simetar. 10 The only known study for ROW supply and demand elasticity is Gopinath and Saito (2006),
which estimates the US domestic supply and demand elasticities as 0.17 and -0.33,
respectively.