alos prism dem v2 product guide - core.ac.ukcore.ac.uk/download/pdf/11773386.pdf0 esa due permafrost...
TRANSCRIPT

0
ESA DUE Permafrost
ALOS PRISM DEM V2 product guide
Vienna University of Technology Institute of Photogrammetry and Re-mote Sensing
Gamma Remote Sensing
Department of Geography and Environ-mental Management Faculty of Environment University of Waterloo
Friedrich-Schiller-Universität Jena Institute of Geography Department of Remote Sensing
Alfred Wegener Institute for Polar and Marine Research
2012 January
i
This document is the Product Guide for the version 1 release of the local ALOS PRISM DEM product. It has been compiled for the DUE Perma-frost project (ESRIN Contract No. 22185/09/I-OL), a project of the Data User Element initiative of the European Space Agency. Prime contractor:
Institute of Photogrammetry and Remote Sensing (I.P.F.) Remote Sensing Group Vienna University of Technology Gusshausstrasse 27-29/E122 1040 Vienna, Austria [email protected] www.ipf.tuwien.ac.at/permafrost
ESA Technical officer: Frank Martin Seifert
Status: Issue 2.0 Authors: Camillo Ressl, Annett Bartsch Circulation: TUWien, Gamma, UW, FSU, AWI, ESA, Users Amendments:
Issue Date Details Editor Issue 1.0 2011-01-31 V1 product guide AB Issue 2.0 2012-01-26 V2 product guide AB

ii
Contents
Contents ............................................................................................................. ii 1 Product overview .......................................................................................... 3 2 Central Yakutia, Russia ................................................................................ 3 3 Polar Bear Pass, Canada ............................................................................... 4 4 Yamal peninsula, Russia ............................................................................... 5 5 Method assessment with laser scanner data - Austria .................................. 5 6 Product specification .................................................................................... 7 7 Data access and contact information ............................................................ 8

3
1 Product overview
Local scale photogrammetric processing of ALOS-Prism Triplets (ground sampling distance 2.5m) has been carried out within three service case re-gions. The analysis has been made for central Yakutia (Russia), Polar Bear Pass (Canada) and a site at the Yamal peninsula (Russia, Ob service case re-gion). An additional DEM with the same methodology will be created over Austria for assessment with Laser scanner data.
Used Software
• ERDAS LPS 2010 for orientation of the images and surface point extraction (correlation threshold 50)
• OPALS for surface interpolation Data source
• Data have been available through JAXA ALOS PI agreement P090
2 Central Yakutia, Russia
Input Forward Img_SceneCenterDateTime="20070707 02:51:55.592" Backward Img_SceneCenterDateTime="20070707 02:53:25.903" Notes on quality Absolute orientation:
• derived surface was fit to ASTER DEM of the Yakutsk area using iterative closed point algorithm;
• therefore the absolute orientation is only as good as the one given by the ASTER DEM
Quality of surface description From the images only points on the surface can be extracted where the im-
age contrast is large enough, therefore the distribution of the extracted surface points depends on the image content and will vary over the area. Thus the quality of the surface description (its resolution) is not homogenous over the area. Over all 26 million points were extracted.

4
The grid width used for the DEM is 10m (which is 4 times the ground sampling distance of the original ALOS images of 2.5m). In order to docu-ment the quality of the surface description a so-called chamfer image was cre-ated also which is co-registered to the DEM. The chamfer image stores in each cell the distance to the closest cell which contains extracted surface points. From this one can clearly see that no points where e.g. extracted in the river regions, most points are extracted in the city areas.
3 Polar Bear Pass, Canada
Input Forward "20100703 19:19:33.220" Nadir "20100703 19:20:18.366" Backward "20100703 19:21:03.519" Notes on quality Absolute orientation:
• absolute orientation was performed using given ortho image 991007_l7_01-07.img with 30m resolution and dem_pbp_wgs84_backg_polar9_GAMMA.img (resolution ca. 185m).
• Orientation is given with respect to UTM 14N, WGS84. Quality of surface description From the images only points on the surface can be extracted where the im-
age contrast is large enough, therefore the distribution of the extracted surface points depends on the image content and will vary over the area. Thus the quality of the surface description (its resolution) is not homogenous over the area.
The grid width used for the DEM is 10m (which is 4 times the ground
sampling distance of the original ALOS images of 2.5m). In order to docu-ment the quality of the surface description a quality image was created, the is co-registered to the DEM but contains only round numbers between 10m and 200m. These numbers represent the radii of circles used to collect original points and interpolate the height at each raster location. From these radii one can clearly see that there are quite large areas, where the maximum radius of 200m was used. In these areas either no points were extracted from the imag-es, or they are covered by clouds (of which there are many in the images).
5
4 Yamal peninsula, Russia
Input Forward "20070709 07:28:30.313" Nadir "20070709 07:29:20.389"; 20100705 07:33:48.312 Backward "20070709 07:30:06.365"
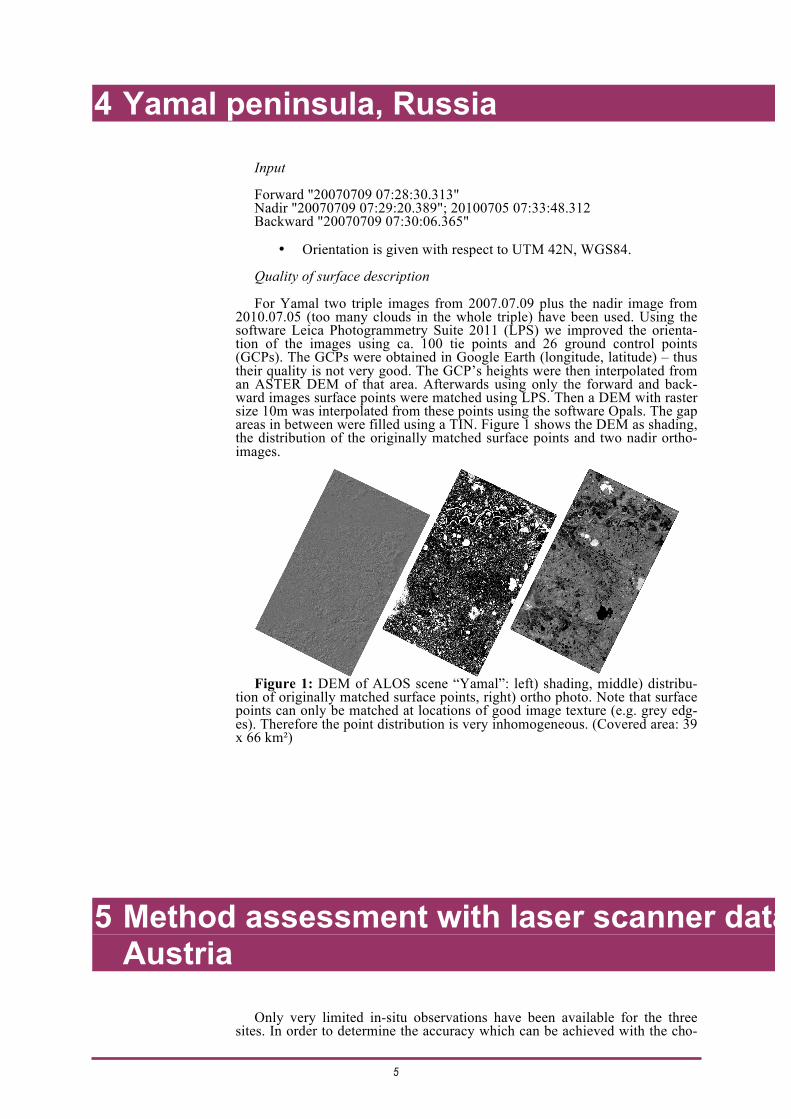
• Orientation is given with respect to UTM 42N, WGS84. Quality of surface description For Yamal two triple images from 2007.07.09 plus the nadir image from
2010.07.05 (too many clouds in the whole triple) have been used. Using the software Leica Photogrammetry Suite 2011 (LPS) we improved the orienta-tion of the images using ca. 100 tie points and 26 ground control points (GCPs). The GCPs were obtained in Google Earth (longitude, latitude) – thus their quality is not very good. The GCP’s heights were then interpolated from an ASTER DEM of that area. Afterwards using only the forward and back-ward images surface points were matched using LPS. Then a DEM with raster size 10m was interpolated from these points using the software Opals. The gap areas in between were filled using a TIN. Figure 1 shows the DEM as shading, the distribution of the originally matched surface points and two nadir ortho-images.
Figure 1: DEM of ALOS scene “Yamal”: left) shading, middle) distribu-
tion of originally matched surface points, right) ortho photo. Note that surface points can only be matched at locations of good image texture (e.g. grey edg-es). Therefore the point distribution is very inhomogeneous. (Covered area: 39 x 66 km²)
5 Method assessment with laser scanner data - Austria
Only very limited in-situ observations have been available for the three sites. In order to determine the accuracy which can be achieved with the cho-

6
sen data and methods we applied exactly the same workflow on ALOS PRISM scenes from Austria “North Burgenland” (including GCP provision using Google Earth and ASTER DEM). Afterwards the DEM with a raster width of 10 m derived from LPS and Opals was compared with a reference DEM derived by airborne laser scanning (accuracy 1 dm), which was kindly provided by the federal government of Burgenland ("Amt der Bur-genländischen Landesregierung, Landesamtsdirektion, Stabsstelle Raumord-nung – Referat GIS-Koordination").
The comparison was done by computing a spatial similarity transformation from the ALOS DEM onto the ALS DEM using least squares matching so that the height differences between both DEMs are minimized. The transformation obtained this way for the ALOS DEM results in median shifts for (X/Y/Z) of (-6/-5/48) [m]. This quantifies the quality of the absolute positioning based on Google Earth and ASTER DEM. The standard deviation of the height differ-ences between both DEMs results to 2.0 m, which corresponds to 0.8 pixels in an ALOS image. This quantifies the geometric quality of the surface represen-tation based on the LPS image matching. However, one must keep in mind that the surface points are very inhomogeneously distributed, and the DEM quality naturally depends on the density of the original points. The found val-ue of 2 m is an overall representative for areas where points were matched. In areas without points the DEM quality will be worse. Additionally we can see from the colour coding of the difference between both DEMs (Figure 2) that the distribution of the differences is not random but a systematic pattern re-mains. In the middle area parallel to the satellite’s flight direction mainly neg-ative differences occur and mainly positive differences can be seen close to the border. This may be attributed to residual errors in the interior orientation of the ALOS images; e.g. the registration of the sub images.
Figure 2: Colour coding of height differences in the North-Burgenland area be-
tween ALOS DEM and reference ALS DEM (superimposed on the shading of the ALOS DEM). The standard deviation of the height differences is 2m. (Covered area: 39 x 33 km²)
7
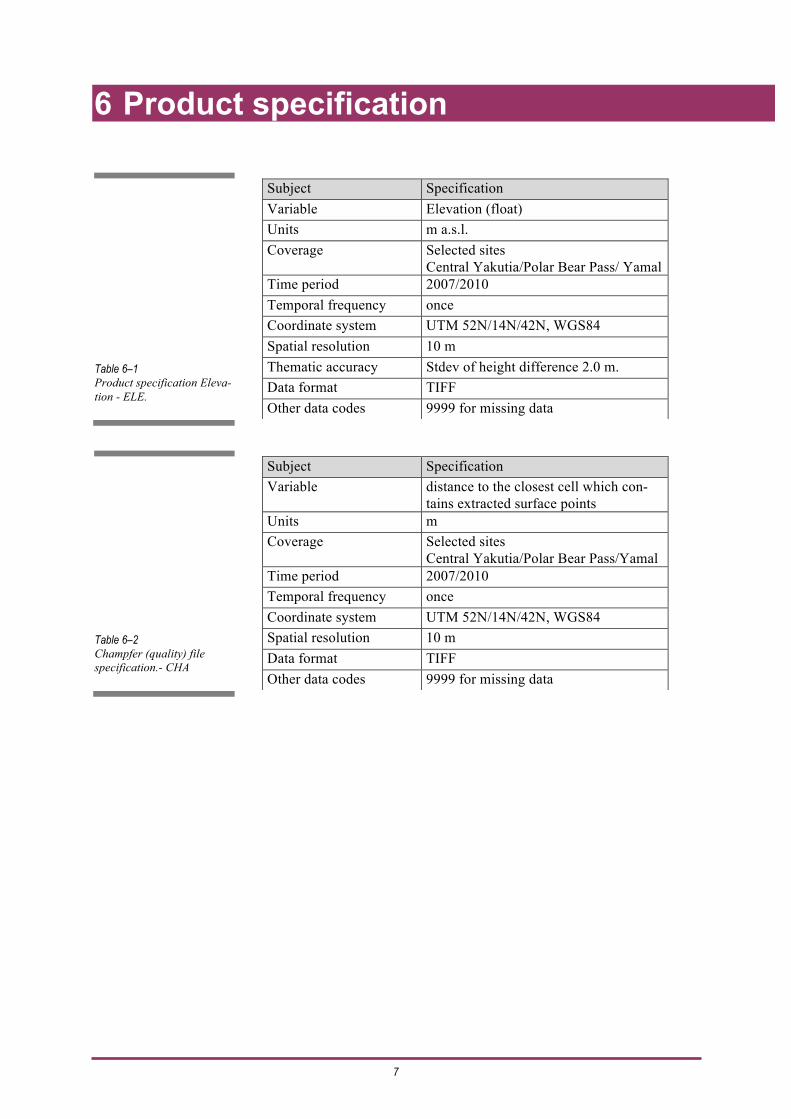
6 Product specification
Table 6–1 Product specification Eleva-tion - ELE.
Subject Specification Variable Elevation (float) Units m a.s.l. Coverage Selected sites
Central Yakutia/Polar Bear Pass/ Yamal Time period 2007/2010 Temporal frequency once Coordinate system UTM 52N/14N/42N, WGS84 Spatial resolution 10 m Thematic accuracy Stdev of height difference 2.0 m. Data format TIFF Other data codes 9999 for missing data
Table 6–2 Champfer (quality) file specification.- CHA
Subject Specification Variable distance to the closest cell which con-
tains extracted surface points Units m Coverage Selected sites
Central Yakutia/Polar Bear Pass/Yamal Time period 2007/2010 Temporal frequency once Coordinate system UTM 52N/14N/42N, WGS84 Spatial resolution 10 m Data format TIFF Other data codes 9999 for missing data
8
7 Data access and contact information
The ALOS PRISM v2 products can be accessed via PANGAEA (http://doi.pangaea.de/10.1594/PANGAEA.783306) and should be cited as:
Ressl, Camillo; Bartsch, Annett; Wagner, Wolfgang (2012): ALOS Digital
Elevation Models, with links to geotiff images. Institute of Photogrammetry and Remote Sensing, TU Vienna. doi:10.1594/PANGAEA.783306
In: ESA Data User Element (DUE) Permafrost: Circumpolar Remote
Sensing Service for Permafrost - Local Services-I: terrain elevation and terrain subsidence - with links to datasets. doi:10.1594/PANGAEA.783634
The product is alternatively stored at GAMMA Remote Sensing and the
Institute of Photogrammetry and Remote Sensing (TU Wien) FTP server which can be accessed via the DUE Permafrost data portal (www.ipf.tuwien.ac.at/permafrost). The dataportal includes a WebGIS for vis-ualization. Login information is available on request.
For login access to the dataportal, contact [email protected]. For questions about the product, contact [email protected] or mail to: [email protected] For ESA’s technical officer, contact [email protected]. Additional information on the ESA DUE Permafrost project can be found
at the web-site: http://www.ipf.tuwien.ac.at/permafrost