align technology, inc. financial results q4 and 2015
TRANSCRIPT

Align Technology, Inc. Financial Results Q4 and 2015
© 2015 Align Technology, Inc. All rights reserved. 2
Align Technology, Inc -- Q4 and 2015 Financial Results
Conference Call • Speakers:
– Joe Hogan, President and CEO – David White, CFO – Shirley Stacy, VP, Corporate
Communications & Investor Relations
• Replay and Web cast Archive – Telephone replay will be available through
5:30pm ET February 11, 2016 – Domestic callers: 877-660-6853 – International callers: 201-612-7415 – Conference # 13627358 – Audio web cast archive will be available at
http://investor.aligntech.com for 12 months
Contacts • Website: http://investor.aligntech.com/ • Email: [email protected] • Tel: (408) 470-1000 • Corporate and Investor Communications:
– Shirley Stacy, [email protected]
– Yin Cantor, [email protected]

© 2015 Align Technology, Inc. All rights reserved. 3
Safe Harbor and Forward Looking Statement
This presentation contains forward-looking statements, including statements regarding certain business metrics for the first quarter of 2016, including, but not limited to, anticipated net revenues, gross margin, operating expenses, operating profit, diluted earnings per share, and case shipments. Forward-looking statements contained in this news release and the tables below relating to expectations about future events or results are based upon information available to Align as of the date hereof. Readers are cautioned that these forward-looking statements are only predictions and are subject to risks, uncertainties and assumptions that are difficult to predict. As a result, actual results may differ materially and adversely from those expressed in any forward-looking statement. Factors that might cause such a difference include, but are not limited to, difficulties predicting customer and consumer purchasing behavior, the willingness and ability of our customers to maintain and/or increase product utilization in sufficient numbers, the possibility that the development and release of new products does not proceed in accordance with the anticipated timeline, the possibility that the market for the sale of these new products may not develop as expected, the risks relating to Align's ability to sustain or increase profitability or revenue growth in future periods while controlling expenses, growth related risks, including capacity constraints and pressure on our internal systems and personnel, our ability to successfully achieve the anticipated benefits from the scanner and services business, continued customer demand for our existing and new products, changes in consumer spending habits as a result of, among other things, prevailing economic conditions, levels of employment, salaries and wages and consumer confidence, the timing of case submissions from our doctors within a quarter, acceptance of our products by consumers and dental professionals, foreign operational, political and other risks relating to Align's international manufacturing operations, Align's ability to protect its intellectual property rights, continued compliance with regulatory requirements, competition from existing and new competitors, Align's ability to develop and successfully introduce new products and product enhancements and the loss of key personnel. These and other risks are detailed from time to time in Align's periodic reports filed with the Securities and Exchange Commission, including, but not limited to, its Annual Report on Form 10-K for the year ended December 31, 2014, which was filed with the Securities and Exchange Commission on February 26, 2015. Align undertakes no obligation to revise or update publicly any forward-looking statements for any reason.

© 2015 Align Technology, Inc. All rights reserved. 4
Q4 2015 Financial Highlights
• Q4’15 was a strong finish to another record year. Better than expected revenue and EPS driven by record Invisalign volume +26% Y/Y.
• Strong growth across our customer base and geographies - from both an increase in the number of submitters as well as cases per doctor.
• Strong scanner revenue growth of 33% Y/Y exceeded expectations as shipments of the new iTero Element began ramping resulting in record scanner shipments.
$186.4 $198.3 $214.0
$12.2 $9.3 $16.2
Q4'14 Q3'15 Q4'15
Revenues ($M)
Scanner
Clear Aligner
126.9 147.5 160.4
Q4'14 Q3'15 Q4'15
Clear Aligner Case Shipments (#K)
• In 2015, 583.2K patients started Orthodontic treatment with Invisalign clear aligners +22% vs +13% in 2014
• Continued adoption and utilization from international doctors and a solid rebound in North America, both driven by investments in territory coverage and sales and marketing programs, including clinical education.
• Product & technology innovation remains key to increased clinical confidence in Invisalign treatment.
$0.48
$0.34
$0.60
Q4'14 Q3'15 Q4'15
Diluted EPS $230.3
$207.6 $198.6

© 2015 Align Technology, Inc. All rights reserved. 5
2015 Record Invisalign Shipments and Strong Growth Trend
4.6% 4.0%
18.2% 18.6% 17.5% 16.2% 13.2%
22.0%
-5.0%
0.0%
5.0%
10.0%
15.0%
20.0%
25.0%
30.0%
35.0%
40.0%
0
100,000
200,000
300,000
400,000
500,000
600,000
700,000
2008 2009 2010 2011 2012 2013 2014 2015
Case Shipments WW Growth North America Growth International Growth
Total volume growth is highest since 2007
© 2015 Align Technology, Inc. All rights reserved. 6
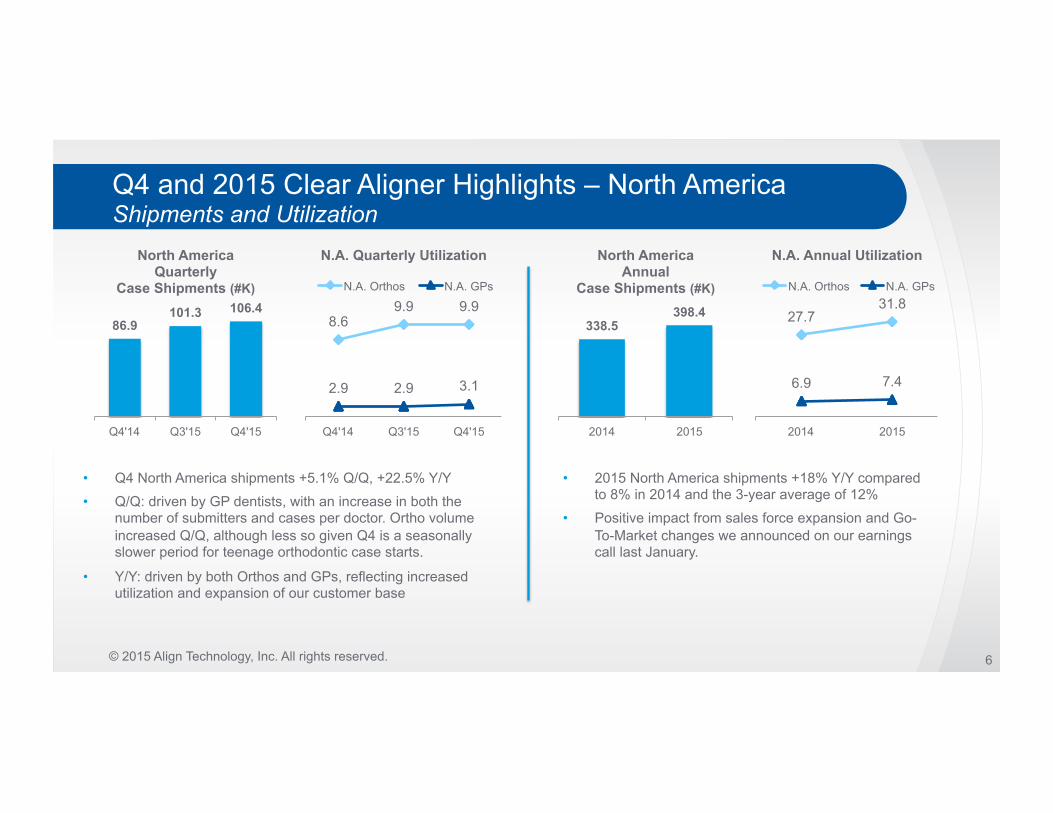
Q4 and 2015 Clear Aligner Highlights – North America Shipments and Utilization
• Q4 North America shipments +5.1% Q/Q, +22.5% Y/Y
• Q/Q: driven by GP dentists, with an increase in both the number of submitters and cases per doctor. Ortho volume increased Q/Q, although less so given Q4 is a seasonally slower period for teenage orthodontic case starts.
• Y/Y: driven by both Orthos and GPs, reflecting increased utilization and expansion of our customer base
338.5 398.4
2014 2015
North America Annual
Case Shipments (#K)
• 2015 North America shipments +18% Y/Y compared to 8% in 2014 and the 3-year average of 12%
• Positive impact from sales force expansion and Go-To-Market changes we announced on our earnings call last January.
86.9 101.3 106.4
Q4'14 Q3'15 Q4'15
North America Quarterly
Case Shipments (#K)
8.6 9.9 9.9
2.9 2.9 3.1
Q4'14 Q3'15 Q4'15
N.A. Quarterly Utilization
N.A. Orthos N.A. GPs
27.7 31.8
6.9 7.4
2014 2015
N.A. Annual Utilization
N.A. Orthos N.A. GPs

© 2015 Align Technology, Inc. All rights reserved. 7
Q4 and 2015 Clear Aligner Highlights – International Shipments and Utilization
• Q4 International shipments +16.8% Q/Q, +34.8% Y/Y
• Strong across all countries driven by both an increase in the number of submitters and in cases per doctor in EMEA and continued expansion of our customer base in APAC.
• EMEA +34% Y/Y – strong performance in our 5 core country markets and are building momentum in our newer geographies.
• APAC +37% Y/Y – notwithstanding a seasonally slower period coming off of a strong summer quarter
40.1 46.2
54.0
Q4'14 Q3'15 Q4'15
International Quarterly
Case Shipments (#K)
4.5 4.6 5.0
Q4'14 Q3'15 Q4'15
International Quarterly Utilization
139.5
184.8
2014 2015
International Annual
Case Shipments (#K)
• 2015 International shipments +32.5% Y/Y
• EMEA +30% – balanced across both Ortho and GP channels. We also saw strong growth in Spain, the UK and the Mediterranean country markets using our new selling process
• APAC +39% – reflecting both expansion of our customer base as well as increased utilization. China volumes doubled over the prior year, Japan grew more than 50% for the 3rd consecutive year
10.4 11.2
2014 2015
International Quarterly Utilization

© 2015 Align Technology, Inc. All rights reserved. 8
Q4 and 2015 Clear Aligner Highlights Teens and Adults
• Teen cases +24.0%Y/Y reflecting continued adoption across our customer channels, but was more pronounced in North America where we have the greatest sales and marketing focus on Teens.
• Adult cases +27.1% Y/Y
• North America, the growth rate of our Teenage cases continues to outpace adult cases.
101.0 117.3 141.4
321.4 360.7 441.9
2013 2014 2015
Teens & Adults Full Year Mix (#K)
Adults Teens
422.3 478.0
583.2
29.7 30.5 33.4 40.6
36.8
Q4'14 Q1'15 Q2'15 Q3'15 Q4'15
Teenaged Patients Case Shipments (#K)
• 2015 Teens +20.6% Y/Y compared to 16% in 2014
• 2015 Adults +22.5% Y/Y compared to 12% in 2014

© 2015 Align Technology, Inc. All rights reserved. 9
2015 Invisalign Clear Aligner Consumer Highlights
8.2M+ Site
visitors 680K+
Smile assessments 350K+
Social media fans
1.3M+ Find a doctor
searches

© 2015 Align Technology, Inc. All rights reserved. 10
Q4 2015 Scanner and Services Highlights
• Q4 revenues +73.7% Q/Q and +33.4% Y/Y • Introduction of our new iTero Element Scanner,
which has been received very enthusiastically by our customers
$12.2 $9.3
$16.2
Q4'14 Q3'15 Q4'15
Scanner Revenues ($M)
• For Q4, total Invisalign cases submitted with a digital scanner in North America was flat from last quarter reflecting fewer scanner sales in Q3 as we transitioned to our new iTero Element.
35.1% 37.7%
39.2% 40.5% 39.6%
Q4'14 Q1'15 Q2'15 Q3'15 Q4'15
% of Digitally Submitted Invisalign Cases

Q4 2015 Financial Review David White CFO

© 2015 Align Technology, Inc. All rights reserved. 12
Q4 2015 Trended Financials
$186.4 $187.0 $200.8 $198.3 $214.0
$12.2 $11.1 $8.7 $9.3
$16.2
Q4'14 Q1'15 Q2'15 Q3'15 Q4'15
WW Net Revenues ($M) Clear Aligner Scanner & Services
$209.5 $207.6 $198.1
$230.3
$198.6 126.9 130.8
144.6 147.5 160.4
Q4'14 Q1'15 Q2'15 Q3'15 Q4'15
Clear Aligner Shipments (#K)
75.9% 76.3% 75.7% 75.9%
75.0%
Q4'14 Q1'15 Q2'15 Q3'15 Q4'15
Gross Margin %
25.9% 24.7%
20.2% 18.3%
25.8%
Q4'14 Q1'15 Q2'15 Q3'15 Q4'15
Operating Margin %
• Notes: Rounding may effect totals. • Align implemented its new Additional Aligners policy on July 18, 2015. Refer to slide 21 for constant currency and Additional Aligners impact information

© 2015 Align Technology, Inc. All rights reserved. 13
Q4 2015 Income Statement Highlights
Q4’15 Sequential Change Q3’15 Year/Year
Change Q4’14
Net Revenues $230.3 +10.9% $207.6 +15.9% $198.6
Gross Margin 75.0% (0.9) pts 75.9% (0.9) pts 75.9%
Operating Expenses $113.5 (5.1)% $119.5 +14.4% $99.2
Operating Margin 25.8% +7.5 pts 18.3% (0.1) pts 25.9%
EPS, diluted $0.60 $0.26 $0.34 $0.12 $0.48
(in millions except per share data and percentages)
Note: Data may not total due to rounding
Year-over-year impact on Q4’15 revenues included a reduction of approximately $7 million and Q4’15 diluted EPS was impacted by approximately $0.07 per share related to Align’s new Additional Aligners policy, which took effect on July 18,2015.
© 2015 Align Technology, Inc. All rights reserved. 14
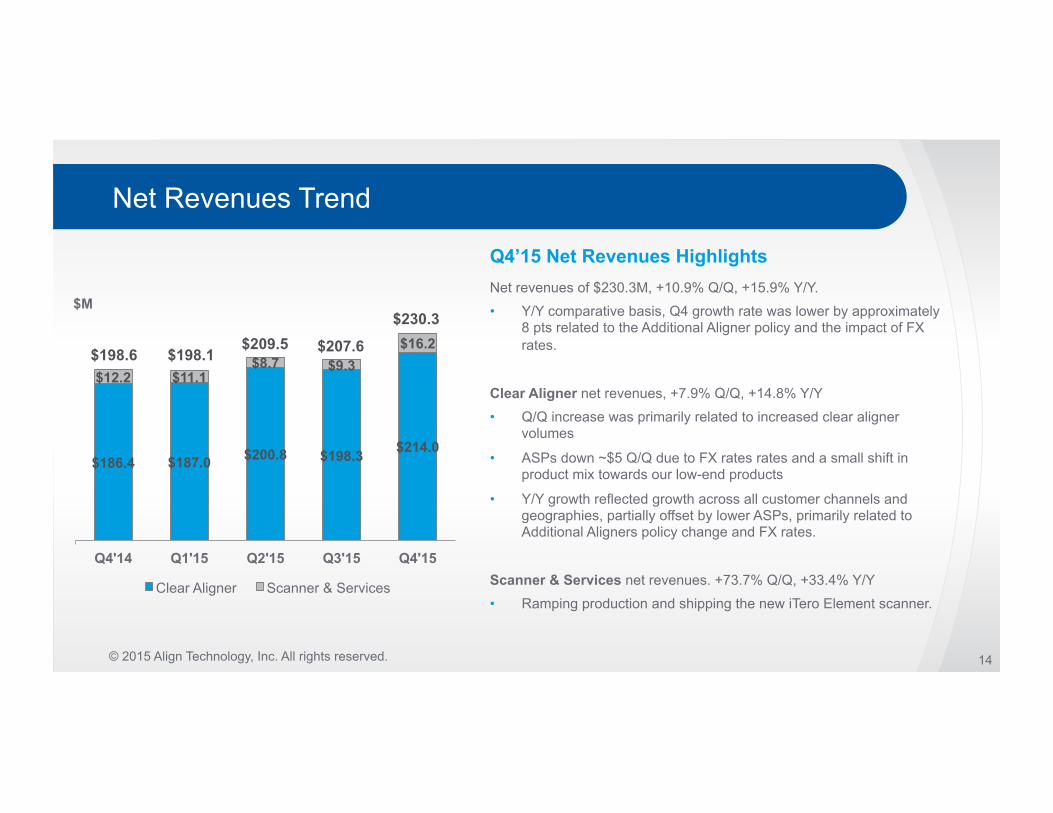
Net Revenues Trend
Q4’15 Net Revenues Highlights Net revenues of $230.3M, +10.9% Q/Q, +15.9% Y/Y.
• Y/Y comparative basis, Q4 growth rate was lower by approximately 8 pts related to the Additional Aligner policy and the impact of FX rates.
Clear Aligner net revenues, +7.9% Q/Q, +14.8% Y/Y
• Q/Q increase was primarily related to increased clear aligner volumes
• ASPs down ~$5 Q/Q due to FX rates rates and a small shift in product mix towards our low-end products
• Y/Y growth reflected growth across all customer channels and geographies, partially offset by lower ASPs, primarily related to Additional Aligners policy change and FX rates.
Scanner & Services net revenues. +73.7% Q/Q, +33.4% Y/Y
• Ramping production and shipping the new iTero Element scanner.
$186.4 $187.0 $200.8 $198.3 $214.0
$12.2 $11.1 $8.7 $9.3
$16.2
Q4'14 Q1'15 Q2'15 Q3'15 Q4'15
$M
Clear Aligner Scanner & Services
$198.6
$230.3
$198.1 $209.5 $207.6

© 2015 Align Technology, Inc. All rights reserved. 15
Clear Aligner Shipments Trend
86.9 91.1 99.6 101.3 106.4
40.1 39.7 44.9 46.2
54.0
Q4'14 Q1'15 Q2'15 Q3'15 Q4'15
Thousands
North America International
147.5 130.8
144.6 160.4
126.9
Shipments of 160.4K, +8.8% Q/Q, +26.4% Y/Y • Q/Q reflecting growth from our International and North
American customers • Y/Y driven by growth across all regions Channel Highlights • N.A. Orthodontists +1.5% Q/Q, +24.5% Y/Y • N.A. GP Dentists +9.4% Q/Q, +20.3% Y/Y • International +16.8% Q/Q, +34.8% Y/Y
Q4’15 Clear Aligner Shipment Highlights
Note: Data may not total due to rounding

© 2015 Align Technology, Inc. All rights reserved. 16
Q4 2015 Clear Aligner Adoption Metrics Invisalign Doctor Training and Utilization
• 2,670 new Invisalign-trained doctors in Q4’15 – 1,270 North America – 1,400 International
• 9,795 doctors became Invisalign providers in 2015
• Q4’15 doctor utilization 4.9 cases/doctor up compared to 4.7 in Q3’15 and 4.4 Q4’14
– N.A. Orthodontists 9.9, +1.3 pts Y/Y – N.A. GP Dentists 3.1, +0.2 pts Y/Y – International 5.0, +0.5 pts Y/Y
Quarterly Doctors Trained Worldwide
N.A. 1,170
N.A. 1,060
N.A. 1,270
Int'l 1,255 Int'l
1,200
Int'l 1,400
Q4'14 Q3'15 Q4'15
Average Doctor Utilization by Channel
8.6 9.0 9.5 9.9 9.9
4.5 4.4 4.6 4.6 5.0
2.9 2.9 3.0 2.9 3.1
Q4'14 Q1'15 Q2'15 Q3'15 Q4'15
N.A. Orthos Int'l N.A. GPs
Utilization = # of cases shipped/# of doctors to whom cases were shipped

© 2015 Align Technology, Inc. All rights reserved. 17
Q4 2015 Geographic Mix by Net Revenues and Volume
Revenue Mix Net Revenues of $230.3M
Volume Mix Shipments of 160,400
Scanner & Services: 7% • +73.7% Q/Q • +33.4% Y/Y
Clear Aligner North America: 56% • +4.5% Q/Q • +14.1% Y/Y
Clear Aligner International: 31% • +15.9% Q/Q • +17.4% Y/Y
Clear Aligner North America
Clear Aligner International
Clear Aligner Non-case
Scanner & Services
Clear Aligner North America
Clear Aligner International
Clear Aligner North America: 66% • +5.1% Q/Q • +22.5% Y/Y
Clear Aligner International: 34% • +16.8% Q/Q • +34.8% Y/Y
Clear Aligner Non-case: 6% • +3.6% Q/Q • +9.0% Y/Y

© 2015 Align Technology, Inc. All rights reserved. 18
Gross Margin Trend
75.9% 76.3%
75.7% 75.9%
75.0%
Q4'14 Q1'15 Q2'15 Q3'15 Q4'15
• Gross profit was $172.8M or 75.0% gross margin • Gross Margin down (0.9) pts Q/Q, (0.9) pts Y/Y • Y/Y decrease was primarily the result of lower ASPs from
currency, which amounted to approx 0.9 pts, as well as the Additional Aligner policy change by about 0.7 pts, which was partially offset by lower costs per unit.
• Includes stock based compensation expense of $1.0M.
Clear Aligner Gross Margin: 77.9% • Gross Margin down (0.9) pts Q/Q, (0.9) pts Y/Y. • Q/Q decrease was primarily driven by by higher freight costs
and increased training activity which carries a lower margin. Scanners & Services Gross Margin: 37.7% • Gross Margin up +23.0 pts Q/Q, +7.5 pts Y/Y. • Q/Q as a result of higher scanner ASPs and lower
manufacturing costs associated with the new iTero Element. • Y/Y increase result of product mix shift to the lower cost iTero
Element coupled with reduced service costs.
Q4’15 Gross Margin Highlights

© 2015 Align Technology, Inc. All rights reserved. 19
Operating Expense Trend
$99.2 $102.2
$116.3 $119.5 $113.5
Q4'14 Q1'15 Q2'15 Q3'15 Q4'15
$M • Operating expense was $113.5M, down ($6.1)M Q/Q primarily due to lower marketing and media spend, and up +$14.3M Y/Y as a result of sales expansion efforts and ERP implementation costs.
• Includes stock-based compensation expense of $12.8M • Recall in Q3, we incurred severance costs for
organizational changes as well as costs related to the termination of product development efforts targeted for the Obstructive Sleep Apnea (OSA) market which contributed to the sequential decline as well.
Q4’15 Operating Expense Highlights

© 2015 Align Technology, Inc. All rights reserved. 20
Operating Margin and EPS Trend
25.9% 24.7%
20.2% 18.3%
25.8%
Q4'14 Q1'15 Q2'15 Q3'15 Q4'15
EPS $0.48 $0.44 $0.39 $0.34 $0.60
• Operating profit was $59.3M and operating margin 25.8%
• Operating margin was up +7.5 pts. Q/Q, and down (0.1) pts. Y/Y
• Q/Q increase primarily to increased clear aligner volume and lower expenses
• On a year-over-year basis, Q4 operating margin was impacted by approx 3 pts from foreign currency and the Additional Aligner policy
• Tax rate was was 18.1%, down 6.3 pts from our Q3 tax rate. Primarily the result of a more favorable mix of earnings in lower taxed geographies, lower tax expenses realized upon the filing of certain tax returns, and to a lesser extent, the renewal of the U.S. R&D tax credit. These items together amounted to about an incremental $0.04 benefit.
EPS Comment • Q4 impacted by approx $0.07 related to the Additional Aligners
policy.
• Y/Y impact on Q4 from the Additional Aligners policy change, as well as assuming constant year-over-year FX rates, was approximately $0.11.
Q4’15 Operating Margin Highlights

© 2015 Align Technology, Inc. All rights reserved. 21
Q4 and 2015 Results Summary Constant Currency and Additional Aligners Impact Information
(in millions, except EPS) Q4 2015 FY 2015 Net Revenues $230.3 $845.5 FX impact using prior year FX rates approx +$8.2 approx +$34.5
Impact of Additional Aligner deferral approx +$7.0 approx +$14.0
EPS $0.60 $1.77
FX impact on revenues using prior year FX rates approx +$0.08 approx +$0.33
FX impact on OpEx using prior year FX rates approx $(0.04) approx +$(0.22)
FX impact on Other Income/Expense +$0.00 +$0.04
Impact of Additional Aligner deferral +$0.07 +$0.13
Align implemented its new Additional Aligners policy on July 18, 2015 in which the Company no longer distinguishes between mid-course corrections and case refinements providing doctors the ability to order additional aligners to address either treatment need at no charge, subject to certain requirements. These changes were effective for all new Invisalign Full, Teen, and Assist treatments shipped worldwide after July 18, 2015, as well as any cases that were open as of this date.
2015 Operating results also included a one-time refund of $6.8M for MDET refund.
© 2015 Align Technology, Inc. All rights reserved. 22
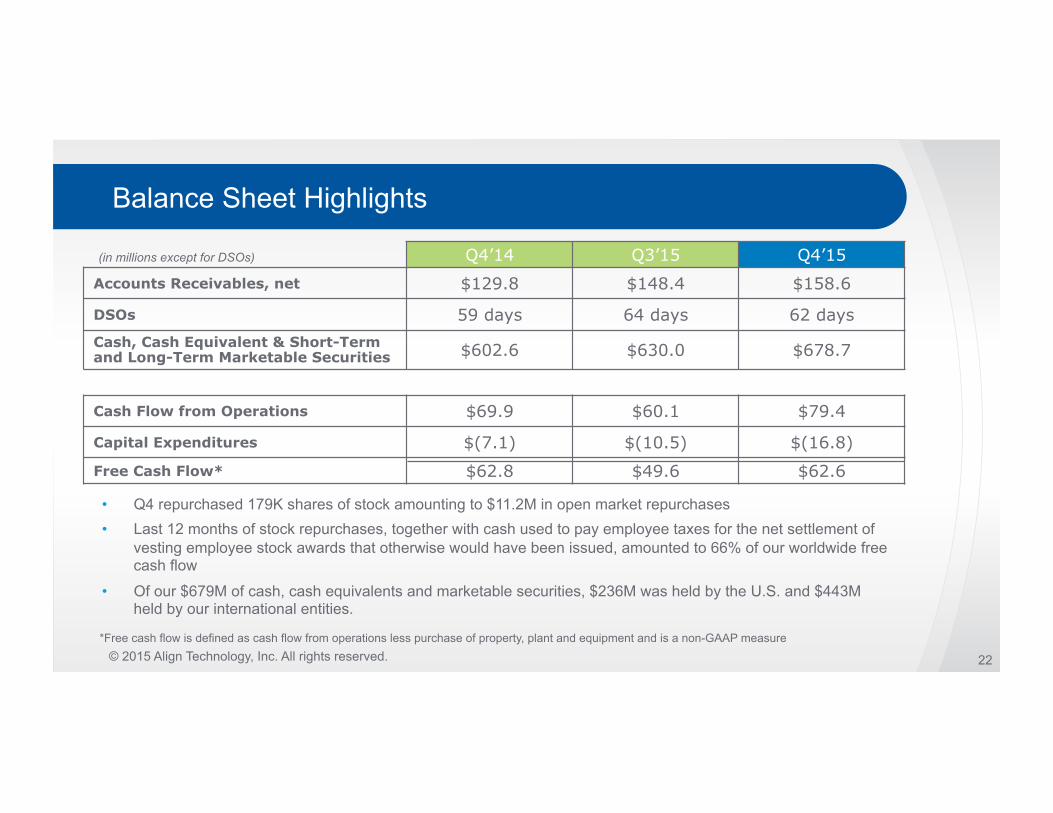
Balance Sheet Highlights
Q4’14 Q3’15 Q4’15 Accounts Receivables, net $129.8 $148.4 $158.6
DSOs 59 days 64 days 62 days Cash, Cash Equivalent & Short-Term and Long-Term Marketable Securities $602.6 $630.0 $678.7
Cash Flow from Operations $69.9 $60.1 $79.4
Capital Expenditures $(7.1) $(10.5) $(16.8) Free Cash Flow* $62.8 $49.6 $62.6
(in millions except for DSOs)
*Free cash flow is defined as cash flow from operations less purchase of property, plant and equipment and is a non-GAAP measure
• Q4 repurchased 179K shares of stock amounting to $11.2M in open market repurchases • Last 12 months of stock repurchases, together with cash used to pay employee taxes for the net settlement of
vesting employee stock awards that otherwise would have been issued, amounted to 66% of our worldwide free cash flow
• Of our $679M of cash, cash equivalents and marketable securities, $236M was held by the U.S. and $443M held by our international entities.

2015 Financial Overview

© 2015 Align Technology, Inc. All rights reserved. 24
2015 Financial Highlights
• Shipped 583,235 Invisalign cases up 22.0% Y/Y – 32.5% volume growth from our International – 17.7% volume growth from our North American doctors.
• Revenue was a record $845.5M, up 11.0% Y/Y including the impact of foreign exchange and Additional Aligners policy.
• Operating income was $188.6M or 22.3% of revenue included 1.6 points of impact from Additional Aligners and foreign exchange rates on a constant currency basis. Our operating results also, included approximately $12M of costs related to ERP implementation, and a one-time refund of $6.8M for Medical Device Excise Tax (MDET) refund, which will not recur in 2016.
• Diluted EPS was $1.77
Total Net Revenues
Invisalign Clear Aligner Net Revenues
Scanner & Services Net Revenues
$845.5M $800.2M 583.2K cases $45.3M
YoY +11.0% +12.3% +22.0% (7.7)%
© 2015 Align Technology, Inc. All rights reserved. 25
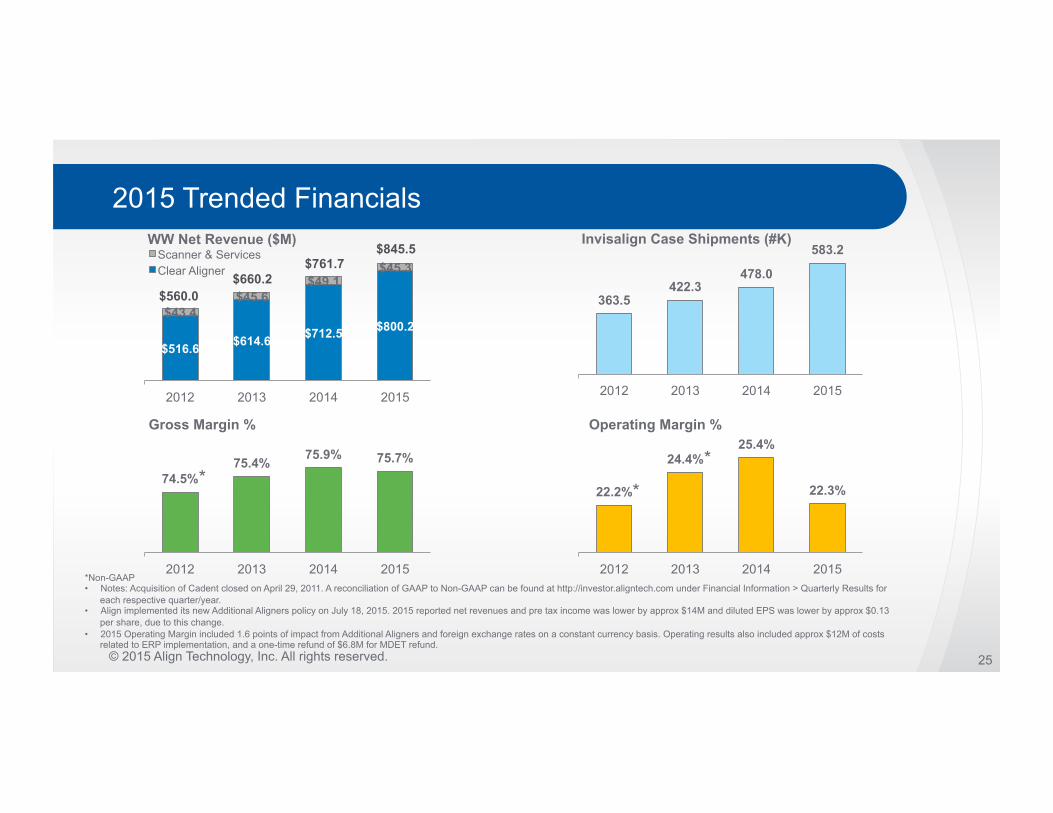
2015 Trended Financials
$516.6 $614.6 $712.5 $800.2 $43.4
$45.6 $49.1
$45.3
2012 2013 2014 2015
WW Net Revenue ($M) Scanner & Services Clear Aligner
$560.0
$845.5
$660.2 $761.7
363.5 422.3
478.0
583.2
2012 2013 2014 2015
Invisalign Case Shipments (#K)
74.5% 75.4% 75.9% 75.7%
2012 2013 2014 2015
Gross Margin %
22.2%
24.4% 25.4%
22.3%
2012 2013 2014 2015
Operating Margin %
*Non-GAAP • Notes: Acquisition of Cadent closed on April 29, 2011. A reconciliation of GAAP to Non-GAAP can be found at http://investor.aligntech.com under Financial Information > Quarterly Results for
each respective quarter/year. • Align implemented its new Additional Aligners policy on July 18, 2015. 2015 reported net revenues and pre tax income was lower by approx $14M and diluted EPS was lower by approx $0.13
per share, due to this change. • 2015 Operating Margin included 1.6 points of impact from Additional Aligners and foreign exchange rates on a constant currency basis. Operating results also included approx $12M of costs
related to ERP implementation, and a one-time refund of $6.8M for MDET refund.
* *
*

© 2015 Align Technology, Inc. All rights reserved. 26
Balance Sheet Highlights
2014 2015
Accounts Receivables, net $129.8 $158.5
Cash, Cash Equivalent & Short-Term and Long-Term Marketable Securities
$602.6 $678.7
Cash Flow from Operations $226.9 $238.0
Capital Expenditures $(24.1) $(53.5)
Free Cash Flow* $202.8 $184.5
(in millions except for DSOs)
*Free cash flow is defined as cash flow from operations less purchase of property, plant and equipment and is a non-GAAP measure
For the full year 2015, we bought back $101.8 million or 1.7 million shares of Align stock.

© 2015 Align Technology, Inc. All rights reserved. 27
3 to 5 Year Financial Model Targets
Q4’14 Actual
2014 Actual
Q4’15 Actual
2015 Actual
3 – 5 Year Model
Revenue CAGR% 15 - 25%
Gross Margin 75.9% 75.9% 75.0% 75.7% 73% - 78%
Operating Expense % 49.9% 50.5% 49.3% 53.4% 45% - 50%
Operating Margin 25.9% 25.4% 25.8% 22.3% 25% - 30%
Free Cash Flow 31.6% 26.6% 27.2% 21.8% 20% - 25%

Financial Outlook

© 2015 Align Technology, Inc. All rights reserved. 29
Factors That Inform Our View of Q1 2016
• North America – Invisalign – Consistent with current demand trends, we expect North America volume to be up sequentially in Q1 primarily driven by the Ortho channel.
• International – Invisalign – While we expect continued strong year-over-year growth, Q1 is a seasonally slower period in Europe due to winter holidays, and not withstanding sequential growth
expected from APAC, we anticipate total International volume to be down sequentially.
• Scanner & Services – Demand for our new iTero Element scanner has been strong. As a result, we expect Q1 scanner shipments to be up significantly sequentially.
• Gross Margin – We expect Q1 gross margin to be slightly down sequentially primarily due to a higher mix of our scanner business which carries lower gross margins.
• Operating Expense: – Typical of prior years, Q1 operating expenses will increase Q/Q, based on several factors:
• Employee compensation-related costs will increase in Q1 due to our annual cycle of employee compensation reviews, which include salary increases and promotions, as well as annual stock grants, and employer paid payroll taxes, such as social security taxes in the U.S., that reset with the start of each new calendar year.
• Incremental investments in sales territory coverage, go-to-market, and product development activities will increase operating expenses as we add additional resources, much of which is front-end loaded in the year.
• Entering the last stages of our ERP implementation program and will not be able to capitalize as much of our total program costs, as compared to the earlier stages of the program.
• Operating Margin – Sequential change it is relatively consistent with historical Q4 to Q1 trends if you exclude ERP investments and the impact from a higher mix of our scanner business.

© 2015 Align Technology, Inc. All rights reserved. 30
Q1 2016 Outlook
Q1 2016
Invisalign Case Shipments 161.3 K – 163.7 K
Net Revenues $232.5 M – $236.6 M
Gross Margin 73.5 % - 74.1 %
Operating Expenses $130.9 M - $132.4 M
Operating Margin 17.2 % - 18.2 %
Effective tax rate 25 %
EPS, diluted $0.37 - $0.40
Stock based compensation $13.5 M
Diluted shares outstanding 81.1 M*
Note: * Excludes any other repurchases during the quarter
© 2015 Align Technology, Inc. All rights reserved. 31
2016 Financial Outlook Commentary
• From a total revenue standpoint, we anticipate year-over-year growth to be in the low to mid-twenties and somewhere in the upper half of our long-term operating model.
• From a volume perspective, we expect continued strong growth in Invisalign case shipments. For scanners, based on current backlog and demand for our new iTero Element, we expect scanner revenue to be approximately double that of 2015.
• Notwithstanding higher top-line growth in 2016, we believe 2016 operating margins will be relatively consistent with our 2015 results for the following reasons:
– First of all, 2016 will bear the full-year impact of the Additional Aligner policy, which we anticipate will impact revenues by approximately $25M to $30M;
– Secondly, we anticipate a higher overall mix of iTero scanner revenue in 2016, and while the new iTero Element scanner is more profitable than the older version, it still carries lower gross margins than Invisalign clear aligners and therefore will somewhat dampen total margins.
– Finally, while we expect to complete most of the implementation of our new ERP system by mid-year, a smaller percentage of these program costs can be capitalized in these later stages, meaning more of these costs will now be included in operating expense. For the full year we expect ERP implementation expenses to be relatively consistent with 2015.
• We believe these investments are key to continued customer adoption and accelerating our growth. Similar to last year, many of these investments will take time before they realize meaningful returns. All included, we expect our earnings power in the second half of the year to be stronger than the first half - with second half operating profits to account for somewhere in the range of 55% to 60% of our full year results.

© 2015 Align Technology, Inc. All rights reserved. 32
2015 CEO Summary and Closing Comments
• As you have seen from our record 2015 results, the investments we made at the onset of the year have helped accelerate growth and increase adoption of Invisalign globally.
• These results reaffirm our confidence in, and commitment to, new investments in 2016.
– This year we will continue to invest in international expansion in new country markets like India and Korea, sales and customer support resources, as well as product and technology innovation to address such things as treatment times, indications unique to teens, and predictability.
– In addition, we will establish our first Order Acquisition and Treatment Planning facilities in International regions so we can be closer to our customers, improve our operational efficiency and provide doctors with a great experience to further improve their confidence in using Invisalign to treat more patients, more often.
• All told we believe these investments will further extend our competitive advantage and leadership in the market.

Supplemental Information Historical Information as of 12/31/15
© 2015 Align Technology, Inc. All rights reserved. 34
Additional Aligner Policy Effective July 18, 2015
• Align implemented its new Additional Aligners policy on July 18, 2015 in which the Company no longer distinguishes between mid-course corrections and case refinements providing doctors the ability to order additional aligners to address either treatment need at no charge, subject to certain requirements.
• These changes were effective for all new Invisalign Full, Teen, and Assist treatments shipped worldwide after July 18, 2015, as well as any cases that were open as of this date. While this policy change was largely immaterial to the Company’s cash flows, it did impact the timing at which the Company recognizes revenue.
• The estimated impact of this change on Q4’15 and 2015 reported revenues and pre tax income was lower by approximately $7.0M and $14M, respectively.

© 2015 Align Technology, Inc. All rights reserved. 35
Total Doctors Invisalign Cases Shipped To
Q4'13 Q1'14 Q2'14 Q3'14 Q4'14 Q1'15 Q2'15 Q3'15 Q4'15 International 6,925 7,185 7,685 7,950 8,945 9,050 9,790 10,150 10,865 North America 18,495 19,015 19,505 19,550 19,745 20,165 21,335 21,160 21,835
32,700
25,420 26,200 27,190 27,500 28,690 29,215 31,125 31,310

© 2015 Align Technology, Inc. All rights reserved. 36
Invisalign Average Selling Price (ASP) Worldwide and International
ASP: Invisalign case revenue / Invisalign case shipments ASP adjusted: adjusted for impact of Additional Aligners at No Charge policy launched in July 18, 2015, effective for all new Invisalign Full, Teen, and Assist products, our Full Product Group, as well as any cases that were open as of this date. Note: we are no longer listing billed ASPs which were previously provided to reflect revenue prior to impact from product deferrals.
Q4'13 Q1'14 Q2'14 Q3'14 Q4'14 Q1'15 Q2'15 Q3'15 Q4'15 Worldwide $1,400 $1,405 $1,405 $1,395 $1,370 $1,335 $1,300 $1,255 $1,250 Worldwide, adjusted $1,400 $1,405 $1,405 $1,395 $1,370 $1,335 $1,300 $1,305 $1,295 International $1,630 $1,620 $1,625 $1,560 $1,510 $1,410 $1,380 $1,325 $1,315 International, adjusted $1,630 $1,620 $1,625 $1,560 $1,510 $1,410 $1,375 $1,375 $1,360
$1,220 $1,270 $1,320 $1,370 $1,420 $1,470 $1,520 $1,570 $1,620

© 2015 Align Technology, Inc. All rights reserved. 37
Invisalign Average Selling Price (ASP) Product Groups
Full Products: Invisalign Full, Invisalign Teen, Invisalign Assist Express Products: Invisalign Express 10, Invisalign Express 5, Invisalign Lite, Invisalign i7
ASP adjusted: adjusted for impact of Additional Aligners at No Charge policy launched in July 18, 2015, effective for all new Invisalign Full, Teen, and Assist products, our Full Product Group, as well as any cases that were open as of this date.
Q4'13 Q1'14 Q2'14 Q3'14 Q4'14 Q1'15 Q2'15 Q3'15 Q4'15 Full Products $1,485 $1,495 $1,495 $1,485 $1,460 $1,420 $1,400 $1,345 $1,340 Full Products, adjusted $1,485 $1,495 $1,495 $1,485 $1,460 $1,420 $1,400 $1,400 $1,395 Express Products $995 $990 $990 $950 $960 $930 $865 $855 $865
$700
$900
$1,100
$1,300
$1,500