q4-2015 results
TRANSCRIPT
FOURTH QUARTER AND FULL YEAR
2015 RESULTSFEBRUARY 11, 2016

AGNICO EAGLE | FOURTH QUARTER AND FULL YEAR 2015 RESULTS | 2
Forward Looking StatementsThe information in this presentation has been prepared by Agnico Eagle Mines Limited (“Agnico Eagle” or the “Company”) as at February 11, 2016. Certain
statements contained in this document constitute “forward-looking statements” within the meaning of the United States Private Securities Litigation Reform Act of
1995 and “forward-looking information” under the provisions of Canadian provincial securities laws and are referred to herein as “forward-looking statements”.
When used in this document, the words “anticipate”, “estimate”, “expect”, “forecast”, “planned”, “will”, “could”, “potential” and similar expressions are intended to
identify forward-looking statements. Such statements include without limitation: the Company's forward-looking production guidance, including estimated ore
grades, project timelines, drilling results, metal production, life of mine estimates, production, total cash costs per ounce, minesite costs per tonne; all-in sustaining
costs per ounce and cash flows; the estimated timing and conclusions of technical reports and other studies; the methods by which ore will be extracted or
processed; statements concerning expansion projects, recovery rates, mill throughput, optimization and projected exploration expenditures, including costs and
other estimates upon which such projections are based; estimates of depreciation expense, general and administrative expense and tax rates; the impact of
maintenance shutdowns; statements regarding timing and amounts of capital expenditures and other assumptions; estimates of future mineral reserves, mineral
resources, mineral production, optimization efforts and sales; estimates of mine life; estimates of future mining costs, total cash costs per ounce, minesite costs per
tonne, all-in sustaining costs per ounce and other expenses; estimates of future capital expenditures and other cash needs, and expectations as to the funding
thereof; statements and information as to the projected development of certain ore deposits, including estimates of exploration, development and production and
other capital costs, and estimates of the timing of such exploration, development and production or decisions with respect to such exploration, development and
production; estimates of mineral reserves and mineral resources, and statements and information regarding anticipated future exploration; the anticipated timing of
events with respect to the Company’s mine sites and statements and information regarding the sufficiency of the Company’s cash resources and other statements
and information regarding anticipated trends with respect to the Company's operations, exploration and the funding thereof. Such statements and information reflect
the Company’s views as at the date of this document and are subject to certain risks, uncertainties and assumptions, and undue reliance should not be placed on
such statements and information. Forward-looking statements are necessarily based upon a number of factors and assumptions that, while considered reasonable
by Agnico Eagle as of the date of such statements, are inherently subject to significant business, economic and competitive uncertainties and contingencies. The
material factors and assumptions used in the preparation of the forward-looking statements contained herein, which may prove to be incorrect, include, but are not
limited to, the assumptions set forth herein and in management's discussion and analysis (“MD&A”) and the Company's Annual Information Form (“AIF”) for the year
ended December 31, 2014 filed with Canadian securities regulators and that are included in its Annual Report on Form 40-F for the year ended December 31, 2014
(“Form 40-F”) filed with the U.S. Securities and Exchange Commission (the “SEC”) as well as: that there are no significant disruptions affecting operations; that
production, permitting and expansion at each of Agnico Eagle's properties proceeds on a basis consistent with current expectations and plans; that the relevant
metals prices, exchange rates and prices for key mining and construction supplies will be consistent with Agnico Eagle's expectations; that Agnico Eagle's current
estimates of mineral reserves, mineral resources, mineral grades and metal recovery are accurate; that there are no material delays in the timing for completion of
ongoing growth projects; that the Company's current plans to optimize production are successful; and that there are no material variations in the current tax and
regulatory environment. Many factors, known and unknown could cause the actual results to be materially different from those expressed or implied by such
forward-looking statements and information. Such risks include, but are not limited to: the volatility of prices of gold and other metals; uncertainty of mineral
reserves, mineral resources, mineral grades and mineral recovery estimates; uncertainty of future production, project development, capital expenditures, and other
costs; currency fluctuations; financing of additional capital requirements; cost of exploration and development programs; mining risks; community protests; risks
associated with foreign operations; governmental and environmental regulation; the volatility of the Company’s stock price; and risks associated with the Company’s
currency, fuel and by-product metal derivative strategies. For a more detailed discussion of such risks and other factors that may affect the Company’s ability to
achieve the expectations set forth in the forward-looking statements contained in this document, see the AIF and MD&A filed on SEDAR at www.sedar.com and
included in the Form 40-F filed on EDGAR at www.sec.gov, as well as the Company’s other filings with the Canadian securities regulators and the SEC. Other than
as required by law, the Company does not intend, and does not assume any obligation, to update these forward-looking statements and information. For a detailed
breakdown of the Company’s mineral reserve and mineral resource position see the Company’s press release dated February 10, 2016.
AGNICO EAGLE | FOURTH QUARTER AND FULL YEAR 2015 RESULTS | 3
Notes to Investors
Note Regarding the Use of Non-GAAP Financial Measures
This presentation discloses certain measures, including ‘‘total cash costs per ounce’’, ‘‘minesite costs per tonne’’ and “all-in sustaining costs per ounce” that arenot recognized measures under IFRS. This data may not be comparable to data presented by other gold producers. For a reconciliation of these measures tothe most directly comparable financial information presented in the consolidated financial statements prepared in accordance with IFRS and for an explanation ofhow management uses these measures, see “Non-GAAP Financial Performance Measures” in the MD&A filed on SEDAR at www.sedar.com and included in theForm 6-K filed on EDGAR at www.sec.gov, as well as the Company’s other filings with the Canadian securities regulators and the SEC. Total cash costs perounce of gold produced is presented on both a by-product basis (deducting by-product metal revenues from production costs) and co-product basis (before by-product metal revenues). Total cash costs per ounce of gold produced on a by-product basis is calculated by adjusting production costs as recorded in theconsolidated statements of income (loss) for by-product revenues, unsold concentrate inventory production costs, smelting, refining and marketing charges andother adjustments, and then dividing by the number of ounces of gold produced. Total cash costs per ounce of gold produced on a co-product basis is calculatedin the same manner as total cash costs per ounce of gold produced on a by-product basis except that no adjustment is made for by-product metal revenues.Accordingly, the calculation of total cash costs per ounce of gold produced on a co-product basis does not reflect a reduction in production costs or smelting,refining and marketing charges associated with the production and sale of by-product metals. Total cash costs per ounce of gold produced is intended to provideinformation about the cash generating capabilities of the Company’s mining operations. Management also uses these measures to monitor the performance ofthe Company’s mining operations. As market prices for gold are quoted on a per ounce basis, using the total cash costs per ounce of gold produced on a by-product basis measure allows management to assess a mine’s cash generating capabilities at various gold prices. All-in sustaining costs per ounce is used toshow the full cost of gold production from current operations. The Company calculates all-in sustaining costs per ounce of gold produced on a by-product basisas the aggregate of total cash costs per ounce on a by-product basis, sustaining capital expenditures (including capitalized exploration), general andadministrative expenses (including stock options) and reclamation expenses divided by the amount of gold produced. The all-in sustaining costs per ounce ofgold produced on a co-product basis is calculated in the same manner as the all-in sustaining costs per ounce of gold produced on a by-product basis except thatthe total cash costs per ounce on a co-product basis is used, meaning no adjustment is made for by-product metal revenues. The Company's methodology forcalculating all-in sustaining costs per ounce may differ from to the methodology used by other producers that disclose all-in sustaining costs per ounce. TheCompany may change the methodology it uses to calculate all-in sustaining costs per ounce in the future, including in response to the adoption of formal industryguidance regarding this measure by the World Gold Council. Management is aware that these per ounce measures of performance can be affected byfluctuations in exchange rates and, in the case of total cash costs per ounce of gold produced on a by-product basis, by-product metal prices. Managementcompensates for these inherent limitations by using these measures in conjunction with minesite costs per tonne (discussed below) as well as other dataprepared in accordance with IFRS. Management also performs sensitivity analyses in order to quantify the effects of fluctuating exchange rates and metal prices.This presentation also contains information as to estimated future total cash costs per ounce, all-in sustaining costs per ounce and minesite costs per tonne. Theestimates are based upon the total cash costs per ounce, all-in sustaining costs per ounce and minesite costs per tonne that the Company expects to incur tomine gold at its mines and projects and, consistent with the reconciliation of these actual costs referred to above, do not include production costs attributable toaccretion expense and other asset retirement costs, which will vary over time as each project is developed and mined. It is therefore not practicable to reconcilethese forward-looking non-GAAP financial measures to the most comparable IFRS measure.
Note Regarding Production Guidance
The gold production guidance is based on the Company’s mineral reserves but includes contingencies and assumes metal prices and foreign exchange rates thatare different from those used in the mineral reserve estimates. These factors and others mean that the gold production guidance presented in this presentationdoes not reconcile exactly with the production models used to support these mineral reserves.

AGNICO EAGLE | FOURTH QUARTER AND FULL YEAR 2015 RESULTS | 4
Guidance exceeded for fourth consecutive year – 2015 payable gold production was 1,671,340 ounces at total cash
costs per ounce of $567, compared to guidance of 1.65 Mozs at total cash costs per ounce of $600. All-in sustaining costs
per ounce (AISC) for 2015 were $810 compared to guidance of $850
Stable production and costs expected through 2018 – Average annual production from 2016 to 2018 is forecast to be
approximately 1.53 Mozs. Production in 2016 is expected to be 1.525 to 1.565 Mozs at total cash costs of $590 to $630
per ounce. AISC for 2016 are expected to be $850 to $890 per ounce
Gold reserve grades increased at key mines, significant increase in 2015 gold resources, slight decline in gold
reserves after mining– Reserve grades increased at the LaRonde, Canadian Malartic, Goldex and La India mines.
Measured and indicated mineral resources were up 1%, while inferred mineral resources increased by 23%, and mineral
reserves declined by only 5% to 19.1 Mozs ounces
Significant increase in gold resources at Amaruq, initial resources declared at EL Barqueño and the Sisar Zone
– 67% increase in Amaruq inferred resources to 3.3 Mozs (16.9 million tonnes at 6.05 g/t gold). El Barqueno inferred
resources estimated at 0.61 Mozs (19.7 million tonnes at 0.96 g/t gold), while the new Sisar Zone contains inferred
resources of 0.65 Mozs (3.4 million tonnes at 5.91 g/t gold)
Moderate 2016 capital spending preserves production optionality in Nunavut – Expenditures at Amaruq are
designed to expand and upgrade the gold resources and outline a second source of open pit ore. Spending at Meliadine
in 2016 is sufficient to keep critical path elements moving forward. However, this decreased spending may delay the
potential project start-up by approximately one year to 2020
Improved financial flexibility – In 2015, net debt was reduced by $190 million, further strengthening the Company’s
investment grade balance sheet
Fourth Quarter and Full Year Highlights

AGNICO EAGLE | FOURTH QUARTER AND FULL YEAR 2015 RESULTS | 5
Operating ResultsStrong Operational Performance Yields Record Annual Production
Q4 2015 2015
All amounts are in US$ (Unless Otherwise Indicated)
Production (Gold oz)
Total Cash Costs* ($/oz)
Operating Margin($000’s)
Production (Gold oz)
Total Cash Costs* ($/oz)
Operating Margin($000’s)
Northern Business
LaRonde 73,161 $510 $50,667 267,921 $590 $145,924
Lapa 19,929 $620 $12,363 90,967 $590 $52,214
Goldex 27,646 $513 $17,108 115,426 $538 $72,567
Canadian Malartic (50%) 72,872 $606 $38,059 285,809 $596 $161,807
Kittila 44,279 $747 $15,174 177,374 $709 $80,262
Meadowbank 102,580 $526 $64,664 381,804 $613 $216,334
340,467 $573 $198,035 1,319,301 $609 $729,108
Southern Business
Pinos Altos 44,496 $417 $29,327 192,974 $387 $145,734
Creston Mascota 13,933 $445 $9,919 54,703 $430 $40,194
La India 23,432 $485 $15,832 104,362 $436 $75,101
81,861 $441 $55,078 352,039 $408 $261,029
Total 422,328 $547 $253,113 1,671,340 $567 $990,137
Q4 2015 Total Operating Margin – $253.1MQ4 2015 Revenue by Metal
Meadowbank, 25%
LaRonde, 20%
Canadian Malartic, 15%
Pinos Altos, 12%
Goldex, 7%
La India, 6%
Kittila, 6%
Lapa, 5%
Creston Mascota, 4%
*Total cash costs are presented on a by-product basis, that is net of by-product revenue
Gold…
Silver4%
Base Metals…
AGNICO EAGLE | FOURTH QUARTER AND FULL YEAR 2015 RESULTS | 6
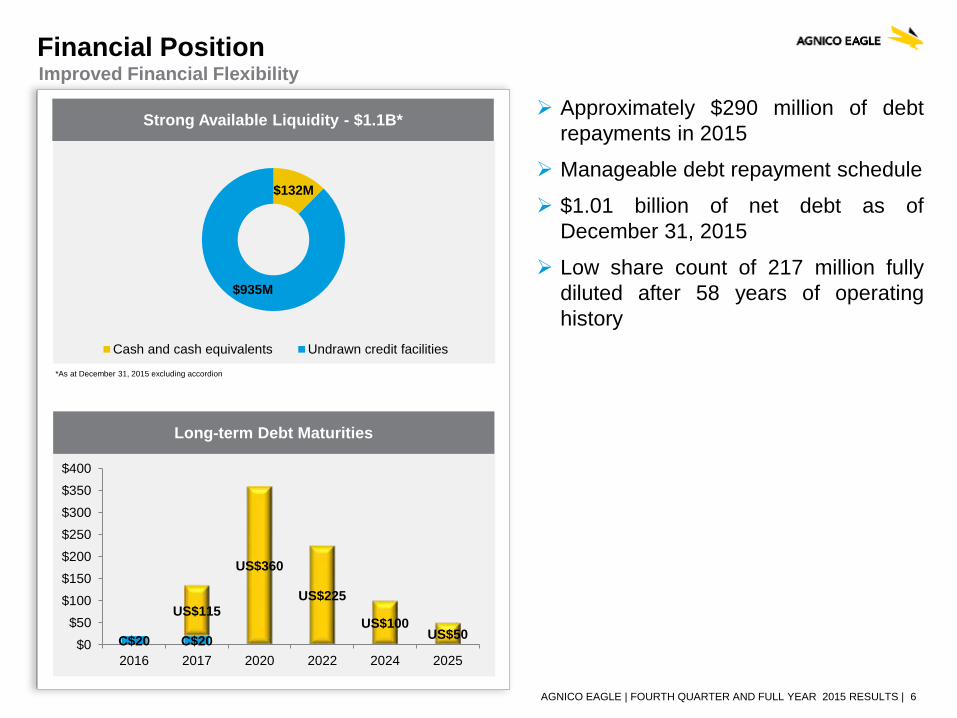
$132M
$935M
Cash and cash equivalents Undrawn credit facilities
Financial PositionImproved Financial Flexibility
Strong Available Liquidity - $1.1B*
Long-term Debt Maturities
*As at December 31, 2015 excluding accordion
Approximately $290 million of debt
repayments in 2015
Manageable debt repayment schedule
$1.01 billion of net debt as of
December 31, 2015
Low share count of 217 million fully
diluted after 58 years of operating
history
C$20 C$20
US$115
US$360
US$225
US$100US$50
$0
$50
$100
$150
$200
$250
$300
$350
$400
2016 2017 2020 2022 2024 2025

AGNICO EAGLE | FOURTH QUARTER AND FULL YEAR 2015 RESULTS | 7
Financial HighlightsRecord Quarterly Production Drives Strong Cash Flow Performance
All amounts are in US$ (Unless Otherwise Indicated) Q4 2015 Q4 2014 2015 2014
Realized Gold Price ($/oz) $1,094 $1,202 $1,156 $1,261
Revenues (millions) $483 $503 $1,985 $1,897
Earnings (millions) ($16) ($21) $25 $83
Earnings per share (basic) ($0.07) ($0.10) $0.11 $0.43
Cash provided by operating activities (millions) $141 $164 $616 $668
Operating Cash flow per share after changes in non-cash
components of working capital (basic)$0.65 $0.77 $2.85 $3.42

AGNICO EAGLE | FOURTH QUARTER AND FULL YEAR 2015 RESULTS | 8
Stable operations, measured development spending and increased exploration efforts expected to result in production growth beyond 2019
The current three year plan (2016 through 2018) sets out estimated average annual gold production of approximately 1.53 Mozs with a forecasted stable cost profile
In 2016, payable production is expected to be approximately 1.525 to 1.565 Mozs of gold. Total cash costs per ounce on a by-product basis in 2016 are expected to be $590 to $630 . Previous guidance for 2016 (from the February 2015 forecast) was 1.60 Mozs. The change from previous guidance is primarily due to the expansion of the Vault pit at Meadowbank which deferred ounces from 2016 into 2017 and 2018, extending the mine life
AISC for 2016 are expected to be approximately $850 to $890 per ounce. In 2017 and 2018, the goal is to reduce AISC below this range
Estimated production in 2017 is forecast to be approximately 1.55 Mozs of gold (up from 1.50 Mozspreviously forecast by the Company in the February 2015 guidance), while production in 2018 is forecast to be approximately 1.50 Mozs of gold. The Company is evaluating potential optimizations and opportunities (none of which have yet been approved for construction) at a number of existing operations to further enhance the production profile in 2018 and beyond
New Three Year Guidance - Stable Production and Cost Profile

AGNICO EAGLE | FOURTH QUARTER AND FULL YEAR 2015 RESULTS | 9
ESTIMATED PAYABLE GOLD PRODUCTION (2016 – 2018)
2016 2017 2018
Estimated* (oz)Total Cash Costs*
($/oz)Estimated (oz) Estimated (oz)
Northern Business
LaRonde 275,000 $592 320,000 375,000
Canadian Malartic (50%) 280,000 $593 295,000 305,000
Lapa 60,000 $640 - -
Goldex 105,000 $601 105,000 130,000
Kittila 200,000 $646 190,000 200,000
Meadowbank 305,000 $750 320,000 155,000
1,225,000 $644 1,230,000 1,165,000
Southern Business
Pinos Altos 175,000 $443 175,000 180,000
Creston Mascota 45,000 $604 40,000 40,000
La India 100,000 $470 105,000 115,000
320,000 $474 320,000 335,000
Total Gold Production 1,545,000 $608 1,550,000 1,500,000
Estimated Byproduct Production – 2016
Ag Production Zn Production
(tonnes)
Cu Production
(tonnes)000’s oz
Northern Business
LaRonde 1,030 4,117 4,575
Canadian Malartic (50%) 280 - -
Meadowbank 190 - -
Northern Total 1,500 4,117 4,575
Southern Business
Pinos Altos 2,149 - -
Creston Mascota 108 - -
La India 129 - -
Southern Total 2,386 - -
Total 3,886 4,117 4,575
*Approximate mid-point of range

AGNICO EAGLE | FOURTH QUARTER AND FULL YEAR 2015 RESULTS | 10
Estimated production level in 2018 is currently forecast to be approximately 1.5 Mozs. However, studies are underway at the following projects (which have not yet been approved for construction) which could further enhance the Company’s production profile:
LaRonde optimization potential- Bousquet Zone 5- Lapa Zone 8 Upper mine and Zulapa 7 - Deep 2 Zone
Goldex optimization potential- Increased throughput from Deep Zone 1- Potential for accelerated development of Deep Zone 2- Potential development of the Akasaba West satellite deposit
Kittila optimization potential- Upper Rimpi Zone development- Potential development of the new Sisar Zone
Mexican optimizations- Satellite zones at Pinos Altos and Creston Mascota- Potential to expand reserves at La India
OPPORTUNITIES TO ENHANCE FUTURE PRODUCTION

AGNICO EAGLE | FOURTH QUARTER AND FULL YEAR 2015 RESULTS | 11
2016E 2017E 2018E 2019 and Beyond
Development Pipeline Could Provide Further Production Growth
Meliadine, Amaruq, El Barqueno and the LaRonde Extension are anticipated to be key production drivers
post 2019
Payable Gold Production Profile
* Approximate mid range of estimated 2016 production guidance
1,545,000* 1,555,0001,500,000
M e l i a d i n e
A m a r u q
E l B a r q u e n o
L a R o n d e
E x t e n s i o n
AGNICO EAGLE | FOURTH QUARTER AND FULL YEAR 2015 RESULTS | 12
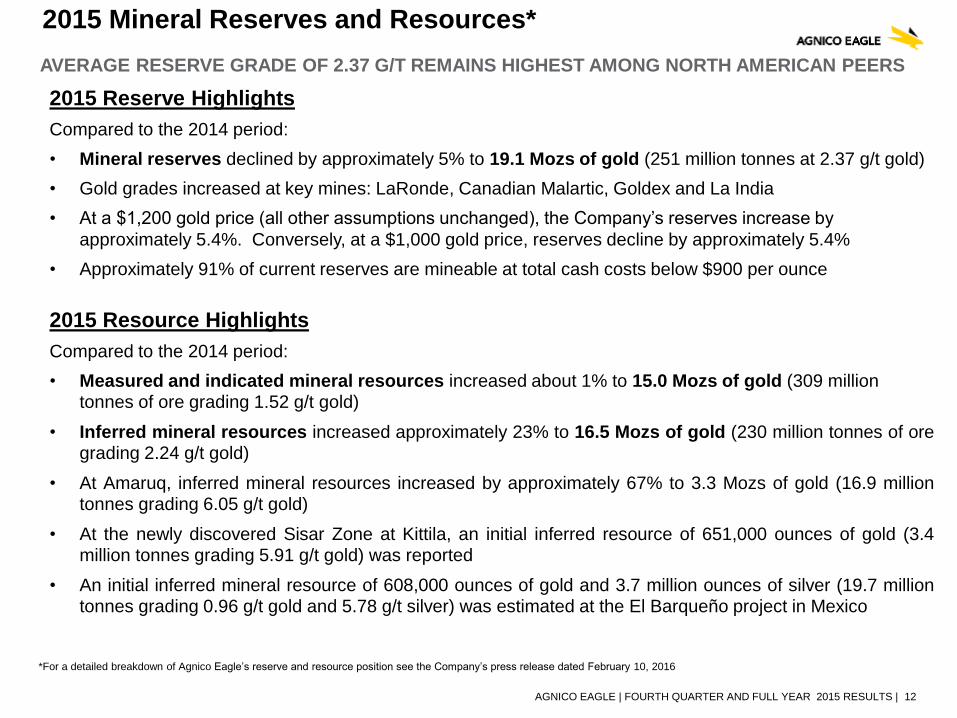
2015 Reserve Highlights
Compared to the 2014 period:
• Mineral reserves declined by approximately 5% to 19.1 Mozs of gold (251 million tonnes at 2.37 g/t gold)
• Gold grades increased at key mines: LaRonde, Canadian Malartic, Goldex and La India
• At a $1,200 gold price (all other assumptions unchanged), the Company’s reserves increase by
approximately 5.4%. Conversely, at a $1,000 gold price, reserves decline by approximately 5.4%
• Approximately 91% of current reserves are mineable at total cash costs below $900 per ounce
2015 Resource Highlights
Compared to the 2014 period:
• Measured and indicated mineral resources increased about 1% to 15.0 Mozs of gold (309 million tonnes of ore grading 1.52 g/t gold)
• Inferred mineral resources increased approximately 23% to 16.5 Mozs of gold (230 million tonnes of oregrading 2.24 g/t gold)
• At Amaruq, inferred mineral resources increased by approximately 67% to 3.3 Mozs of gold (16.9 milliontonnes grading 6.05 g/t gold)
• At the newly discovered Sisar Zone at Kittila, an initial inferred resource of 651,000 ounces of gold (3.4million tonnes grading 5.91 g/t gold) was reported
• An initial inferred mineral resource of 608,000 ounces of gold and 3.7 million ounces of silver (19.7 milliontonnes grading 0.96 g/t gold and 5.78 g/t silver) was estimated at the El Barqueño project in Mexico
*For a detailed breakdown of Agnico Eagle’s reserve and resource position see the Company’s press release dated February 10, 2016
2015 Mineral Reserves and Resources*
AVERAGE RESERVE GRADE OF 2.37 G/T REMAINS HIGHEST AMONG NORTH AMERICAN PEERS

NORTHERNBUSINESS

AGNICO EAGLE | FOURTH QUARTER AND FULL YEAR 2015 RESULTS | 14
Connection of the 269 and 293 mining pyramids and full
commissioning of the coarse ore conveyor is planned for
2016, which should improve mining flexibility
This year, about 89% of the ore will come from the
higher grade lower mine area (below level 248). The
increased production forecasts through 2018 largely
reflect an increase in grade closer to that of the average
mineral reserves
Exploration and studies are continuing to assess the
potential to extend the mineral reserves and carry out
mining activities between the 311 and 371 levels
The Company is evaluating the potential to initially mine
the Bousquet Zone 5 from a depth of 90 to 330 metres
below surface via an underground ramp. Dewatering of
the old pit is underway and permit applications to collect
a bulk sample will be submitted shortly
LaRondeIncreased Tonnage from Lower Mine Drives Record Quarterly Production
Proven & probable gold
reserves (million oz)
3.1
Indicated gold resource (million oz)
0.8
Inferred gold resource (million oz)
1.3
Q4 2015 Total Cash
Costs/oz
$510
Q4 2015 Production(koz)
73
See AEM February 10, 2016 press release and appendix for detailed breakdown of reserves and resources
$80
$90
$100
$110
$120
$130
-
10
20
30
40
50
60
70
Q1-14Q2-14Q3-14Q4-14Q1-15Q2-15Q3-15Q4-15
Production (koz) Cost/tonne

AGNICO EAGLE | FOURTH QUARTER AND FULL YEAR 2015 RESULTS | 15
The Partnership is working on the permitting necessary
for improving the efficiency and environmental
performance of the existing mobile crusher. Milling
levels are expected to be approximately 53,000 tpd
through year-end 2016
Further initiatives to optimize operations:
Improvements to SAG and crusher mill liners to reduce the
number of planned shutdowns
Higher North Zone performance with the purchase of an
additional remote control production back hoe. This should
result in higher grade ore being brought to the mill
Cost savings opportunities: primarily on explosives and
contractors
Exploration programs are planned to evaluate a number
of near pit/underground targets at the mine and further
define the extent of the mineralization at the Odyssey
zone
Canadian Malartic (50% Interest)Annual Records Set for Ounces Produced and Tonnes Milled
*Includes 11,878 ounces attributable to AEM post the Osisko acquisition
** Excludes royalties
Proven & probable gold
reserves (million oz)
3.9
Measured & indicated
gold resource (million oz)
0.6
Inferred gold resource (million oz)
0.2
Q4 2015 Total Cash
Costs/oz
$606
Q4 2015 Production(koz)
73Reserves and resources represent Agnico Eagle’s 50% interest as of December 31, 2015
$17
$18
$19
$20
$21
$22
$23
100
110
120
130
140
150
160Production (koz) (100%) Cost/tonne**
See AEM February 10, 2016 press release and appendix for detailed breakdown of reserves and resources
AGNICO EAGLE | FOURTH QUARTER AND FULL YEAR 2015 RESULTS | 16
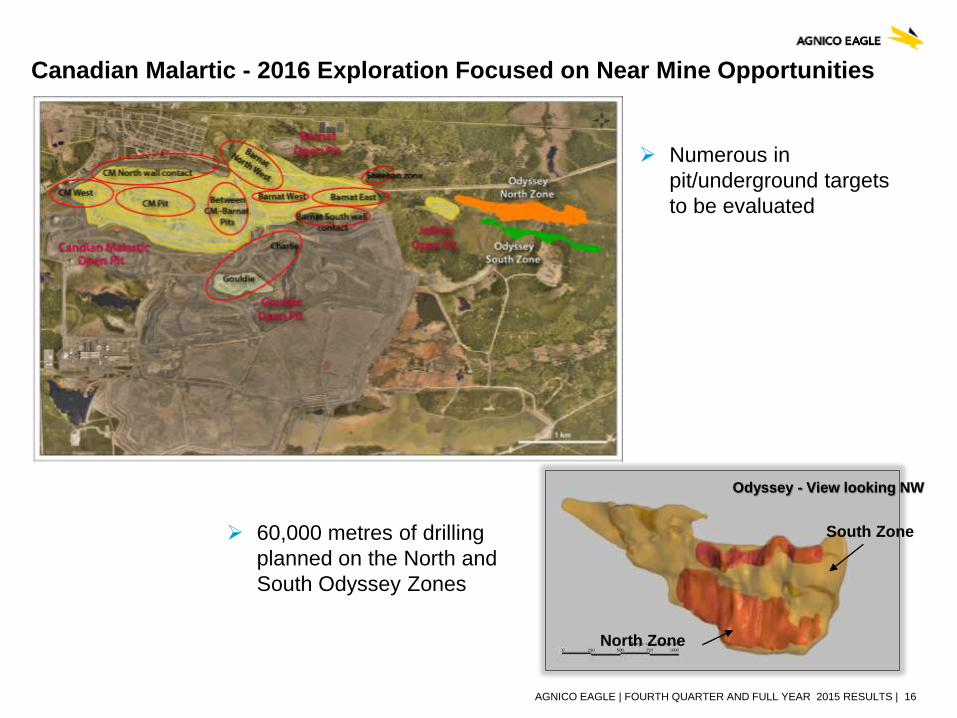
Canadian Malartic - 2016 Exploration Focused on Near Mine Opportunities
Odyssey - View looking NW
South Zone
North Zone
Numerous in
pit/underground targets
to be evaluated
60,000 metres of drilling
planned on the North and
South Odyssey Zones

AGNICO EAGLE | FOURTH QUARTER AND FULL YEAR 2015 RESULTS | 17
At Goldex, production in 2015 was above the previous
guidance due to a faster than expected ramp-up in
mining rates
Existing mineral reserves and exploitation of the M3 and
M4 zones are expected to keep production levels and
costs relatively constant through 2017
In July 2015, the Company announced approval of the
Deep 1 project. This project has the potential to unlock
other value creating opportunities such as potential
development of the Akasaba West deposit and the Deep
2 Zone
Production guidance in 2018 reflects the potential to
increase mill throughput levels beyond the current
forecast of approximately 6,400 tpd
GoldexRecord Underground Ore Hoisting in Q4 2015, Trend Could Continue into 2016
Proven & probable gold
reserves (million oz)
0.7
Measured & indicated
gold resource (million oz)
2.1
Inferred gold resource (million oz)
1.2
Q4 2015 Total Cash
Costs/oz
$513
Q4 2015 Production(koz)
28
$20
$25
$30
$35
$40
$45
$50
15
20
25
30
35
Q1-14Q2-14Q3-14Q4-14Q1-15Q2-15Q3-15Q4-15
Production (koz) Cost/tonne
See AEM February 10, 2016 press release and appendix for detailed breakdown of reserves and resources

AGNICO EAGLE | FOURTH QUARTER AND FULL YEAR 2015 RESULTS | 18
Under the current life of mine plan, Lapa is only expected
to operate until early into the fourth quarter of 2016
Two targets have been identified through exploration as
areas that could potentially support future mining activity
potentially in 2018, in a restart scenario
However, additional exploration is required, and any
potential production from these areas are expected to
require synergies with other production opportunities such
as the Bousquet Zone 5 or the Pandora project (in which
the Company has 50% ownership)
LapaStrong 2015 Performance, Limited Mine Life in 2016, Exploration Could Provide Additional Upside
Proven & probable gold
reserves (million oz)
0.1
Indicated gold resource (million oz)
0.2
Inferred gold resource (million oz)
0.3
Q4 2015 Total Cash
Costs/oz
$620
Q4 2015 Production(koz)
20
$90
$100
$110
$120
$130
$140
$150
-
5
10
15
20
25
30
Q1-14Q2-14Q3-14Q4-14Q1-15Q2-15Q3-15Q4-15
Production (koz) Cost/tonne
See AEM February 10, 2016 press release and appendix for detailed breakdown of reserves and resources

AGNICO EAGLE | FOURTH QUARTER AND FULL YEAR 2015 RESULTS | 19
In 2015, optimization initiatives resulted in a significant
increase in total tonnage moved. Mining rates are
expected to be sustainable at these levels which could
provide additional flexibility
In 2015, a decision was made to extend the Vault pit, which
resulted in decreased forecast production in 2016, but
added about another year of production (now through Q3
2018). This extension helps to partially bridge the
production gap with the potential development of the
Amaruq deposit
Production levels are expected to decline from 2017 to
2018 due to a decline in grade as the current mineral
reserve base is depleted
A major drill program is underway at Amaruq to expand
mineral resources and to try to delineate a second open pit
MeadowbankImproved Mining Rates Could Provide Additional Flexibility Through 2018
Proven & probable gold
reserves (million oz)
0.9
Measured & indicated
gold resource (million oz)
0.7
Inferred gold resource (million oz)
0.4
Q4 2015 Total Cash
Costs/oz
$526
Q4 2015 Production(koz)
103
$60
$65
$70
$75
$80
$85
$90
-
25
50
75
100
125
150
175
Q1-14Q2-14Q3-14Q4-14Q1-15Q2-15Q3-15Q4-15
Production (koz) Cost/tonne
See AEM February 10, 2016 press release and appendix for detailed breakdown of reserves and resources

AGNICO EAGLE | FOURTH QUARTER AND FULL YEAR 2015 RESULTS | 20
Amaruq ProjectInferred Resources expanded 67% Since August 2015*
2016 drill program underway, focus on locating a second open pit source of ore
Two drills currently
testing the Mammoth
target
*See AEM August 19, 2015 press release for detailed breakdown of previous resources
AGNICO EAGLE | FOURTH QUARTER AND FULL YEAR 2015 RESULTS | 21
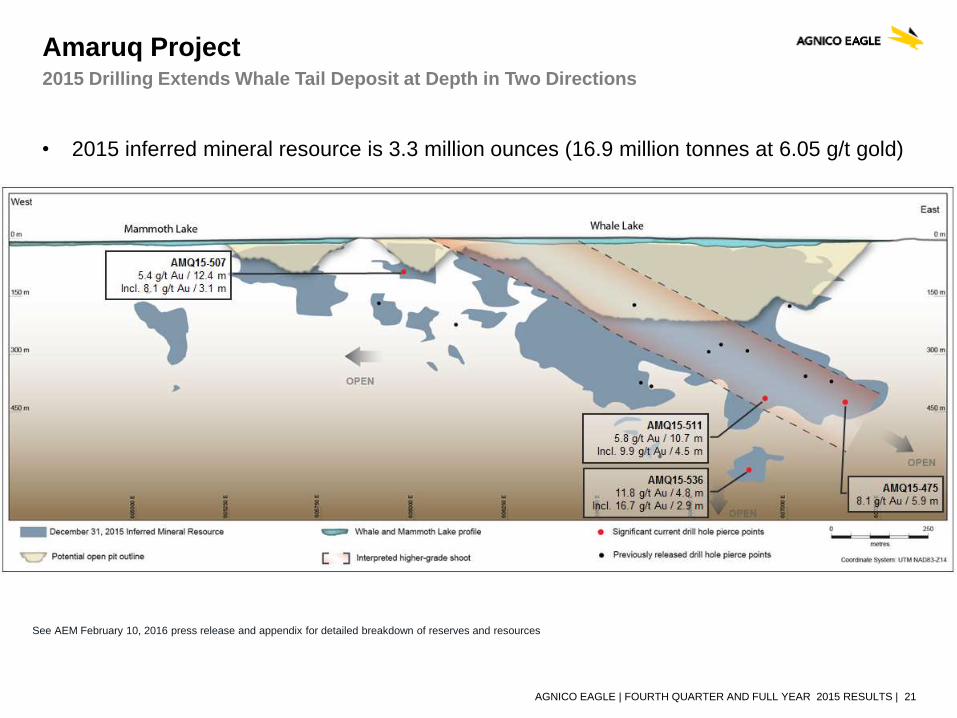
Amaruq Project2015 Drilling Extends Whale Tail Deposit at Depth in Two Directions
See AEM February 10, 2016 press release and appendix for detailed breakdown of reserves and resources
• 2015 inferred mineral resource is 3.3 million ounces (16.9 million tonnes at 6.05 g/t gold)

AGNICO EAGLE | FOURTH QUARTER AND FULL YEAR 2015 RESULTS | 22
2016 capital budget of $96 million focused on further
underground development (approximately 3,000 metres),
detailed engineering and procurement, construction of
essential surface infrastructure and acquisition of a used
camp facility
Internal studies are ongoing to evaluate the potential to
extract additional ounces of gold which could potentially
extend the mine life, increase annual production, and
improve the project economics and the after-tax internal
rate of return. These studies are expected to be
completed in the third quarter of 2016
Future investment decisions are subject to Agnico Eagle
Board approval, prevailing market conditions and
outcomes of various potential scenarios being evaluated
MeliadineModerate 2016 Capital Expenditures Preserve Production Optionality, But Potential Start-up
Delayed by One Year to 2020
Proven & probable gold
reserves (million oz)
3.4
Indicated gold resource (million oz)
3.3
Inferred gold resource (million oz)
3.6
See AEM February 10, 2016 press release and appendix for detailed breakdown of reserves and resources
AGNICO EAGLE | FOURTH QUARTER AND FULL YEAR 2015 RESULTS | 23
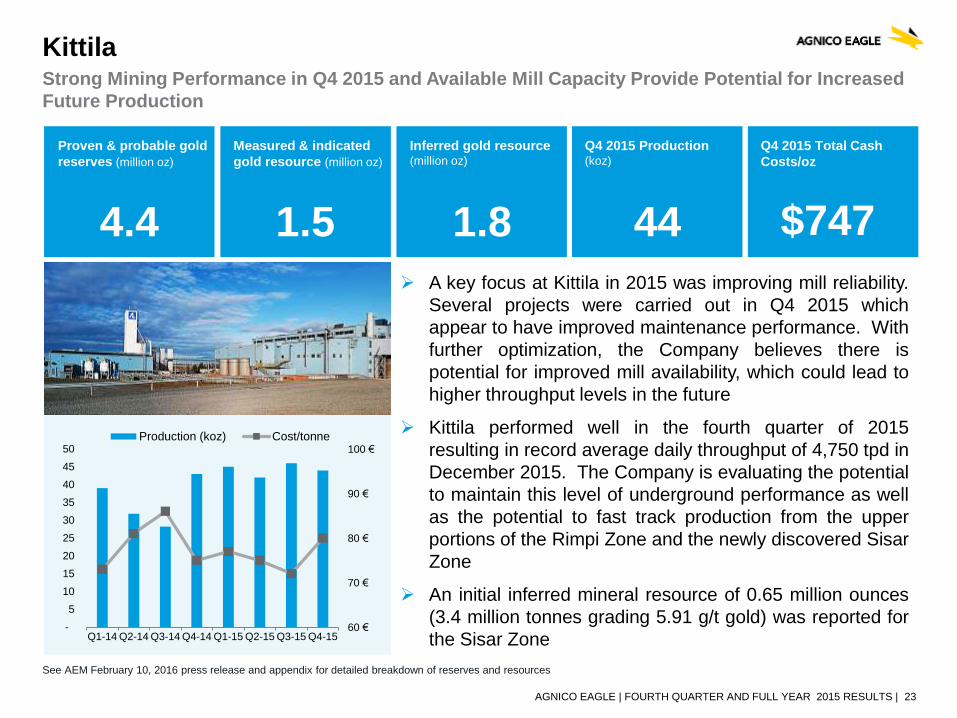
A key focus at Kittila in 2015 was improving mill reliability.
Several projects were carried out in Q4 2015 which
appear to have improved maintenance performance. With
further optimization, the Company believes there is
potential for improved mill availability, which could lead to
higher throughput levels in the future
Kittila performed well in the fourth quarter of 2015
resulting in record average daily throughput of 4,750 tpd in
December 2015. The Company is evaluating the potential
to maintain this level of underground performance as well
as the potential to fast track production from the upper
portions of the Rimpi Zone and the newly discovered Sisar
Zone
An initial inferred mineral resource of 0.65 million ounces
(3.4 million tonnes grading 5.91 g/t gold) was reported for
the Sisar Zone
KittilaStrong Mining Performance in Q4 2015 and Available Mill Capacity Provide Potential for Increased
Future Production
Proven & probable gold
reserves (million oz)
4.4
Measured & indicated
gold resource (million oz)
1.5
Inferred gold resource (million oz)
1.8
Q4 2015 Total Cash
Costs/oz
Q4 2015 Production(koz)
44
60 €
70 €
80 €
90 €
100 €
-
5
10
15
20
25
30
35
40
45
50
Q1-14 Q2-14 Q3-14 Q4-14 Q1-15 Q2-15 Q3-15 Q4-15
Production (koz) Cost/tonne
$747
See AEM February 10, 2016 press release and appendix for detailed breakdown of reserves and resources
AGNICO EAGLE | FOURTH QUARTER AND FULL YEAR 2015 RESULTS | 24
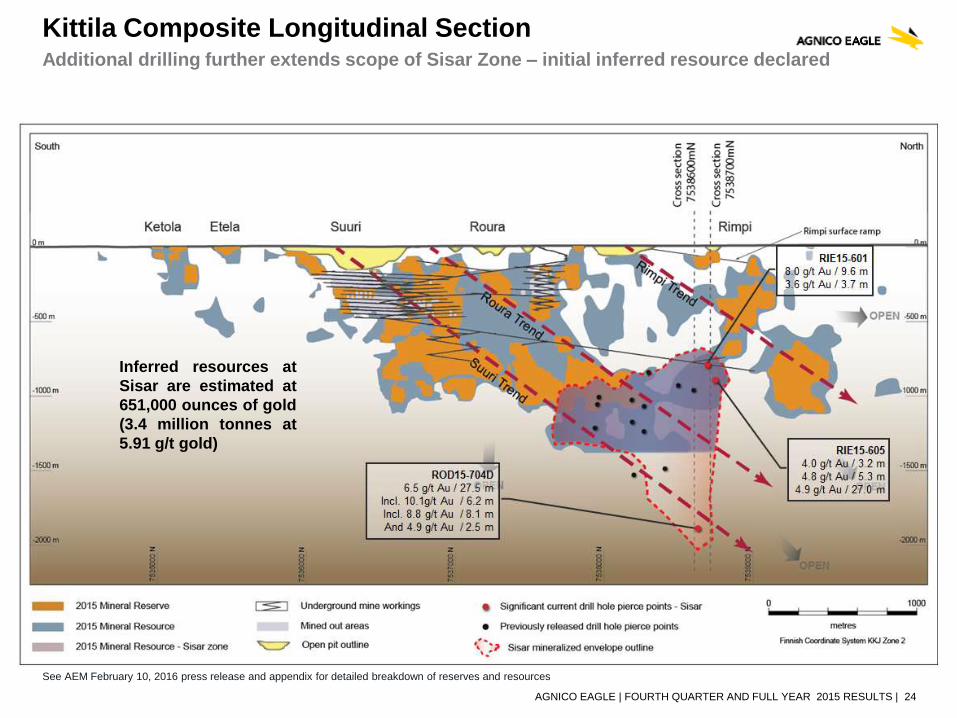
Kittila Composite Longitudinal SectionAdditional drilling further extends scope of Sisar Zone – initial inferred resource declared
Inferred resources at
Sisar are estimated at
651,000 ounces of gold
(3.4 million tonnes at
5.91 g/t gold)
See AEM February 10, 2016 press release and appendix for detailed breakdown of reserves and resources

AGNICO EAGLE | FOURTH QUARTER AND FULL YEAR 2015 RESULTS | 25
Kittila Composite Cross Sections (Looking North)
Sisar Zone Could Potentially Be An Additional Ore Source With Relatively Low Development Costs

SOUTHERNBUSINESS
AGNICO EAGLE | FOURTH QUARTER AND FULL YEAR 2015 RESULTS | 27
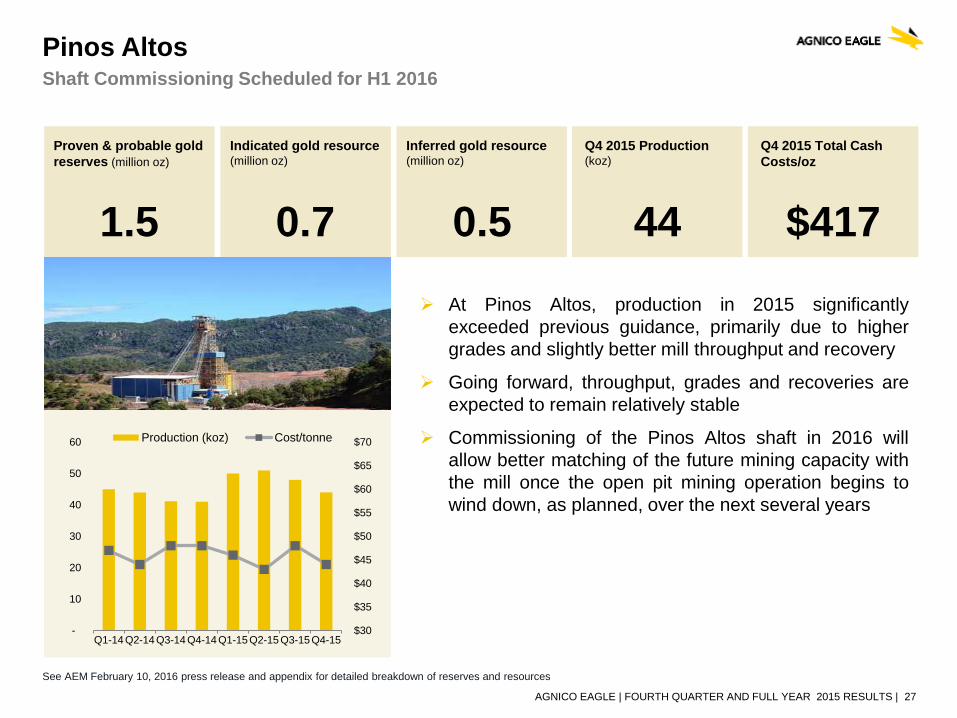
At Pinos Altos, production in 2015 significantly
exceeded previous guidance, primarily due to higher
grades and slightly better mill throughput and recovery
Going forward, throughput, grades and recoveries are
expected to remain relatively stable
Commissioning of the Pinos Altos shaft in 2016 will
allow better matching of the future mining capacity with
the mill once the open pit mining operation begins to
wind down, as planned, over the next several years
Pinos AltosShaft Commissioning Scheduled for H1 2016
Proven & probable gold
reserves (million oz)
1.5
Indicated gold resource (million oz)
0.7
Inferred gold resource (million oz)
0.5
Q4 2015 Total Cash
Costs/oz
$417
Q4 2015 Production(koz)
44
$30
$35
$40
$45
$50
$55
$60
$65
$70
-
10
20
30
40
50
60
Q1-14 Q2-14 Q3-14 Q4-14 Q1-15 Q2-15 Q3-15 Q4-15
Production (koz) Cost/tonne
See AEM February 10, 2016 press release and appendix for detailed breakdown of reserves and resources

AGNICO EAGLE | FOURTH QUARTER AND FULL YEAR 2015 RESULTS | 28
Production in 2015 was slightly better than previous
guidance due to additional ore being encountered outside
the block model, which resulted in more tonnes stacked
on the leach pad
Infill drilling has encountered higher grade mineralization
below the Creston Mascota pit. Work is underway to
evaluate the impact of this mineralization on the pit design
and production planning
In 2016, further work is planned on the Bravo deposit to
evaluate it as a potential source of additional production
In Q4 of 2015, work on the Phase 4 leach pad advanced
with construction activities focused on earthworks,
drainages, peripheral roads and water diversion channels.
Overall, the project is 50% constructed with full completion
expected later in 2016
Creston MascotaRecord Annual Tonnes stacked
Proven & probable gold
reserves (million oz)
0.2
Indicated gold resource (million oz)
0.1
Inferred gold resource (million oz)
0.1
Q4 2015 Total Cash
Costs/oz
$445
Q4 2015 Production(koz)
14
$-
$5
$10
$15
$20
$25
$30
$35
$40
-
2
4
6
8
10
12
14
16
18
Q1-14Q2-14Q3-14Q4-14Q1-15Q2-15Q3-15Q4-15
Production (koz) Cost/tonne
See AEM February 10, 2016 press release and appendix for detailed breakdown of reserves and resources
AGNICO EAGLE | FOURTH QUARTER AND FULL YEAR 2015 RESULTS | 29
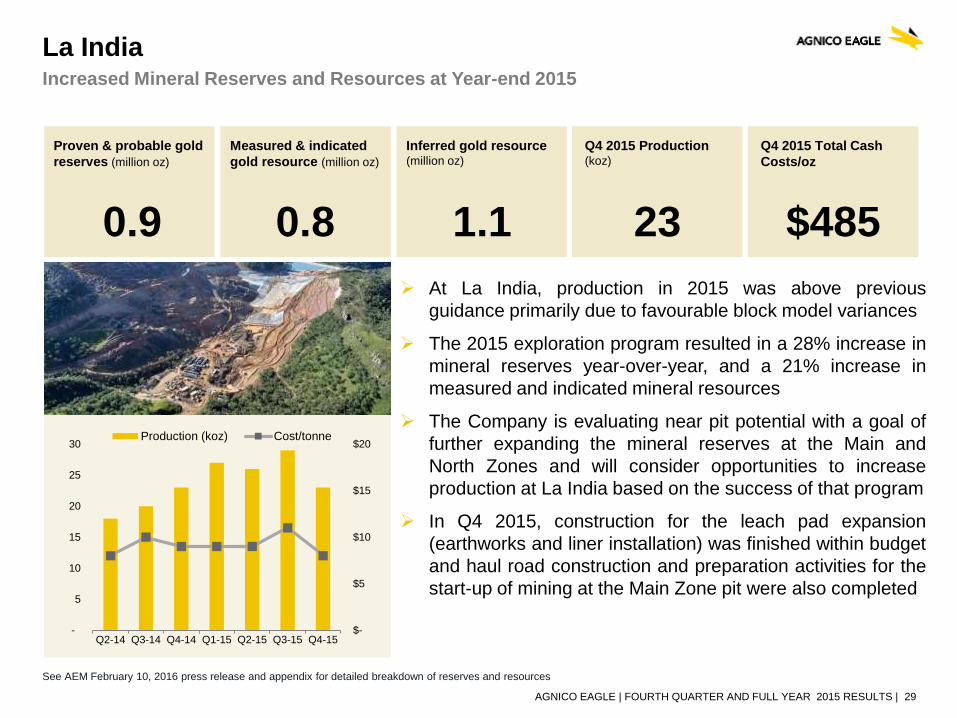
At La India, production in 2015 was above previous
guidance primarily due to favourable block model variances
The 2015 exploration program resulted in a 28% increase in
mineral reserves year-over-year, and a 21% increase in
measured and indicated mineral resources
The Company is evaluating near pit potential with a goal of
further expanding the mineral reserves at the Main and
North Zones and will consider opportunities to increase
production at La India based on the success of that program
In Q4 2015, construction for the leach pad expansion
(earthworks and liner installation) was finished within budget
and haul road construction and preparation activities for the
start-up of mining at the Main Zone pit were also completed
La IndiaIncreased Mineral Reserves and Resources at Year-end 2015
Proven & probable gold
reserves (million oz)
0.9
Measured & indicated
gold resource (million oz)
0.8
Inferred gold resource (million oz)
1.1
Q4 2015 Total Cash
Costs/oz
$485
Q4 2015 Production(koz)
23
$-
$5
$10
$15
$20
-
5
10
15
20
25
30
Q2-14 Q3-14 Q4-14 Q1-15 Q2-15 Q3-15 Q4-15
Production (koz) Cost/tonne
See AEM February 10, 2016 press release and appendix for detailed breakdown of reserves and resources

AGNICO EAGLE | FOURTH QUARTER AND FULL YEAR 2015 RESULTS | 30
La India Exploration Potential
Several near-mine targets will be evaluated in 2016

AGNICO EAGLE | FOURTH QUARTER AND FULL YEAR 2015 RESULTS | 31
Initial Inferred Mineral Resource reported on Azteca-Zapoteca, Peña de Oro and Angostura deposits
The 2016 drill program
is underway with 14
drills
Focus is on mineral
resource development,
conversion, and
regional exploration
Target areas to be
tested in 2016 include:
Zapote
Mixteca
Olmeca
El Rayo
Pilarica
El Barqueño Project
The El Barqueño Project contains an initial total inferred mineral resource of 0.61 Mozs of gold and 3.7
Mozs of silver (19.7 million tonnes grading 0.96 g/t gold and 5.78 g/t silver)
See AEM February 10, 2016 press release and appendix for detailed breakdown of reserves and resources

AGNICO EAGLE | FOURTH QUARTER AND FULL YEAR 2015 RESULTS | 32
Exploration results from Amaruq, El Barqueno, the Sisar Zone and Odyssey – ongoing
throughout 2016
Potential Update of Amaruq, El Barqueno, and Sisar mineral resource estimates –
second half of 2016
Potential Receipt of Meliadine License A – Q2 2016
Update on Status of Meliadine Project – Q3 2016
Potential production decision on Akasaba west project – late 2016 or early 2017
2016 News Flow

APPENDIX
AGNICO EAGLE | FOURTH QUARTER AND FULL YEAR 2015 RESULTS | 34
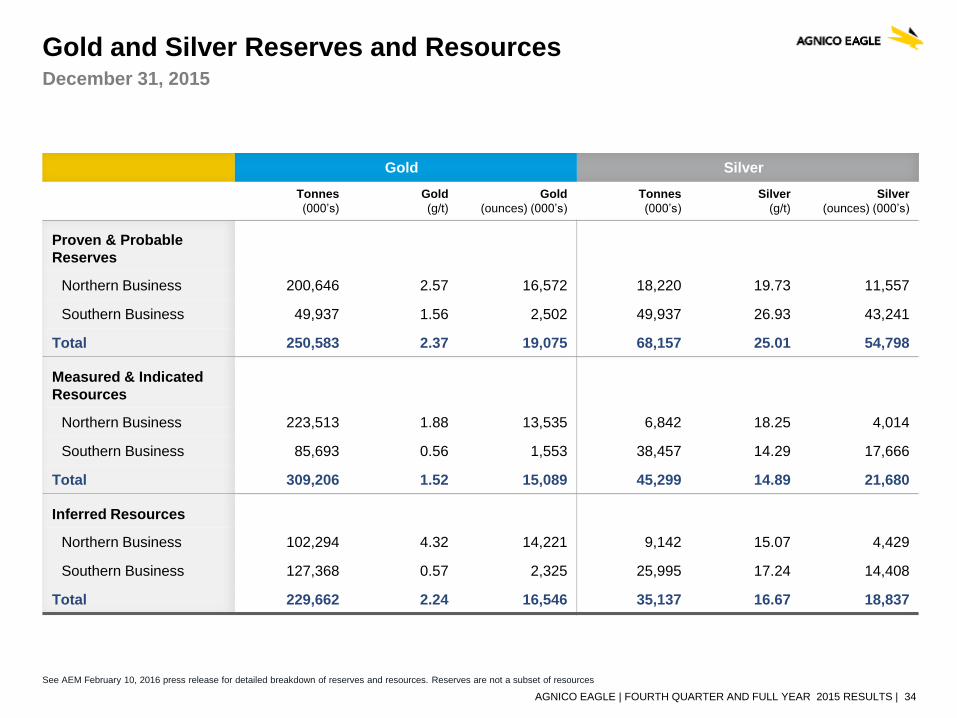
Gold and Silver Reserves and ResourcesDecember 31, 2015
Gold Silver
Tonnes
(000’s)
Gold
(g/t)
Gold
(ounces) (000’s)
Tonnes
(000’s)
Silver
(g/t)
Silver
(ounces) (000’s)
Proven & Probable
Reserves
Northern Business 200,646 2.57 16,572 18,220 19.73 11,557
Southern Business 49,937 1.56 2,502 49,937 26.93 43,241
Total 250,583 2.37 19,075 68,157 25.01 54,798
Measured & Indicated
Resources
Northern Business 223,513 1.88 13,535 6,842 18.25 4,014
Southern Business 85,693 0.56 1,553 38,457 14.29 17,666
Total 309,206 1.52 15,089 45,299 14.89 21,680
Inferred Resources
Northern Business 102,294 4.32 14,221 9,142 15.07 4,429
Southern Business 127,368 0.57 2,325 25,995 17.24 14,408
Total 229,662 2.24 16,546 35,137 16.67 18,837
See AEM February 10, 2016 press release for detailed breakdown of reserves and resources. Reserves are not a subset of resources

AGNICO EAGLE | FOURTH QUARTER AND FULL YEAR 2015 RESULTS | 35
Copper, Zinc and Lead Reserves and ResourcesDecember 31, 2015
Copper Zinc Lead
Tonnes
(000’s)
Copper
(%)
Copper
(tonnes)
Tonnes
(000’s)
Zinc
(%)
Zinc
(tonnes)
Tonnes
(000’s)
Lead
(%)
Lead
(tonnes)
Proven & Probable
Reserves
Northern Business 22,979 0.30 67,915 18,220 0.81 147,927 18,220 0.04 7,500
Southern Business
Total 22,979 0.30 67,915 18,220 0.81 147,927 18,220 0.04 7,500
Measured & Indicated
Resources
Northern Business 14,073 0.29 41,449 6,842 0.82 55,838 6,842 0.07 4,895
Southern Business
Total 14,073 0.29 41,449 6,842 0.82 55,838 6,842 0.07 4,895
Inferred Resources
Northern Business 12,592 0.29 35,918 9,142 0.90 82,396 9,142 0.06 5,782
Southern Business 19,658 0.19 36,451
Total 32,250 0.22 72,369 9,142 0.90 82,396 9,142 0.06 5,782
See AEM February 10, 2016 press release for detailed breakdown of reserves and resources. Reserves are not a subset of resources

AGNICO EAGLE | FOURTH QUARTER AND FULL YEAR 2015 RESULTS | 36
Mineral Reserves and Resources by ProjectDecember 31, 2015
Northern Business Gold
Tonnes (Mt) Gold (g/t) Gold (Moz)
LaRonde mine
Proven Reserves 3.5 4.1 0.5
Probable Reserves 14.8 5.6 2.7
Indicated Resource 6.8 3.5 0.8
Inferred Resource 9.1 4.3 1.3
Meadowbank mine
Proven Reserves 1.2 1.5 0.1
Probable Reserves 9.6 2.9 0.9
Measured & Indicated Resource 7.0 3.2 0.7
Inferred Resource 3.4 4.0 0.4
Amaruq Project
Inferred Resource 16.9 6.1 3.3
Canadian Malartic mine (50% Interest)
Proven Reserves 27.4 1.0 0.9
Probable Reserves 83.3 1.1 3.0
Measured & Indicated Resource (Undiluted), excluding
reserves12.8 1.5 0.6
Inferred Resource 4.5 1.5 0.2
Meliadine project
Proven Reserves 0.03 7.3 0.01
Probable Reserves 14.5 7.3 3.4
Indicated Resource 20.8 5.0 3.3
Inferred Resource 14.7 7.5 3.6
Kittila mine
Proven Reserves 1.1 4.3 0.1
Probable Reserves 27.1 4.8 4.2
Measured & Indicated Resource 15.9 3.0 1.5
Inferred Resource 11.8 4.6 1.8
Goldex mine
Proven Reserves 0.3 1.5 0.02
Probable Reserves 12.6 1.6 0.7
Measured & Indicated Resource 34.4 1.9 2.1
Inferred Resource 24.6 1.5 1.2
Lapa mine
Proven Reserves 0.4 5.5 0.1
Measured & Indicated Resource 1.1 4.3 0.2
Inferred Resource 1.4 6.5 0.3
Southern Business Gold
Tonnes (Mt) Gold (g/t) Gold (Moz)
Pinos Altos mine
Proven Reserves 2.8 3.1 0.3
Probable Reserves 13.0 2.8 1.2
Indicated Resource 11.1 1.8 0.7
Inferred Resource 12.6 1.3 0.5
Creston Mascota mine
Proven Reserves 0.2 0.7 0.004
Probable Reserves 4.0 1.3 0.2
Indicated Resource 4.3 0.5 0.1
Inferred Resource 4.3 1.1 0.1
La India mine
Proven Reserves 0.2 0.7 0.01
Probable Reserves 29.7 0.9 0.9
Measured & Indicated Resource 70.3 0.4 0.8
Inferred Resource 90.9 0.4 1.1
El Barqueño Project
Inferred Resource 19.7 1.0 0.6
See AEM February 10, 2016 press release for detailed breakdown of reserves and resources.
Reserves are not a subset of resources

AGNICO EAGLE | FOURTH QUARTER AND FULL YEAR 2015 RESULTS | 37
Notes to Investors Regarding
The Use of Mineral ResourcesCautionary Note to Investors Concerning Estimates of Measured and Indicated Mineral Resources
This document uses the terms “measured mineral resources” and “indicated mineral resources”. Investors are advised that while those terms are recognized and required by Canadian
regulations, the SEC does not recognize them. Investors are cautioned not to assume that any part or all of mineral deposits in these categories will ever be converted into
mineral reserves.
Cautionary Note to Investors Concerning Estimates of Inferred Mineral Resources
This document also uses the term “inferred mineral resources”. Investors are advised that while this term is recognized and required by Canadian regulations, the SEC does not
recognize it. “Inferred mineral resources” have a great amount of uncertainty as to their existence, and great uncertainty as to their economic and legal feasibility. It cannot be
assumed that all or any part of an inferred mineral resource will ever be upgraded to a higher category. Under Canadian rules, estimates of inferred mineral resources may not form
the basis of feasibility or pre-feasibility studies, except in rare cases. Investors are cautioned not to assume that part or all of an inferred mineral resource exists, or is
economically or legally mineable.
Scientific and Technical Data
Cautionary Note To U.S. Investors - The SEC permits U.S. mining companies, in their filings with the SEC, to disclose only those mineral deposits that a company can economically
and legally extract or produce. Agnico Eagle reports mineral resource and mineral reserve estimates in accordance with the Canadian Institute of Mining, Metallurgy and Petroleum
Best Practice Guidelines for Exploration and for Estimation of Mineral Resources and Mineral Reserves in accordance with the Canadian securities regulatory authorities' (the "CSA")
National Instrument 43-101 Standards of Disclosure for Mineral Projects ("NI 43-101"). These standards are similar to those used by the SEC’s Industry Guide No. 7, as interpreted by
Staff at the SEC ("Guide 7"). However, the definitions in NI 43-101 differ in certain respects from those under Guide 7. Accordingly, mineral reserve information contained herein may
not be comparable to similar information disclosed by U.S. companies. Under the requirements of the SEC, mineralization may not be classified as a "mineral reserve" unless the
determination has been made that the mineralization could be economically and legally produced or extracted at the time the mineral reserve determination is made. A "final" or
"bankable" feasibility study is required to meet the requirements to designate mineral reserves under Industry Guide 7. Agnico Eagle uses certain terms in this presentation, such as
"measured", "indicated", and "inferred", and "resources" that the SEC guidelines strictly prohibit U.S. registered companies from including in their filings with the SEC.
In prior periods, mineral reserves for all properties were typically estimated using historic three-year average metals prices and foreign exchange rates in accordance with the SEC
guidelines. These guidelines require the use of prices that reflect current economic conditions at the time of mineral reserve determination, which the Staff of the SEC has interpreted
to mean historic three-year average prices. Given the current lower commodity price environment, Agnico Eagle has decided to use price assumptions that are below the three-year
averages. The assumptions used for the mineral reserve estimates at all mines and advanced projects as of December 31, 2015 (other than the Canadian Malartic mine), reported by
the Company on February 10, 2016, are $1,100 per ounce gold, $16.00 per ounce silver, $0.90 per pound zinc, $2.50 per pound copper, and US$/C$, Euro/US$ and US$/MXP
exchange rates for all mines and projects other than the Lapa, Meadowbank and Creston Mascota mines and Santo Niño open pit at Pinos Altos of 1.16, 1.20 and 14.00, respectively.
Due to shorter mine life, the assumptions used for the mineral reserve estimates at the short-life mines (the Lapa, Meadowbank and Creston Mascota mines and Santo Niño open pit)
as of December 31, 2015, reported by the Company on February 10, 2016, include the same metal price assumptions, and US$/C$ and US$/MXP exchange rates of 1.30 and 16.00,
respectively. The assumptions used for the mineral reserves estimate at the Canadian Malartic mine as of December 31, 2015, reported by the Company on February 10, 2016, are
$1,150 per ounce gold, a cut-off grade between 0.30 g/t and 0.33 g/t gold (depending on the deposit) and a US$/C$ exchange rate of 1.24.
NI 43-101 requires mining companies to disclose mineral reserves and mineral resources using the subcategories of "proven mineral reserves”, "probable mineral reserves”, "measured
mineral resources”, "indicated mineral resources” and "inferred mineral resources”. Mineral resources that are not mineral reserves do not have demonstrated economic viability.

AGNICO EAGLE | FOURTH QUARTER AND FULL YEAR 2015 RESULTS | 38
Notes to Investors Regarding
The Use of Mineral ResourcesA mineral reserve is the economically mineable part of a measured and/or indicated mineral resource. It includes diluting materials and allowances for losses, which may occur when
the material is mined or extracted and is defined by studies at pre-feasibility or feasibility level as appropriate that include application of modifying factors. Such studies demonstrate
that, at the time of reporting, extraction could reasonably be justified.
Modifying factors are considerations used to convert mineral resources to mineral reserves. These include, but are not restricted to, mining, processing, metallurgical, infrastructure,
economic, marketing, legal, environmental, social and governmental factors.
A proven mineral reserve is the economically mineable part of a measured mineral resource. A proven mineral reserve implies a high degree of confidence in the modifying factors. A
probable mineral reserve is the economically mineable part of an indicated and, in some circumstances, a measured mineral resource. The confidence in the modifying factors
applying to a probable mineral reserve is lower than that applying to a proven mineral reserve.
A mineral resource is a concentration or occurrence of solid material of economic interest in or on the Earth's crust in such form, grade or quality and quantity that there are reasonable
prospects for eventual economic extraction. The location, quantity, grade or quality, continuity and other geological characteristics of a mineral resource are known, estimated or
interpreted from specific geological evidence and knowledge, including sampling.
A measured mineral resource is that part of a mineral resource for which quantity, grade or quality, densities, shape and physical characteristics are estimated with confidence
sufficient to allow the application of modifying factors to support detailed mine planning and final evaluation of the economic viability of the deposit. Geological evidence is derived from
detailed and reliable exploration, sampling and testing and is sufficient to confirm geological and grade or quality continuity between points of observation. An indicated mineral
resource is that part of a mineral resource for which quantity, grade or quality, densities, shape and physical characteristics are estimated with sufficient confidence to allow the
application of modifying factors in sufficient detail to support mine planning and evaluation of the economic viability of the deposit. Geological evidence is derived from adequately
detailed and reliable exploration, sampling and testing and is sufficient to assume geological and grade or quality continuity between points of observation. An inferred mineral
resource is that part of a mineral resource for which quantity and grade or quality are estimated on the basis of limited geological evidence and sampling. Geological evidence is
sufficient to imply but not verify geological and grade or quality continuity.
Investors are cautioned not to assume that part or all of an inferred mineral resource exists, or is economically or legally mineable.
A feasibility study is a comprehensive technical and economic study of the selected development option for a mineral project that includes appropriately detailed assessments of
applicable modifying factors together with any other relevant operational factors and detailed financial analysis that are necessary to demonstrate, at the time of reporting, that
extraction is reasonably justified (economically mineable). The results of the study may reasonably serve as the basis for a final decision by a proponent or financial institution to
proceed with, or finance, the development of the project. The confidence level of the study will be higher than that of a Pre-Feasibility Study.
The effective date for all of the Company's mineral resource and mineral reserve estimates in this presentation is December 31, 2015. Additional information about each of the mineral
projects that is required by NI 43-101, sections 3.2 and 3.3 and paragraphs 3.4 (a), (c) and (d) can be found in the Technical Reports filed by Agnico Eagle, which may be found at
www.sedar.com. Other important operating information can be found in the Company's AIF and Form 40-F.
The scientific and technical information relating to Agnico Eagle’s mineral reserves and mineral resources contained herein (other than the Canadian Malartic mine) has been approved
by Daniel Doucet, Eng., Senior Corporate Director, Reserve Development; and relating to mineral reserves and mineral resources at the Canadian Malartic mine contained herein has
been approved by Donald Gervais, P.Geo., Director of Technical Services at Canadian Malartic Corporation. Each of them is a "Qualified Person" for the purposes of NI 43-101.

Trading Symbol:
AEM on TSX & NYSE
Investor Relations:
416-947-1212
agnicoeagle.com