air quality reanalysis - harvard...
TRANSCRIPT
1
Air Quality Reanalysis (Translating research to service)
AQAST-8 Dec 2-4, 2014, Atlanta, GA
Greg Carmichael1, David Edwards2, Yongtao Hu3, Edward Hyer4, Hyuncheol Kim5, Pius Lee5, Yang Liu6, Dick McNider7, Talat Odman3, Li Pan5, Brad Pierce8,
Arastoo Pour Biazar7, Ted Russell3, Rick Saylor9, Scott Spak1, Youhua Tang5, Daniel Tong5
1 College of Engineering, University of Iowa, Iowa City, IA 2 Corporation for Atmospheric Research, Boulder, CO
3School of Civil and Environmental Engr., Georgia Institute of Technology, Atlanta, GA 4Naval Research Laboratory, Monterey, CA
5Air Resources Lab., NOAA Center for Weather and Climate Prediction, College Park, MD
6Department of Environmental Health, Emory University, Atlanta, GA 7Department of Atmospheric Science, University Alabama, Huntsville AL
8National Environmental Satellite and Information Service (NESDIS), Madison, WI 9Air Resources Lab., NOAA, Oak Ridge, TN
2
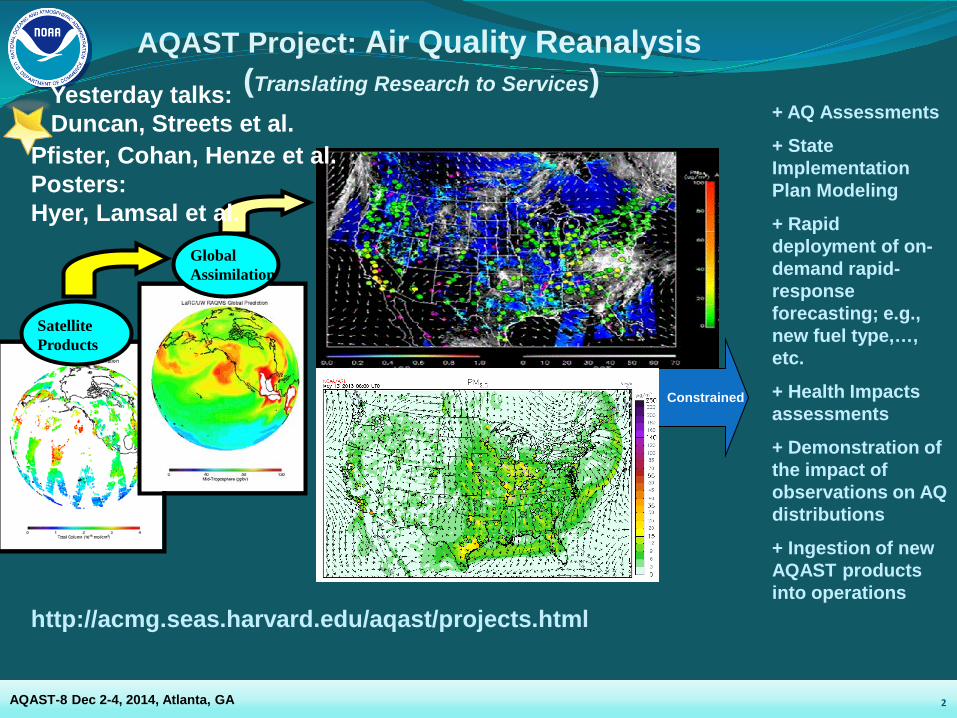
Constrained
Satellite Products
Global Assimilation
+ AQ Assessments
+ State Implementation Plan Modeling
+ Rapid deployment of on-demand rapid-response forecasting; e.g., new fuel type,…, etc.
+ Health Impacts assessments
+ Demonstration of the impact of observations on AQ distributions
+ Ingestion of new AQAST products into operations
http://acmg.seas.harvard.edu/aqast/projects.html
AQAST Project: Air Quality Reanalysis (Translating Research to Services)
Yesterday talks: Duncan, Streets et al.
Pfister, Cohan, Henze et al. Posters: Hyer, Lamsal et al.
AQAST-8 Dec 2-4, 2014, Atlanta, GA
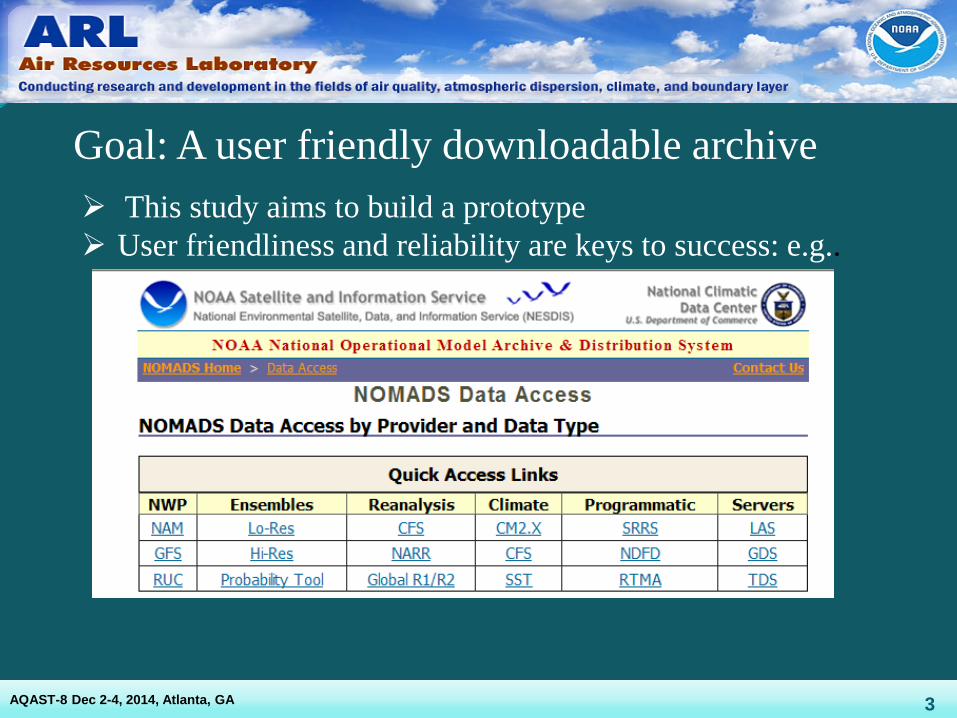
This study aims to build a prototype User friendliness and reliability are keys to success: e.g..
Goal: A user friendly downloadable archive
3 AQAST-8 Dec 2-4, 2014, Atlanta, GA
4
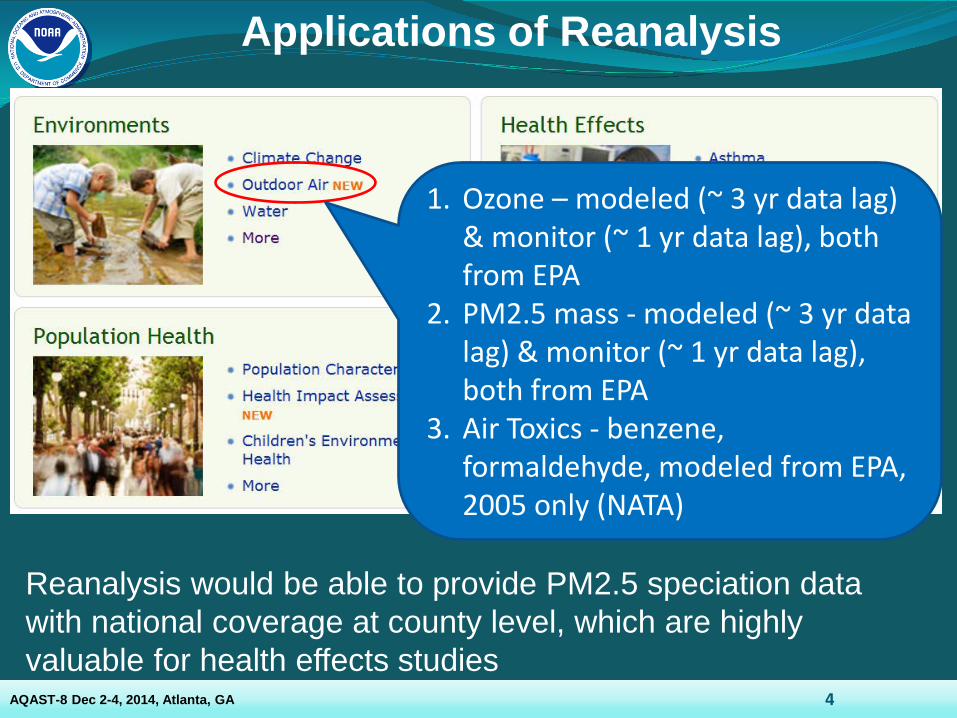
Applications of Reanalysis
1. Ozone – modeled (~ 3 yr data lag) & monitor (~ 1 yr data lag), both from EPA
2. PM2.5 mass - modeled (~ 3 yr data lag) & monitor (~ 1 yr data lag), both from EPA
3. Air Toxics - benzene, formaldehyde, modeled from EPA, 2005 only (NATA)
Reanalysis would be able to provide PM2.5 speciation data with national coverage at county level, which are highly valuable for health effects studies
AQAST-8 Dec 2-4, 2014, Atlanta, GA
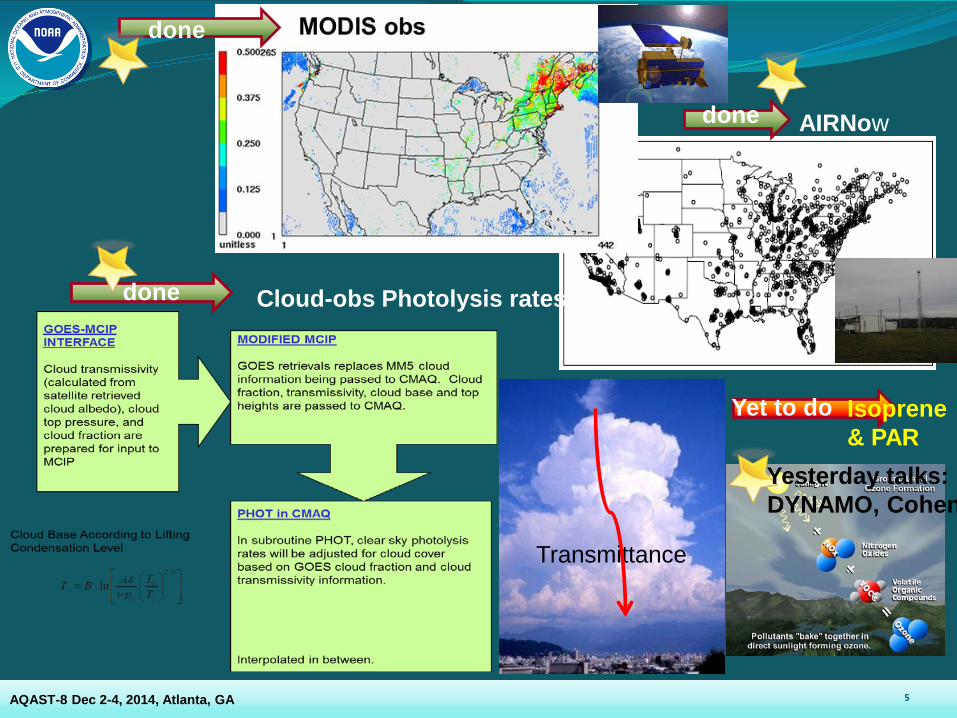
5
Transmittance
AIRNow
Cloud-obs Photolysis rates
Isoprene & PAR
done
done
done
Yet to do
AQAST-8 Dec 2-4, 2014, Atlanta, GA
Yesterday talks: DYNAMO, Cohen
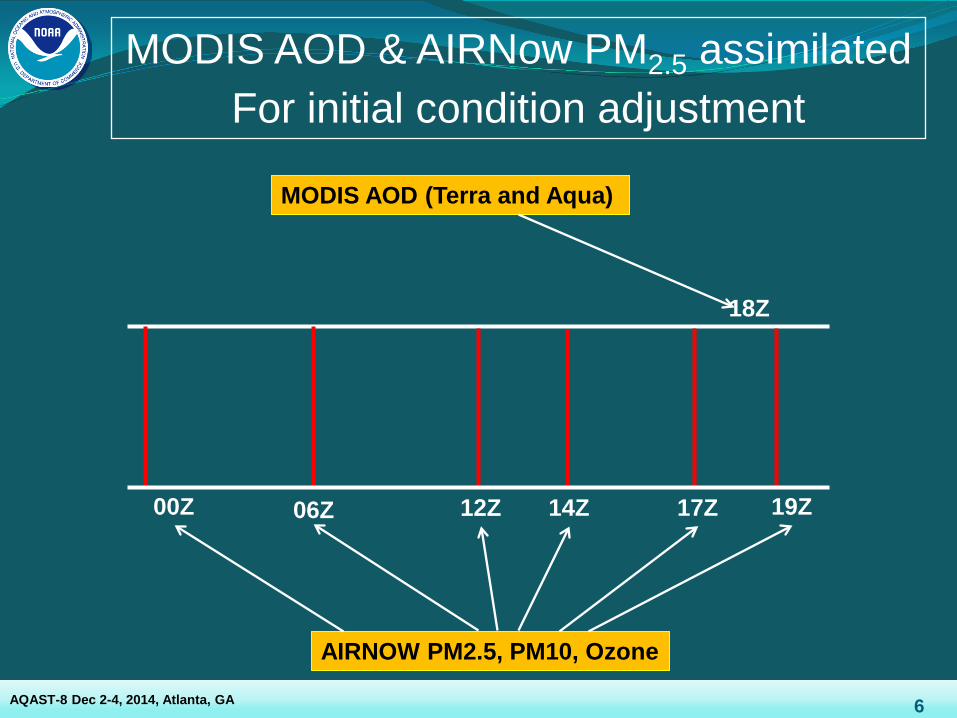
MODIS AOD & AIRNow PM2.5 assimilated For initial condition adjustment
6
00Z 06Z 12Z 19Z
AIRNOW PM2.5, PM10, Ozone
MODIS AOD (Terra and Aqua)
14Z 17Z
18Z
AQAST-8 Dec 2-4, 2014, Atlanta, GA
7
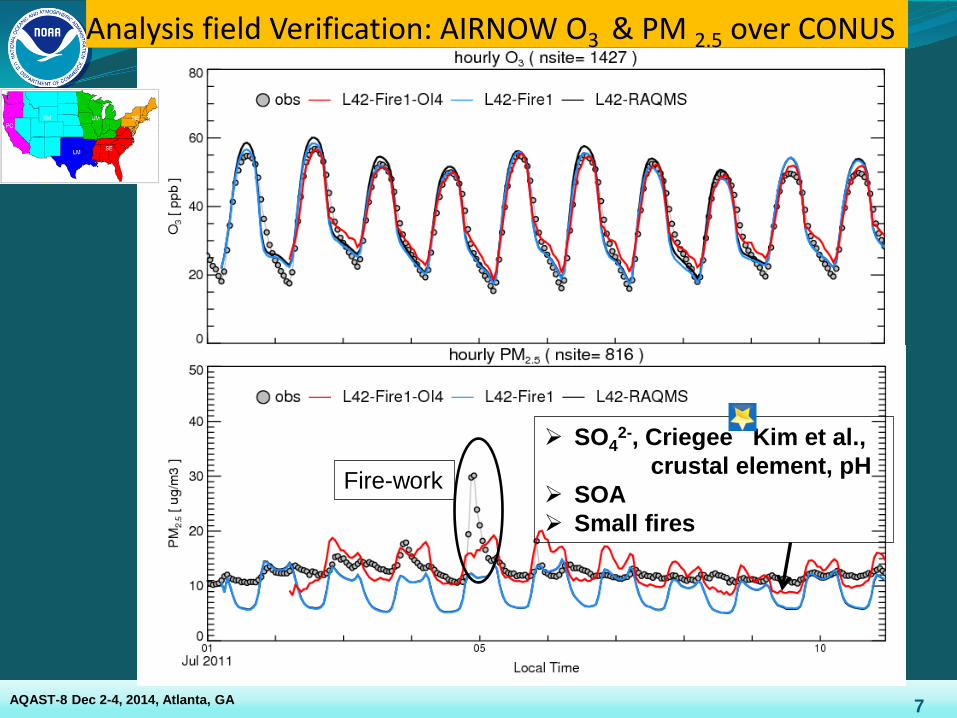
Analysis field Verification: AIRNOW O3 & PM 2.5 over CONUS
AQAST-8 Dec 2-4, 2014, Atlanta, GA
Fire-work
SO42-, Criegee Kim et al.,
crustal element, pH SOA Small fires
8
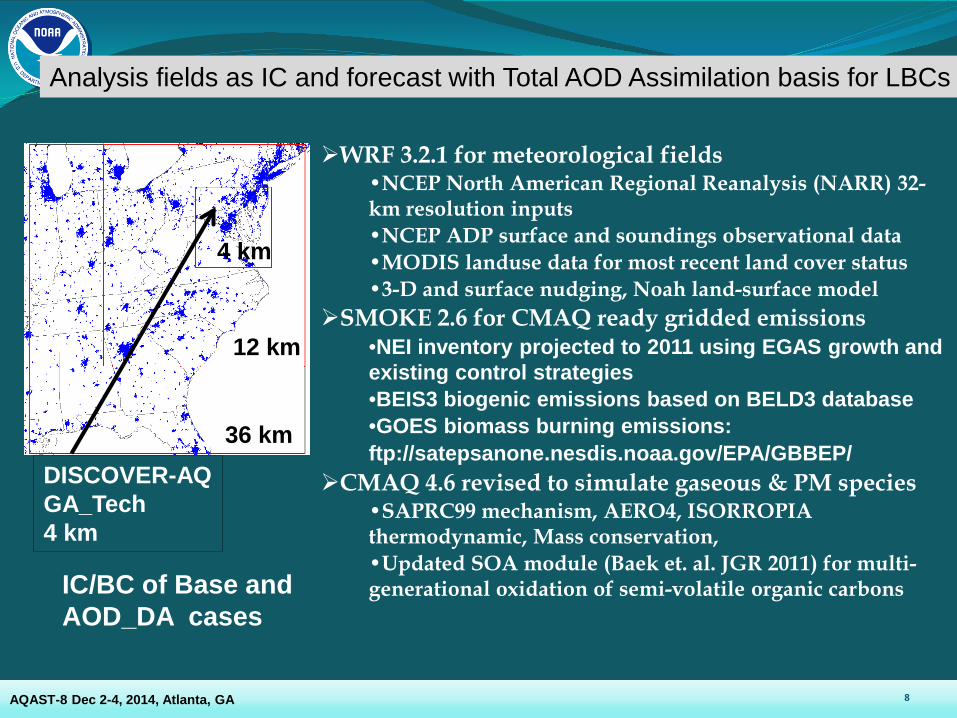
WRF 3.2.1 for meteorological fields •NCEP North American Regional Reanalysis (NARR) 32-km resolution inputs •NCEP ADP surface and soundings observational data •MODIS landuse data for most recent land cover status •3-D and surface nudging, Noah land-surface model
SMOKE 2.6 for CMAQ ready gridded emissions •NEI inventory projected to 2011 using EGAS growth and existing control strategies •BEIS3 biogenic emissions based on BELD3 database •GOES biomass burning emissions: ftp://satepsanone.nesdis.noaa.gov/EPA/GBBEP/
CMAQ 4.6 revised to simulate gaseous & PM species •SAPRC99 mechanism, AERO4, ISORROPIA thermodynamic, Mass conservation, •Updated SOA module (Baek et. al. JGR 2011) for multi-generational oxidation of semi-volatile organic carbons
Analysis fields as IC and forecast with Total AOD Assimilation basis for LBCs
12 km
36 km
4 km
IC/BC of Base and AOD_DA cases
DISCOVER-AQ GA_Tech 4 km
AQAST-8 Dec 2-4, 2014, Atlanta, GA
9
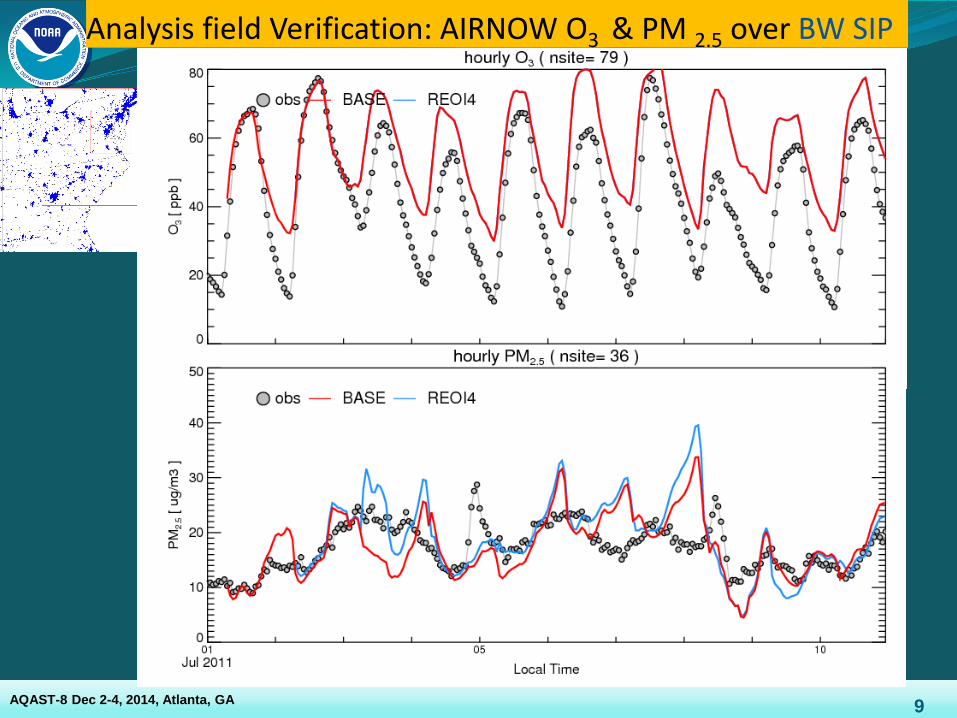
Analysis field Verification: AIRNOW O3 & PM 2.5 over BW SIP
AQAST-8 Dec 2-4, 2014, Atlanta, GA
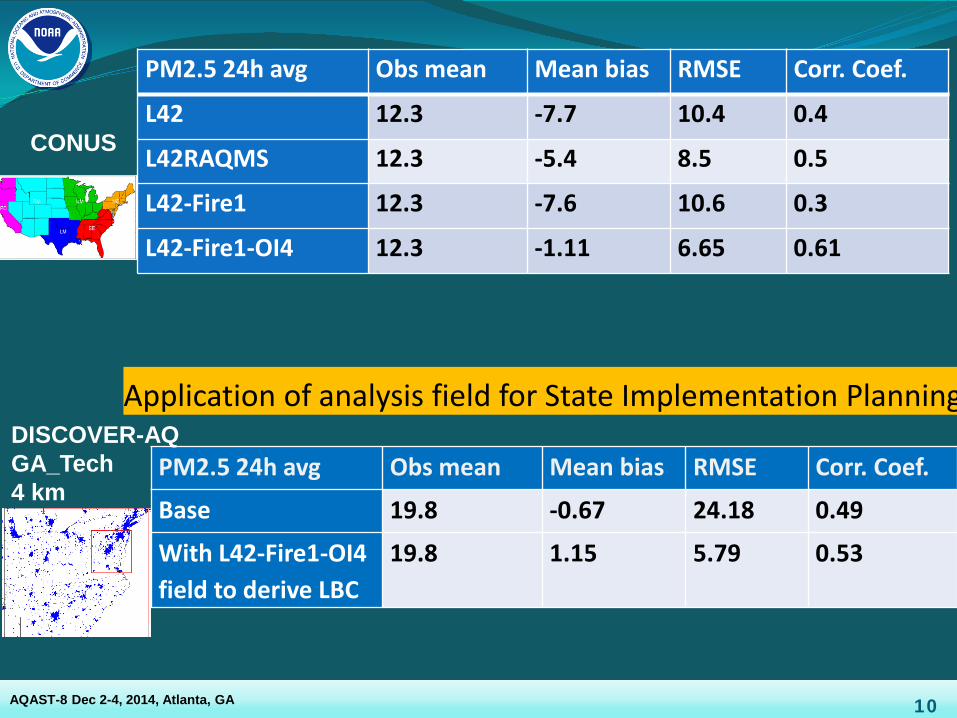
PM2.5 24h avg Obs mean Mean bias RMSE Corr. Coef.
L42 12.3 -7.7 10.4 0.4
L42RAQMS 12.3 -5.4 8.5 0.5
L42-Fire1 12.3 -7.6 10.6 0.3
L42-Fire1-OI4 12.3 -1.11 6.65 0.61
CONUS
PM2.5 24h avg Obs mean Mean bias RMSE Corr. Coef. Base 19.8 -0.67 24.18 0.49 With L42-Fire1-OI4 field to derive LBC
19.8 1.15 5.79 0.53
10
DISCOVER-AQ GA_Tech 4 km
Application of analysis field for State Implementation Planning
AQAST-8 Dec 2-4, 2014, Atlanta, GA
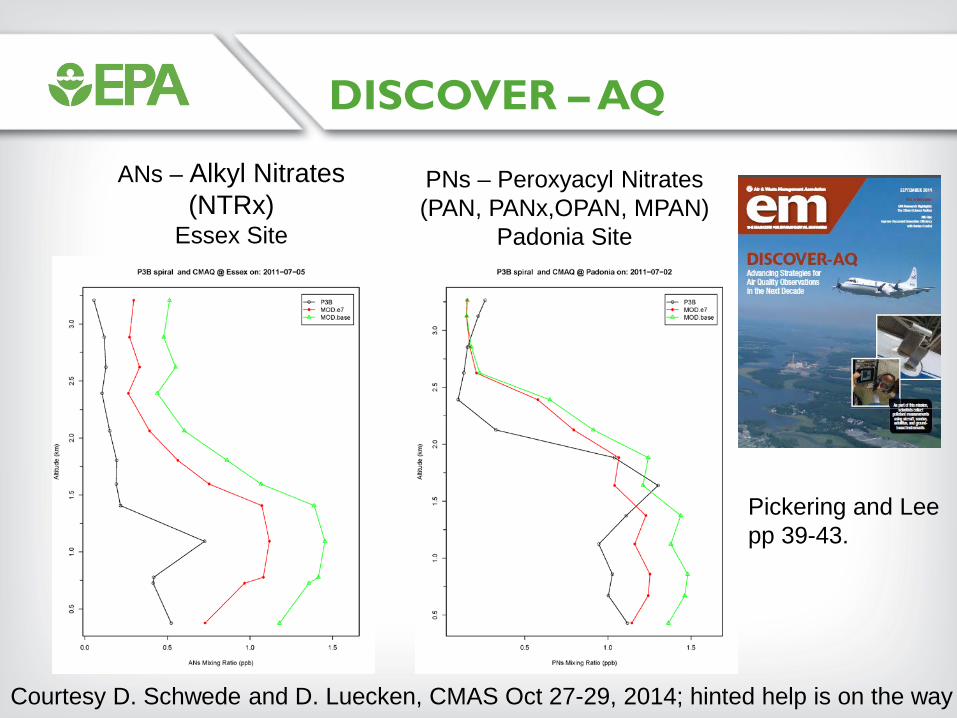
DISCOVER – AQ
ANs – Alkyl Nitrates (NTRx)
Essex Site
PNs – Peroxyacyl Nitrates (PAN, PANx,OPAN, MPAN)
Padonia Site
Courtesy D. Schwede and D. Luecken, CMAS Oct 27-29, 2014; hinted help is on the way
Pickering and Lee pp 39-43.
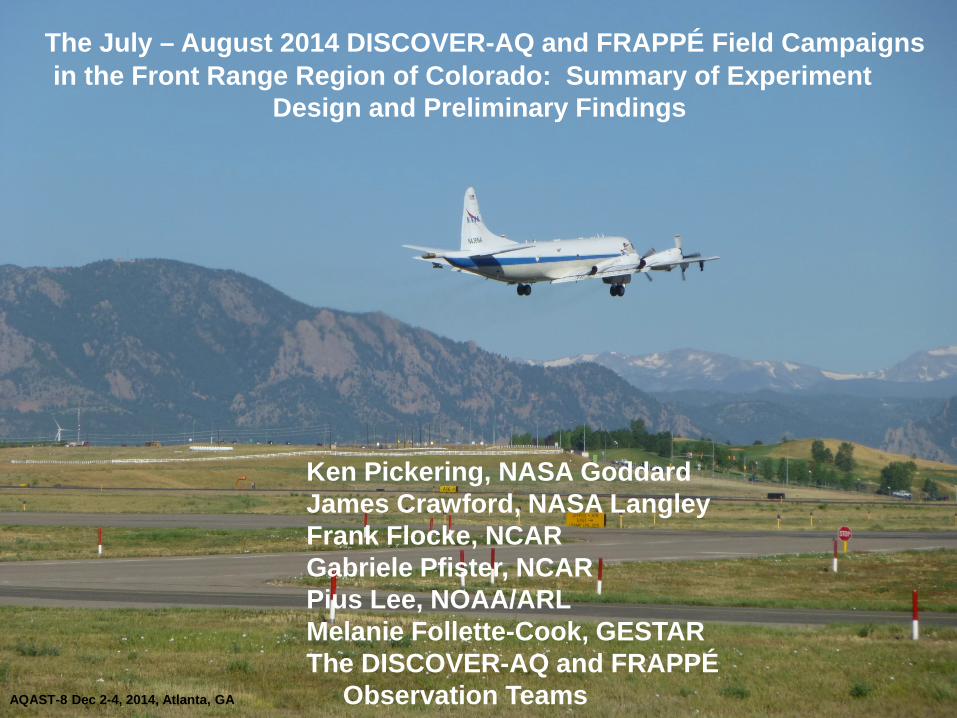
The July – August 2014 DISCOVER-AQ and FRAPPÉ Field Campaigns in the Front Range Region of Colorado: Summary of Experiment Design and Preliminary Findings
Ken Pickering, NASA Goddard James Crawford, NASA Langley Frank Flocke, NCAR Gabriele Pfister, NCAR Pius Lee, NOAA/ARL Melanie Follette-Cook, GESTAR The DISCOVER-AQ and FRAPPÉ Observation Teams AQAST-8 Dec 2-4, 2014, Atlanta, GA
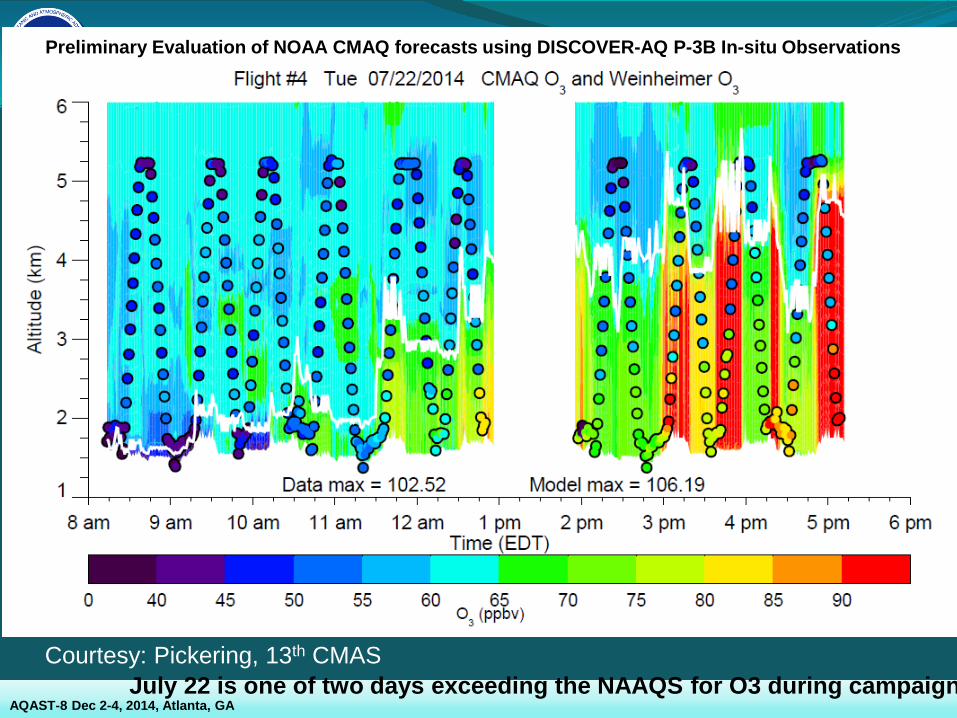
Preliminary Evaluation of NOAA CMAQ forecasts using DISCOVER-AQ P-3B In-situ Observations
July 22 is one of two days exceeding the NAAQS for O3 during campaign Courtesy: Pickering, 13th CMAS
AQAST-8 Dec 2-4, 2014, Atlanta, GA
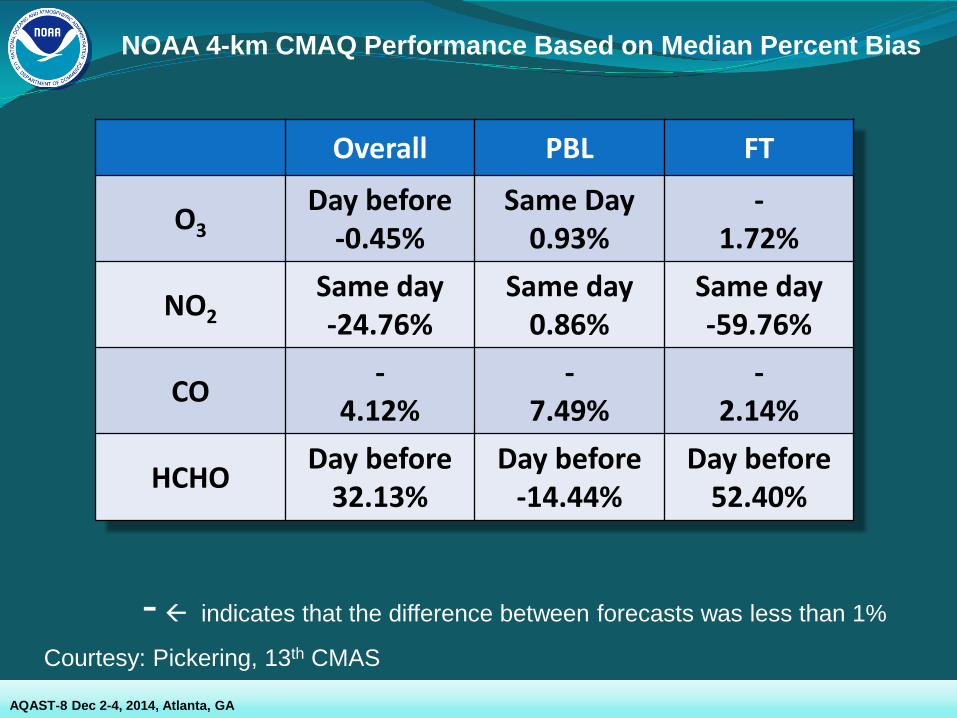
Overall PBL FT
O3 Day before
-0.45% Same Day
0.93% -
1.72%
NO2 Same day -24.76%
Same day 0.86%
Same day -59.76%
CO - 4.12%
- 7.49%
- 2.14%
HCHO Day before 32.13%
Day before -14.44%
Day before 52.40%
- indicates that the difference between forecasts was less than 1%
NOAA 4-km CMAQ Performance Based on Median Percent Bias
Courtesy: Pickering, 13th CMAS
AQAST-8 Dec 2-4, 2014, Atlanta, GA
15
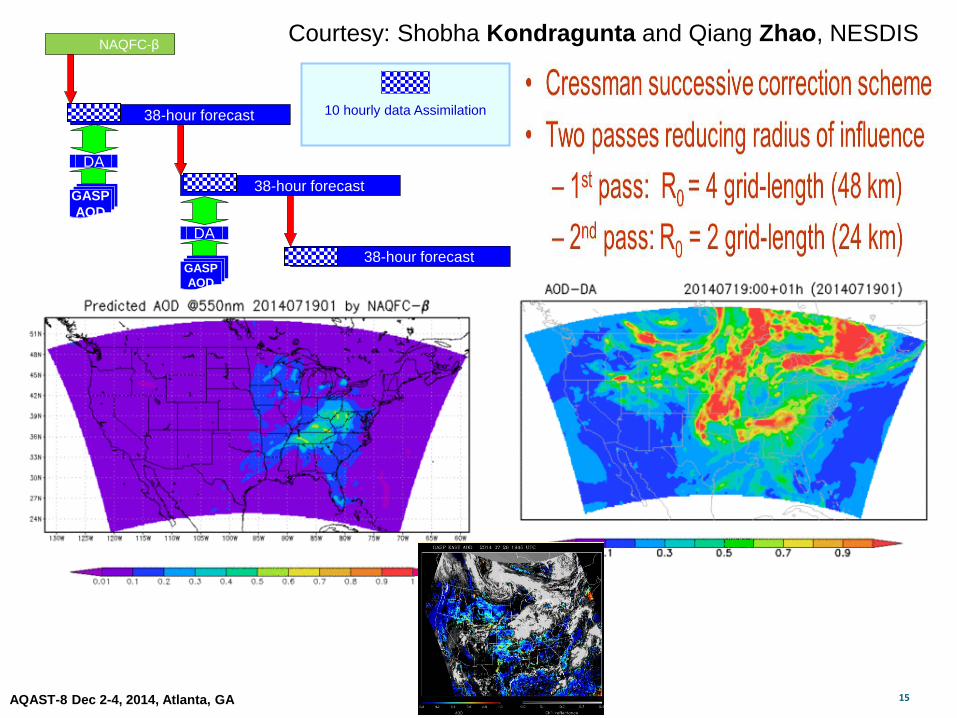
Courtesy: Shobha Kondragunta and Qiang Zhao, NESDIS NAQFC-β
38-hour forecast
38-hour forecastGASPAOD
38-hour forecast
DA
GASPAOD
DA
10 hourly data Assimilation
AQAST-8 Dec 2-4, 2014, Atlanta, GA
16
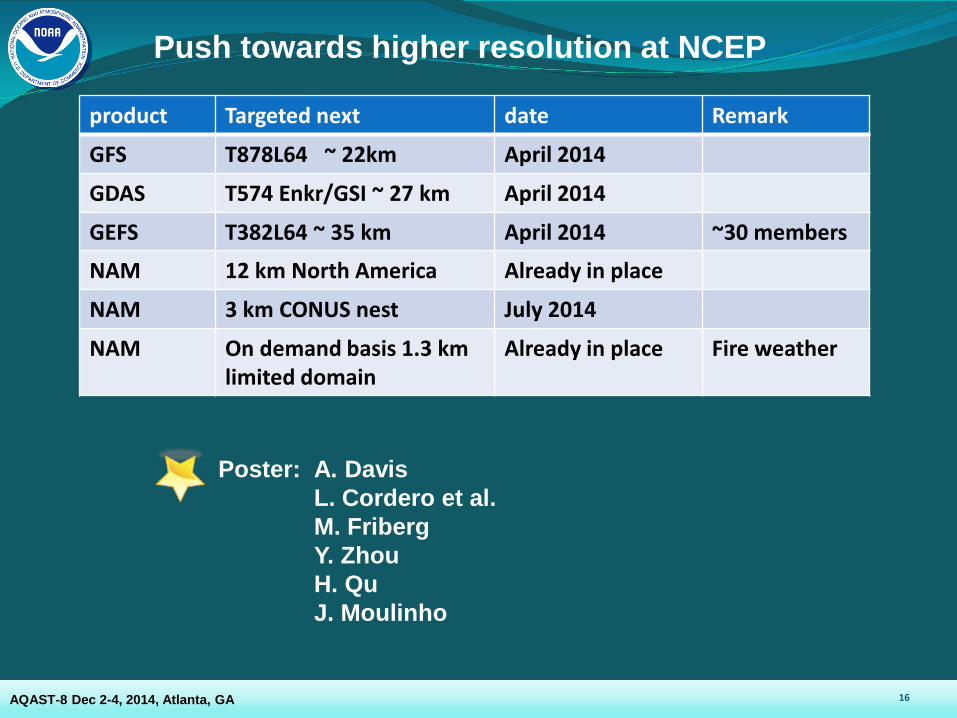
Push towards higher resolution at NCEP
product Targeted next date Remark
GFS T878L64 ~ 22km April 2014
GDAS T574 Enkr/GSI ~ 27 km April 2014
GEFS T382L64 ~ 35 km April 2014 ~30 members
NAM 12 km North America Already in place
NAM 3 km CONUS nest July 2014
NAM On demand basis 1.3 km limited domain
Already in place Fire weather
AQAST-8 Dec 2-4, 2014, Atlanta, GA
Poster: A. Davis L. Cordero et al. M. Friberg Y. Zhou H. Qu J. Moulinho
17
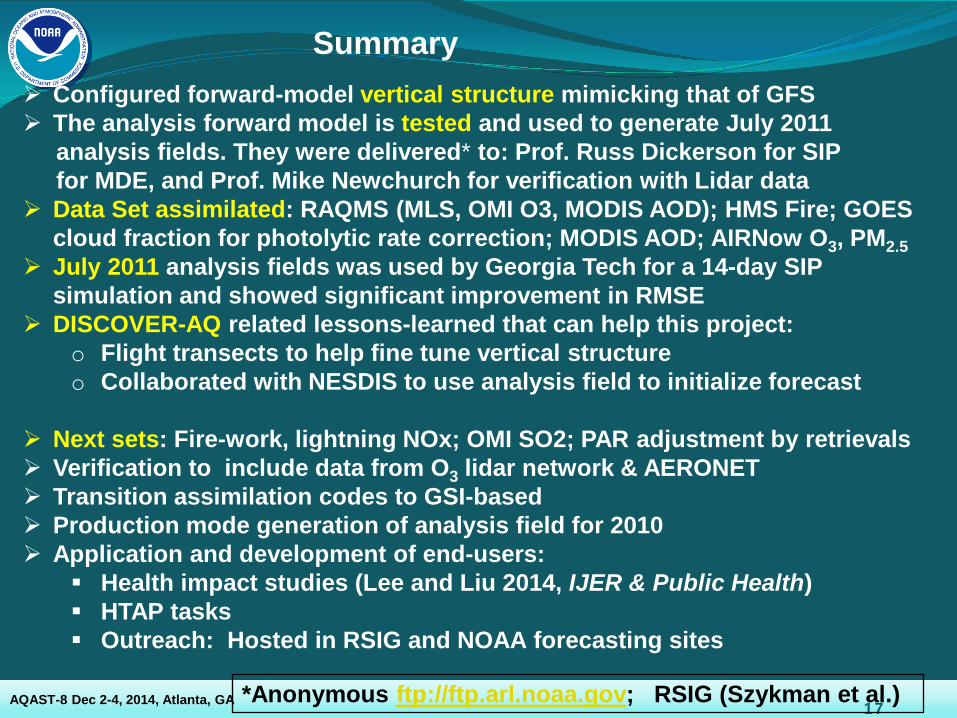
Configured forward-model vertical structure mimicking that of GFS The analysis forward model is tested and used to generate July 2011 analysis fields. They were delivered* to: Prof. Russ Dickerson for SIP for MDE, and Prof. Mike Newchurch for verification with Lidar data Data Set assimilated: RAQMS (MLS, OMI O3, MODIS AOD); HMS Fire; GOES
cloud fraction for photolytic rate correction; MODIS AOD; AIRNow O3, PM2.5 July 2011 analysis fields was used by Georgia Tech for a 14-day SIP
simulation and showed significant improvement in RMSE DISCOVER-AQ related lessons-learned that can help this project:
o Flight transects to help fine tune vertical structure o Collaborated with NESDIS to use analysis field to initialize forecast
Next sets: Fire-work, lightning NOx; OMI SO2; PAR adjustment by retrievals Verification to include data from O3 lidar network & AERONET Transition assimilation codes to GSI-based Production mode generation of analysis field for 2010 Application and development of end-users:
Health impact studies (Lee and Liu 2014, IJER & Public Health) HTAP tasks Outreach: Hosted in RSIG and NOAA forecasting sites
Summary
AQAST-8 Dec 2-4, 2014, Atlanta, GA *Anonymous ftp://ftp.arl.noaa.gov; RSIG (Szykman et al.)

18 18
EXTRA SLIDES
Contact: [email protected] http://www.arl.noaa.gov/
AQAST-8 Dec 2-4, 2014, Atlanta, GA
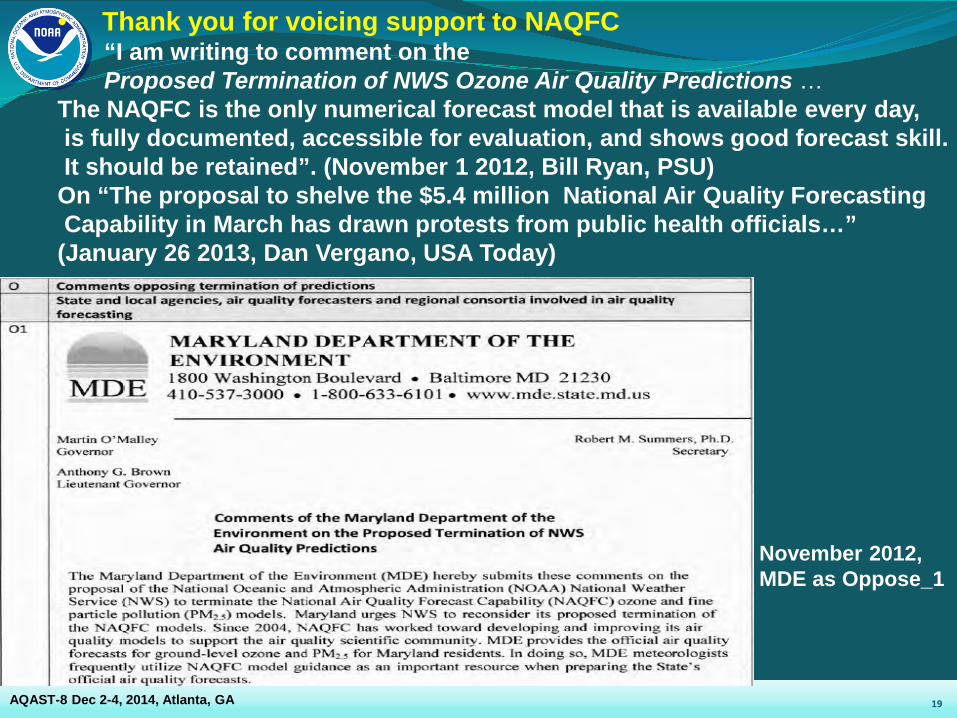
• Thank you for voicing support to NAQFC “I am writing to comment on the Proposed Termination of NWS Ozone Air Quality Predictions … The NAQFC is the only numerical forecast model that is available every day, is fully documented, accessible for evaluation, and shows good forecast skill. It should be retained”. (November 1 2012, Bill Ryan, PSU) On “The proposal to shelve the $5.4 million National Air Quality Forecasting Capability in March has drawn protests from public health officials…” (January 26 2013, Dan Vergano, USA Today)
19
November 2012, MDE as Oppose_1
AQAST-8 Dec 2-4, 2014, Atlanta, GA
20
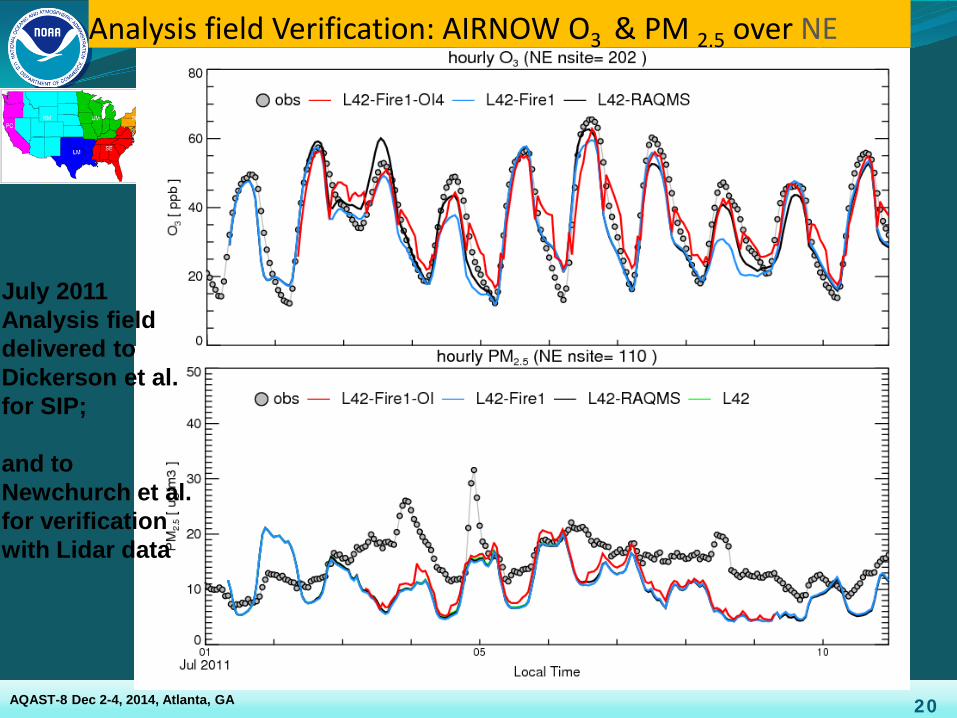
Analysis field Verification: AIRNOW O3 & PM 2.5 over NE
AQAST-8 Dec 2-4, 2014, Atlanta, GA
July 2011 Analysis field delivered to Dickerson et al. for SIP; and to Newchurch et al. for verification with Lidar data
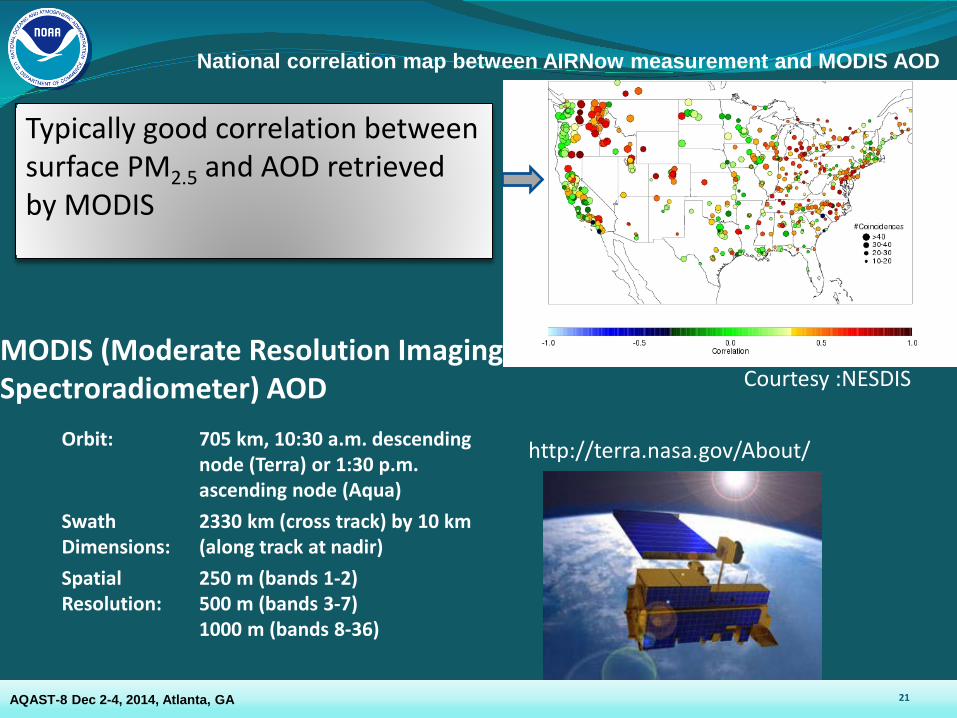
MODIS (Moderate Resolution Imaging Spectroradiometer) AOD
http://terra.nasa.gov/About/ Orbit: 705 km, 10:30 a.m. descending node (Terra) or 1:30 p.m. ascending node (Aqua)
Swath Dimensions:
2330 km (cross track) by 10 km (along track at nadir)
Spatial Resolution:
250 m (bands 1-2) 500 m (bands 3-7) 1000 m (bands 8-36)
Courtesy :NESDIS
21
National correlation map between AIRNow measurement and MODIS AOD
Typically good correlation between surface PM2.5 and AOD retrieved by MODIS
AQAST-8 Dec 2-4, 2014, Atlanta, GA
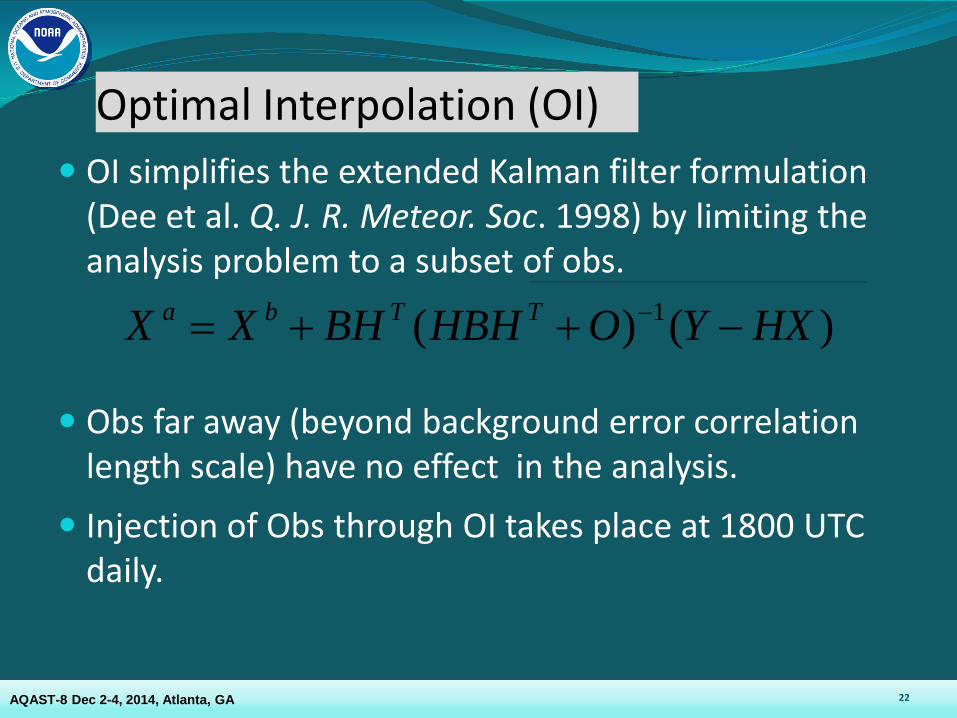
Optimal Interpolation (OI) OI simplifies the extended Kalman filter formulation
(Dee et al. Q. J. R. Meteor. Soc. 1998) by limiting the analysis problem to a subset of obs.
Obs far away (beyond background error correlation
length scale) have no effect in the analysis.
Injection of Obs through OI takes place at 1800 UTC daily.
)()( 1 HXYOHBHBHXX TTba −++= −
22 AQAST-8 Dec 2-4, 2014, Atlanta, GA