agta presentation accessible vehicle operations. supershuttle today 19 operations serving 28...
TRANSCRIPT

AGTA PresentationAccessible Vehicle Operations

SuperShuttle Today
• 19 Operations serving 28 airportsoM&M – Spring of 2007o Kansas City – Summer of 2007o San Diego – Fall of 2007oOntario – Fall of 2007oNashville – Winter of 2007
• Operates over 1500 vehicles

Improvements
•Moved rez center from Phoenix to Tempe and expanded from 65 to 100 stations
oPurchased new phone switch to handle increased traffic and add flexibilityoAbility to add an additional 30 stations

Improvements (continued)
• Expanded Tampa reservation center from 30 to 90 stationso Ability to add 30 additional stations
• Kiosk technology in Baltimore, Washington & Kansas City

Experience in Serving the Physically Challenged
• Provided accessible service since 1984• Each SuperShuttle city operates accessible equipment• Currently have approximately 60 accessible
vehicles in our nationwide fleet• Accepted and provided service to over 12,000
ADA passengers in past year

Department of Justice
• Department of Justice conducted an ADA compliance review in 2001 and 2002• SuperShuttle was found to be materially in compliance with the Americans with Disabilities Act, however recommendations were made:oA minimum of 2 ADA vehicles per locationoBetter data collection process tracking service standardsoQuarterly reporting for 24 months

3.0
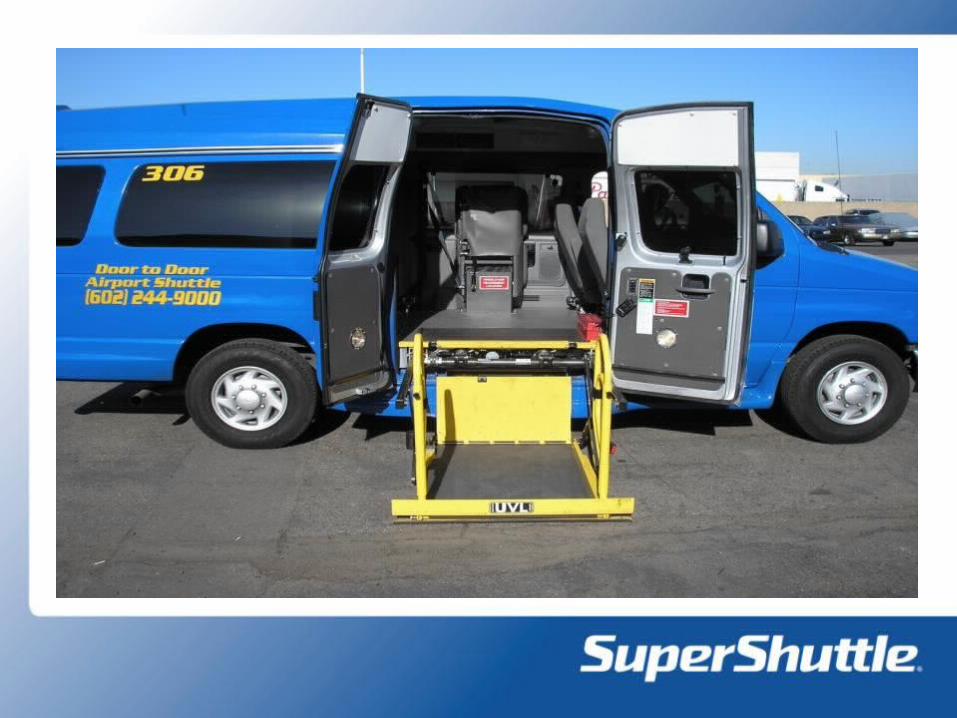
Type of Equipment
•Primarily use Ford E-350•Lift made by Braun Corporation•Conversion made by Braun Corporation•In floor storage system•High reliability


Cost and Process of ADA Conversions
• Ship vehicle to conversion site
• Conversion takes anywhere from 6-12 weeks
• Conversion cost $21,000
• Ship vehicle to city location

SuperShuttle InternationalVehicle Inventory
City Vehicles
Accessible Vehicles % of fleet
Austin 30 2 6.67%Nashville 20 2 10.00%Burbank 70 3 4.28%Baltimore 80 3 3.75%Washington 125 4 3.20%Dallas 80 2 2.50%Denver 75 2 2.67%Houston 60 2 3.33%KC 30 2 6.67%LA 215 6 2.79%Minneapolis 35 4 11.42%NYC 125 4 3.20%Ontario 80 4 5.00%Phoenix 105 6 5.71%San Diego 75 2 2.67%San Francisco 105 4 3.81%Sacramento 45 3 6.67%Tampa 60 2 3.33%Total 1,415 57 4.02%

SuperShuttle InternationalReservation Breakdown
City
Total
Res. ADA Res % ADAAustin 7,609 12 0.16%Nashville 1,054 1 0.09%Burbank 10,020 26 0.26%Baltimore 16,164 47 0.29%Washington 21,419 78 0.36%Dallas 17,687 45 0.25%Denver 13,929 34 0.24%Houston 11,165 20 0.18%Kansas City 4,870 1 0.02%Los Angeles 46,211 175 0.38%Minneapolis 5,183 91 1.76%NYC 28,313 56 0.20%Ontario 10,411 47 0.45%Phoenix 35,466 129 0.36%San Diego 13,504 101 0.75%San Francisco 28,311 49 0.17%Sacramento 7,648 54 0.71%Tampa 17,977 65 0.36%
Total 296,941 1,031
0.35%

Recommendations• All transportation providers should be required to have
ADA equipment in their fleet• Extend service life of ADA equipment beyond the normal
mandated airport replacement schedule • Providers should have signed sub contract agreements
with paratransit service companies in the event service requests exceed vehicle inventory
• Do not require providers to have a larger inventory of ADA vehicles than their demand dictateso Large financial impacto Lower utilization