afdb · pdf fileintroduced in 1976, the certificate of indigence provided access to free...
TRANSCRIPT
AfDB
A f r i c a n D e v e l o p m e n t B a n k
Procedures for the Direct Targetingof Poverty and Human Developmentin Morocco
2016www.afdb.org
W o r k i n g P a p e rRegional Department for North Africa
Key Messages
• Low income is not the only challenge facing vulnerable households in Morocco. It is also
necessary: (1) to consider their housing and living conditions; (2) to determine whether they
have sufficient capacity to generate decent income; and (3) to consider the ratio of non-
active individuals in each household (children, the elderly or the disabled who cannot work)
to active adults.
• To address this precariousness which especially affects certain geographic area, Morocco's
National Human Development Initiative (INDH) has, since 2005, helped to correct some of
these distortions through the geographic targeting of certain urban and rural localities considered
to be the most disadvantaged. It has helped to achieve significant progress towards improving
the population's living conditions.
• The direct targeting procedure adopted by the INDH does not fully identify the end beneficiaries.
Consequently, social assistance programmes limited to geographic targeting experience
problems of effective targeting, and their impact on the living conditions of the poor and
vulnerable population does not always match the resources committed.
• The aim of the approach presented is to identify, based on the existing context, a series of
easily observable and objectively verifiable indicators that are summarized in a new score that
will identify households with lowest standards of living and suffering the most deprivations.
The New Index allows to target (96%) of the most vulnerable households. However, by using
the 'New Index' in selecting eligible households for social assistance, the poverty rate falls to
5.15% (i.e. a 16% drop in the number of the poor), which is close to the perfect targeting
poverty rate (4.75%, corresponding to a theoretical poverty reduction of 22%).
This paper was prepared by Mohamed Ayadi and Vincent Castel (Chief Country Economist, ORNA) with the support of Leila Jaafor (Socio-Economist) and Laurence Lannes (Principale Health Economist, OSHD 3). Overall guidance was receivedfrom Jacob Kolster (Director, ORNA) and Yacine Fal (Resident Representative, MAFO).
CONTENTS
I – Introduction p.2
II – Social Transfer Mechanismsin Morocco p.41. Origin of Social Transfers inMorocco p.4
2. 1999 Reforms: strengthening ofdirect transfers and reduction ofindirect transfers (indirect products) p.4
3. Improvement of direct socialtransfers and control and reductionof indirect social transfers since 2005 (energy products) p.4
4. Ways to optimize social welfaretargeting p.7
III – Lessons Learned fromInternational Experience p.81. The Indian experience p.8
2. The Indonesian experience p.8
3. Expansion of the use of the UNDPMPI in the world p.9
4. AfDB proposal to improve socialtransfers in Tunisia p.9
IV – Improving the identificationof beneficiaries of directtransfers in Morocco p.101. Deprivation score and livingconditions in Morocco p.10
2. Formulation of a multipledeprivation score p.16
3. Formulation of the aggregatedindex by the Proxy Means Tests p.19
V – How to improve targeting?Proposal of a new method p.221. Combination of the Proxy MeansTest and the Multiple DeprivationMethod to ensure better targeting p.22
2. Performance in terms of povertyreduction p.24
VI – Conclusions p.27
VII – Bibliography p.28
VIII – Annex p.29
Jacob KolsterDirector ORNA [email protected]+216 7110 2065

The most recent studies on poverty and human development in
Morocco concur that monetary poverty fell considerably between
2001 and 2011. In absolute terms, monetary poverty fell from 15%
in 2001 to 9% in 2007 and 6.2% in 2011. The proportion of vulnerable
people (with income levels just above the monetary poverty line)
fell from 22.8% in 2001 to 17.5% in 2007 and 13.7% in 2011 (AfDB,
2014).
Poverty does not affect Morocco's population uniformly. In 2011, the
rural poverty rate (10%) was triple that of the urban poverty rate
(3.5%). Similarly the rural vulnerability rate (17.7%) was double
that of the urban vulnerability rate (9.4%).
Low income is not the only challenge facing the poor. Poverty reduction
without increasing the capability of vulnerable individuals – i.e. the
ability of an individual to generate a decent income by him/herself –
could weaken this performance over time. In localities with high poverty
rates, it has, however, been observed that households suffer from
limited access to basic services (drinking water, sanitation, electricity,
roads, health care and education), a lack of professional opportunities
(apart from non-irrigated agriculture) and high youth unemployment.
For example, in rural areas, some children from poor families do
not attend school because the cost of doing so is fairly high and
parents prefer to have them work to increase the family's income (this
issue is at the heart of the Taysir program). Consequently, school
drop-out rates are highest among children from poor rural households,
which perpetuates this fragility. These factors underpin the chronic
poverty and precariousness experienced by households in certain
geographic areas of Morocco. Consequently, there are wide disparities
in terms of access to basic services between different areas (urban
and rural), regions (mountainous and Saharan areas on the one hand,
and areas around the major cities, on the other) and households in
different income distribution quintiles.
It should, however, be pointed out that, since independence, Morocco
has provided free education and basic health care and facilitated
access to food and energy products. This policy has been
implemented without discrimination among the beneficiaries (poor or
rich). However, only a quarter of these subsidies benefit inhabitants
of rural areas which contain three quarters of Morocco's poor and
41% of its population (Achy, 2010). Similarly, it has been observed
that, despite increases in public spending on health, the allocations
are not evenly distributed since 78% target urban areas
(WB, 2007).
Since 2005, the National Human Development Initiative in Morocco
has aimed to correct the distortions in favour of people living
in precarious situations, especially households in the most
disadvantaged urban and rural localities. It has contributed to the
significant progress made in improving the living conditions of that
segment of the population1.
The specific risks to the poorest households are due to limited access
to basic services, employment and sources of income. Deprivation
is higher among social groups most vulnerable to risk (mainly the
disabled, elderly and people living in remote areas).
Geographic targeting is often used in Morocco to mitigate these risks,
based on increasingly sophisticated poverty maps2. However, this
direct targeting procedure is unable to accurately identify the end
beneficiaries. In most cases, the final selection of beneficiaries falls
within the remit of commissions or individuals that decide on the basis
of criteria that leave much to their interpretation or weighting. This
lack of transparency prevents any recourse by the population in the
event of error or fraud (WB, 2012). In 2008, in rural localities targeted
by the INDH, the proportion of poor people was about 35% compared
to 32% for the entire urban population covered by the INDH
(Achy, 2010). Consequently, social welfare programmes confined to
geographic targeting face problems of efficient targeting and
governance, and their impact on the living conditions of the poor
and vulnerable population does not always match the resources
committed.
A f r i c a n D e v e l o p m e n t B a n k
2
AfDBW o r k i n g P a p e r
Regional Department forNorth Africa
2 0 1 6 • w w w . a f d b . o r g
I. Introduction
1 Morocco can be satisfied with its positive score for health since life expectancy at birth is now 72.4 years compared to 57.7 years in 1980.2 This joint programme of the Moroccan Authorities and the World Bank targeted the country's 14 poorest provinces in 1996. These provinces have benefited from a series of integratedprojects covering education, health, social welfare and job creation (Achy 2010).
A f r i c a n D e v e l o p m e n t B a n k
3
W o r k i n g P a p e rRegional Department for
North Africa
2 0 1 6 • w w w . a f d b . o r g
AfDB
This paper proposes a methodology that would fine tune the
existing system by combining geographic targeting and direct
targeting of households. It is also expected to minimize the
differences in the action taken by the different social actors in
Morocco and help to establish a single registry of beneficiaries3.
The new procedure addresses the multi-dimensional aspects of
poverty and vulnerability, which should facilitate inter-sector
coordination.
3 In its report entitled 'Targeting and Social Protection', the WB (2011) recommends as a priority action in the reform of targeting procedures 'the establishment of a unified targetingsystem for all programmes and a single registry of beneficiaries'.

A f r i c a n D e v e l o p m e n t B a n k
4
AfDBW o r k i n g P a p e r
Regional Department forNorth Africa
2 0 1 6 • w w w . a f d b . o r g
II. Social Transfer Mechanisms in Morocco
1. Origin of Social Transfers in Morocco
Until 1999, social transfer mechanisms were based on: (1) an indirect
social transfer mechanism by universal targeting through subsidies
on staple products (introduced since the late 30s); and (2) a direct social
transfer system through the payment of hospital care for the most
disadvantaged.
a. Direct social transfers: access to health care by Certificateof Indigence
Introduced in 1976, the Certificate of Indigence provided access to free
health care. The eligibility criteria for the certificate, issued by the local
representative of the Ministry of Interior, were not standardized. The
number of beneficiaries was not known and there were few controls.
According to WHO (2007), its impact was limited since the richest
uninsured quintile of the population benefited from 67% of the services
provided free of charge by public hospitals while the poorest quintile
only benefited from 5%.
b. Indirect social transfers: subsidies on staple products(energy and food products)
The staple product subsidization system was established with the
dual objective of: (i) protecting the population's purchasing power
from potential international price hikes of certain commodities; and (ii)
guaranteeing an adequate level of profitability for firms operating in
certain sectors by fixing the selling price. When it was initiated, the
system was designed to stabilize the prices of certain products through
a mechanism by which price increases of subsidized products would
offset each other. The State's contribution would be on an ad hoc
basis. Over time, the system strayed from its objective and became
an instrument to support the competiveness of firms (Court of Auditors,
2014). The system covered National Soft Wheat Flour (NSWF), sugar,
oil, butane gas, diesel and petrol. The subsidy system was designed
as a universal system providing the entire population access to
products and subsequently to the related subsidies. Since the amount
of subsidies from which a family benefits increases according to the
volume consumed, the system was more advantageous to the
wealthiest segments of the population (Ministry of Economy and
Finance, 2008).
2. 1999 Reforms: strengthening of direct transfers andreduction of indirect transfers (indirect products)
a. Direct social transfers by the Social Development Agency
In 1999, the Government established the Social Development Agency
(ADS) to support smallholders affected by the removal of customs
protection. The mission of the ADS was to build local capacity through
technical and financial support provided to local development projects.
The estimated number of ADS direct beneficiaries was 220,000
(WB, 2012).
b. Food subsidy reforms
In addition to the lack of targeting inherently linked to its universality,
the cost of indirect food product subsidies rose sharply to 1.6% of GDP
in 1999. In 1999, the Moroccan government implemented a first series
of reforms. It ended the subsidy on sugar for industrial purposes and
liberalized the price of edible oil. It also reduced customs duties on these
products. The cost of subsidizing food products thus fell from 1.8% of
GDP in 1990 to 0.8% in 2000 (IMF, 2014).
3. Improvement of direct social transfers and controland reduction of indirect social transfers since 2005(energy products)
Since the early 2000s, global demand for raw materials has risen sharply,
thus seriously affecting the prices of staples on the world market.
Over the 2002 to 2012 period, oil prices more than quadrupled while
those of sugar and wheat tripled. Consequently, the subsidy system
based on a stabilization mechanism as originally designed could no
longer operate since the fluctuations had become structural. Central
government support was necessary. From 2002 to 2012, the subsidy
budget rose from MAD 4 billion to MAD 56 billion, i.e. from 0.9% to
6.8% of GDP (Court of Auditors, 2014). The most significant increase
was from 2009 to 2012 when the budget increased by 258% from
MAD 15 billion to MAD 56.3 billion (Court of Auditors, 2014). Food and
energy subsidies then represented 85% of the total social welfare
budget (Sinking Fund and National Inter-professional Cereals and Pulses
Board -ONICL, 2009).

A f r i c a n D e v e l o p m e n t B a n k
5
The Moroccan government called into question this compensation
system, which had strayed from its original objective of protecting
consumers' purchasing power by mainly benefiting the 'non-poor' and
is costly for the government. To address these two anomalies, the
government initiated two reforms from 2005: (1) the first concerned the
reduction and stabilization of the cost of subsidizing oil products mainly
consumed by the most well-off segments of the population (petrol and
diesel); and (2) the second entailed the establishment of new social
safety nets to improve the efficiency of existing direct targeting
procedures and provide social transfer channels that will more effectively
redeploy part of the budget savings from the reduction of the indirect
subsidy on energy products.
This process led to National Human Development Initiative (INDH) based
on a series of programmes, including geographical targeting. The
purpose was to reach the most disadvantaged localities of the Kingdom
while safeguarding the productivity of the different economic sectors.
In addition, the Government initiated programmes to ensure that the
poorest segments of the community had a higher level of education
(Tayssir Programme) and easier access to health care (RAMED and
AMO programmes).
a. Improvement of direct social transfers to vulnerable communities
The government has gradually strengthened the existing social security
network and the targeting of the most vulnerable groups. This has
helped to reduce poverty and vulnerability.
• The National Human Development Initiative (2005)
This was the first programme that sought to improve the targeting
of vulnerable social groups and regions. The INDH simultaneously
adopted geographic and social targeting. It aims to reduce poverty,
precariousness and social exclusion through actions in support of
income-generating activities and improvement of the conditions of
access to basic services and infrastructure (education, health, worship,
road, water and sanitation, environmental protection etc.). It covers
the 403 poorest rural municipalities and the 264 most disadvantaged
urban neighbourhoods (WB, 2012). The first phase of the INDH (2005-
2010) comprised the launching of 22000 projects from which 5 million
people in several localities benefited (IMF, 2014). Between 2004 and
2007, poverty fell by 41% in the municipalities targeted by the INDH
(from 36% to 21%) compared with a 28% drop for the remaining rural
municipalities (from 16.9% to 12.2%) (WB, 2012).
In 2013, as part of social action, 6227 projects were scheduled
representing total investments of MAD 3.9 billion (of which over 56%
under the INDH allocated MAD 2.2 billion). The total number of project
beneficiaries was 1,277,522. Among others, these investments resulted
in the launching of road projects of over 700 km, the electrification of
over 1900 douars, drinking water supply for 127 douars, the construction
of 700 houses for 700 primary school teachers and the provision of
38 fully equipped ambulances4.
• Health Access Programmes (2005)
The law 65-00 (which came into force in September 2005) provides
access to all Moroccans to health care through universal
basic medical coverage. The law provides for a system of Mandatory
Health Insurance (AMO) for employees of the public sector and the
private sector, the self-employed, professionals. It also institutes a
medical assistance scheme (RAMED). The law also created by the
National Health Insurance Agency (ANAM), placed since 2009 under
the Ministry of Health. Its role, by law, is to ensure the technical
supervision of AMO, to ensure the implementation of system regulatory
tools (Article 59) and to manage the resources allocated to
RAMED.
Financed by national insurance contributions, the AMO comprises
several schemes: (i) the private sector wage earners and retirees
scheme managed by the CNSS; (ii) the public sector wage earners
and retirees scheme managed by the National Fund for Social Welfare
Organizations (CNOPS); and (iii) internal schemes or those managed
by private insurance companies benefiting wage earners prior to 2005
and which have been temporarily retained. The public and private
sector wage-earner schemes should in time cover about 10 million
people. The scheme for the self-employed, liberal professions and
other non-wage-earning activities should, in principle, cover 10 to 12
million people.
Finally, the Kingdom of Morocco has made recent progress in the
coverage of "independents", which represent about 32% of the
population, 85% of informal workers: bill was to be discussed in 2015.
In addition, the student insurance scheme was adopted and was
operational in 2015 (it concerns 260,000 students).
4 http://www.lemag.ma/Neuf-ans-d-INDH-Le-Maroc-de-son-modele-ravi_a83208.html
W o r k i n g P a p e rRegional Department for
North Africa
2 0 1 6 • w w w . a f d b . o r g
AfDB

For its part, RAMED is expected to cover poor and vulnerable
households, i.e. 8.5 million people (4 million poor and 4.5 million
vulnerable people) in addition to 160,000 prisoners, the homeless
and orphans (IMF, 2014). RAMED is gradually replacing the direct
targeting programme based on issuance of Certificate of Indigence.
RAMED was preceded by a pilot experiment initiated in the Tadla
Azilal region in 2008 to define the selection criteria for the population
to be targeted (WB, 2012). Following this experimental phase which
was evaluated in 2010, adjustments were made to the existing
regulatory provisions and eligibility procedures. As from 13 March
2012, RAMED was officially expanded to cover all those living in a
situation of poverty or vulnerability throughout the Kingdom. It covers
26% of the population, i.e. 8.5 million people (Ministry of General
Affairs and Governance, 2014)5.
RAMED is based on two types of health card: free cards valid for three
years issued to households considered poor; and cards issued to
households considered vulnerable for a three-year period renewable
annually upon payment of an annual contribution of MAD 120
per person with a ceiling of MAD 600 per family (RAMED, 2014)6.
Health care coverage has improved since the introduction of AMO in
2010 and 32% of the population has medical insurance compared
to 16.3% prior to the introduction of AMO (WB 2012).
RAMED had about 200,000 members in 2010. Eligible people are
identified based on procedures that take into account location, declared
resources and the awarding of a score related to households' socio-
economic conditions. The evaluation of the pilot phase was finalized in
February 2010 to identify conditions for scaling up the programme.
RAMED's 2009 budget was MAD 137.5 million (WB, 2012).
• Education Access Programmes (2007)
The "Tayssir" programme launched in 2007 allocates direct monetary
transfers, subject to conditions, to encourage education in disadvantaged
areas. The following five geographic areas have benefited from this
programme: Oriental, Marrakech-Tensift-Al Haouz, Meknes-Tafilalet,
Souss-Massa-Draa, and Tadla-Azilal.
This programme covered 160,000 families and approximately 300,000
pupils. In 2011, it reached 450,000 pupils (IMF, 2014). Since 2014 this
program has been generalized: all children in a primary school, receive
a grant of 60 100 DH / month depending on the level of attendance.
b. Reform of indirect social transfers: subsidies on energyproducts (2013-2014)
Energy product subsidies have gradually become an expenditure item
that is difficult to control. From 2009 to 2013, cumulative subsidies
reached a total of MAD 194.8 billion, 162.2 billion of which was solely
allocated to energy products, i.e. 83.3% of the total amount (Court
of Auditors, 2014).
Energy product subsidies only slightly benefit the poorest. The wealthiest
20% of the population benefited from 43% of subsidies and, in particular,
75% of subsidies on diesel and petrol prices (WB, 2012)). The report
by the Court of Auditors of the Kingdom of Morocco estimated that,
on average, in 2012 a household without a car (reflecting a low income)
received MAD 2181 per year in subsidies while a household with a car
(middle or high income) received more than double that amount, i.e.
MAD 4996.
To more strictly control the total cost of energy subsidies, the Moroccan
government decided in 2013 to partially index oil prices locally. This
procedure was intended to encourage households to be more efficient
in (and thus reduce) their energy consumption.
This policy was pursued in January 2014 when the Government took
the decision to remove subsidies on petrol and industrial fuel, while
gradually reducing the subsidy on diesel but maintaining the subsidy
on butane gas. A traditional transport sector support mechanism was
established (Court of Auditors, 2014). The Court of Auditors estimates
that the cost of subsidies fell from 6.8% of GDP in 2012 to 5.1% in
2013 (from MAD 48.2 million in 2012 to MAD 36.7 million in 2014).
A f r i c a n D e v e l o p m e n t B a n k
6
AfDBW o r k i n g P a p e r
Regional Department forNorth Africa
2 0 1 6 • w w w . a f d b . o r g
5 http://www.affaires-generales.gov.ma/index.php/fr/2012-10-08-16-53-28/politique-de-ciblage/programme-ramed.html6 https://www.ramed.ma/ServicesEnligne/APropos.html
4. Ways to optimize social welfare targeting
The Court of Auditors' Report (2014), recommends more accurate
targeting of beneficiaries based on eligibility criteria determined in
consultation with the different parties concerned. However, the main
difficulty lies in the identification of these eligibility criteria. The targeting
of direct transfers can be improved in light of successful experiences
in certain countries of Latin America and Asia. For example, in the case
of RAMED, the fact that eligibility is dependent on the declaration by a
potential beneficiary of his/her income and resources is potentially
problematic. Such declarations are often erroneous since households
tend to undervalue their income and resources in order to benefit from
social assistance.
As a result of the INDH, considerable strides have been made towards
improving the population's living conditions7/8. However, the INDH's
direct geographic targeting procedure does not always make it possible
to accurately identify the end beneficiaries. In the majority of cases, the
final selection of beneficiaries is the responsibility of commissions or
individuals that decide using criteria which give considerable leeway in
their interpretation or weighting. This lack of transparency prevents any
recourse by the population in the event of error or fraud (WB 2012).
To address the weaknesses of the purely geographic targeting
procedures, the WB (2012) and IMF (2014) have recommended
that the Moroccan authorities adopt targeting programmes for the
neediest based on the Proxy Means Tests method. The PMT uses
an approximation for income and certain poverty thresholds to identify
eligible households for direct transfers. It proposes that the amounts
be inversely proportional to the approximated income levels.
However, use of the PMT requires the building of new administrative
capacity to fine-tune the procedure for the selection of eligible households
and control of the selection procedure. This requires the availability of
accurate and reliable statistical data that field workers can use to
implement the procedure for the selection of eligible households for
direct social assistance. This will create additional costs for central
government.
A f r i c a n D e v e l o p m e n t B a n k
7
W o r k i n g P a p e rRegional Department for
North Africa
2 0 1 6 • w w w . a f d b . o r g
AfDB
7 Morocco can be satisfied with its positive score for health since life expectancy at birth is now 72.4 years compared with 57.7 years in 1980.8 Malgré les efforts en faveur de la lutte contre la pauvreté réalisés par le pays depuis plus d'une décennie, le Maroc reste en queue de peloton en matière de développement humain : son indice de développement humain(IDH) s'établit à 0,591en 2012, ce qui est inférieur à la moyenne mondiale (0,694) et à la moyenne des pays arabes (0,652). L'IDH du Maroc est 130e sur les 187 pays étudiés, selonle Rapport 2013 de Développement Humain publié par le PNUD. Toutefois, l'IDH du Maroc a largement progressé depuis 1980, où il n'atteignait que 0,371. 5 http://www.affaires-generales.gov.ma/index.php/fr/2012-10-08-16-53-28/politique-de-ciblage/programme-ramed.html8 Despite the country's poverty reduction efforts for over a decade, Morocco lags behind in terms of human development: its human development index (HDI) was 0.591 in 2012,which is below the world average (0.694) and the Arab country average (0.652). Morocco's HDI is 130th out of the 187 countries studied according to the 2013 Human DevelopmentReport published by UNDP. However, Morocco has made considerable progress since 1980 when it only scored 0.371.

A f r i c a n D e v e l o p m e n t B a n k
8
AfDBW o r k i n g P a p e r
Regional Department forNorth Africa
2 0 1 6 • w w w . a f d b . o r g
III. Lessons Learned from International Experience
1. The Indian experience
Initially, the Indian planner noted the difficulty in verifying information
on the income of a number of households working in the informal
sector. For this reason, the targeting policy was implemented in two
stages. First, visibly non-poor households were identified, then, in a
second stage, assistance was allocated to the other households based
on their respective expenditure levels, starting with those households
with the lowest levels of total spending up to the exhaustion of the
budget earmarked for such assistance.
Following some years of implementation, the planner noted the
subjectivity of the exclusion and assessment criteria for household living
standards. Total expenditure was replaced by a synthetic indicator,
based on a multidimensional approach during the living standards
assessment, in order to classify households by order of eligibility for
social assistance.
In the last stage, in 2009, the Indian planner addressed corruption in
the granting of assistance by reducing information asymmetry. “To guard
against misappropriation”, it expressed the living standards indicator
as a function of all “verifiable” indicators.
2. The Indonesian experience
1. The Indonesian experience
Like Morocco, Indonesia targets poor communities in three ways: (1)
social welfare, which provides poor households with direct assistance
(this partly corresponds to RAMED's activities); (2) allocation of
funds to the most disadvantaged localities (which corresponds to
the allocation of funds in Morocco to 667 poor localities (403 rural
municipalities and the 264 most disadvantaged urban neighbourhoods
under the supervision of INDH); and (3) assistance for the start-up of
microenterprises (activity already carried out by INDH in Morocco).
2. Procedure for the reallocation of funds originally earmarkedfor oil product subsidies.
Indonesia has one of the largest direct transfer programmes of all
developing countries, the BLT (Bantuan Langsung Tunai) programme.
Launched in 2008, this programme allocates direct transfers to 19.2 million
families in periods of economic crisis. Targeting in this programme is
carried out by a combination of community targeting procedures
and Proxy Means Tests (PMT). Community targeting delegates the
responsibility for targeting households or individuals to community
leaders (people usually respected in the community such as religious
leaders or primary school teachers). The PMT ranks households
according to their estimated income level through an econometric
estimation using observations on the socio-demographic characteristics
of households as well as on their living conditions (type of housing,
ownership of durable goods, etc...).
Alatas et al. 2009, attempted to evaluate the performance of the
combination of the two methods based on a sample of 640 Indonesian
villages. If households are ranked according to their total expenditure
levels (limited to monetary poverty), community targeting will tend to
generate more targeting errors than the PMT especially if the estimated
household income is close to the monetary poverty threshold. However,
the salient feature of this study is that the communities appear to use
a different concept of poverty. The results of the community method
are correlated with the manner in which members of the community
rank themselves according to their status rather than their respective
expenditure levels. In this ranking, other deprivations are taken into
account in addition to monetary income.
The study showed that community targeting results in 60% fewer
complaints than the PMT and that it is easier to distribute the allocations.
Community targeting was more satisfactory in Indonesia since it is based
on more accurate information on the family's precariousness. The
effectiveness of community targeting is due to the fact that it is more
difficult to conceal wealth from one's neighbour than the government.
The PMT takes into account the permanent component of consumption
since it is based on the family's assets to approximate its income. Thus
a family may fall into a precarious situation because the household head
has become ill but the family may not be eligible for social assistance
because it still has a big house - which means that the PMT ranks it as
non-poor (therefore ineligible for social assistance). However community
targeting may favour family and friends. This creates bias in the allocation
process. To prevent such bias, the Indonesian Minister of Planning opted
in 2012 for targeting based on a multidimensional poverty index (MPI),
summarized by a multiple deprivation score as recommended by the
A f r i c a n D e v e l o p m e n t B a n k
9
W o r k i n g P a p e rRegional Department for
North Africa
2 0 1 6 • w w w . a f d b . o r g
AfDB
UNDP. The MPI helps to rank households according to their order of
priority for social assistance by considering their respective levels of
deprivation. It helps to establish an objective and transparent rule in the
community targeting process.
3. Expansion of the use of the UNDP MPI in the world
The MPI is currently calculated for over 100 of the world's countries9.
It complements the monetary poverty measures by taking into account
the most severe deprivations that several people may experience in
terms of education, access to health care and in their living and housing
conditions.
The UNDP's MPI comprises ten indicators. According to UNDP, a person
is MPI poor if he/she is deprived of over one third of the deprivations
used to calculate this multidimensional poverty index. Therefore,
the MPI helps to map out the living conditions of the poor. It allows
international and regional comparisons, and comparisons by area (urban
or rural) based on any type of community stratification. The MPI may
be considered as a valuable analytical tool for identifying the most
vulnerable communities and for specifying the determinants of their
poverty. Hence, it helps political decision-makers to improve their
targeting and subsequently put in place more effective poverty reduction
policies.
Pakistan has adopted the MPI to identify policies for targeting the poor.
Pakistan's Ministry of Planning, Development and Reforms has initiated
the development of a new multidimensional poverty index (MPI) based
on the Alkire and Foster method. Pakistan's Minister of Planning, Ahsan
Iqbal, stated that “The traditional one-dimensional indices cannot reflect
the true poverty levels in Pakistan. The MPI is more comprehensive,
integrated and holistic as it covers education, health and living standards.
It will help us understand and better address issues related to poverty
in Pakistan”.
According to Marc-André Franche, UNDP Country Director in Pakistan,
“The MPI is crucial for policymaking and improving the targeting of social
policy. It is vital to develop a robust revenue formula, improve policy
design and monitor effectiveness of policy over time. Each country
needs to choose dimensions that are most important for measuring
poverty”.
Therefore, the MPI helps to improve policy action plans, identify
interconnections between deprivations and monitor the effectiveness
and performance of social policies over time, and in targeting the poor
and regions receiving social assistance while avoiding malpractice in
“community targeting”.
4. AfDB proposal to improve social transfers in Tunisia
The AfDB report (2014b) stresses the fundamental idea that Tunisian
decision-makers do not always share the same understanding of what
makes a potential beneficiary of social assistance. The large majority of
decision-makers define a potential beneficiary as a poor person in the
monetary sense of the term, i.e. an individual with a low income below
a fixed value. This is readily understandable since the poverty indicators
communicated by the INS (National Institute of Statistics) are calculated
using this method. However, the existing direct social transfer system is
based more on the notion of deprivation, which is closer to the notion
of multi-dimensional poverty. The beneficiary is not defined in terms of
income or consumption, but by a set of factors reflecting the constraints
on his/her way of life and living standard. Since these two interpretations
are not mutually interchangeable, the decision-maker must be selective.
Therefore, the report (AfDB, 2014) proposes a methodology that will
optimally meet this dual objective (monetary poverty and deprivation).
As such, a new approach has been developed. To facilitate its adoption,
this approach relies on the existing context. It uses easily observable
and non-modifiable indicators during the operation to identify poor people
carried out by the social worker, while ensuring a careful estimation of
the living conditions of individuals or households concerned by social
assistance. Fifteen (15) living standard indicators are used that take into
account the many deprivations from which households are reported to
suffer. They synthesize three household living standard criteria: (1) living
conditions (including housing); (2) the capacity of household members
to generate a decent income; and (3) the burden borne by active
household members. All these indicators may be easily assessed
by government representatives in the field during household surveys.
These approaches are based on both the multiple deprivation method
and the Proxy Means Test method. They take into account the
interdependence of the impacts of the 15 indicators, household
behaviours, and the heterogeneity associated with different milieu and
regions of residence and which may aggravate targeting errors.
The proposed methodology to determine the allocation to be made to
the beneficiary will ensure a more equitable allocation of resources in
favour of those suffering from multiple deprivations and/or extreme poverty.
9 "A wealth of data. A useful new way to capture the many aspects of poverty". The Economist. July 29, 2010.
A f r i c a n D e v e l o p m e n t B a n k
10
AfDBW o r k i n g P a p e r
Regional Department forNorth Africa
2 0 1 6 • w w w . a f d b . o r g
IV. Improving the identification of beneficiaries of direct transfers in Morocco
To consolidate the ongoing process in Morocco and as with the
Indonesian experience, it is proposed in this chapter to test
the effectiveness of a targeting method combining geographic
and household targeting, based on an index reflecting poverty and
vulnerabilities.
The objective of this study is to improve the distribution of assistance
within the targeted areas (intra-geographic zone targeting) in Morocco.
The score proposed for the calculation will ensure a more accurate
ranking of beneficiaries according to their order of priority for the different
types of assistance recommended by the Moroccan government. This
method allows us to consider a ranking of potential beneficiaries within
a targeted locality but can also be easily adapted to adjust and revise
the budgets allocated by locality.
In addition to being more effective in terms of targeting, the new
procedure is less costly and will require less administrative mobilization.
As in the case of the Tunisian example mentioned above, it combines
the PMT method and the multiple deprivation method to ensure that
the calculation of the deprivation scores is based on the characteristics
of households easily observable by people in the field. Therefore,
administrative control procedures could be easier and less costly.
This procedure could help to improve the social transfer procedures
adopted by the INDH in Morocco. The use of this score could also optimize
the reduction in the divergences among the objectives of the different
social actors in Morocco, and contribute to the establishment of a single
registry of beneficiaries10. Indeed, the lack of a single identification criterion
for all actors results in wastage during the budget allocation processes
for the different programmes. The procedure for the identification of those
eligible for social assistance within the targeted regions and currently
carried out by Moroccan social workers attaches a key role to the personal
assessment of the workers. Such an assessment could be subjective in
the absence of objective and verifiable assessment criteria (by the social
worker and by the control officer). The new procedure, which calculates
a score of deprivations with a multidimensional aspect of poverty and
vulnerability, should facilitate inter-sector coordination while ensuring more
transparent transfer allocation modalities.
While drawing on the existing context, approach presented below seeks
to identify a series of more easily observable and objectively verifiable
indicators that will help to identify households with the lowest standards
of living that are the most vulnerable. This new approach can then be
fine-tuned while providing a specific anchor to Moroccan society.
To identify easily observable and objectively verifiable indicators that
can then be used to spot the beneficiaries, a representative sample is
used (2000 households) from the 2009-2010 Morocco 'Household
and Youth Survey'. The survey conducted between December 2009
to March 2010 by the World Bank collected detailed information on
households’ characteristics: demography, education, economic
activities, migration, participation in social programs ...
Identification of these indicators will initially help to construct a deprivation
score on the basis of 16 indicators (defined in Figure 1), the relative
importance of which is calculated using the UNDP method. This
deprivation indicator combined with the conventional monetary poverty
indicator will then be used to measure targeting method performance
either in terms of deprivations or in targeting monetary poverty. Two
targeting methods ('multiple deprivations' and the 'Proxy Means Test')
are successively presented and then combined in the following chapter
to define a new targeting indicator for the INDH.
1. Deprivation score and living conditions in Morocco
A score is calculated for each household seeking social assistance
based on a number of characteristics that are easily observable by social
workers in the field. Each of these characteristics is assigned a weight.
Eligibility for social assistance is determined by comparing this score
with a predefined eligibility threshold. The variables used to calculate
this score for each family must enable the person in the field (social
worker or assistant) to carry out the control smoothly.
a. Selection of indicators
To make an approximation of living standards, household deprivations
are analysed by selecting on the basis of the 2010 'Morocco Household
10 In its report entitled 'Targeting and Social Protection', the WB (2011) recommends as a priority action in the reform of targeting procedures ‘the establishment of a unified targetingsystem for all programmes and a single registry for beneficiaries.'

A f r i c a n D e v e l o p m e n t B a n k
11
W o r k i n g P a p e rRegional Department for
North Africa
2 0 1 6 • w w w . a f d b . o r g
AfDB
and Youth Survey' 16 indicators, classified into three categories:
(1) household housing and living conditions; (2) household ability to
generate a decent income; and (3) the burden of non-active individuals
(children, the elderly and those who are ill or unable to work) on working
adults.
The selection of variables in this first category also helps to assess the
impact of the Moroccan government's efforts in terms of investment
in basic infrastructure that will facilitate access to drinking water and
electricity as well as to road transport.
The second category includes household head-specific variables
to determine whether he/she is in a profession at risk (agricultural
workers without land and informal sector workers) and to identify
his/her level of education. Consideration of these indicators is
essential in a living standard assessment. Achy (2010) showed that,
despite the drop in average poverty levels, wide disparities, a high
illiteracy rate and a significant informal sector reflect the vulnerability
of certain jobs that characterize households in disadvantaged
areas.
Lastly, to select third category variables, declining fertility in families
has a direct impact on the dependency rate, the fall in which is partly
due to the drop in the proportion of under-15s in the population from
42.5% in 1980 to 28% in 2008 (Achy, 2010).
The 16 indicators selected and presented in Figure 1 are both easily
defined, easy to collect and easily verifiable. The three criteria adopted
use the same determinants of living standards as those used by most
studies in this field, while respecting Moroccan specificities. Individually,
these deprivations are encountered more frequently in communities
affected by monetary poverty and in rural rather than urban areas (Table
A1 and Graphs 1a and 1b). The relevance of these indicators will then
be checked in the following chapters by analyzing the efficiency of the
composite indicator in identifying households affected by monetary
poverty.

A f r i c a n D e v e l o p m e n t B a n k
12
AfDBW o r k i n g P a p e r
Regional Department forNorth Africa
2 0 1 6 • w w w . a f d b . o r g
LivingCondi�ons
Indicator Indicator's Depriva�on Threshold
Roof
Wall
Floor
Tap water
Electricity
Sanita�on
Housing type
No confort
Cooking
Capacity oi theHead of the Housold to Generate DecentIncome
Mul�pleDepriva�on Score
informal
disabled
No educa�on
Land
Charge Born by Ac�ve Adults
Dependant
Crowding
widow
=1 the roof is not in cement
=1 the walls are not made of bricks
=1 the floor is made of sand
=1 if not connected
=1 if not connected
=1 si no toilet
=1 if precarious housing
= 1 if no tv , fridge
=1 if use wood
=1 if no social securit
=1 if the head of the household can not work because of a disability
=1 if the head of the household has no primary educ�on
= 1 if landless agric worker
=1 si the ra�o[Nbre(young + old) / Nbr adults ] >2
=1 if the number of people per sleepingroom >3
=1 if the head of the houseold is a widox
Figure1: Standard of Living Indicators and Deprivation Thresholds in Morocco
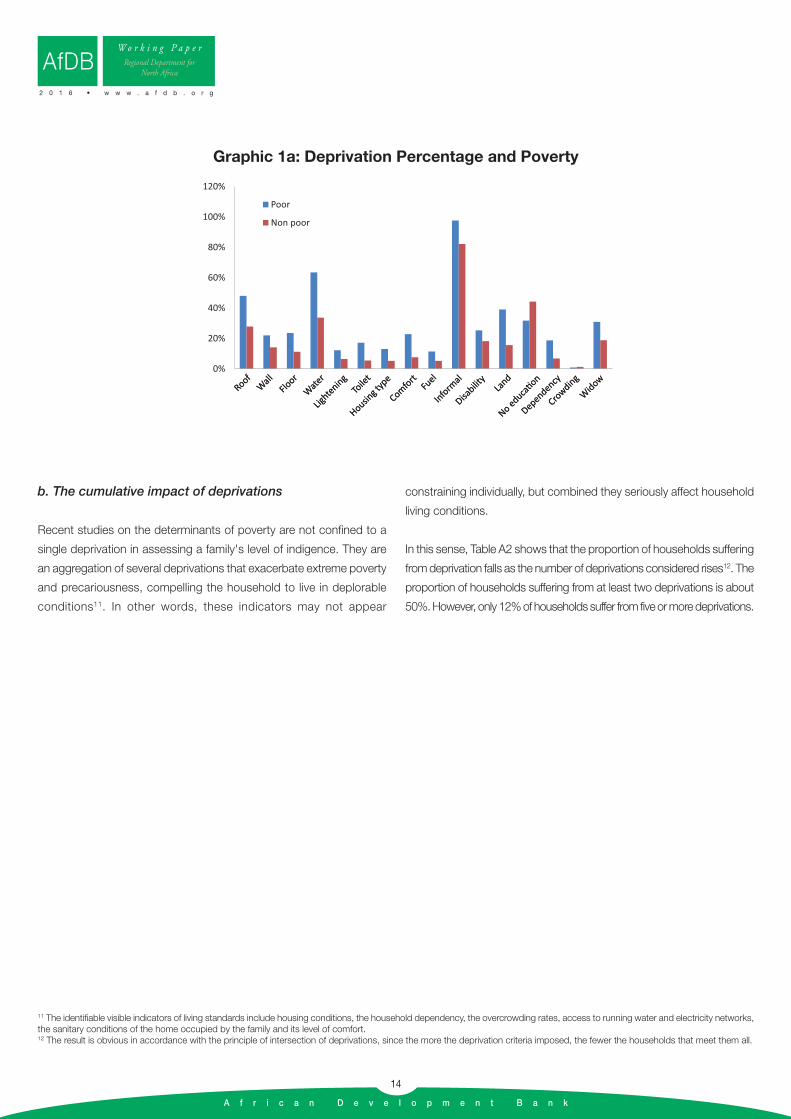
Key variables impacting on household living conditions: conditions
differ between urban and rural areas (Table A1). In rural areas, there are
fewer permanent buildings and access to running water rare. However
the existence of a clay or sand floor at the place of residence, the lack
of a toilet and connection to the public electricity network as well as of
comfortable conditions are two to three times more frequent among
poor households. These five variables appropriately reflect the indigence
of families and are used to calculate deprivation scores.
A f r i c a n D e v e l o p m e n t B a n k
13
W o r k i n g P a p e rRegional Department for
North Africa
2 0 1 6 • w w w . a f d b . o r g
AfDB
Key variables impacting on the household head's ability to generate
a decent income: Graphs 1a and 1b highlight the predominance of
informal sector jobs in Moroccan society with 83% of household heads
working in that sector. However, virtually all (98%) household heads
affected by monetary poverty and rural dwellers (94%) work in the
informal sector. By focusing on rural areas, it is observed that 43% of
household heads are 'agricultural workers without land'. However this
percentage skyrockets if the monetary poor are considered with 85%
of family heads who are 'agricultural workers without land'. When the
econometric estimation is calculated for the PMT, it will be observed
that these two variables (informal and land ownership) will have significant
negative impacts on living standards. Furthermore, since these two
variables are observable, they are relevant for the calculation of the
deprivation score.
Key variables impacting on the burden borne by active adults:
the dependency rate corresponding to the ratio between the number
of inactive people (under-18 youths and over-65 adults) to the number
of active adults in the household, is commonly used in the literature
when considering the burden borne by active household members.
Graph 1a shows that the dependency rate is tripled among
the poor.
A f r i c a n D e v e l o p m e n t B a n k
14
AfDBW o r k i n g P a p e r
Regional Department forNorth Africa
2 0 1 6 • w w w . a f d b . o r g
b. The cumulative impact of deprivations
Recent studies on the determinants of poverty are not confined to a
single deprivation in assessing a family's level of indigence. They are
an aggregation of several deprivations that exacerbate extreme poverty
and precariousness, compelling the household to live in deplorable
conditions11. In other words, these indicators may not appear
constraining individually, but combined they seriously affect household
living conditions.
In this sense, Table A2 shows that the proportion of households suffering
from deprivation falls as the number of deprivations considered rises12. The
proportion of households suffering from at least two deprivations is about
50%. However, only 12% of households suffer from five or more deprivations.
11 The identifiable visible indicators of living standards include housing conditions, the household dependency, the overcrowding rates, access to running water and electricity networks,the sanitary conditions of the home occupied by the family and its level of comfort.12 The result is obvious in accordance with the principle of intersection of deprivations, since the more the deprivation criteria imposed, the fewer the households that meet them all.
0%
RoofWall
Floor
Water
Lightening
Toile
t
Housing t
ype
ComfortFu
el
Informal
Disabilit
yLa
nd
No educa�on
Dependency
Crowding
WidowRoof
WallFlo
orWate
r
Lightening
Toile
t
Housing t
ype
ComfortFu
el
Informal
Disabilit
yLa
nd
No educa�on
Dependency
Crowding
Widow
20%
40%
60%
80%
100%
120%
Poor
Non poor
Graphic 1a: Deprivation Percentage and Poverty

A f r i c a n D e v e l o p m e n t B a n k
15
W o r k i n g P a p e rRegional Department for
North Africa
2 0 1 6 • w w w . a f d b . o r g
AfDB
c. Relationship between the number of deprivations andmonetary poverty
Furthermore even if, considered individually, the deprivation indicators
appear to be more frequent in poor communities, it is important to
determine whether the cumulative frequency of deprivations reflects
monetary poverty. Table A3a and Graphs 3a1 and 3a2 show that,
beyond 3 deprivations the proportion of poor people is higher.
This proportion doubles above 3 deprivations and triples over 4
deprivations.
0
0.1
0.2
0.3
0.4
0.5
0.6
0.7
0.8
0.9
1
>=1 >=2 >=3 >=4 >=5 >=6 >=7
Graphic 2a: Cumulated Frequencies of Deprivations
d. Relationship between the number of deprivations and the area
The number of deprivations is higher in rural areas. Urban households
are less affected on average by deprivation than rural households. Thus,
under 7% of the urban population suffers from more than 3 deprivations
while 48% of rural households suffer from over 3 deprivations.
0
0.1
0.2
0.3
0.4
0.5
0.6
0.7
0.8
0.9
1
1 2 3 4 5 6 7 8
PoorNon poor
0
0.1
0.2
0.3
0.4
0.5
0.6
0.7
0.8
0.9
1
>=1 >=2 >=3 >=4 >=5 >=6 >=7
PoorNon poor
Graphic 3a1: Breakdown ofDeprivations
Graphic 3a2: Cumulated Frequencies ofDeprivations

A f r i c a n D e v e l o p m e n t B a n k
16
AfDBW o r k i n g P a p e r
Regional Department forNorth Africa
2 0 1 6 • w w w . a f d b . o r g
2. Formulation of a multiple deprivation score
The process of allocating assistance to each household could depend
on the number of deprivations and their respective weights. To
operationalize this process, it is necessary to construct and aggregate
deprivation index that will factor in the interactions between the
deprivation indicators.
a. Theory
To take into account interactions between indicators when assessing
a household's degree of deprivation, the multidimensional approaches
identify people in a situation of deprivation using the union approach or
intersection approach. The union approach stipulates that a household
is in a situation of deprivation if it is deprived of at least one dimension.
The intersection approach argues that a household is in a situation of
deprivation if it is deprived of all its dimensions.
The Alkire Foster approach (2007) (or the A&F approach) identifies a
household as being in a situation of deprivation if it is deprived of at
least k dimensions (k=1,..,D)13. This multiple deprivation approach
considers therefore that it is the accumulation of deprivations which
determines a family’s level of poverty. Multiple deprivation levels of a
household are established on the basis of aggregated periodic levels
of deprivation which are ranked according to their respective weights.
Hence, a synthetic household living standard indicator summarizing the
overall level of deprivation suffered by each household is established.
Furthermore, deprivation thresholds corresponding to the maximum
number of deprivations tolerated are defined. This helps to delineate
the allocation processes by types of households classified according
to their respective deprivation levels and suffering from minimum
deprivation14 (AfDB 2014).
b. Practice
Two indices have been defined to implement this method:
a) An unweighted deprivation index: in this case a single weight is
assigned to each of the 16 indicators awarding a score to each
household of 1 to 16. A weight of 1/16 is assigned to each indicator.
Therefore, the final score is between 0 and 1. The neediest
households in terms of direct targeting are those with the highest
scores. This first approach enables us to carry out an initial analysis
based on the number of deprivations (which can only be done if the
weights associated with the different indicators are identical), then
a second analysis based on the deprivation percentage.
0
0.1
0.2
0.3
0.4
0.5
0.6
0.7
0.8
0.9
1
1 2 3 4 5 6 7 8
UrbanRural
0
0.1
0.2
0.3
0.4
0.5
0.6
0.7
0.8
0.9
1
>=1 >=2 >=3 >=4 >=5 >=6 >=7
UrbanRural
Graphic 3b1: Breakdown of Deprivationsby Location
Graphic 3b2: Cumulated Frequencies ofDeprivations by Location
13 Alkire and Foster (2007) propose the family of adjusted FGT measures defined by Mα = μ(gα) where α≥0.Mα which meets all the multidimensional axiomatic properties while beingeasy to calculate and adapted to ordinal data. Indices of the Mα family are decomposable by population groups. In addition, all members of this family may be subdivided into groupsof standard of living indicators. This decomposition property is interpreted as the contribution of the dth indicator to multidimensional poverty. 14 We consider the case of N households and D living standard indicators where zd is defined as the threshold (or line) specifying the level ofdeprivation of indicator d (d = 1,..,D). Wenote sid the status of indicator d in household i, and we give a scalar of gid to each household i so that gid = 1 where sid<zd and gid = 0 otherwise. Thus household i is considered tobe deprived of indicator d if gid = 1.

A f r i c a n D e v e l o p m e n t B a n k
17
W o r k i n g P a p e rRegional Department for
North Africa
2 0 1 6 • w w w . a f d b . o r g
AfDB
b) A weighted deprivation index: the 16 deprivation indicators are used
to define an overall score for each household. However, the indicators
are assigned different weights that are defined exogenously based on
a UNDP-defined approach. Three groups of indicators are defined:
‘family housing conditions and living standards’, ‘capacity to generate
a decent income’ and ‘burden borne by the family’. The weight of
each of these groups in the calculation of the final index is 1/3. The
‘family housing conditions andliving standards’ deprivation indicator
group comprises 9 sub-indicators. The weight of each of these
sub-indicators will be 1/27 in the calculation of the final index. A weight
of 1/12 is assigned to each indicator in the ‘capacity to generate
a decent income’ group. Lastly, it assigns a weight of 1/9 to each
sub-indicator in the ‘burden borne by the family’ group. Since the final
score is also between 0 and 1 in this case, the neediest households
in terms of direct targeting are those with the highest score.
c. Results
The values of the deprivation indicators (weighted and non-weighted)
are calculated for each household on the basis of statistical information
from the 2009-2010 'Morocco Household and Youth Survey'. Then,
the adjusted Alkier and Foster (2007) indices are calculated by
fixing an aggregate deprivation threshold (defined by the tolerated
number of deprivations or the tolerated percentage of deprivations).
This makes it possible to analyse multidimensional levels of poverty
for different levels of deprivation and different deprivation
percentages.
The analyses are carried out at the global level initially and in a second
phase by area15.
• Overall analysis
Households are classified according to their deprivation indices16. The
following four deprivation thresholds are defined: 0.10, 0.20 and 0.30
and 0.40. The further the relative deprivation threshold falls, the faster
the number of people considered to be suffering from deprivation
rises.
For a deprivation threshold of 0.1, the percentage of families considered
to suffer from deprivations is 43%, according to the overall unweighted
index, and 58% when the overall weighted deprivation index is
considered (Table A4). For a deprivation threshold of 0.30, the
proportions of needy families according to the two overall indices are
about 4% and 9%, respectively.
Table A4 and Graph 4 show that the cumulative frequencies of
households suffering from deprivations are fairly sensitive to the
deprivation thresholds but insensitive to the weights adopted for the
calculation of the living standard indicator.
15 The analysis may be expanded by making classifications by geographic area (mountainous areas, coastal areas, etc.) or based on certain socio-demographic characteristics of thehousehold head and tracking the main inequalities of opportunity between households.16 In the UNDP methodology, the percentage of a household’s deprivation corresponds to the weighted sum of the deprivations. Thus, when the weights are standard for all the indicators, the percentage (or proportion of privations) equals the sums of 15 gih divided by 16. Where gih is equal to 1 if household h is deprived of indicator i, it is otherwise equal to zeroif not. However, when the weights denoted wi, differ among the 16 indicators, the percentage of deprivations is obtained by the weighted average by the wi of the 16 gih. These deprivationpercentages, calculated for each household h, make it possible to classify the latter in ascending order of their respective deprivations even though the indicators have the same impactson household living standards. The authors acknowledge the potentially arbitrary nature of this methodology.

A f r i c a n D e v e l o p m e n t B a n k
18
AfDBW o r k i n g P a p e r
Regional Department forNorth Africa
2 0 1 6 • w w w . a f d b . o r g
0%
10%
20%
30%
40%
50%
60%
70%
80%
90%
100%
0.1 0.2 0.3 0.4 0.5
Not weighted Weighted
Graphic 4: Breakdown of Relative Deprivations
• Analysis by area
Deprivation frequencies are higher in rural areas irrespective of the
deprivation threshold and the deprivation index (Table A5). The inter-
area differences between the proportions of people suffering from
deprivations increase as the deprivation threshold falls. The biggest
difference was obtained for a threshold of 0.2.
It was noted that the analysis in terms of deprivations places greater
emphasis on the differences in terms of living standards between
areas than is revealed in the analysis using monetary poverty rates.
Urban areas are home to a significant middle class suffering from
few deprivations. However, the highest proportion of poor people
with deeper levels of deprivation live in rural.
0%
10%
20%
30%
40%
50%
60%
70%
80%
90%
100%
0.1 0.2 0.3 0.4 0.5
UrbanRural
0%
10%
20%
30%
40%
50%
60%
70%
80%
90%
100%
0.1 0.2 0.3 0.4 0.5
UrbanRural
Graphic 5a: Un-weighted Deprivation Index Graphic 5b: Weighted Deprivation Index

A f r i c a n D e v e l o p m e n t B a n k
19
W o r k i n g P a p e rRegional Department for
North Africa
2 0 1 6 • w w w . a f d b . o r g
AfDB
3. Formulation of the aggregated index by the ProxyMeans Tests
a. Theory
From a theoretical standpoint, this approach is based on the definition
(using observable variables and obtained by econometric regression) of
a proxy (or estimator) as a standard of living indicator17. This method
makes it possible to classify households based on predicted consumption
levels.
The index corresponds to the poverty gap which, in turn, corresponds
to the difference between estimated consumption and the poverty line.
In other words, this gap corresponds to the transfer amount required
to lift a needy family above the poverty threshold.
In theory, this approach makes it possible to establish a link between
monetary poverty (since it gives an approximate living standard for a
household on the basis of its total expenditure) and multiple deprivations
(since the deprivations suffered by each household are used to predict
its standard of living).
b. Practice
It will initially be necessary to perform an econometric regression
to determine – for the deprivation indicators – the role they play as
determinants of monetary poverty. In a subsequent stage, this will permit
the construction of a model that will facilitate estimation of the living
standards of this family. Lastly, an index will be defined for each household
corresponding to the gap between the living standards of the household
as predicted by the model and the poverty line. In descending order,
this index will classify the neediest families in terms of direct targeting.
The 2010 'Morocco Household and Youth Survey' provides considerable
information on households that may be used to carry out the Proxy
Means Test. In addition to information on the expenditure levels of each
household, this survey contains a series of 50 variables tracking the
socio-demographic, geographic and institutional variables of each
household in the sample.
Table A6 presents the results of econometric regressions of the logarithm
of total expenditure18 of each household on a series of explanatory
variables for all households, then for households in the first quartile (the
poorest) in 201019.
These variables first of all include the 16 indicators defined in Figure
1, summarizing the main observable characteristics of households.
The analyses also take into account the impacts relating to household
areas and regions of residence. The inclusion of these variables reflects
the heterogeneity of behaviour between living environments and
regions.
c. Results
The results of the econometric regressions show that:
Concerning the variables relating to housing conditions, those
relating to ‘the absence of a permanent wall, roofing and flooring’,
‘non-connection to the electricity or drinking water networks’ or the
fact of living in a ‘non-decent house’ (according to the criteria defined
in figure 1) all have negative impacts on the level of total expenditure.
However, only four of the nine variables have statistically significant
impacts. Thus, if the house occupied by the family has a sandy or
clay floor or if it has no toilet or is not equipped with a television or
refrigerator and, lastly, if the house is non-decent, the family living in
it will most probably have a very low standard of living and should be
prioritized when granting social assistance.
Regarding the variables associated with the capacity of the
household head to generate a decent income, only two ('being an
agricultural worker without land' or 'informal sector worker') of the four
indicators have significant negative impacts on the standard of living.
The other two variables (' presence of disabled people in the household',
'low level of education of household head') have, on the contrary, a
17 Our analysis is based on approximate income values, denoted y ̂, estimated by observing certain living standard indicators, denoted by X. Our problem, therefore, is to minimize theanticipated level of poverty E[P(y + t, z)/X], when selecting optimal direct transfer levels ti, associated with each household i. The least squares estimation of the income equation parameters will predict total expenditure y ̂_i. This value may then be used to decide whether the household can benefit from thesubsidy by verifying whether y ̂_i is below the poverty threshold z and if so, how much that subsidy will be. The amount of the subsidy, equal to t ̂_i=z-y ̂_i, is consequently correlatedwith y ̂_i.18 Used as a proxy for income per capita.19 This distinction between regressions for all first quartile households helps to identify the behavioural specificities of the neediest households which, as our estimates show, do nothave the same behaviour.

A f r i c a n D e v e l o p m e n t B a n k
20
AfDBW o r k i n g P a p e r
Regional Department forNorth Africa
2 0 1 6 • w w w . a f d b . o r g
positive impact. The level of education is not a determining factor of the
standard of living of the average representative household at national
level. However, if only first quartile households are considered, the
impacts of these two variables will be negative but not significant.
The relative weight of dependents in the household has a
statistically significant impact on living standards. Dependency
(if the number of young and elderly people in the family is more than
double the number of active adults) and if the household head is a
woman ('widow') have a significant and negative impact on household
living standard in Morocco. However, the existence of a large family in
confined housing has no significant impact on the standard of living,
but it becomes negative if only first quartile households are considered,
albeit not statistically significant.
The results of these estimations help to identify the indicators
that best reflect household standards of living. Their use within a
predictive model immediately makes it possible to identify the poor and
vulnerable among the total population by simply observing the 16 fixed
indicators as well as the area and region of residence.

A f r i c a n D e v e l o p m e n t B a n k
21
W o r k i n g P a p e rRegional Department for
North Africa
2 0 1 6 • w w w . a f d b . o r g
AfDB
Table 1: PMT Estimation
VARIABLES Total Population 1st Quartile Households
Roof -0.0477(0.0391)
0.0266(0.0467)
Wall -0.0583(0.0425)
-0.000467(0.0491)
Flooring -0.106**(0.0444)
-0.0173(0.0484)
Lighting -0.141**(0.0593)
0.0884(0.0574)
Water -0.0466(0.0371)
-0.00964(0.0468)
Toilet -0.194***(0.0568)
-0.100*(0.0553)
Fuel -0.0295(0.0570)
0.0233(0.0619)
Comfort -0.193***(0.0499)
-0.0988*(0.0512)
Type of Housing -0.162***(0.0548)
-0.171***(0.0604)
Land -0.253***(0.0401)
-0.0916**(0.0459)
Informal -0.337***(0.0337)
-0.0382(0.0779)
Disabled 0.0501**(0.0243)
-0.0341(0.0318)
No Primary 0.0659**(0.0263)
-0.0177(0.0372)
Dependency -0.244***(0.0466)
-0.186***(0.0521)
Overcrowding 0.244**(0.111)
-0.0305(0.267)
Widow -0.138***(0.0316)
-0.0976**(0.0406)
Rural 0.0962**(0.0413)
0.0383(0.0552)
Constant 11.01***(0.0367)
10.01***(0.0810)
Observations 1997 497
R-squared 0.1950.088
(standard deviation in brackets)
*** p<0.01, ** p<0.05, * p<0.10
The results of these estimations help to identify the indicators that
best reflect household standards of living. Their use within a
predictive model immediately makes it possible to identify the
poor and vulnerable among the total population by simply
observing the 16 fixed indicators as well as the area and region
of residence.

A f r i c a n D e v e l o p m e n t B a n k
22
AfDBW o r k i n g P a p e r
Regional Department forNorth Africa
2 0 1 6 • w w w . a f d b . o r g
V. How to improve targeting? Proposal of a new method
1. Combination of the Proxy Means Test and the MultipleDeprivation Method to ensure better targeting
a. Description
The minor shortcoming of the PMT approach is that it does not place
sufficient emphasis on deprivations, which are the starting point
for the INDH transfer policy. To more effectively re-channel resources
to households experiencing deprivations (in keeping with the conclusions
of the Indonesian experience) and to ensure that these households are
correctly targeted (thereby minimizing exclusion errors), it is proposed
to combine the Proxy Means Test (PMT) approach with the results of
the multiple deprivation approach (AfDB, 2014b).).
To that end, we normalize the index obtained using the PMT method
by multiplying it by an index inversely proportional to the percentage of
weighted deprivations. This gives:
Adjusted PMT = PMT index *(1– weighted deprivation index)
This index places even greater emphasis on households suffering from
a significant level of deprivation by proportionally lowering the value of
the PMT index.
b. Performance of the proposed index
As previously mentioned, the decision-maker is split between dual
objectives: that of reducing poverty and that of reducing deprivations.
In this analysis, we propose to adopt the methodology that will result
in the best compromise between these two objectives so that the
population as a whole has a deeper understanding of the strategy
adopted for social transfers and more readily accepts any possible
injustices.
To do so, we will compare the performance of the two previously
described methodologies and our new method (in keeping with the
conclusion that we compare with the approach confined to total
monetary expenditure as the main indicator of living standards) regarding:
(a) identification of the poor from a monetary standpoint; and (b)
identification of those suffering most from deprivations.
The three methodologies result in the classification of all the families in the
sample by order of eligibility for social assistance. We will then look at that
part of the population we wish to target and classified among the very first
beneficiaries according to a given methodology. This will enable us to
understand the origin of exclusion errors and the effectiveness of a given
method in identifying a family that is poor or suffering deprivation. We will
also consider the part of the population that should not be affected by the
transfer mechanism – included among the highest ranked in the classification.
This will give us the inclusion errors – and the effectiveness of the methodology
in not transferring assistance to those who do not need it.
The study's recommendation is to use a multidimensional indicator
when classifying households by order of eligibility for social assistance.
By only considering the level of income (monetary income), some
deprivations that reflect the precariousness of household living conditions
will not be taken into account. This will result in poor targeting. The
Indonesian experience in this area correctly stresses that consideration
of deprivations will create greater social stability.
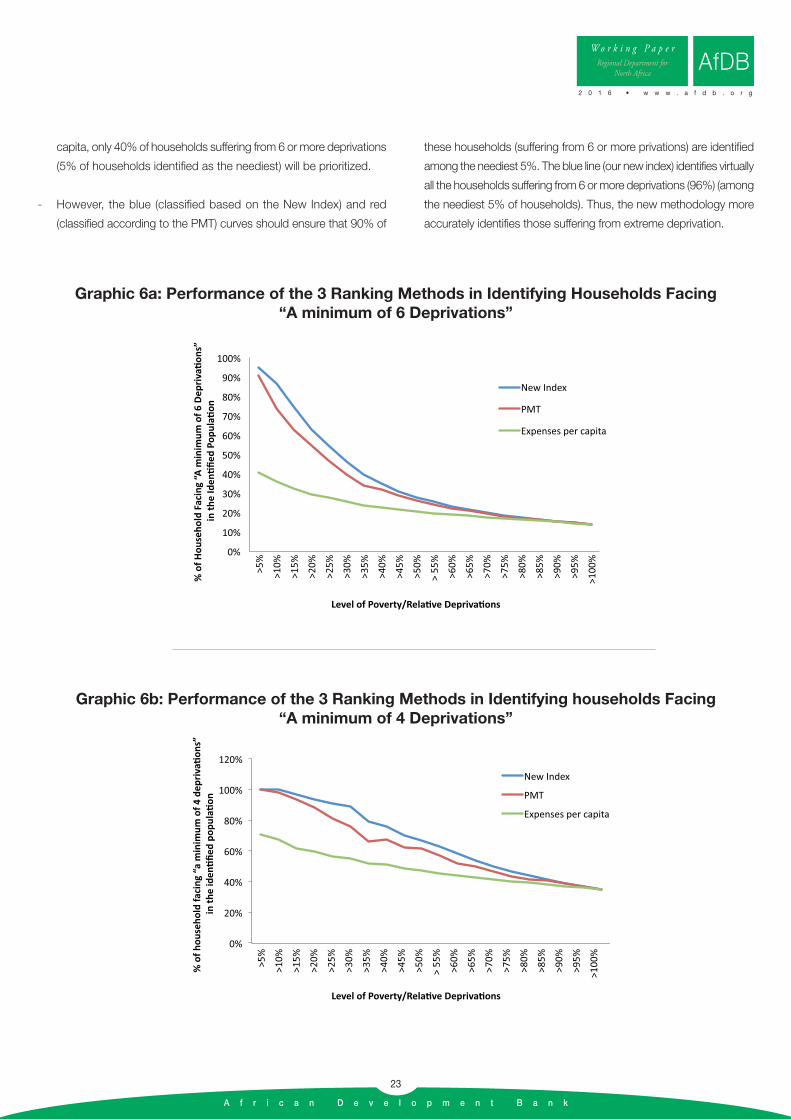
Graphs 6a, 6b and 6c show on the x-axis the 'different relative poverty
lines' defined by the three indices (for example'<5%' means the 5% of
households identified as being the neediest according to the method
retained,'<20%' means the 20% of households identified as being the
neediest according to the method retained). Where total expenditure is
used, the relative poverty threshold is referred to. However, when the PMT
index or the new index is used, we refer to the relative deprivation index.
The curves of the three graphs are decreasing because the broader
the poverty/deprivation line, the fewer the needy households, and
consequently the percentage of households actually suffering from
deprivation or poverty will decline among this assisted population
identified by the different methodologies.
Graph 6a, shows the performance of the different methods regarding
the identification of individuals suffering from 'over six deprivations'
according to the three types of household deprivations (classification
in ascending order of 'expenditure per capita' (in green), the PMT index
(in red) and our new index (in blue)).
- The green curve (classification according to expenditure per capita)
shows that, if households are classified based on expenditure per
A f r i c a n D e v e l o p m e n t B a n k
23
W o r k i n g P a p e rRegional Department for
North Africa
2 0 1 6 • w w w . a f d b . o r g
AfDB
capita, only 40% of households suffering from 6 or more deprivations
(5% of households identified as the neediest) will be prioritized.
- However, the blue (classified based on the New Index) and red
(classified according to the PMT) curves should ensure that 90% of
these households (suffering from 6 or more privations) are identified
among the neediest 5%. The blue line (our new index) identifies virtually
all the households suffering from 6 or more deprivations (96%) (among
the neediest 5% of households). Thus, the new methodology more
accurately identifies those suffering from extreme deprivation.
0%
10%
20%
30%
40%
50%
60%
70%
80%
90%
100%
>5%
>10%
>15%
>20%
>25%
>30%
>35%
>40%
>45%
>50%
> 55
%
>60%
>65%
>70%
>75%
>80%
>85%
>90%
>95%
>100
%
% o
f Hou
seho
ld F
acin
g “A
min
imum
of 6
Dep
riva�
ons”
in
the
Iden
�fied
Pop
ula�
on
Level of Poverty/Rela�ve Depriva�ons
New Index
PMT
Expenses per capita
Graphic 6a: Performance of the 3 Ranking Methods in Identifying Households Facing“A minimum of 6 Deprivations”
>5%
>10%
>15%
>20%
>25%
>30%
>35%
>40%
>45%
>50%
> 55
%
>60%
>65%
>70%
>75%
>80%
>85%
>90%
>95%
>100
%
0%
20%
40%
60%
80%
100%
120%
% o
f hou
seho
ld fa
cing
“a m
inim
um o
f 4 d
epriv
a�on
s”
in th
e id
en�fi
ed p
opul
a�on
Level of Poverty/Rela�ve Depriva�ons
New Index
PMT
Expenses per capita
Graphic 6b: Performance of the 3 Ranking Methods in Identifying households Facing“A minimum of 4 Deprivations”

A f r i c a n D e v e l o p m e n t B a n k
24
AfDBW o r k i n g P a p e r
Regional Department forNorth Africa
2 0 1 6 • w w w . a f d b . o r g
Graph 6b shows that of the 5% poorest from a monetary standpoint, 70%
of households suffer from 4 or more deprivations. However, if the classification
is made according to the New Index or PMT, 100% of these households
(suffering from 4 or more deprivations) are among the neediest 5%.
Graph 6c shows that, if the PMT or New Index is used, income alone
is not the only indicator to classify households according to their degree
of deprivation. Several other non-monetary-related indicators are
considered. Consequently the needy households selected by these
indices often include fewer households considered as poor in the
monetary sense. Thus, the 'blue' (classified according to the New Index)
and red (classified according to the PMT index) are situated below the
'green' line (classified according income).
2. Performance in terms of poverty reduction
The INDH uses geographic targeting using a poverty map produced
by HCP. However, since there are no observable standard of living
indicators, this process requires the selection by social workers on
the basis of a field survey of the neediest households to ensure more
effective allocation of the budget earmarked for each locality. Since
there is no standard assessment score, there may be some subjectivity
in the standard of living assessment procedure.
In the following paragraphs, it will be shown that based on the new
score, it is possible to harmonize the household standard of living
assessment processes by the field workers with less subjectivity,
thereby reducing targeting errors.
However, the issue does not only concern the selection of beneficiaries,
but also the amounts to be transferred to the different beneficiaries.
To answer this question, it will be shown that, by adopting the 'imperfect
targeting' procedure which uses estimated poverty gap values,
adequate transfer amounts will be assessed more accurately, thus
resulting in fewer targeting errors. It is then possible to ensure more
progressive targeting procedures for needy households. However,
since the objective is to build on the existing geographic targeting, we
will also consider a scenario that applies our procedure by geographic
area rather than at the national level.
It should also be noted that the amounts fixed by our methodology
should correspond to the total amount of all subsidies and social
assistance received by a household. This amount would then be
allocated using existing allocation instruments utilised by the different
programmes for targeting the poor in Morocco, but based on a new
procedure: (i) identification of priority households for social assistance;
and (ii) and assessment of the transfer amount that each of the identified
households should receive.
>5%
>10%
>15%
>20%
>25%
>30%
>35%
>40%
>45%
>50%
> 55
%
>60%
>65%
>70%
>75%
>80%
>85%
>90%
>95%
>100
%
0%
10%
20%
30%
40%
50%
60%
70%
80%
90%
100%
% o
f hou
seho
ld fa
cing
“m
onet
ary
pove
rty”
in th
e id
en�fi
ed p
opul
a�on
Level of Poverty/Rela�ve Depriva�ons
New Index
PMT
Expenses per capita
Graphic 6c: Performance of the 3 Ranking Methods in Identifying Households Facing“Monetary Poverty”
A f r i c a n D e v e l o p m e n t B a n k
25
W o r k i n g P a p e rRegional Department for
North Africa
2 0 1 6 • w w w . a f d b . o r g
AfDB
a. Scenarios
To work on the basis of a constant central government budget, it is
proposed to remove fuel subsidies and reallocate the amounts saved
to social assistance. Six scenarios are defined:
1. In the absence of identification criteria for the neediest, this amount
will be equally divided between all households. This is called 'uniform
targeting'.
2. Direct assistance will only be allocated to the disadvantaged regions
and the budget will be allocated equally among all the households
in the targeted regions. This is called "uniform geographic targeting".
3. This amount is allocated on the basis of known and perfectly
observed assumed income (by transferring to each household in
the country the amount required by it to close the poverty gap). This
is called 'perfect targeting'. In this case, households only receive
the amount that will bring them up to the level of the poverty line.
4. This amount is allocated in the targeted regions based on known
and perfectly observed assumed income, (by transferring to each
household in the targeted regions the amount required by it to close
the poverty gap). This is called 'perfect geographic targeting'.
5. This amount is allocated based on the deprivation score calculated
by the social worker and is perfectly observed (by closing the poverty
gap for each household by an amount corresponding to the
deprivation score for all households in the country). This is called
'imperfect targeting'.
6. This amount is allocated based on the deprivation score calculated
by the social worker and is perfectly observed in a region (by closing
the poverty gap for each household by an amount corresponding
to the deprivation score for all households in the targeted regions).
This is called 'imperfect geographic targeting'.
We have based our approach on statistics from the Court of Auditors'
report (2014), which assesses the amount of subsidies from which car
users benefit (i.e. MAD 2093 per user per year in 2013) converted into
an average subsidy per car (some families have more than one
car, which doubles or triples these families' subsidies). Based on
information on the number of cars in our sample, the average subsidy
is MAD 1929.5 per car.
It is worth noting that the removal of fuel subsidies without transferring
the amounts collected (worst case scenario) only very slightly affects
the poverty and vulnerability rates (respective rate increases of 0.8%
and 1.6%) because, in reality, this subsidy has little impact on the poor
and vulnerable (see Table 2).
b. Results of the different scenarios (with a constant centralgovernment budget):
The results of the simulation, assuming a constant central government
budget (Table 2), show that the use of geographic targeting reduces
absolute poverty rates from 6.10% to 5.65% (i.e. a 7% drop in the
number of the poor). However, by adopting the "PMT_pond" deprivation
score (our 'New Index') in selecting eligible households for social
assistance, the poverty rate falls to 5.15% (i.e. a 22% drop in the number
of the poor), which is close to the perfect targeting poverty rate (4.75%)
(corresponding to a theoretical poverty reduction of 24%).
Similar conclusions are reached by examining the specific vulnerability
rates for the different scenarios. The vulnerability rates thus fall from
12.65% to 11.5% by adopting uniform geographic targeting (i.e. a 9%
drop in the number of poor people). By adopting perfect geographic
targeting, the rates approximate 11.75% (i.e. a theoretical drop of 7%
in the number of poor people) and 11.6% for imperfect geographic
targeting (i.e. an 8% drop in the number of poor people). This draws
our attention to the fact that direct targeting procedures are more effective
for households suffering from extreme deprivations that are unable to
lift themselves out of the extreme poverty which characterizes them. It
is less so in the case of the other poor people.
As required by Moroccan government bodies (Court of Auditors, 2014)
our new methodology will help to improve the social assistance eligibility
criteria and improve beneficiary targeting. Furthermore, the targeting
procedure used will ensure the allocation of more assistance to the
most needy.
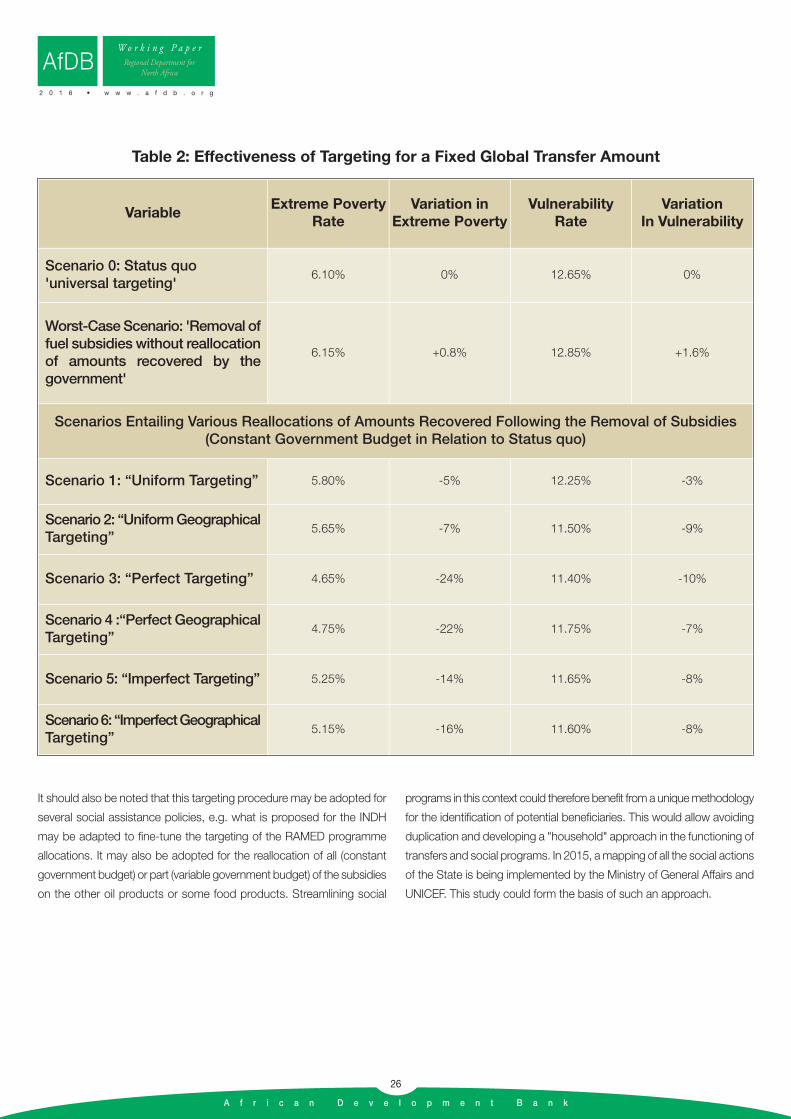
A f r i c a n D e v e l o p m e n t B a n k
26
AfDBW o r k i n g P a p e r
Regional Department forNorth Africa
2 0 1 6 • w w w . a f d b . o r g
Table 2: Effectiveness of Targeting for a Fixed Global Transfer Amount
VariableExtreme Poverty
RateVariation in
Extreme PovertyVulnerability
RateVariation
In Vulnerability
Scenario 0: Status quo 'universal targeting'
6.10% 0% 12.65% 0%
Worst-Case Scenario: 'Removal offuel subsidies without reallocationof amounts recovered by the government'
6.15% +0.8% 12.85% +1.6%
Scenarios Entailing Various Reallocations of Amounts Recovered Following the Removal of Subsidies(Constant Government Budget in Relation to Status quo)
Scenario 1: “Uniform Targeting” 5.80% -5% 12.25% -3%
Scenario 2: “Uniform GeographicalTargeting”
5.65% -7% 11.50% -9%
Scenario 3: “Perfect Targeting” 4.65% -24% 11.40% -10%
Scenario 4 :“Perfect GeographicalTargeting”
4.75% -22% 11.75% -7%
Scenario 5: “Imperfect Targeting” 5.25% -14% 11.65% -8%
Scenario 6: “Imperfect GeographicalTargeting”
5.15% -16% 11.60% -8%
It should also be noted that this targeting procedure may be adopted for
several social assistance policies, e.g. what is proposed for the INDH
may be adapted to fine-tune the targeting of the RAMED programme
allocations. It may also be adopted for the reallocation of all (constant
government budget) or part (variable government budget) of the subsidies
on the other oil products or some food products. Streamlining social
programs in this context could therefore benefit from a unique methodology
for the identification of potential beneficiaries. This would allow avoiding
duplication and developing a "household" approach in the functioning of
transfers and social programs. In 2015, a mapping of all the social actions
of the State is being implemented by the Ministry of General Affairs and
UNICEF. This study could form the basis of such an approach.
A f r i c a n D e v e l o p m e n t B a n k
27
W o r k i n g P a p e rRegional Department for
North Africa
2 0 1 6 • w w w . a f d b . o r g
AfDB
VI. Conclusions
Low income is not the only challenge facing vulnerable households
in Morocco. It is also necessary: (1) to consider their housing and
living conditions; (2) to determine whether they have sufficient capacity
to generate decent income; and (3) to consider the ratio of non-active
individuals in each household (children, the elderly or the disabled who
cannot work) to active adults. Drawing on the Indian or Indonesian
experiences, this study has summarized these different characteristics
in a single index of multiple deprivation. The IMD has helped to improve
the identification of the factors underpinning chronic poverty and
precariousness suffered by some geographic areas in Morocco.
To address this precariousness which especially affects certain
geographic area, Morocco's National Human Development Initiative
(INDH) has, since 2005, helped to correct some of these distortions
through the geographic targeting of certain urban and rural localities
considered to be the most disadvantaged. It has helped to achieve
significant progress towards improving the population's living conditions.
However, the direct targeting procedure adopted by the INDH does not
fully identify the end beneficiaries. Consequently, social assistance
programmes limited to geographic targeting experience problems of
effective targeting, and their impact on the living conditions of the poor
and vulnerable population does not always match the resources
committed.
The study's objective was to improve targeting within a geographic area
in Morocco using a score combining the Proxy Means Test and the
Index of Multiple Deprivation (IMD). This new score has helped to
establish a more effective household classification according to order
of priority for the different types of assistance recommended by the
Moroccan government. The aim of the approach presented is to identify,
based on the existing context, a series of easily observable and
objectively verifiable indicators that are summarized in a new score that
will identify households with lowest standards of living and suffering
the most deprivations.
In terms of targeting effectiveness, our new index helps to improve
identification of families suffering from multiple deprivations. It is shown
that, if households are only classified by their level of expenditure per
capita, only 40% of households suffering from 6 or more deprivations
would be included among households requiring assistance (5%
of the neediest households). However, by classifying households
in ascending order on our New Index, virtually all (96%) of these
households can be included among the poorest households (among
the neediest 5%).
The results of the simulation (assuming a constant central government
budget) show that the use of geographic targeting reduces absolute
poverty rates from 6.10% to 5.65% (i.e. a 7% drop in the number of
the poor). However, by using our 'New Index' in selecting eligible
households for social assistance, the poverty rate falls to 5.15% (i.e. a
16% drop in the number of the poor), which is close to the perfect
targeting poverty rate (4.75%) (corresponding to a theoretical poverty
reduction of 22%).
The new methodology provides the Moroccan authorities with a
transparent procedure for identifying eligible families that may be used
for selecting the allocation processes for the two types of RAMED cards.
The weighting procedure for income, the score for socio-economic
conditions (as well as its deprivation threshold) in urban areas, and the
score for assets as well as the score for socio-economic conditions
(and their respective thresholds) can be reviewed, which is quite
complicated. In the paper, we have discussed the feasibility of
improvement possibilities, but implementation will require considerable
discussion with the authorities concerned.
A f r i c a n D e v e l o p m e n t B a n k
28
AfDBW o r k i n g P a p e r
Regional Department forNorth Africa
2 0 1 6 • w w w . a f d b . o r g
VII. Bibliography
• Achy Lahcen (2010), "Morrocco’s experience with poverty reduction: Lessons for the Arab World", Carnegie Middle East Center,
Washington, DC .
• African Economic Outlook "Maroc", BAD (2014).
• AlatasVivi, Abhijit Banerjee, Rema Hanna, Benjamin A. Olken, and Julia Tobias, (2012), "Targeting the Poor: Evidence from a Field Experiment
in Indonesia".
• Alatas V., Banerjee A., Hanna R., Olken B., Tobias J., (2012). "How to Target the Poor: Evidence from a Field Experiment in Indonesia".
American Economic Review 2012, 102 (4): 1206–1240.
• Alkire, S. and Foster, J. E. (2011). "Counting and Multidimensional Poverty Measurement". Journal of Public Economics, 95 (7–8), 476–487.
• Banque Africaine de Développement (2011), "Poverty and inequality in Tunisia, Morroco and Mauritania" ADB, Tunis.
• Banque Africaine de Développement (2014), « Subventions alimentaires et aides sociales directes, vers un meilleur ciblage de la pauvreté
monétaire et des privations en Tunisie », ADB, Tunis.
• Banque Mondiale (2007), "Youth - an Undervalued Asset: Towards a New Agenda in the Middle East and North Africa". Note 43372, Département
du Développement Humain, Moyen-Orient et Afrique du Nord, Banque mondiale (MNSHD), Washington DC.
• Banque Mondiale (2012), « Royaume du Maroc, Ciblage et protection sociale : note d’orientation stratégique ». Royaume du Maroc.
• Cours des comptes du royaume du Maroc (2014), "Rapport sur Le système de compensation au Maroc : Diagnostic et propositions de
réforme". Royaume du Maroc.
• IMF (2014) "subsidy Reform in the Middle East and North Africa: Recent Progress and Challenges Ahead", Middle East and Central Asia
Department, International Monetary Fund.
• Government of India (2009) "Report of the expert group to advise the ministry of rural development on the methodology for conducting the
bellow poverty line Census for 11th five year Plan". Ministry of rural development, Krishi bhavan, New Helhi.

A f r i c a n D e v e l o p m e n t B a n k
29
W o r k i n g P a p e rRegional Department for
North Africa
2 0 1 6 • w w w . a f d b . o r g
AfDB
VIII. Annex
Table A1: Deprivation Percentages Broken down by Area and based on Monetary Poverty
Variable population Poor Non-Poor Urban Rural
Roof 29% 48% 28% 11% 57%
Wall 15% 22% 14% 6% 28%
Floor 12% 24% 11% 1% 29%
Water 36% 63% 34% 10% 75%
Lighting 7% 12% 6% 4% 12%
Toilet 6% 17% 5% 2% 13%
Type of Housing 6% 13% 5% 5% 7%
Comfort 9% 23% 8% 5% 14%
Fuel 6% 11% 5% 1% 13%
Informal 83% 98% 82% 76% 94%
Disabled 19% 25% 18% 17% 21%
Land Ownership 17% 39% 16% 0% 43%
Education 43% 32% 44% 52% 30%
Dependency 7% 19% 7% 6% 9%
Overcrowding 1% 1% 1% 1% 2%
Widow (er) 20% 31% 19% 24% 12%
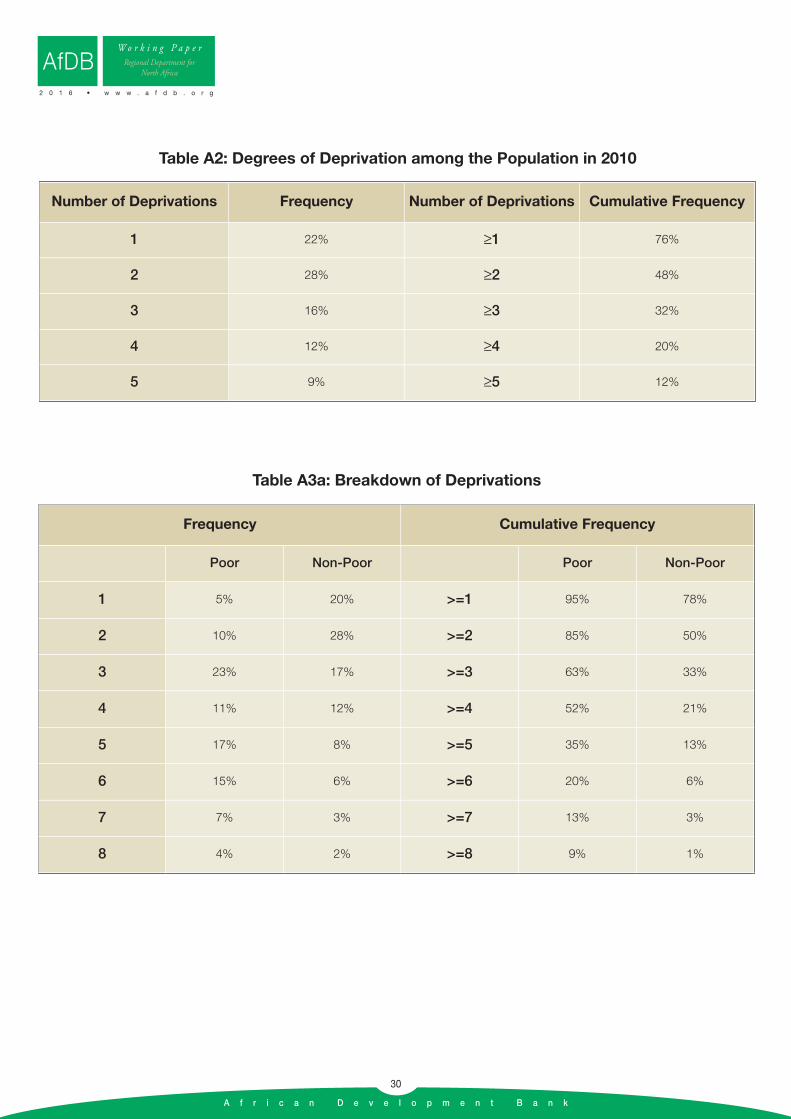
A f r i c a n D e v e l o p m e n t B a n k
30
AfDBW o r k i n g P a p e r
Regional Department forNorth Africa
2 0 1 6 • w w w . a f d b . o r g
Table A2: Degrees of Deprivation among the Population in 2010
Number of Deprivations Frequency Number of Deprivations Cumulative Frequency
1 22% ≥1 76%
2 28% ≥2 48%
3 16% ≥3 32%
4 12% ≥4 20%
5 9% ≥5 12%
Table A3a: Breakdown of Deprivations
Frequency Cumulative Frequency
Poor Non-Poor Poor Non-Poor
1 5% 20% >=1 95% 78%
2 10% 28% >=2 85% 50%
3 23% 17% >=3 63% 33%
4 11% 12% >=4 52% 21%
5 17% 8% >=5 35% 13%
6 15% 6% >=6 20% 6%
7 7% 3% >=7 13% 3%
8 4% 2% >=8 9% 1%
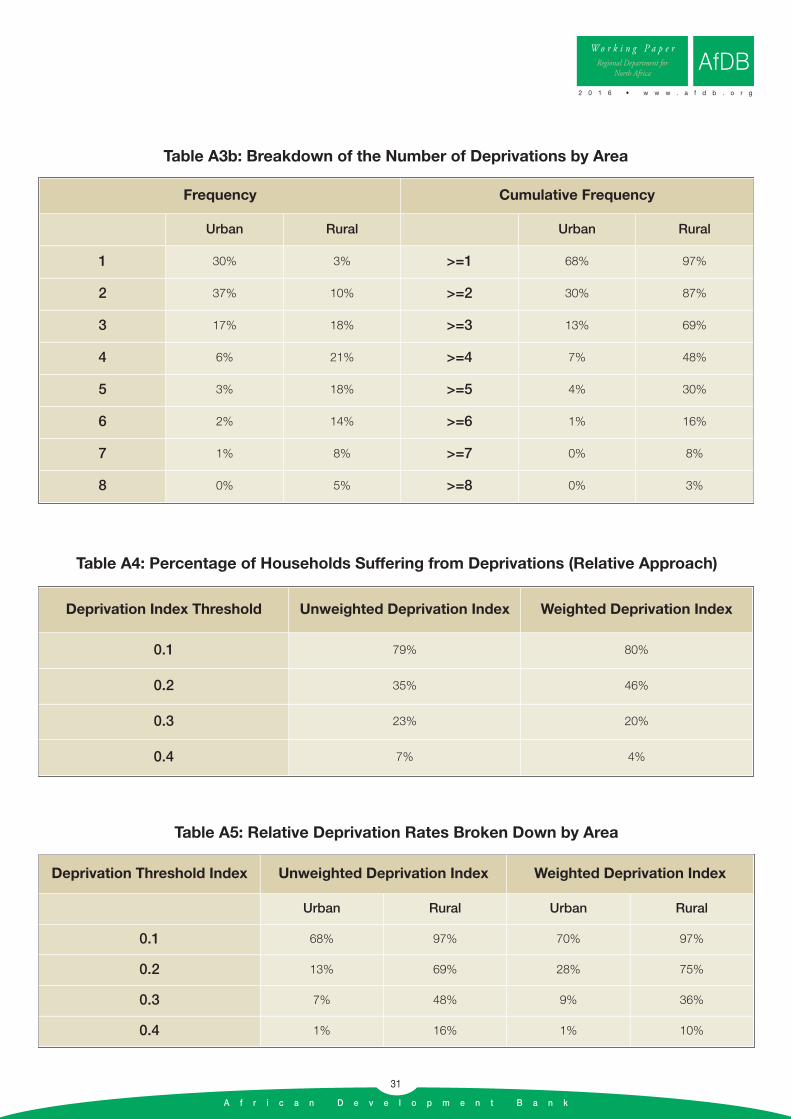
A f r i c a n D e v e l o p m e n t B a n k
31
W o r k i n g P a p e rRegional Department for
North Africa
2 0 1 6 • w w w . a f d b . o r g
AfDB
Table A3b: Breakdown of the Number of Deprivations by Area
Frequency Cumulative Frequency
Urban Rural Urban Rural
1 30% 3% >=1 68% 97%
2 37% 10% >=2 30% 87%
3 17% 18% >=3 13% 69%
4 6% 21% >=4 7% 48%
5 3% 18% >=5 4% 30%
6 2% 14% >=6 1% 16%
7 1% 8% >=7 0% 8%
8 0% 5% >=8 0% 3%
Table A4: Percentage of Households Suffering from Deprivations (Relative Approach)
Deprivation Index Threshold Unweighted Deprivation Index Weighted Deprivation Index
0.1 79% 80%
0.2 35% 46%
0.3 23% 20%
0.4 7% 4%
Table A5: Relative Deprivation Rates Broken Down by Area
Deprivation Threshold Index Unweighted Deprivation Index Weighted Deprivation Index
Urban Rural Urban Rural
0.1 68% 97% 70% 97%
0.2 13% 69% 28% 75%
0.3 7% 48% 9% 36%
0.4 1% 16% 1% 10%

A f r i c a n D e v e l o p m e n t B a n k
© 2010 - AfDB - Design, External Relations and Com
munication Unit/YA
L