advertisement and its impact on consumer buying behaviour...
TRANSCRIPT

Ms. Suganthi Pais et al, International Journal of Pharmaceutical Sciences and Business Management,
Vol.4 Issue. 8, August - 2016, pg. 42-55 ISSN: 2310-6913
42 © 2016, IJPSBM All Rights Reserved, www.ijpsbm.com
ADVERTISEMENT AND ITS IMPACT
ON CONSUMER BUYING BEHAVIOUR
ON HEALTHCARE PRODUCTS IN
BANGALORE CITY 1Dr. K. Nirmala,
2Ms. Suganthi Pais,
1Associate Professor, Bangalore Central College, Bangalore.
2Assistant Professor, SJCC Bangalore
Abstract: -
Advertisement is a powerful medium of mass communication, particularly TV advertisement. The need and
importance of advertisement is increasing day by day because of mass production. All the companies want their
products to be at the top in the market so the companies spend maximum on advertising, marketing and
promoting their products. This project deals with the study on “Advertisement and its impact on consumer
buying behaviour on healthcare products in BANGALORE CITY”. The objective of the study is to analyse the
impact of TV advertisements on healthcare products and the factors influencing the customers buying behaviour
on healthcare product. The research design undertaken for the study was descriptive research and convenience
sampling method is used and the sample size consist of 100 respondents. Simple percentage method, chi-square
analysis, weighted average method and Correlation method was used to analyze the data collected and the
results of the study shows that the advertisements has both positive and negative impact on the customers
buying behaviour and most of the time advertisements mislead the customers in choosing their products.
Introduction:
Advertisements are messages paid for by those who send them and are intended to inform or influence people
who receive them. Advertising is always present, though people may not be aware of it. It includes the name of
a product or service and how that product or service could benefit the consumer, to persuade potential customers
to purchase or to consume that particular brand. Modern advertising developed with the rise of mass production
in the late 20th and early 21st centuries. In today's world, advertising uses every possible media to get its
message through. Commercial advertisers often seek to generate increased consumption of their products or
services through branding, which involves the repetition of an image or product name in an effort to associate
related qualities with the brand in the minds of consumers. It does this via television, print (newspapers,
magazines, journals etc), radio, press, internet, direct selling, hoardings, mailers, contests, sponsorships, posters,
clothes, events, colours, sounds, visuals and even people (endorsements). Advertising may be placed by an
advertising agency on behalf of a company or other organization.
The advertising industry is made of companies that advertise, agencies that create the advertisements, media that
carries the ads, and a host of people like copy editors, visualizers, brand managers, researchers, creative heads
and designers who take it the last mile to the customer or receiver. A company that needs to advertise itself
and/or its products hires an advertising agency. The company briefs the agency on the brand, its imagery, the
ideals and values behind it, the target segments and so on. The agencies convert the ideas and concepts to create

Ms. Suganthi Pais et al, International Journal of Pharmaceutical Sciences and Business Management,
Vol.4 Issue. 8, August - 2016, pg. 42-55 ISSN: 2310-6913
43 © 2016, IJPSBM All Rights Reserved, www.ijpsbm.com
the visuals, text, layouts and themes to communicate with the user. After approval from the client, the ads go on
air, as per the bookings done by the agency's media buying unit.
Non - commercial advertisers that spend money to advertise items other than a consumer product or service
include political parties, interest groups, religious organizations and governmental agencies. Non-profit
organizations may rely on free modes of persuasion, such as a public service announcement.
DEFINITION OF ADVERTISING The American Marketing Association defines
Advertising as “any paid form of non-personal presentation and promotion of Ideas, goods or services by an
identified sponsor.”
According to Dunn and Barbon “Advertising is paid, non-personal communication through various media by
business firms, non-profit organizations and individuals who are in some way identified in the advertising
message and who hope to inform or persuade members of a particular audience.”
According to William J. Stanton, "Advertising consists of all the activities involves in presenting to a group, a
non-personal, oral or visual, openly sponsored message regarding disseminated through one or more media and
is paid for by an identified sponsor."
TV ADVERTISEMENTS Television is often called “The King” of the advertising media, since a majority of people spends more hours in
watching TV per day than spending time with any other medium. It combines the use of sight, colour, sound and
motion. TV has proved its persuasive power in influencing human behaviour from time to time. It is popular
than any other media because of its creativity and impact, coverage and cost effectiveness, captivity and
attention, selectivity and flexibility.
The interaction of sight and sound offers tremendous creative flexibility and makes dramatic life like
representation of products possible. TV commercials can be used to convey a mood or image for a brand as well
as to develop emotional or entertaining appeals that help to make dull products appear interesting.
PERSPECTIVES OF TV ADVERTISEMENTS Television is an audio – visual medium because one can both see and hear. This media is best for advertising
and it has widest appeal. Television in our country has become very popular. The position of radio publicity is
now being gradually taken by TV advertising. TV provides a scientific synchronization of features such as
sound, sight, motion and immediateness that no other medium is able to provide so far. That is why, TV is the
best-selling method ever invented.
A variety of techniques are available on TV for the production of commercial messages like live action, puppet
show, cartoons, documentary films and use of music, which can increase the memorability and persuade the
audience to buy the product.
NEED FOR THE STUDY
Though TV advertisements play a major role in making awareness of the products and persuade the public to
purchase it, most of the time it leads to confusion among viewers and consumers and also majority of the
advertisements falls under the category of false or misleading advertisements. The advertisers spend more cost
Ms. Suganthi Pais et al, International Journal of Pharmaceutical Sciences and Business Management,
Vol.4 Issue. 8, August - 2016, pg. 42-55 ISSN: 2310-6913
44 © 2016, IJPSBM All Rights Reserved, www.ijpsbm.com
for advertising their products, particularly in electronic media and most of the time the advertisements in the
television are continually repeated. But to what extent the advertisements have reached the customers is
unknown. Hence the study attempts to find out the impact of TV advertisements on consumer buying behaviour
on health care products in Bangalore City.
OBJECTIVES:
1. To classify the various health care products advertised through the electronic medium - television
2. To assess the factors influencing buying behaviour of consumers through advertisement on television.
3. To study the impact of TV advertisement on consumer buying behaviour
RESEARCH METHODOLOGY Research methodology is a way to systematically solve the research problems. It may be understood as a science
of studying how research is done scientifically. It includes the overall research design, the sampling procedure,
data collection method and analysis procedure. In this study, Descriptive research was adopted. Descriptive
research study includes surveys and fact findings enquiries of different kinds, which help the researchers to
describe the present situation that makes the analysis about the impact of TV advertisements and helps to reach
the objectives.
SAMPLING DESIGN Sampling design is to clearly define set of objects, technically called the universe to be studied. A sampling
design is a definite plan for obtaining a sample from the given population.
SAMPLE SIZE & SAMPLING METHOD The sample size consists of 100 respondents. Convenience sampling method under Non-Probability sampling
was employed in selecting the sample.
DATA COLLECTION METHODS The present study covers both primary as well as secondary data.
A) PRIMARY DATA It is the first hand information which is being collected by the researcher. In this study the primary data was
collected through structured questionnaire.
B) SECONDARY DATA Besides the primary data, the secondary data was also collected for the study. Websites, books, leading journals
and magazines were referred for this purpose to facilitate proper understanding of the study.
CLASSIFICATION OF HEALTH CARE PRODUCTS:
Hair – shampoo, dyes, oil, conditioners
Skin – soaps, lotions, scrubs, face packs, shaving cream and machines
Body – health drinks, vitamins and supplements, sanitary products
TOOLS FOR ANALYSIS Data collected through Research Schedule were presented in a master table. From the master table sub tables
were prepared. In order to do analysis and interpretation of the data simple statistical tools like Simple Percentage analysis, Chi–Square test, Weighted Average method and Henry Garett Ranking method are used.

Ms. Suganthi Pais et al, International Journal of Pharmaceutical Sciences and Business Management,
Vol.4 Issue. 8, August - 2016, pg. 42-55 ISSN: 2310-6913
45 © 2016, IJPSBM All Rights Reserved, www.ijpsbm.com
CHI-SQUARE TEST Chi-Square test enables the researcher to find out whether the divergence between expected and actual
frequencies is significant or not. The following formula can be used for calculating chi-square value.
∑ (O -E)^2
Chi-square test= ___________
E
Where,
O – Observed Frequency
E – Expected Frequency
WEIGHTED AVERAGE METHOD Under this method, the respondents are asked to rank their choices. This method involves ranking of the items
given. To secure a ranking of all the items involved, the researches simply total the weights which are given to
each item. The highest weighted score is ranked first and correspondingly the other ranks are assigned.
Weighted Average = ∑WX
∑W
CORRELTATION:
r = ∑ XY
√
LIMITATION OF THE STUDY 1. The Study area was confined to the Bangalore City only.
2. Only selected health care products were taken for the study. 3. The No. of respondents is limited to 100 only.
4. The survey period covered is only between May 2016 to July 2016.
DATA ANALYSIS AND INTERPRETATION The term analysis refers to the computation of certain measures along with searching for patterns of relationship
that exist among data-groups. Interpretation is a search for broader meaning of research findings.
SIMPLE PERCENTAGE METHOD:
TABLE: 1 SHOWING DEMOGRAPHIC FACTORS OF THE RESPONDENTS
Factors Particulars No. of Respondents Percentage
Gender Male 58 58
Female 42 42
Total 100 100
Age 20 - 25 37 37
25 - 30 45 45
30 - 35 18 18
Total 100 100
Ms. Suganthi Pais et al, International Journal of Pharmaceutical Sciences and Business Management,
Vol.4 Issue. 8, August - 2016, pg. 42-55 ISSN: 2310-6913
46 © 2016, IJPSBM All Rights Reserved, www.ijpsbm.com
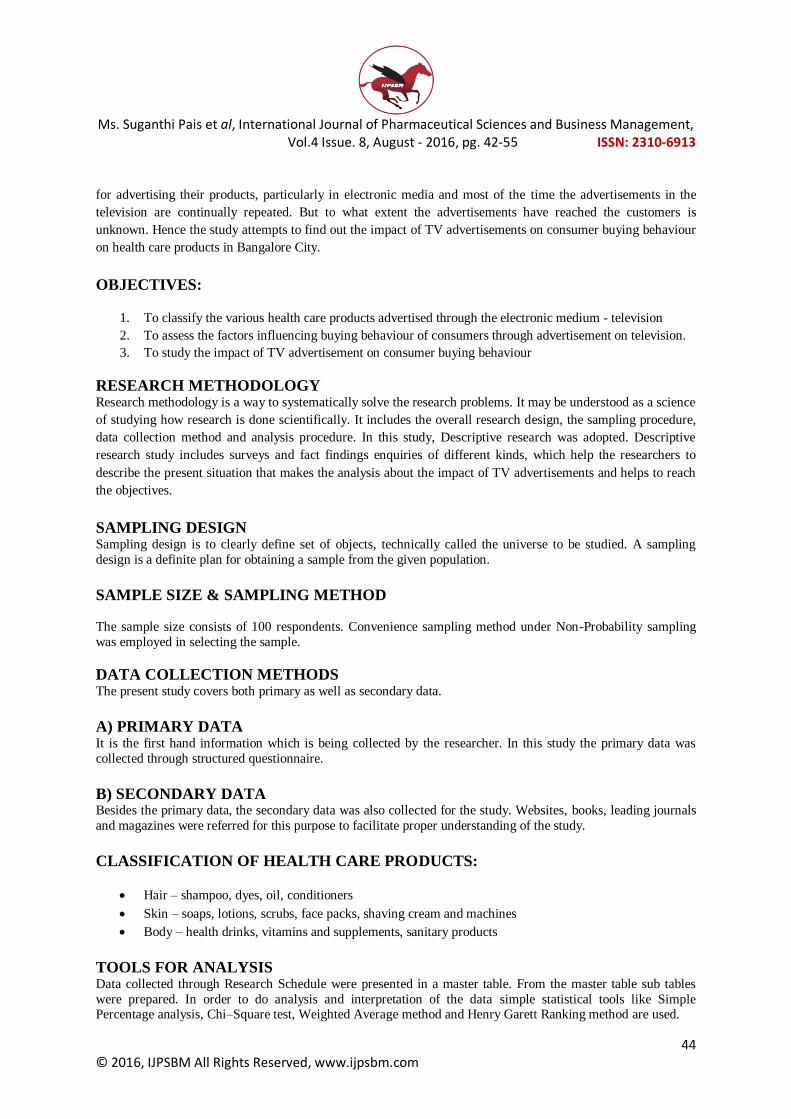
Marital Status Married 24 24
Single 76 76
Total 100 100
Educational Qualification School 04 04
Under Graduate 63 63
Post Graduate 24 24
Others 09 09
Total 100 100
Income 50 - 1,00,000 p.a 67 67
1,00,000 -
3,00,000 p.a 19 19
3,00,000 and
above 14 14
Total 100 100
Occupation Student 62 62
Student & Part-
time Job 05 05
Part-time Job - -
Own Business 20 20
House Wife 04 04
Others 09 09
Total 100 100
Source: Primary Data
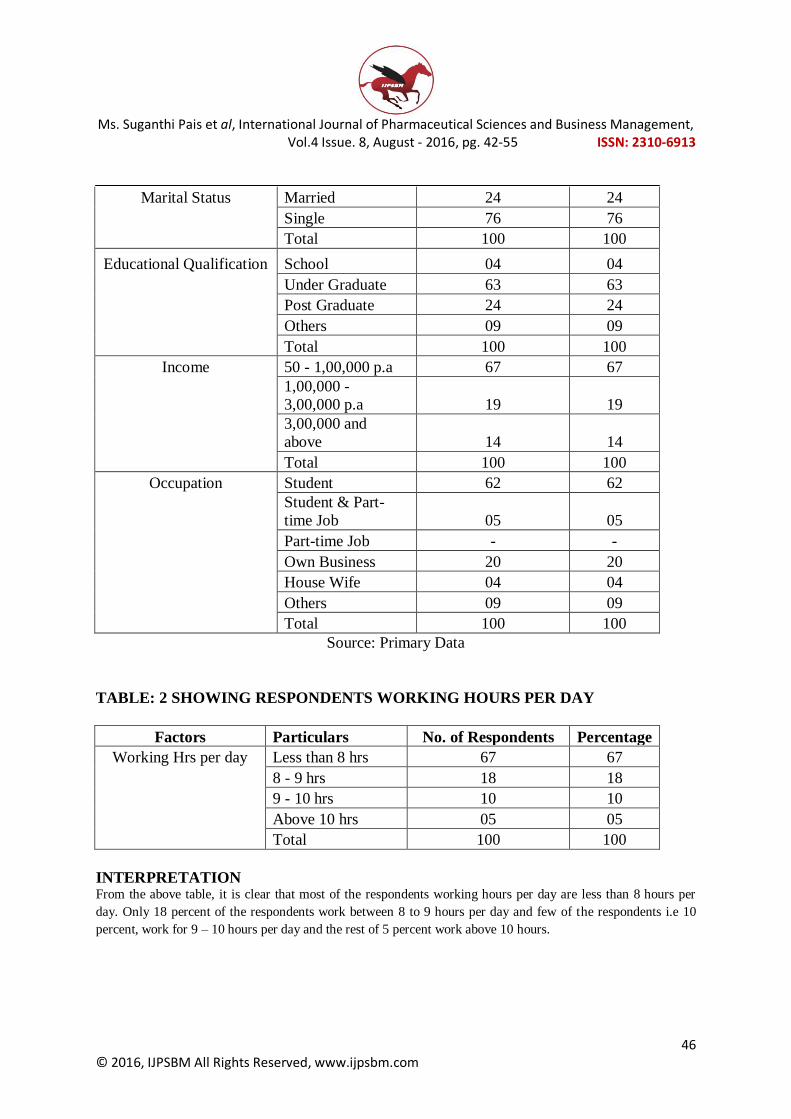
TABLE: 2 SHOWING RESPONDENTS WORKING HOURS PER DAY
Factors Particulars No. of Respondents Percentage
Working Hrs per day Less than 8 hrs 67 67
8 - 9 hrs 18 18
9 - 10 hrs 10 10
Above 10 hrs 05 05
Total 100 100
INTERPRETATION From the above table, it is clear that most of the respondents working hours per day are less than 8 hours per
day. Only 18 percent of the respondents work between 8 to 9 hours per day and few of the respondents i.e 10
percent, work for 9 – 10 hours per day and the rest of 5 percent work above 10 hours.

Ms. Suganthi Pais et al, International Journal of Pharmaceutical Sciences and Business Management,
Vol.4 Issue. 8, August - 2016, pg. 42-55 ISSN: 2310-6913
47 © 2016, IJPSBM All Rights Reserved, www.ijpsbm.com
TABLE: 3 SHOWING RESPONDENTS WAY OF SPENDING REST TIME
Factors Particulars No. of Respondents Percentage
Spending rest of the Time Sleep 27 27
Watch TV 48 48
Chat 11 11
Play Games 05 05
Read Books 06 06
Others 03 03
Total 100 100
INTERPRETATION From the above table, the researcher identifies that majority of the respondents i.e 48 percent watch TV and 27
percent sleep during their rest time. Some of the respondents i.e 11 percent spend their rest time by means of
chatting, 5 percent by playing, 6 percent by reading books and only 3 percent of respondents belong to other
category.
TABLE: 4 SHOWING TIME SPEND BY RESPONDENTS ON WATCHING TV PER
DAY
Factors Particulars No. of Respondents Percentage
Time Spend Watching TV Less than 1 hr 07 07
1 - 2 hrs 45 45
2 - 3 hrs 38 38
Above 3 hrs 10 10
Total 100 100
INTERPRETATION The above table reveals that all of the respondents daily spend time for watching TV and among that majority of
the respondents daily spend 1 – 2 hours for watching TV and the next highest is between 2 – 3 hours.
TABLE: 5 SHOWING AWARENESS OF HEALTH CARE PRODUCTS IN THE
MARKET
Awareness Respondents Percentage
Yes 100 100
No - -
Total 100 100
INTERPRETATION: The above table shows that all the respondents are aware about the different health care products in the market.
TABLE: 6 SHOWINGSWARENESS OF THE DIFFERENT HEALTH CARE
PRODUCTS

Ms. Suganthi Pais et al, International Journal of Pharmaceutical Sciences and Business Management,
Vol.4 Issue. 8, August - 2016, pg. 42-55 ISSN: 2310-6913
48 © 2016, IJPSBM All Rights Reserved, www.ijpsbm.com
CATEGORY PRODUCTS RESPONDENTS PERCENTAGE
Hair Shampoo 100 25
Dyes 100 25
Oil 100 25
Conditioners 100 25
Total 400 100
Skin Soaps 100 20
Lotions 100 20
Scrubs 100 20
Face packs 100 20
Shaving Creams and
Machines 100 20
Total 500 100
Body Health Drink 100 33.33
Vitamins and Supplements 100 33.33
Sanitary products 100 33.33
Total 300 100
INTERPRETATION: From the above table, it could be interpreted that all the respondents are aware about the different health care
products in the market category wised.
TABLE: 7 SHOWING THE RESPONDENTS ENJOY WATCHING TV
ADVERTISEMENT
Enjoy watching TV ADs Respondents Percentage
Yes 12 12
No 88 88
Total 100 100
INTERPRETATION: The above table shows that majority of the respondents do not enjoy watching TV advertisement as they feel it
is a disturbance between the TV program.
CORRELATION:
TABLE: 8 SHOWING THE EFFECT OF ADVERTISEMENT AND PRICE ON
BUYING BEHAVIOUR

Ms. Suganthi Pais et al, International Journal of Pharmaceutical Sciences and Business Management,
Vol.4 Issue. 8, August - 2016, pg. 42-55 ISSN: 2310-6913
49 © 2016, IJPSBM All Rights Reserved, www.ijpsbm.com
CATEGORY PRODUCTS OPTIONS ADVERTISEMENT PRICE
Hair Shampoo YES 64 91
NO 36 9
Total 100 100
Dyes YES 64 91
NO 36 9
Total 100 100
Oil YES 31 68
NO 69 32
Total 100 100
Conditioners YES 45 91
NO 55 9
Total 100 100
Skin Soaps YES 64 55
NO 36 45
Total 100 100
Lotions YES 57 91
NO 43 9
Total 100 100
Scrubs YES 64 91
NO 36 9
Total 100 100
Face Packs YES 64 91
NO 36 9
Total 100 100
Shaving Cream &
Machine YES 64 37
NO 36 63
Total 100 100
Body Health Drink YES 59 84
NO 41 16
Total 100 100
Vitamins & Supplements YES 21 26
NO 79 74
Total 100 100
Sanitary Products YES 64 12
NO 36 88
Total 100 100
Ms. Suganthi Pais et al, International Journal of Pharmaceutical Sciences and Business Management,
Vol.4 Issue. 8, August - 2016, pg. 42-55 ISSN: 2310-6913
50 © 2016, IJPSBM All Rights Reserved, www.ijpsbm.com
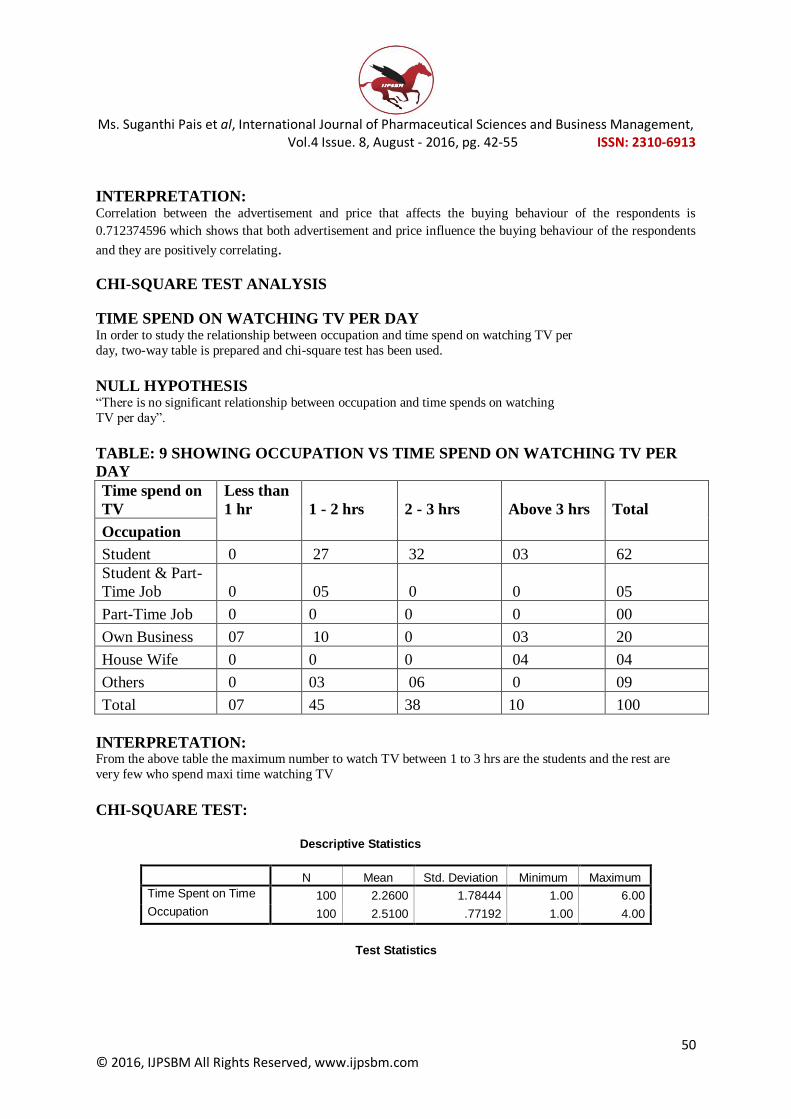
INTERPRETATION: Correlation between the advertisement and price that affects the buying behaviour of the respondents is
0.712374596 which shows that both advertisement and price influence the buying behaviour of the respondents
and they are positively correlating.
CHI-SQUARE TEST ANALYSIS
TIME SPEND ON WATCHING TV PER DAY In order to study the relationship between occupation and time spend on watching TV per
day, two-way table is prepared and chi-square test has been used.
NULL HYPOTHESIS “There is no significant relationship between occupation and time spends on watching
TV per day”.
TABLE: 9 SHOWING OCCUPATION VS TIME SPEND ON WATCHING TV PER
DAY
Time spend on
TV
Less than
1 hr 1 - 2 hrs 2 - 3 hrs Above 3 hrs Total
Occupation
Student 0 27 32 03 62
Student & Part-
Time Job 0 05 0 0 05
Part-Time Job 0 0 0 0 00
Own Business 07 10 0 03 20
House Wife 0 0 0 04 04
Others 0 03 06 0 09
Total 07 45 38 10 100
INTERPRETATION: From the above table the maximum number to watch TV between 1 to 3 hrs are the students and the rest are
very few who spend maxi time watching TV
CHI-SQUARE TEST:
Descriptive Statistics
N Mean Std. Deviation Minimum Maximum
Time Spent on Time 100 2.2600 1.78444 1.00 6.00
Occupation 100 2.5100 .77192 1.00 4.00
Test Statistics

Ms. Suganthi Pais et al, International Journal of Pharmaceutical Sciences and Business Management,
Vol.4 Issue. 8, August - 2016, pg. 42-55 ISSN: 2310-6913
51 © 2016, IJPSBM All Rights Reserved, www.ijpsbm.com
Time Spent
on Time Occupation
Chi-Square(a,b)
118.300 44.720
df 4 3
Asymp. Sig. .000 .000
a 0 cells (.0%) have expected frequencies less than 5. The minimum expected cell frequency is 20.0. b 0 cells (.0%) have expected frequencies less than 5. The minimum expected cell frequency is 25.0.
Ho – is Rejected
The above table shows that calculated value is lesser than 0.05. Therefore the hypothesis is rejected.
RESULT So there is a significant relationship between occupation and time spends on watching TV
AGE VS INTEREST IN WATCHING TV ADVERTISEMENTS In order to study the relationship between age and interest in watching TV advertisements, two-way table is
prepared and chi-square test has been used.
NULL HYPOTHESIS “There is no significant relationship between age and interest in watching TV advertisements”.
own businessPart_time JobStudent & Part-Time Job
Student
Occupation
40
30
20
10
0
Cou
nt
6.00
5.00
Above 3 hrs
1 - 2 hrs
Less than 1 Hr
Time Spent on Time
Bar Chart

Ms. Suganthi Pais et al, International Journal of Pharmaceutical Sciences and Business Management,
Vol.4 Issue. 8, August - 2016, pg. 42-55 ISSN: 2310-6913
52 © 2016, IJPSBM All Rights Reserved, www.ijpsbm.com
TABLE: 10 SHOWING AGE VS INTEREST IN WATCHING TV
ADVERTISEMENTS
Interest Yes No Total
Age
20 - 25 20 47 67
25 - 30 11 12 23
30 - 35 02 08 10
Total 33 67 100
INTERPRETATION: According to the above table, majority of the respondents are not interested in watching TV advertisements in
which 47% of the respondents are below 25 years category, 12% of the respondents belong to the category of 25
– 30 years, 08% of the respondents belong to the category of 30 -35 years and only 33% out of the total are interested in watching TV advertisements.
Descriptive Statistics
N Mean Std. Deviation Minimum Maximum
age 100 1.4300 .67052 1.00 3.00
interest 100 1.6700 .47258 1.00 2.00
Test Statistics
age interest
Chi-Square(a,b) 53.540 11.560
df 2 1
Asymp. Sig. .000 .001
The above table shows that calculated value is lesser than 0.05. Therefore the hypothesis is rejected.
30 to 3525 to 3020 to 25
age
50
40
30
20
10
0
Coun
t
no
yes
interest
Bar Chart

Ms. Suganthi Pais et al, International Journal of Pharmaceutical Sciences and Business Management,
Vol.4 Issue. 8, August - 2016, pg. 42-55 ISSN: 2310-6913
53 © 2016, IJPSBM All Rights Reserved, www.ijpsbm.com
RESULT So there is a significant relationship between age and interest in watching TV advertisements
WEIGHTED AVERAGE METHOD
TABLE 11 SHOWING THE INFLUENCE OF BRAND AMBASSADORS IN BUYING
BEHAVIOUR
Factors
Weighted average Rank
Model 52.46 4
Movie Stars 45.98 5
Sports Celebrities 72.21 1
Social Activists 58.92 3
Animations 71.96 2
Others 35.33 6
INTERPRETATION:
From the above table, it is clear that sports celebrities influence the majority and followed by
animation which is more popular and social activist, model and others.
TABLE 12 SHOWING THE FACTORS WHICH INFLUENCES MORE IN BUYING
BEHAVIOUR
Factors Weighted average Rank
Discount 76.34 2
Offers 75.67 3
Social concern 68.45 4
Warrants 79.88 1
Attraction 65.33 5
INTERPRETATION:
From the above table, it could interpreted that warrants, discounts and offers play a very
important role in influencing the buying behaviour of the respondents followed by social
concerns and warrants.
TABLE 12 SHOWING THE ADVERTISEMENT MISLEADING THE
RESPONDENTS IN THEIR BUYING BEHAVIOUR
Factors Respondents Percentage
Yes 98 98
No 02 02
Total 100 100
INTERPRETATION:
From the above table, it is found that the majority of the respondents that is 98% feel that
advertisements mislead in deciding their products.

Ms. Suganthi Pais et al, International Journal of Pharmaceutical Sciences and Business Management,
Vol.4 Issue. 8, August - 2016, pg. 42-55 ISSN: 2310-6913
54 © 2016, IJPSBM All Rights Reserved, www.ijpsbm.com
FINDINGS, CONCLUSION AND SUGGESTIONS
FINDINGS
[1] 67% of the respondents income per annum is between Rs. 05 – 1,00,000.
[2] It is clear from the analysis that 67% of the respondents working hours per day are less than 8 hours per
day.
[3] It is identified from the analysis that all the respondents have specific rest time in a day.
[4] The analysis shows that 48% of the respondents said that they watch TV during their rest time.
[5] 45% of the respondents opined that they daily spend 1 – 2 hours for watching TV and 38% 2 -3 hours.
[6] It is found from the analysis that 37% of the respondents are in the age group of 20 -25 and 45% between 25 - 30.
[7] It is observed from the analysis that the majority (88%) of the respondents are not interested in
watching advertisements in TV and only 12% do enjoy.
[8] Majority of the respondents are students who are pursuing their education.
[9] It is found from the analysis that there is a significant relationship between occupation and time spends
on watching TV per day.
[10] It is identified from the analysis that there is a significant relationship between age and interest in
watching TV advertisements.
[11] It is clear from the analysis that the advertisements are more influencing in buying behaviour because
sports celebrities and animations.
[12] The analysis shows that the factors namely Advertisement recall, Confusion to choose the products, Dissatisfaction – After using the product, Interest to watch again has a strong impact on viewers
whereas Angered, immediate purchase, Switch over from old brand and Recommend others to
purchase are the factors which has a less impact on viewers.
[13] Advertisement and price factors are positively correlating between each other which says that they are
highly influential in buying behaviour of the respondents..
[14] Warrants, discounts and offers attract the respondents more in their buying behaviour of a product.
[15] 98% of the respondents felt that most the advertisements are misleading than giving then information
about the products.
[16] Majority of the viewers opined that the advertisements should contain the true message and should not
mislead them and
[17] It is clear from the analysis that the advertisements related to Health Care Products are known to all the respondents only because of advertisements.
CONCLUSION The study was conducted on “Advertisement and its impact on consumer buying behaviour on healthcare
products in BANGALORE CITY”. It reveals that the advertisements are attractive and the viewers were able to
recall the advertisements. But at the same time the viewers opined that the advertisements should be made more
informative, must guide them in a proper way, should avoid misleading and confusing the viewers. The findings
of the study clearly reveal that the advertisements have both positive and negative impact on viewers and to
conclude with the lines of Edgar.A.Shaoff “Advertising is the art of making whole lies out of half-truth”
SUGGESTIONS [1] During the rest time, most of the viewer’s search the New and Quality of Products through TV
Advertisement. Therefore, the Advertising Agency must give moral idea about the products.
[2] Mis-representation of advertisements should not be delivered through Television Channels.
[3] Most of the respondents are aware about various health care products in the market through
advertisements, Hence the advertisement provided should be provided more and more in order to
cover the mass population to keep them aware about the various products in the market and

Ms. Suganthi Pais et al, International Journal of Pharmaceutical Sciences and Business Management,
Vol.4 Issue. 8, August - 2016, pg. 42-55 ISSN: 2310-6913
55 © 2016, IJPSBM All Rights Reserved, www.ijpsbm.com
[4] Most of the viewer’s believe the Television Media produces the standard idea about the products by
both audio and video effect. It may executed by the producers in a positive way to represent the details
about the products or services.
[5] Most of the views felt that the advertisement so provided is misleading by giving wrong messages
which should be avoided in order to increase the satisfaction of the customers with their products.
REFERENCES
TEXT BOOKS C.R.Kothari , Research Methodology, New Age International (P) Ltd., New Delhi, pp.124-145.
R.S.N. Pillai & Bagavathi, Modern Marketing, S.Chand & Company Ltd, New Delhi, pp.65-98.
C.N. Sontakki, Advertising, Kalyani Publishers, New Delhi, pp.12-42.
Frank Jefkins, Advertising, Macmillan India Ltd, New Delhi, pp.46-75.
C.B.Gupta & Vijay Gupta, An Introduction To Statistical Methods, Vikas Publishing
House Private Ltd, New Delhi, pp.176-190.
R. Paneerselvam, Research Methodology, Prentice Hall of India (P) Ltd., New Delhi, pp.144-198.
Sangeeta Sharma & Raghuvir Singh, Advertising: Planning and Implementation, Prentice
Hall of India (P) Ltd., New Delhi, pp.203-240.
Rajeev Batra, John G. Myers & David A. Aaker, Advertising Management, Prentice Hall
Of India (P) Ltd., New Delhi, pp.110-123.
MAGAZINES AND JOURNALS
Business & Management, “Media Indian Outlook”, January 2010, pp.45-67. Business Today, “Most Watched Ads in January 2010”, March 7, 2010, pp.32-45.
Indian Journal of Marketing, “Consumer Perception Towards Different Media Options”,May 2010,
pp.34-65.
Brand Management, “Customer Perception About Celebrity Endorsement In Television
Advertising For Retail Brands”, September & December 2009, pp.23-35.
Zenith international journal of Business Economics and Management Research, “Impact of TV
Advertisements”, December 2011, pp. 219 – 237
Indian Journal of Marketing, “Perception towards Memorability of TV Advertisements”, September
2009, pp.45-65.
WEBSITES
www.advertisements.com
www.tv advertisements.com
www.trendsindia.com
www.managementparadise.com
www.medianewsline.com
www.indiatoday.in