adoption as a social marker: innovation diffusion …
TRANSCRIPT
ADOPTION AS A SOCIAL MARKER:INNOVATION DIFFUSION WITH OUTGROUP
AVERSION
PAUL E. SMALDINO1,∗, MARCO A. JANSSEN2, VICKEN HILLIS3, AND JENNA BEDNAR4
August 28, 2018
Abstract. Social identities are among the key factors driving behavior in complexsocieties. Signals of social identity are known to influence individual behaviors in theadoption of innovations. Yet the population-level consequences of identity signalingon the diffusion of innovations are largely unknown. Here we use both analytical andagent-based modeling to consider the spread of a beneficial innovation in a struc-tured population in which there exist two groups who are averse to being mistakenfor each other. We investigate the dynamics of adoption and consider the role ofstructural factors such as demographic skew and communication scale on population-level outcomes. We find that outgroup aversion can lead to adoption being delayed orsuppressed in one group, and that population-wide underadoption is common. Com-paring the two models, we find that differential adoption can arise due to structuralconstraints on information flow even in the absence of intrinsic between-group differ-ences in adoption rates. Further, we find that patterns of polarization in adoptionat both local and global scales depend on the details of demographic organizationand the scale of communication. This research has particular relevance to widelybeneficial but identity-relevant products and behaviors, such as green technologies,where overall levels of adoption determine the positive benefits that accrue to societyat large.
Keywords: innovation diffusion; polarization; social identity; identity signaling; net-works; agent-based model
1Cognitive and Information Sciences, University of California, Merced2School of Sustainability, Arizona State University, Tempe3Department of Environmental Science and Policy, University of California,
Davis4Department of Political Science, University of Michigan, Ann ArborE-mail address: [email protected].
1
arX
iv:1
507.
0477
5v4
[ph
ysic
s.so
c-ph
] 2
1 Ju
l 201
6

2 SMALDINO, JANSSEN, HILLIS, & BEDNAR
1. Introduction
The adoption of new technologies, products, and behaviors can be influenced byidentity signaling. Consider, as an example, the adoption of hybrid cars. Owners of aToyota Prius are willing to pay a few thousand dollars to signal their green intentions(Sexton & Sexton, 2014). On the other hand anti-environmentalists spend thousandsof dollars to modify their vehicle’s emissions systems to deliberately spew sooty dieselexhaust on electric cars, bicyclists and pedestrians (Weigel, 2014). In 2014, Cadil-lac and Ford capitalized on differences among proponents of hybrid cars, producingadvertisements for their plug-in hybrids that appealed to contrasting values amongcar owners for products with similar functional qualities (Bradford, 2014). Recentexperimental work has additionally highlighted that both adoption and disadoptionof products and other consumptive behaviors are influenced by the perceived socialidentities of previous adopters (Berger & Heath, 2007, 2008; Brooks & Wilson, 2015;Morvinski, Amir, & Muller, 2014). It is therefore clear that social identity should notbe ignored when considering how products diffuse in a population. Nevertheless, therole of identity has been largely absent in models of product diffusion (Peres, Muller,& Mahajan, 2010).
In this paper, we present formal models of product adoption under the influenceof identity signaling and explore the population-level consequences of identity on dif-fusion dynamics1. We examine product adoption as a form of social marking, andhow the emergence of a product’s role in identity signaling influences the diffusion ofinnovations. In particular, we investigate the effect of outgroup aversion on adoption,taking into account the spatial structure of a population and varying scales of commu-nication across distances. In the interest of clarity, we first discuss a simple analyticalmodel that relies on coupled differential equations. This model was first introduced byBakshi et al. (2013); we adapt it for our purposes. We then introduce an agent-basedmodel with explicit spatial structure. A model capable of capturing who interactswith whom, as agent-based models do, is critical for understanding social behaviorbecause the structure of interactions shapes the temporal and categorical dynamicsof social behavior (Boccaletti, Latora, Moreno, Chavez, & Hwang, 2006; Durrett& Levin, 1994; Newman, 2003), including how innovations spread (Abrahamson& Rosenkopf, 1997; Burt, 1980; Davis & Greve, 1997; Delre, Jager, Bijmolt, &Janssen, 2010; Watts & Dodds, 2007). We demonstrate that 1) differential rates ofadoption typically attributed to intrinsic between-group differences in rates of adop-tion can arise simply due to structural constraints on information flow, and 2) thatequilibrium levels of adoption, as well as global and local polarization in adoption,depend heavily on both demographic organization and the scale of communication.
1.1. Identity Signaling and Product Adoption. Identity signaling is the broad-casting of one’s membership in some group or collective, with receivers includingboth fellow members and non-members. Identity signaling is important when multi-ple groups exist in a population and individuals benefit by being correctly identifiedwith their group, as well as by not being mistaken for a member of another group.
1We use the terms “product” and “innovation” interchangeably, as our models apply equallyto innovations, non-innovative products, and any other behavior that can be adopted via socialinfluence.
ADOPTION AS A SOCIAL MARKER 3
The anthropological literature has long characterized arbitrary social markers as crit-ical for coordination when correlations exist between group identity and behavioralnorms (Barth, 1969; McElreath, Boyd, & Richerson, 2003; Moffett, 2013; Wim-mer, 2013). In complex societies such as ours, interactions delineated by socialidentities are ubiquitous (Smaldino, 2017), and social markers are crucial coordina-tion tools. Although social identities are multidimensional and context dependent(Ashmore, Deaux, & McLaughlin-Volpe, 2004; Roccas & Brewer, 2002), in anyparticular context humans appear to have strong instincts to identify with a group,even if the distinguishing factor between ingroup and outgroup is arbitrary (Tajfel,Billig, Bundy, & Flament, 1971).
Although individuals often adopt a product for its intrinsic value, product adoptioncan also be used to distinguish oneself from other groups (Berger & Heath, 2008).When adoption can be observed by others, products may become social markers andserve the role of helping individuals to find appropriate social partners for interactions(McElreath et al., 2003; Smaldino, 2017). For this reason, an individual may be lesslikely to adopt an innovation if it is more strongly associated with an outgroup thanwith their ingroup or with no group at all. Indeed, recent marketing studies suggestthat the identity signaling component of product adoption comes into play even whenthe outgroup does not evoke negative affect, as long as it is seen as dissimilar. Forexample, in one study, Stanford undergraduates evaluated an mp3 player substantiallyless favorably after being told that it was popular with “business executives” (whomthey rated as dissimilar but not disliked) compared with when they were told it waspopular with “individuals” (Berger & Heath 2007, study 4). Conversely, Morvinski etal. (2014) found that information about a large number of previous adopters positivelyinfluenced adoption only if those previous adopters were described as similar to thepotential adopters. In another study, after adopting a charity-affiliated bracelet,students from a “jock” dorm dis-adopted (i.e., stopped wearing the bracelet) when thebracelet started appearing on the wrists of students from the nearby “nerdy” dorm,whom the jocks did not dislike but also did not want to be mistaken for (Berger &Heath 2008, study 2). This latter study also serves to illustrate that products neednot be intrinsically associated with particular social groups, but can emerge as socialmarkers through preferential adoption by one group, for reasons that may be initiallyarbitrary.
1.2. Population Structure and Population Dynamics. The sociological litera-ture has shown that even small differences in opinions, preferences, or product adop-tion can cascade, through the processes of homophily and social influence, into highlypolarized social networks (Axelrod, 1997; Carley, 1991; Flache & Macy, 2011;Mark, 1998). A great deal of research has shown that the structure of those networksaffects exactly how individuals influence, and are influenced by, one another (Abra-hamson & Rosenkopf, 1997; Banerjee, Chandrasekhar, Duflo, & Jackson, 2013;Burt, 1980; Delre et al., 2010; Flache & Macy, 2011; Funk, Gilad, Watkins, &Jansen, 2009; Strogatz, 2001; Watts & Dodds, 2007). As a striking example,conformity across a broad spectrum of lifestyle preferences is seen within clusters ofAmericans identified only by political affiliation, such that arbitrary traits becomemarkers of identity, as with “latte-drinking liberals” and “gun-toting republicans”(DellaPosta, Shi, & Macy, 2015). Although many factors lead to the adoption
4 SMALDINO, JANSSEN, HILLIS, & BEDNAR
of behaviors or technologies, social influence through no other factor than networkproximity can be such a powerful force that some have argued it must be explicitlydiscounted before other cultural or developmental explanations may be considered(DellaPosta et al., 2015; Dow, Burton, & White, 1982; McPherson, 2004).
As a description of the emergence of an initially neutral product becoming stronglyassociated with a particular social identity, consider another example, this time fromthe beer industry. In the 1980s, Pabst Blue Ribbon (PBR) was a relatively unpopularbeer in the United States, loosely associated with the white working class. Then, inthe late 1990s, bars in Brooklyn and Lower Manhattan began offering PBR drinkspecials, attracted by its low price and relative obscurity. The brand gradually be-came associated with urban hipsters, spread to hipster enclaves in Portland and LosAngeles, and has since found widespread adoption in hip youth culture. Without anydirect advertising, adoption as a social marker cascaded. Sold in 1985 for $63 million($141 million in 2015 dollars), PBR was recently sold again in 2014 for an estimated$700 million (Gelles, 2014). Meanwhile, its identity as a “hipster beer” may haveturned at least some people away. As of this writing, the top definition for PBR onurbandictionary.com includes the remark, “Pabst Blue Ribbon is a lot like the bandBright Eyes. Hipsters love it, but everyone else thinks it’s liquid shit.”
A standard model of product adoption invokes status: a social marker describes ademarcation between social elites, who innovate in order to distinguish themselves,and the lower classes, who imitate the elites. This process of chase and flight drivesnew cycles of fashions as the elites continuously attempt to distance themselves fromthe lower classes (Simmel, 1957). However, many cases of adoption or abandonmentof products are not so easily characterized in terms of status. Indeed, innovationsand fashions often originate from among the lower or middle classes (Berger & Heath,2008). Chase and flight dynamics are undoubtedly important in many settings, in-cluding some that don’t involve groups with differing levels of socio-economic status(Bakshi, Hosanagar, & Van den Bulte, 2013). However, products are commonlyused as social markers facilitating preferential interaction with ingroup members onthe part of all groups. Indeed, a large anthropological literature has demonstratedthat, regardless of status, individuals are often better off when they can easily dis-tinguish group members from non-members (Barth, 1969; McElreath et al., 2003;Moffett, 2013; Wimmer, 2013). It is therefore important to examine diffusion dy-namics for scenarios involving general tendencies for outgroup aversion, as suggestedin an influential review by Peres et al. (2010). Such an analysis has hitherto beenmissing from the literature on product adoption.
There are many important factors to consider in the dynamics of innovation adop-tion, and our aim here is not to cover all of them with the veneer of identity signaling.In particular, we will not address multi-brand competition, in which companies sellingsimilar products compete for customers. This type of competition has only recentlybeen the subject of formal modeling, always with the assumption that customers areidentical and brands equivalent (Laciana, Gual, Kalmus, Oteiza-Aguirre, & Rovere,2014; Laciana & Oteiza-Aguirre, 2014; Libai, Muller, & Peres, 2009). Such com-petition entails rich dynamics, influenced by a host of factors such as the timing ofproduct release, the network position of early adopters, and the strength of cross-brand influence (Libai et al., 2009; Libai, Muller, & Peres, 2013). Because the
ADOPTION AS A SOCIAL MARKER 5
interplay between adoption and identity signaling has not been previously modeled,we believe it appropriate to limit our study here to the one-product, one-brand case soas to establish a baseline. Later in this paper, we will discuss multi-brand competitionin light of our results.
1.3. Modeling Approach. We wish to consider how patterns of adoption are influ-enced by outgroup aversion, defined as a desire to not engage in activities associatedwith the outgroup; demographic organization, including network autocorrelation; andthe scale of communication, contrasting local, short-range observations with long-range observations of distant actors. We also examine how these three factors in-fluence patterns of local and global polarization, or the extent to which adoption isskewed towards one group or another, suggesting demographic segregation. In thefollowing sections, we present two models of innovation adoption as a social marker.The first is an analytical model that takes as its starting point the well-known modelof Bass (1969). This was the first model to provide a generative explanation of whymany diffusion processes generate S-shaped adoption curves. We extend this modelto allow for two groups who are averse to products associated with the other group.Such a model is necessarily limited, however, because it assumes perfect populationmixing and therefore cannot account for the influences of structural aspects of de-mography or communication. Focusing on structural influences can provide importantinsights, because micro-level mechanisms frequently aggregate into population-levelconsequences in non-obvious ways (Davis, 2006). To investigate these influences,therefore, we introduce a spatially-structured agent-based model.
Our agent-based model allows for quite a bit more complexity than is afforded bythe analytical model, and thus a direct comparison is not our intention. However, for-malizing the verbal description in two distinct ways provides several benefits. First,while both models illustrate that when products become social markers, outgroupaversion can lead to population-wide underadoption as well as delayed or suppressedadoption among members of one group, each model highlights a distinct causal mech-anism. Second, the analytical model provides a formal link between prior work onthe diffusion of innovations, while the agent-based model that allows us to more fullyexplore our questions of interest. Third, there are often many possible formal instan-tiations of a complex social system. We show that two different formalizations yieldcompatible results, thus providing the beginnings of a triangulation on a robust the-ory of social identity and product adoption. Finally, we also connect our model withthe literature on opinion polarization, examining the factors that lead to differentkinds of polarization in product adoption.
2. Analytical Model
The canonical model of product diffusion was introduced by Bass (1969), and pro-vided a concise explanation of the sigmoidal patterns of diffusion observed by Rogers(1962) and others (Barnett, 2011; Bass, 2004). Bakshi et al. (2013) recently ex-tended Bass’s model to account for product adoption by two interacting groups2. Weadopt their formalism here. For each group, the probability of adoption is influencedby three factors: a background rate of spontaneous adoption, social influence from
2Bakshi et al. refer to these as “segments” of the population.
6 SMALDINO, JANSSEN, HILLIS, & BEDNAR
one’s group members, and social influence from members of the outgroup. The modeltakes the form of coupled differential equations
dN1
dt= (a1 + b1N1 + c1N2)(m1 −N1) (1)
dN2
dt= (a2 + b2N2 + c2N1)(m2 −N2), (2)
where for each group i, ai > 0, bi > 0, mi > 0, and 0 ≤ Ni ≤ mi. Ni is the currentnumber of adopters at time t, out of a potential market of size mi. The remainingterms are the coefficient for innovation, ai, the coefficient for within-group imitation,bi, and the coefficient for cross-group imitation, ci. If both c terms are zero, themodel reduces to two independent instantiations of the Bass (1969) model. Bakshi etal. (2013) took their inspiration from Simmel’s (1904/1957) chase-and-flight theory,and restricted their analyses to cases where cross-group influence was positive for onegroup and negative for the other. Here, we are interested in the scenario where bothgroups want to avoid being associated with the opposite group, and so will rejector even disadopt products that are popular with the opposite group (Barth, 1969;Berger & Heath, 2008; Wimmer, 2013). We therefore focus on the case where bothc1 and c2 are less than zero.
A closed-form solution for this system of equations is not analytically tractablebecause of the coupled dependencies. Moreover, we are heavily interested in demo-graphic and communication effects related to population structure, so we forego acomplete specification of the analytical model system3. However, some numericalanalysis is quite revealing. Our primary interests are in the dynamics of adoptionwhen products are social markers in the case of mutual repulsion, and not in the con-sequences of major between-group differences in within and between-group imitationor market size (though such consequences are surely worthy of future investigation).As such, we focus on scenarios where the two groups are largely identical in theirpropensity for within-group imitation, cross-group imitation, and market size, so thatb1 = b2 = b, c1 = c2 = c, m1 = m2 = m.
We anticipate that three categories of outcomes might emerge from the interactionof outgroup aversion, social influence, and innovation rate. When outgroup aversionis particularly strong it might overcome the force of ingroup imitation entirely andresult in underadoption in both groups. When ingroup imitation outweighs outgroupaversion, we expect adoption to occur, and to be quicker in the group with a higherrate of innovation. To explore these dynamics in more detail and their resultant equi-libria, we vary the strengths of outgroup aversion, ingroup imitation, and innovationrates, as described below. Delayed adoption can occur if outgroup aversion is weakerthan ingroup imitation, |c| < |b|, and the difference between the rates of innovationin each group is small. If innovation rates are equal, a1 = a2, then adoption willincrease at the same rate in both groups, and since ingroup attraction outweighsoutgroup repulsion, both groups will always achieve full adoption at the same time.If, however, the innovation rate is slightly higher in one group, then that group willadopt at an initially faster rate. Even if this advantage in innovation rate in the first
3We provide, as a supplement, a Mathematica notebook for reproducing and altering the plotsshown in Figure 1 to enable a more thorough exploration of the analytical model by the curiousreader.

ADOPTION AS A SOCIAL MARKER 7
0 5 10 15 20 25 30t
20
40
60
80
100{N1(t), N2(t)}
Printed by Wolfram Mathematica Student Edition
(a) Delayed adoption, a1/a2 = 1.14
Time
Adop
tion
Group 1
Group 2
0 5 10 15 20 25 30t
20
40
60
80
100{N1(t), N2(t)}
Printed by Wolfram Mathematica Student Edition
(b) Suppressed adoption, a1/a2 = 1.15
Time
Adop
tion
Group 1
Group 2
0 10 20 30 40 50 60 70t
20
40
60
80
100{N1(t), N2(t)}
0 10 20 30 40 50 60 70t
20
40
60
80
100{N1(t), N2(t)}
Printed by Wolfram Mathematica Student Edition
(c)
Adop
tion
Time
Underadoption (unstable), |b| < |c|
Group 1
Group 2
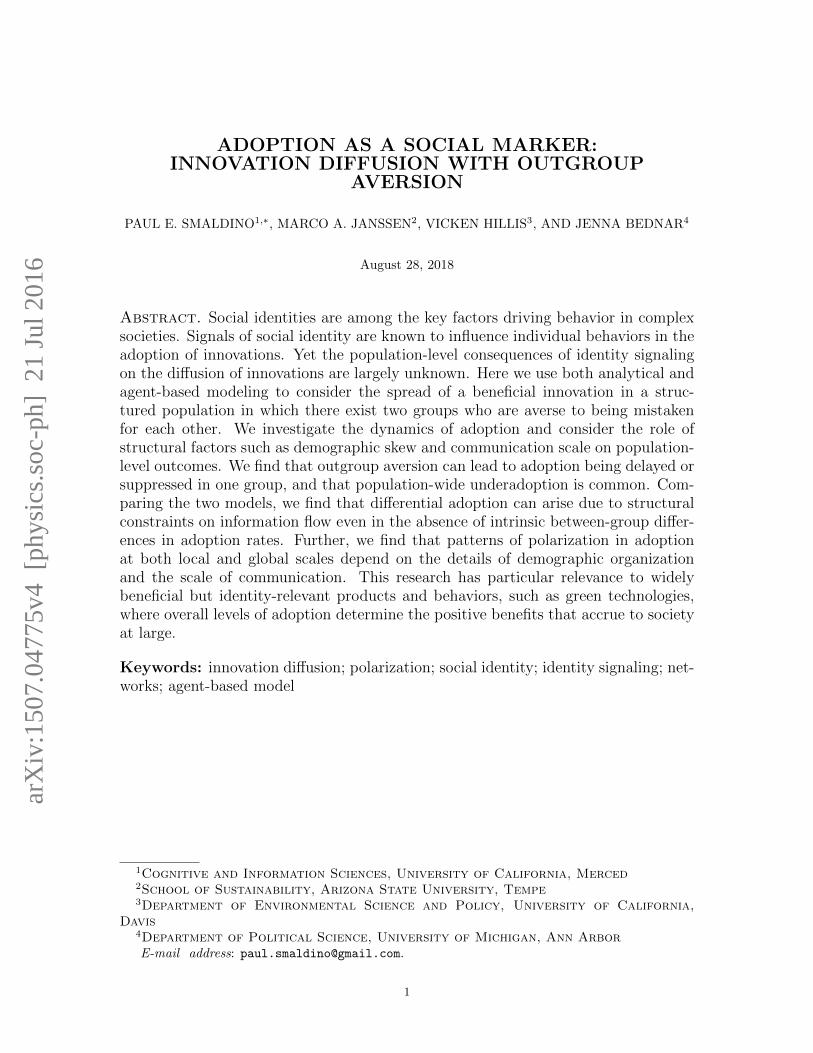
Figure 1. Numerical simulation of the analytical model. For all sim-ulations, a2 = .01, b = .006, m = 100. When ingroup attraction isstronger than outgroup aversion and one group has a higher innovationrate, the group with the lower innovation rate can have delayed (a)or suppressed (b) adoption. For these simulations, c = −.002. Whenoutgroup aversion is stronger than ingroup attraction, an unstable equi-librium of mutual partial adoption can give way to complete adoptionby one group and zero adoption by the other (c). For this simulation,a1 = a2 = .01, c = −.007.
group is small, adoption among members of the second group can be substantiallydelayed (Figure 1a). If this advantage is only slightly larger, however, adoption in thesecond group can be completely suppressed. In our example, shown in Figure 1b, anadvantage of only 15% in innovation rate leads to enough of a disparity in adoptionrates between groups that outgroup aversion comes to completely suppress long-termadoption in the group slower to innovate. Finally, consider if outgroup aversion isstronger than ingroup attraction, |c| > |b|. Whatever group is slower to adopt ini-tially will eventually be entirely suppressed. If both groups innovate at exactly thesame rate, a state of mutual underadoption can occur, in which neither group adoptsat saturation levels. However, such a state is unstable, and even the slightest pertur-bation will lead to full adoption by one group and zero adoption by the other (Figure1c).
This analysis indicates how the Bass (1969) model can be extended to include mu-tually aversive social groups, and that outgroup aversion can lead to delayed adoptionor complete suppression of adoption by one group. Mutual underadoption is possiblebut unstable. Thus, we may begin to investigate the appearance of these trends inthe dynamics of real world adoption.
Our aim is to advance the model from the stylized analytical model in a directionthat better matches reality. The analytical model assumes a well-mixed popula-tion and random interactions among all individuals regardless of group membership.These assumptions are useful as a first approximation but ultimately unsatisfying.Members of different social groups do interact with one another, but individuals of-ten preferentially interact with members of their own social groups (Lazarsfeld &Merton, 1954; McPherson, Smith-Lovin, & Cook, 2001). Moreover, communicationoccurs both locally and occasionally over long distances, and rarely resembles thewell-mixed population implicit in the Bass model. For these reasons, we turn to anagent-based model in order to investigate the effects of structure in demography andcommunication.
8 SMALDINO, JANSSEN, HILLIS, & BEDNAR
Agent-based models involve explicit instantiation of individuals, and through com-puter simulation can explore consequences of heterogeneous individuals interactingin structured populations in ways difficult or impossible for purely mathematical ap-proaches4 (Epstein, 2006; Peres et al., 2010; Rand & Rust, 2011; Smaldino,Calanchini, & Pickett, 2015). We may then see if and when the outcomes generatedby the analytical model occur in the agent-based model, and perform more nuancedanalyses of the dynamics of diffusion.
3. Agent-Based Model
We designed our model not to represent any specific demographic system, butrather as an abstraction representing general properties common to many systems inwhich individuals maintain social networks on which many but not all interactionstake place. The population is structured into discrete patches upon which agents liveand interact. Patches can represent geographic localities, but need not; they simplyconnote any highly clustered interaction network. Inter-patch interactions may alsooccur, representing long-distance effects such as travel, telephone, and social media.A product will be introduced which has some intrinsic appeal. As in the analyticalmodel, the probability of adoption increases with multiple exposures, reflecting so-ciological research on complex contagion (Centola, 2010; Centola & Macy, 2007)as well as marketing research on network externalities, which can increase the utilityof adoption as more people adopt (Peres et al., 2010). However, if an individual’sexperience with the product is such that its adoption is preferentially associated withthe outgroup, adoption becomes less likely. In our analysis we will explore the effectof several parameters, including the importance of identity signaling, the extent ofhomophily in demographic organization, and the influence of long-range interactions.
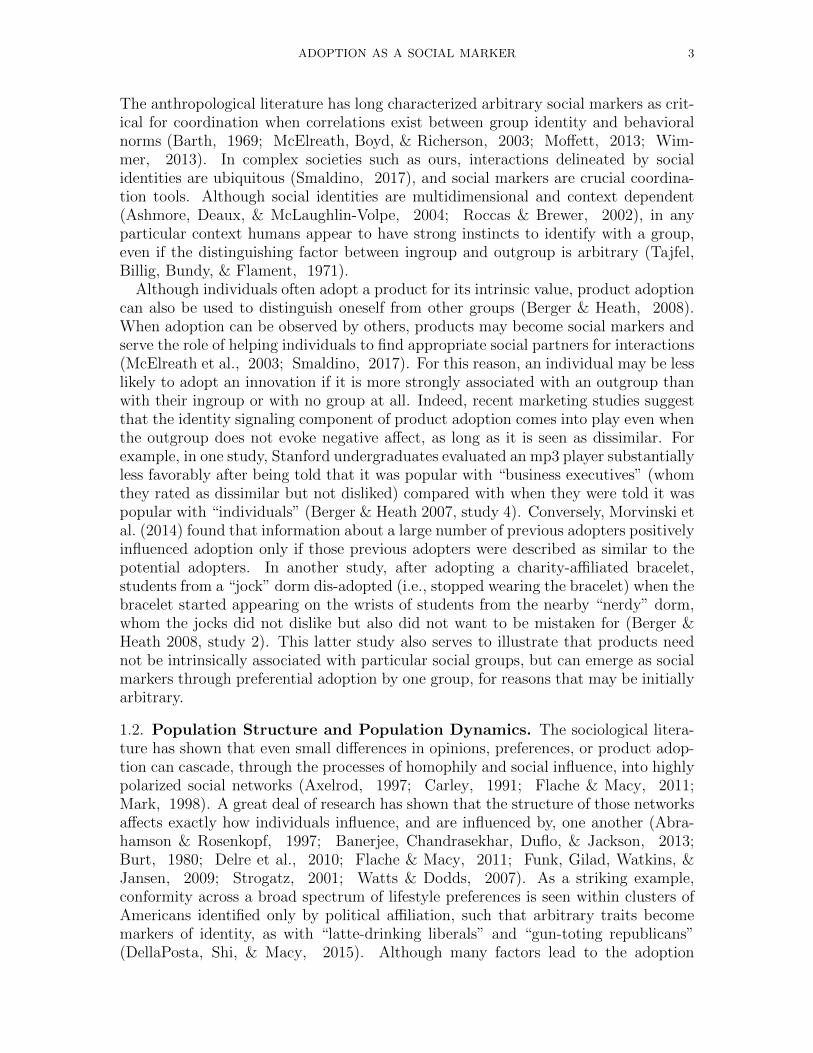
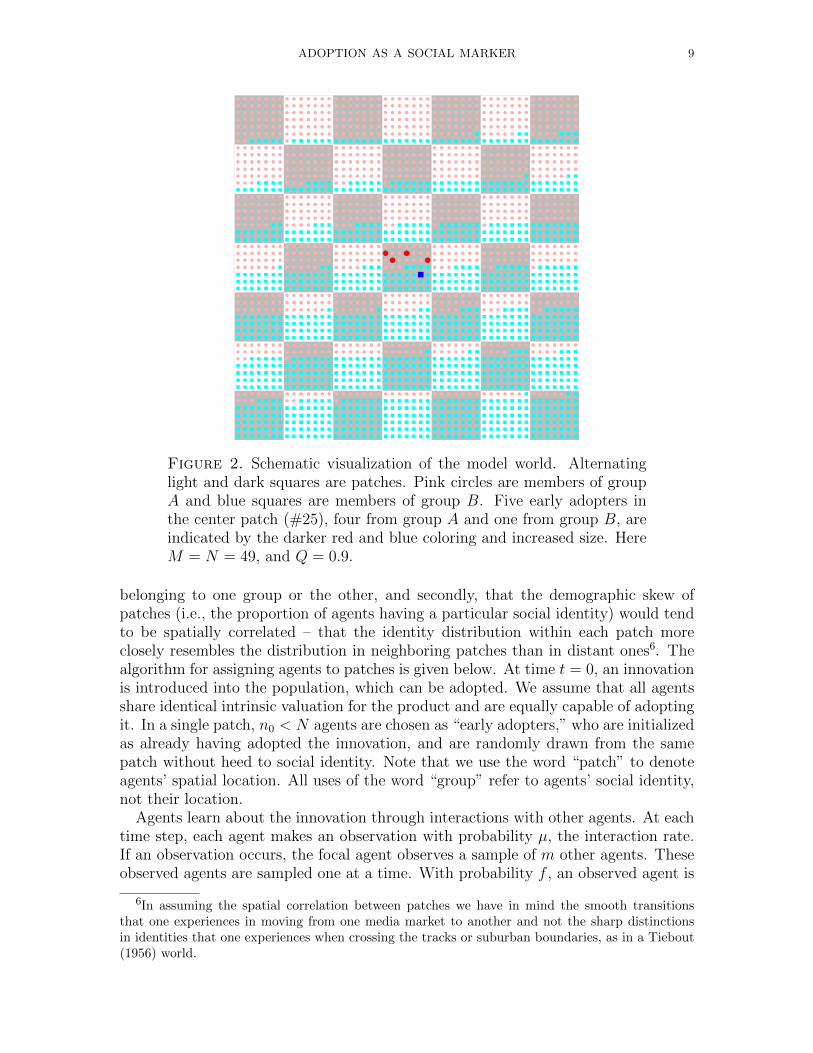
More formally, the population is distributed across M patches, which are situatedalong a line so that each patch has two neighboring patches with the exception ofpatches 1 and M (the first and last patches), which have only one neighbor. Whileour line of patches is not as common a way of modeling spatial structure as others,such as Moore neighborhoods, we settled on this arrangement because it facilitatesthe examination of short and long range interactions among individuals with varyingidentities in the most minimal way5. We visualized this layout by placing the patcheson a square grid, such that the rightmost patch in one row neighbors the leftmostpatch in the row just below it (Figure 2). Each patch contains N agents. Eachagent has one of S social identities (S = {A,B}). To avoid global majority/minorityeffects, we assumed equal overall numbers of individuals holding each group identity,though we allowed the distribution of identities to vary within each patch. Becausesimilar individuals tend to assort (Dow et al., 1982; McPherson et al., 2001), wegenerally assumed that, firstly, each patch would tend to be dominated by individuals
4Even when mathematical approximations are possible, they are imprecise and can miss importantresults only available to simulation approaches, as in de Aguiar, Rauch, and Bar-Yam (2004).
5The line is the simplest organizational framework with which to study structured interactions.It also allowed for an easily implementable and interpretable spatial correlation between neighboringpatches, which would be more complicated in network structures in which patches could share morethan one neighbor in common, such as a square lattice or small world network. That said, our modelis easily extendable to those and other network structures.
ADOPTION AS A SOCIAL MARKER 9
Figure 2. Schematic visualization of the model world. Alternatinglight and dark squares are patches. Pink circles are members of groupA and blue squares are members of group B. Five early adopters inthe center patch (#25), four from group A and one from group B, areindicated by the darker red and blue coloring and increased size. HereM = N = 49, and Q = 0.9.
belonging to one group or the other, and secondly, that the demographic skew ofpatches (i.e., the proportion of agents having a particular social identity) would tendto be spatially correlated – that the identity distribution within each patch moreclosely resembles the distribution in neighboring patches than in distant ones6. Thealgorithm for assigning agents to patches is given below. At time t = 0, an innovationis introduced into the population, which can be adopted. We assume that all agentsshare identical intrinsic valuation for the product and are equally capable of adoptingit. In a single patch, n0 < N agents are chosen as “early adopters,” who are initializedas already having adopted the innovation, and are randomly drawn from the samepatch without heed to social identity. Note that we use the word “patch” to denoteagents’ spatial location. All uses of the word “group” refer to agents’ social identity,not their location.
Agents learn about the innovation through interactions with other agents. At eachtime step, each agent makes an observation with probability µ, the interaction rate.If an observation occurs, the focal agent observes a sample of m other agents. Theseobserved agents are sampled one at a time. With probability f , an observed agent is
6In assuming the spatial correlation between patches we have in mind the smooth transitionsthat one experiences in moving from one media market to another and not the sharp distinctionsin identities that one experiences when crossing the tracks or suburban boundaries, as in a Tiebout(1956) world.
10 SMALDINO, JANSSEN, HILLIS, & BEDNAR
sampled at random from the focal agent’s own patch. Otherwise, the observed agentis drawn at random from an external patch. The parameter f allows us to contin-uously vary the clustering of the population, with a well-mixed population at oneextreme and an isolated islands model at the other. When observations involve anexternal patch, that patch may be restricted to spatial neighbors of the focal agent’spatch (local external observation), or be randomly drawn from the entire populationof patches (long-range external observation). Neighboring patches have correlateddemographic properties; that is, they have similar proportions of the two markedgroups. Long-range observations result in a more well-mixed population structurein which individuals are influenced by others who might reside in environments thatare, at a local level, demographically quite different7 (Flache & Macy, 2011). Ob-servations allow agents to become aware of innovations, and to make assessments ofthe innovation’s prevalence among both in- and out-group individuals8. The order inwhich agents make observations is randomized at each time step. Once an agent hasobserved m other agents, she makes a decision about whether to adopt the innovation.
3.1. Social Influence and Innovation Adoption. Following an observation, theagent decides whether or not to adopt the innovation. This decision is made even ifthe agent has previously adopted the innovation; in this case, a decision not to adoptimplies a disadoption. Two factors contribute to the consideration of adoption: (1) ageneralized frequency-dependent bias, whereby the more popular a product is in thepopulation, the more likely an agent is to adopt it, and (2) an aversion bias, wherebyagents prefer not to adopt an innovation adopted by outgroup members. By includinga generalized frequency-dependent bias instead of restricting positive influence toone’s ingroup, we are able to analyze the contrasting influences of positive frequencydependence and outgroup aversion in a more realistic manner than was possible inthe analytical model.
First, consider the frequency dependent influence, F . An agent is more likely toadopt a more common product. We follow Granovetter (1978) in assuming that thelikelihood of adoption is influenced by positive feedback – the more people do some-thing, the more people will be willing to join in. This influence is probabilistic; forexample, Berger and Heath (2007) found that, regardless of whether a product wasidentity relevant, some small proportion of people (at least 14% in their study 3)still chose a minority product over a more popular one. Nevertheless, their findingssupport the claim that, all things being equal, people tend to prefer more popularitems, fitting the literature on positive biases in social transmission of ideas and be-haviors (Bikhchandani, Hirschleifer, & Welch, 1998). In many cases, social forcescan also lead to the preferential adoption of already popular items. For example, Sal-ganik, Dodds, and Watts (2006) used an artificial online music market to show thata product’s adoption was largely determined by its early popularity, independent ofinherent quality. Our assumption of positive frequency dependence is also congruent
7In reality, even long-range observations will likely be skewed by homophily. Our formalizationallows us to control the rate of homophilic interactions more precisely.
8Product information flow in our model involves only direct social communication, and for simplic-ity excludes mass media influences. A modification in which agents received additional informationfrom third-party sources, perhaps represented by “media agents,” could be added for future analyses.
ADOPTION AS A SOCIAL MARKER 11
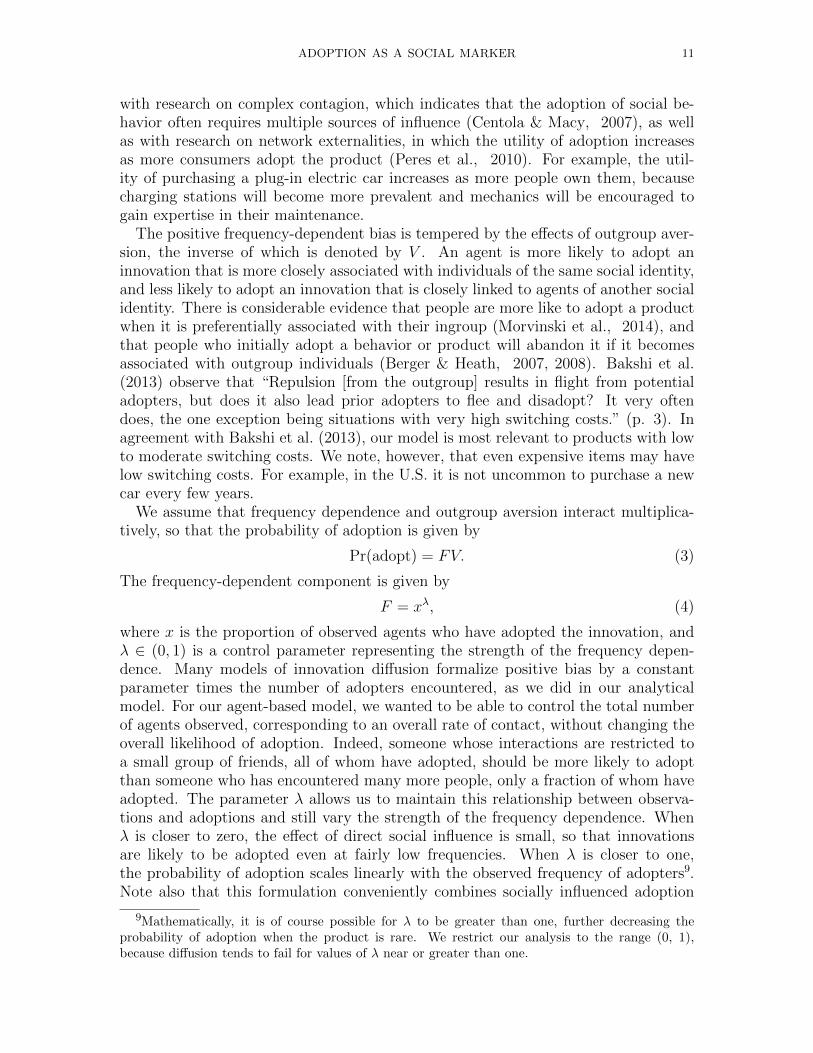
with research on complex contagion, which indicates that the adoption of social be-havior often requires multiple sources of influence (Centola & Macy, 2007), as wellas with research on network externalities, in which the utility of adoption increasesas more consumers adopt the product (Peres et al., 2010). For example, the util-ity of purchasing a plug-in electric car increases as more people own them, becausecharging stations will become more prevalent and mechanics will be encouraged togain expertise in their maintenance.
The positive frequency-dependent bias is tempered by the effects of outgroup aver-sion, the inverse of which is denoted by V . An agent is more likely to adopt aninnovation that is more closely associated with individuals of the same social identity,and less likely to adopt an innovation that is closely linked to agents of another socialidentity. There is considerable evidence that people are more like to adopt a productwhen it is preferentially associated with their ingroup (Morvinski et al., 2014), andthat people who initially adopt a behavior or product will abandon it if it becomesassociated with outgroup individuals (Berger & Heath, 2007, 2008). Bakshi et al.(2013) observe that “Repulsion [from the outgroup] results in flight from potentialadopters, but does it also lead prior adopters to flee and disadopt? It very oftendoes, the one exception being situations with very high switching costs.” (p. 3). Inagreement with Bakshi et al. (2013), our model is most relevant to products with lowto moderate switching costs. We note, however, that even expensive items may havelow switching costs. For example, in the U.S. it is not uncommon to purchase a newcar every few years.
We assume that frequency dependence and outgroup aversion interact multiplica-tively, so that the probability of adoption is given by
Pr(adopt) = FV. (3)
The frequency-dependent component is given by
F = xλ, (4)
where x is the proportion of observed agents who have adopted the innovation, andλ ∈ (0, 1) is a control parameter representing the strength of the frequency depen-dence. Many models of innovation diffusion formalize positive bias by a constantparameter times the number of adopters encountered, as we did in our analyticalmodel. For our agent-based model, we wanted to be able to control the total numberof agents observed, corresponding to an overall rate of contact, without changing theoverall likelihood of adoption. Indeed, someone whose interactions are restricted toa small group of friends, all of whom have adopted, should be more likely to adoptthan someone who has encountered many more people, only a fraction of whom haveadopted. The parameter λ allows us to maintain this relationship between observa-tions and adoptions and still vary the strength of the frequency dependence. Whenλ is closer to zero, the effect of direct social influence is small, so that innovationsare likely to be adopted even at fairly low frequencies. When λ is closer to one,the probability of adoption scales linearly with the observed frequency of adopters9.Note also that this formulation conveniently combines socially influenced adoption
9Mathematically, it is of course possible for λ to be greater than one, further decreasing theprobability of adoption when the product is rare. We restrict our analysis to the range (0, 1),because diffusion tends to fail for values of λ near or greater than one.
12 SMALDINO, JANSSEN, HILLIS, & BEDNAR
0
0.2
0.4
0.6
0.8
1
-10 -8 -6 -4 -2 0 2 4 6 8 10
b = 1b = 0.8b = 0.6
0
0.2
0.4
0.6
0.8
1
0 0.2 0.4 0.6 0.8 1
λ = 0.3λ = 0.5λ = 0.7
mI – mO
×F V
x
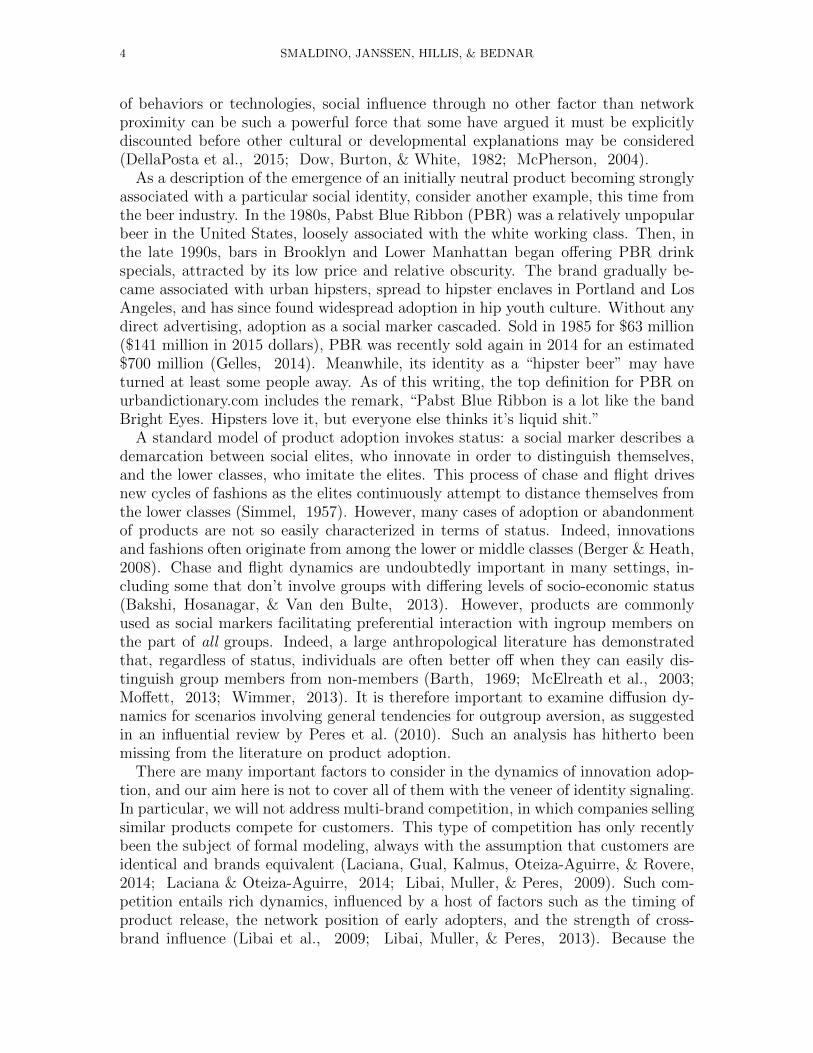
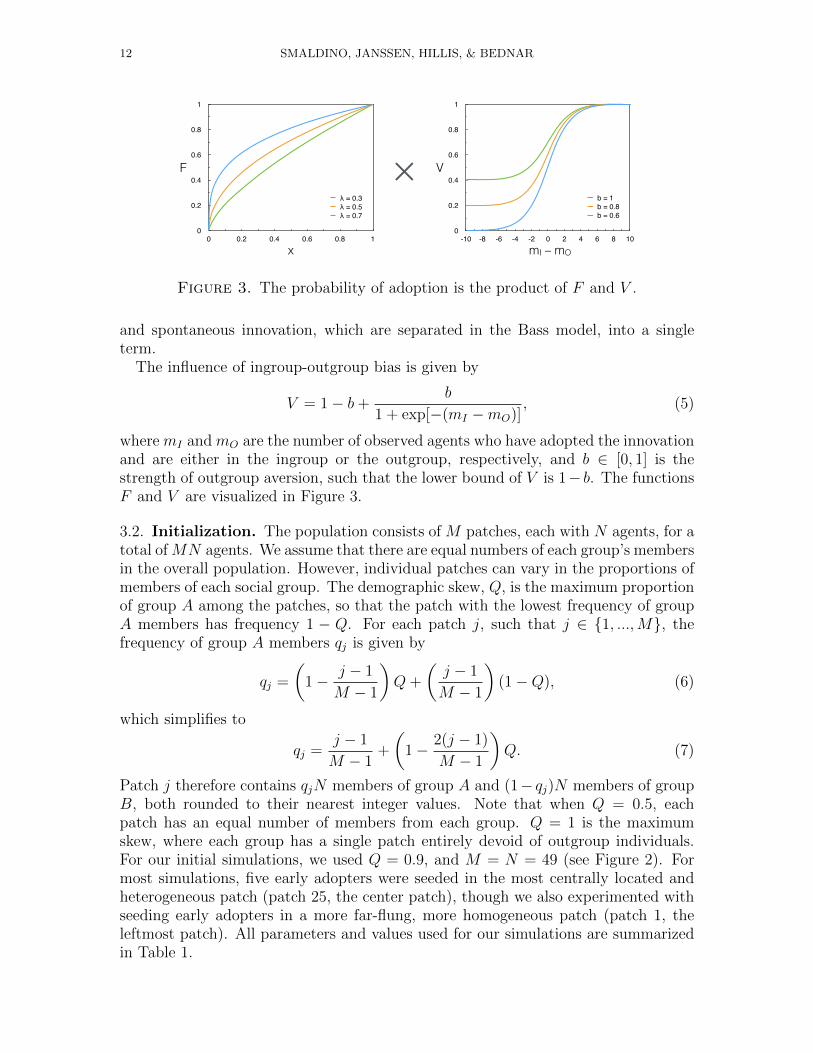
Figure 3. The probability of adoption is the product of F and V .
and spontaneous innovation, which are separated in the Bass model, into a singleterm.
The influence of ingroup-outgroup bias is given by
V = 1− b+b
1 + exp[−(mI −mO)], (5)
where mI and mO are the number of observed agents who have adopted the innovationand are either in the ingroup or the outgroup, respectively, and b ∈ [0, 1] is thestrength of outgroup aversion, such that the lower bound of V is 1− b. The functionsF and V are visualized in Figure 3.
3.2. Initialization. The population consists of M patches, each with N agents, for atotal ofMN agents. We assume that there are equal numbers of each group’s membersin the overall population. However, individual patches can vary in the proportions ofmembers of each social group. The demographic skew, Q, is the maximum proportionof group A among the patches, so that the patch with the lowest frequency of groupA members has frequency 1 − Q. For each patch j, such that j ∈ {1, ...,M}, thefrequency of group A members qj is given by
qj =
(1− j − 1
M − 1
)Q+
(j − 1
M − 1
)(1−Q), (6)
which simplifies to
qj =j − 1
M − 1+
(1− 2(j − 1)
M − 1
)Q. (7)
Patch j therefore contains qjN members of group A and (1− qj)N members of groupB, both rounded to their nearest integer values. Note that when Q = 0.5, eachpatch has an equal number of members from each group. Q = 1 is the maximumskew, where each group has a single patch entirely devoid of outgroup individuals.For our initial simulations, we used Q = 0.9, and M = N = 49 (see Figure 2). Formost simulations, five early adopters were seeded in the most centrally located andheterogeneous patch (patch 25, the center patch), though we also experimented withseeding early adopters in a more far-flung, more homogeneous patch (patch 1, theleftmost patch). All parameters and values used for our simulations are summarizedin Table 1.
ADOPTION AS A SOCIAL MARKER 13
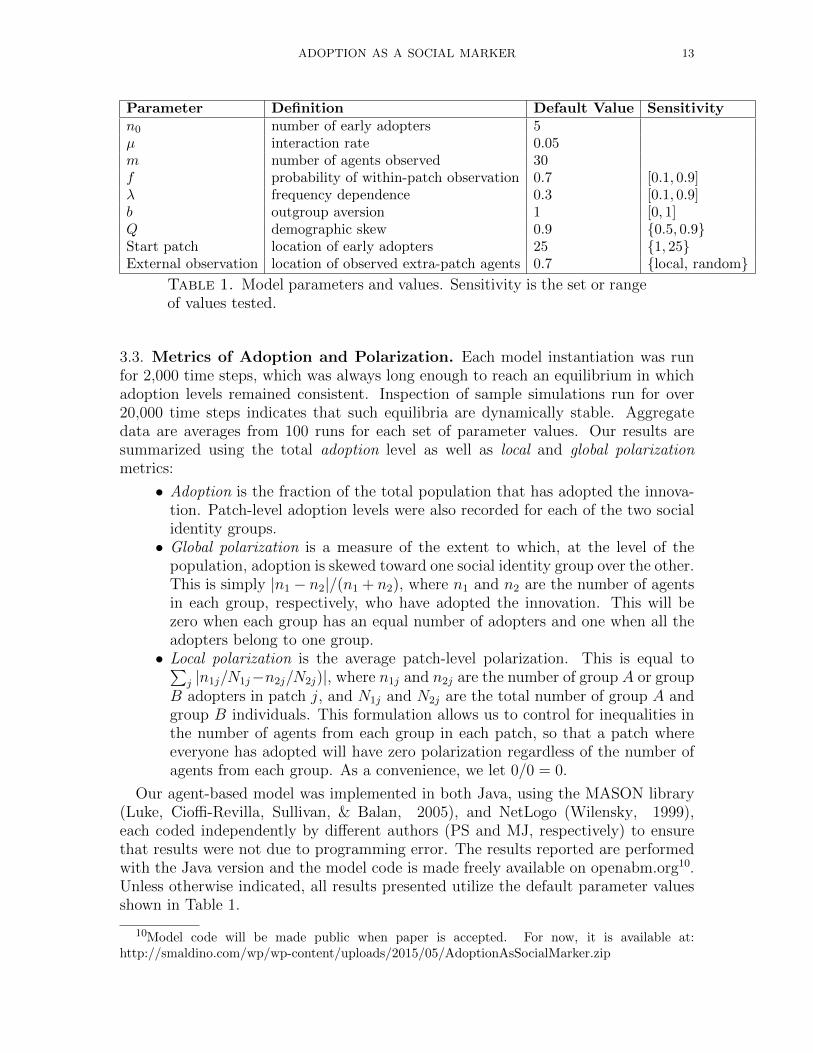
Parameter Definition Default Value Sensitivityn0 number of early adopters 5µ interaction rate 0.05m number of agents observed 30f probability of within-patch observation 0.7 [0.1, 0.9]λ frequency dependence 0.3 [0.1, 0.9]b outgroup aversion 1 [0, 1]Q demographic skew 0.9 {0.5, 0.9}Start patch location of early adopters 25 {1, 25}External observation location of observed extra-patch agents 0.7 {local, random}
Table 1. Model parameters and values. Sensitivity is the set or rangeof values tested.
3.3. Metrics of Adoption and Polarization. Each model instantiation was runfor 2,000 time steps, which was always long enough to reach an equilibrium in whichadoption levels remained consistent. Inspection of sample simulations run for over20,000 time steps indicates that such equilibria are dynamically stable. Aggregatedata are averages from 100 runs for each set of parameter values. Our results aresummarized using the total adoption level as well as local and global polarizationmetrics:
• Adoption is the fraction of the total population that has adopted the innova-tion. Patch-level adoption levels were also recorded for each of the two socialidentity groups.• Global polarization is a measure of the extent to which, at the level of the
population, adoption is skewed toward one social identity group over the other.This is simply |n1 − n2|/(n1 + n2), where n1 and n2 are the number of agentsin each group, respectively, who have adopted the innovation. This will bezero when each group has an equal number of adopters and one when all theadopters belong to one group.• Local polarization is the average patch-level polarization. This is equal to∑
j |n1j/N1j−n2j/N2j)|, where n1j and n2j are the number of group A or groupB adopters in patch j, and N1j and N2j are the total number of group A andgroup B individuals. This formulation allows us to control for inequalities inthe number of agents from each group in each patch, so that a patch whereeveryone has adopted will have zero polarization regardless of the number ofagents from each group. As a convenience, we let 0/0 = 0.
Our agent-based model was implemented in both Java, using the MASON library(Luke, Cioffi-Revilla, Sullivan, & Balan, 2005), and NetLogo (Wilensky, 1999),each coded independently by different authors (PS and MJ, respectively) to ensurethat results were not due to programming error. The results reported are performedwith the Java version and the model code is made freely available on openabm.org10.Unless otherwise indicated, all results presented utilize the default parameter valuesshown in Table 1.
10Model code will be made public when paper is accepted. For now, it is available at:http://smaldino.com/wp/wp-content/uploads/2015/05/AdoptionAsSocialMarker.zip
14 SMALDINO, JANSSEN, HILLIS, & BEDNAR
4. Simulation Results
In our analytical model, we found that delayed adoption, suppressed adoption,and mutual underadoption could all occur as a result of differential innovation ratesbetween groups, depending on the strength of outgroup aversion. An importantfinding of our agent-based investigation is that all three of these outcomes occurred,but with somewhat different characteristics and through different causal mechanisms.In the analytical model, differences in innovation rate corresponded to persistentdifferences in the spontaneous adoption of the product by members of each group. Theempirical meaning of this parameter is unclear, however, unless one can definitivelystate that members of one group are more or less innovative (though differences inaccess to the product or inherent wealth could provide a means for such an outcome).In our agent-based model, all adoption apart from a few early adopters is due to directsocial influence. Thus, the agent based model demonstrates that differences in group-level adoption outcomes can arise even when there are no differences in innovationrate. Rather, these differences emerge from structural differences in how individualsinteract with one another.
In our agent-based model, the structure of communication is determined by twoparameters: the tendency for observations to occur within one’s patch, f , and whetherextra-patch observations are made locally (in a neighboring patch) or randomly acrossthe entire population, with the latter case representing long-range communication orhigh levels of social mixing.
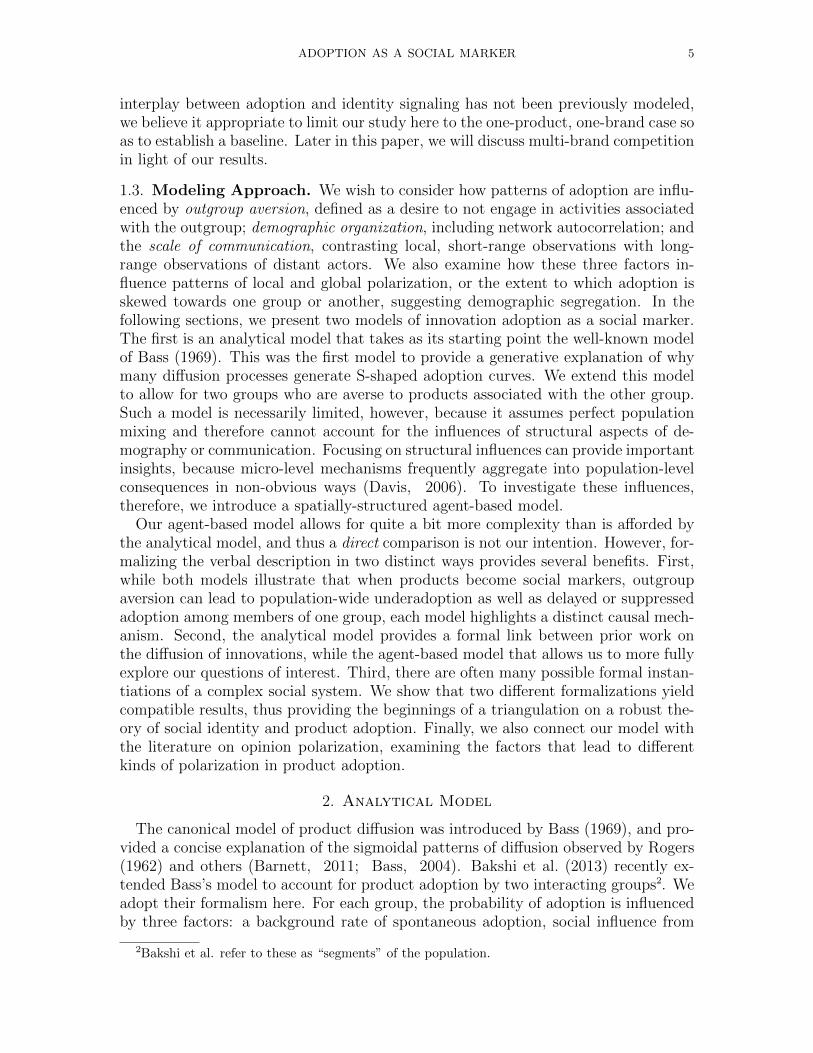
When observations were mostly local, we observed local but not global polarization,with persistent underadoption at the population level. Here, outgroup aversion sup-pressed adoption by the minority within patches (Figures 4a and 5a). Results herewere similar regardless of whether extra-patch observations were local or random,because most observations occurred within an agent’s own patch.
When external observations were more common but restricted to neighboring patches(which are demographically similar in terms of group membership), we observed de-layed adoption resulting from small stochastic differences in initial conditions, whichcascade as a result of network structure. Here, adoption flowed from patch to patchin the direction of increasing prevalence of the group that first began to adopt ata higher rate. In the other direction, members of the same group as those earlyadopters were increasingly rare, allowing outgroup aversion to delay adoption untilsufficient individuals from the second group adopted. Once this occurred, adoptionflowed from patch to patch in that direction among the second group (Figures 4b and5b). In such cases, the population may initially become quite polarized (as when onegroup is the primary adopter), but quickly equilibrates so that both groups adoptedin nearly equal numbers overall. Note here that there is still underadoption at thepopulation level, because the product spreads only among one group (typically themore numerous one) in each patch.
When external observations were common and randomly drawn from the entirepopulation, we observed total suppression of adoption in one group. This resultemerged from small differences in initial patterns of adoption and the subsequent pathdependency of stochastic interactions. When one group, purely by chance, exhibited aslightly higher frequency of adoption early on, this initial disparity generated positive

ADOPTION AS A SOCIAL MARKER 15
t = 0 t = 200t = 10 t = 30 t = 80 t = 120
f = 0.3, random observations(c)
f = 0.7, random observations(a)
f = 0.3, local observations(b)
Figure 4. The dynamics of local and global polarization. Visualiza-tion of example model runs showing the spread of the innovation fordifferent rates of and strategies for external observation. White andgrey square patches each contain 49 agents. Small cyan and pink agentshave not adopted. They turn dark blue and red, respectively, when theyadopt. While all three runs illustrate underadoption, we also observeddelayed (b) and suppressed (c) adoption.
0
0.2
0.4
0.6
0.8
1
0 100 200 300
Rat
e of
Ado
ptio
n
Time
Group AGroup B
0
0.2
0.4
0.6
0.8
1
0 100 200 300
Rat
e of
Ado
ptio
n
Time
Group AGroup B
f = 0.3, random observations
0
0.2
0.4
0.6
0.8
1
0 100 200 300Time
Global Adoption
Global Polarization
Local Polarization
(a)
0
0.2
0.4
0.6
0.8
1
0 100 200 300
Rat
e of
Ado
ptio
n
Time
Group AGroup B
f = 0.7, random observations
0
0.2
0.4
0.6
0.8
1
0 100 200 300Time
Global Adoption
Local Polarization
Global Polarization
f = 0.3, local observations
0
0.2
0.4
0.6
0.8
1
0 100 200 300Time
Local Polarization
Global Adoption
Global Polarization
(b) (c)
Figure 5. Dynamics of adoption and polarization, from the runs de-picted in Figure 4.

16 SMALDINO, JANSSEN, HILLIS, & BEDNAR
0
0.2
0.4
0.6
0.8
1
0 0.2 0.4 0.6 0.8 1
Glo
bal P
olar
izatio
n
Outgroup aversion, b
0
0.2
0.4
0.6
0.8
1
0 0.2 0.4 0.6 0.8 1
Glo
bal A
dopt
ion
Outgroup aversion, b
0
0.2
0.4
0.6
0.8
1
0 0.2 0.4 0.6 0.8 1
Loca
l Pol
ariza
tion
Outgroup aversion, b
λ=.1λ=.3λ=.5λ=.7λ=.9
(a) (b) (c)
Figure 6. Effect of outgroup aversion, b, and frequency dependence, λ.
feedback, making it more likely that members of the same group would adopt andthat outgroup individuals would not (Figures 4c and 5c).
The presence of multiple identity groups and widespread aversion toward adopt-ing products or behaviors associated with an outgroup yield these distinct diffusiondynamics. These are the major results generated by our model. For completeness,we also present a more detailed analysis of the model behavior, and explore how thedynamics respond to variations in parameter values.
4.1. Outgroup Aversion Hinders Adoption. First, we consider whether out-group aversion hinders overall levels of adoption. For example, will the total pur-chases of high-end electric cars be suppressed if a large share of the population wouldprefer not to be associated with the West-coast elites who were among the first todrive Teslas? Moreover, if a product is less intrinsically desirable (and thus its adop-tion more dependent on social influence), how will this influence patterns of adoptionin our model? We expected adoption would decrease with an increase in either out-group aversion, b, or frequency dependence, λ. These broad predictions follow fromour model assumptions. However, the extent to which these expectations will beinfluenced by demographic skew and the location of early adopters was unclear.
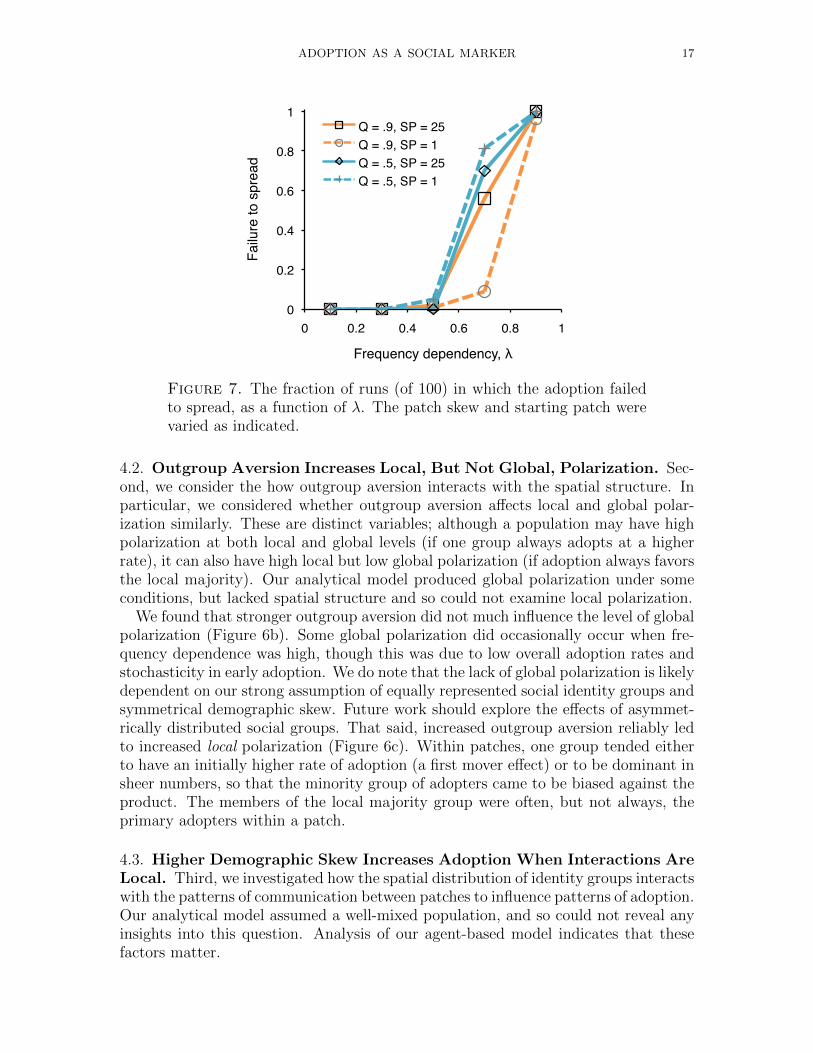
We found that increasing the strength of outgroup aversion, b, hindered overalladoption levels (Figure 6a). Stochastic events early in the adoption process led onegroup to become associated with the innovation within any given patch, resultingin the outgroup becoming averse to adoption. Within a patch, the adopting groupwas highly likely to be the local majority, both because they were more likely to bethe early adopters (all things being equal) and because majority group members weremore likely to be observed by potential adopters. Stronger frequency dependence alsoresulted in lower rates of adoption as long as outgroup aversion was nonzero. In thesecases, individuals were less likely to spontaneously adopt, creating a feedback loopresulting in persistent low adoption. Indeed, because outgroup aversion reduced theavailability of ready adopters and impeded the spread of the innovation when rare,high values of λ under strong outgroup aversion sometimes meant the innovation failedentirely to spread (i.e., the adoption rate was zero at the end of the simulation),though this was also influenced by the initial location of early adopters as well asthe degree of demographic skew (Figure 7). The effects of high λ were mitigatedby higher demographic skew, especially when the innovation was seeded in a highlyskewed patch, where effects of outgroup aversion were minimized.
ADOPTION AS A SOCIAL MARKER 17
0
0.2
0.4
0.6
0.8
1
0 0.2 0.4 0.6 0.8 1
Failu
re to
spr
ead
Frequency dependency, λ
Q = .9, SP = 25Q = .9, SP = 1Q = .5, SP = 25Q = .5, SP = 1
Figure 7. The fraction of runs (of 100) in which the adoption failedto spread, as a function of λ. The patch skew and starting patch werevaried as indicated.
4.2. Outgroup Aversion Increases Local, But Not Global, Polarization. Sec-ond, we consider the how outgroup aversion interacts with the spatial structure. Inparticular, we considered whether outgroup aversion affects local and global polar-ization similarly. These are distinct variables; although a population may have highpolarization at both local and global levels (if one group always adopts at a higherrate), it can also have high local but low global polarization (if adoption always favorsthe local majority). Our analytical model produced global polarization under someconditions, but lacked spatial structure and so could not examine local polarization.
We found that stronger outgroup aversion did not much influence the level of globalpolarization (Figure 6b). Some global polarization did occasionally occur when fre-quency dependence was high, though this was due to low overall adoption rates andstochasticity in early adoption. We do note that the lack of global polarization is likelydependent on our strong assumption of equally represented social identity groups andsymmetrical demographic skew. Future work should explore the effects of asymmet-rically distributed social groups. That said, increased outgroup aversion reliably ledto increased local polarization (Figure 6c). Within patches, one group tended eitherto have an initially higher rate of adoption (a first mover effect) or to be dominant insheer numbers, so that the minority group of adopters came to be biased against theproduct. The members of the local majority group were often, but not always, theprimary adopters within a patch.
4.3. Higher Demographic Skew Increases Adoption When Interactions AreLocal. Third, we investigated how the spatial distribution of identity groups interactswith the patterns of communication between patches to influence patterns of adoption.Our analytical model assumed a well-mixed population, and so could not reveal anyinsights into this question. Analysis of our agent-based model indicates that thesefactors matter.
18 SMALDINO, JANSSEN, HILLIS, & BEDNAR
0
0.2
0.4
0.6
0.8
1
0 0.2 0.4 0.6 0.8 1
Glo
bal A
dopt
ion
Frequency dependency, λ
Q = .9, SP = 25Q = .9, SP = 1Q = .5, SP = 25Q = .5, SP = 1
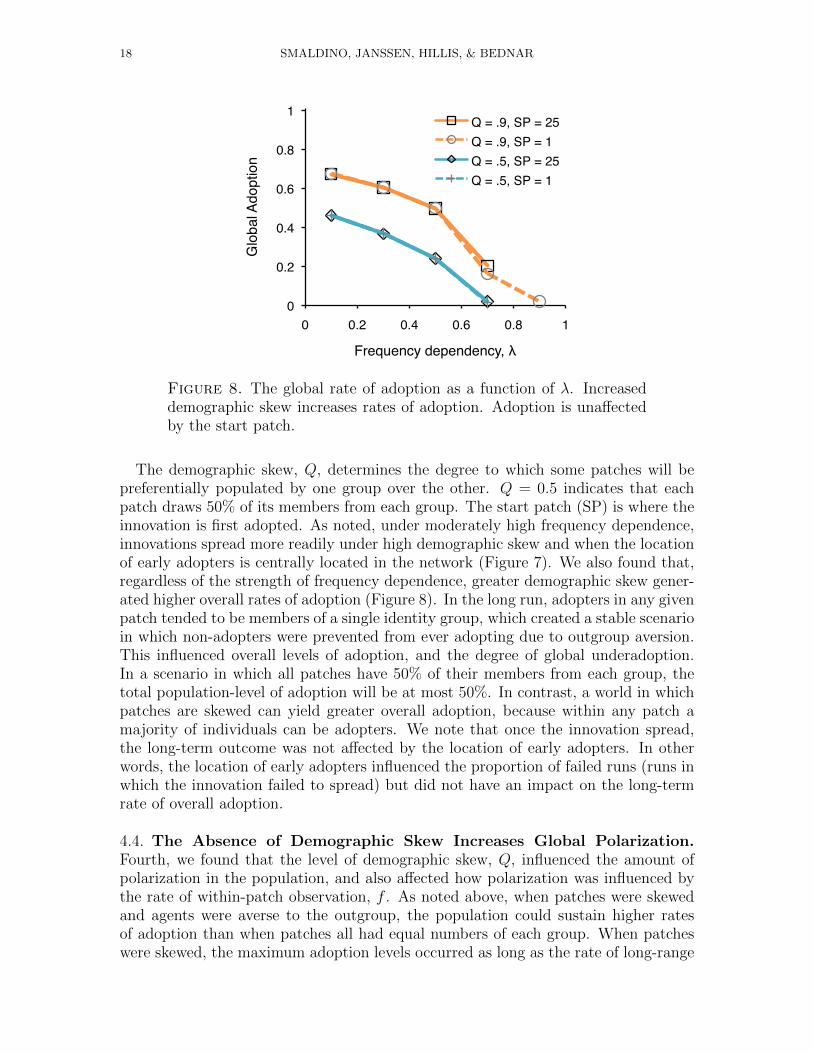
Figure 8. The global rate of adoption as a function of λ. Increaseddemographic skew increases rates of adoption. Adoption is unaffectedby the start patch.
The demographic skew, Q, determines the degree to which some patches will bepreferentially populated by one group over the other. Q = 0.5 indicates that eachpatch draws 50% of its members from each group. The start patch (SP) is where theinnovation is first adopted. As noted, under moderately high frequency dependence,innovations spread more readily under high demographic skew and when the locationof early adopters is centrally located in the network (Figure 7). We also found that,regardless of the strength of frequency dependence, greater demographic skew gener-ated higher overall rates of adoption (Figure 8). In the long run, adopters in any givenpatch tended to be members of a single identity group, which created a stable scenarioin which non-adopters were prevented from ever adopting due to outgroup aversion.This influenced overall levels of adoption, and the degree of global underadoption.In a scenario in which all patches have 50% of their members from each group, thetotal population-level of adoption will be at most 50%. In contrast, a world in whichpatches are skewed can yield greater overall adoption, because within any patch amajority of individuals can be adopters. We note that once the innovation spread,the long-term outcome was not affected by the location of early adopters. In otherwords, the location of early adopters influenced the proportion of failed runs (runs inwhich the innovation failed to spread) but did not have an impact on the long-termrate of overall adoption.
4.4. The Absence of Demographic Skew Increases Global Polarization.Fourth, we found that the level of demographic skew, Q, influenced the amount ofpolarization in the population, and also affected how polarization was influenced bythe rate of within-patch observation, f . As noted above, when patches were skewedand agents were averse to the outgroup, the population could sustain higher ratesof adoption than when patches all had equal numbers of each group. When patcheswere skewed, the maximum adoption levels occurred as long as the rate of long-range
ADOPTION AS A SOCIAL MARKER 19
0.2
0.3
0.4
0.5
0.6
0.7
0 0.2 0.4 0.6 0.8 1
Glo
bal A
dopt
ion
Observations within own patch, f
0
0.2
0.4
0.6
0.8
1
0 0.2 0.4 0.6 0.8 1
Glo
bal P
olar
izatio
n
Observations within own patch, f
0.6
0.7
0.8
0.9
0 0.2 0.4 0.6 0.8 1
Loca
l Pol
ariza
tion
Observations within own patch, f
local, Q = .9
random, Q = .9
local ,Q = .5
random, Q = .5
(a) (b) (c)
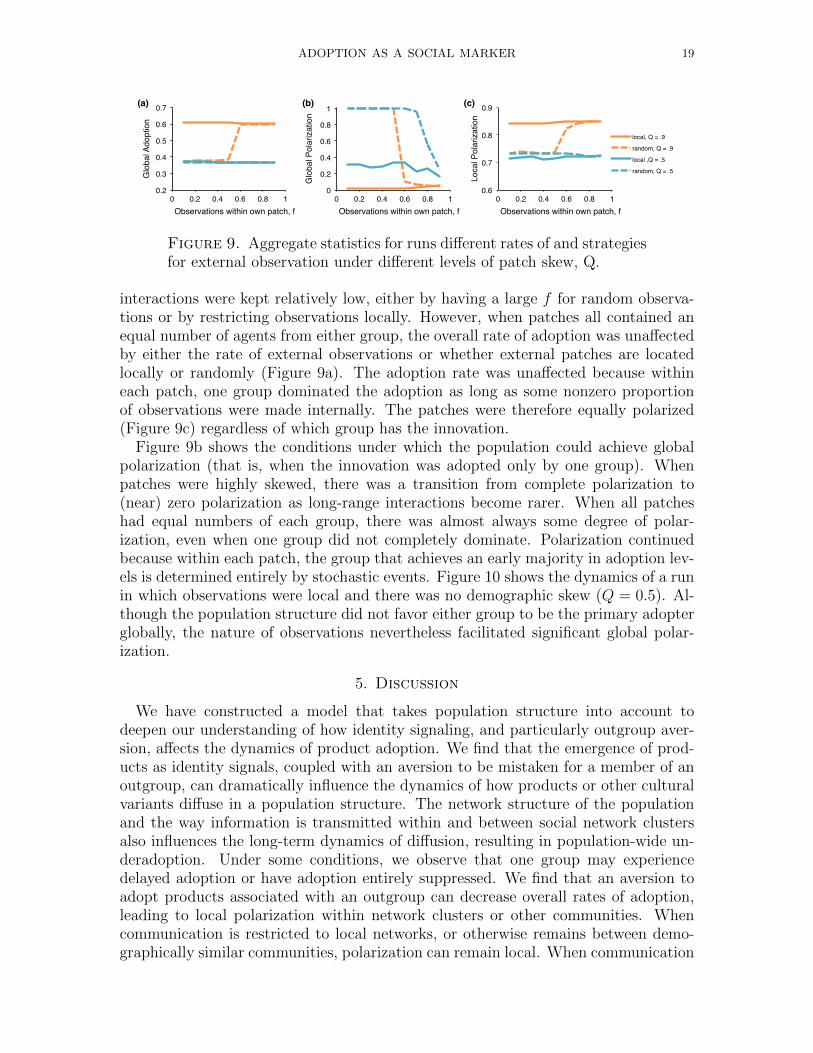
Figure 9. Aggregate statistics for runs different rates of and strategiesfor external observation under different levels of patch skew, Q.
interactions were kept relatively low, either by having a large f for random observa-tions or by restricting observations locally. However, when patches all contained anequal number of agents from either group, the overall rate of adoption was unaffectedby either the rate of external observations or whether external patches are locatedlocally or randomly (Figure 9a). The adoption rate was unaffected because withineach patch, one group dominated the adoption as long as some nonzero proportionof observations were made internally. The patches were therefore equally polarized(Figure 9c) regardless of which group has the innovation.
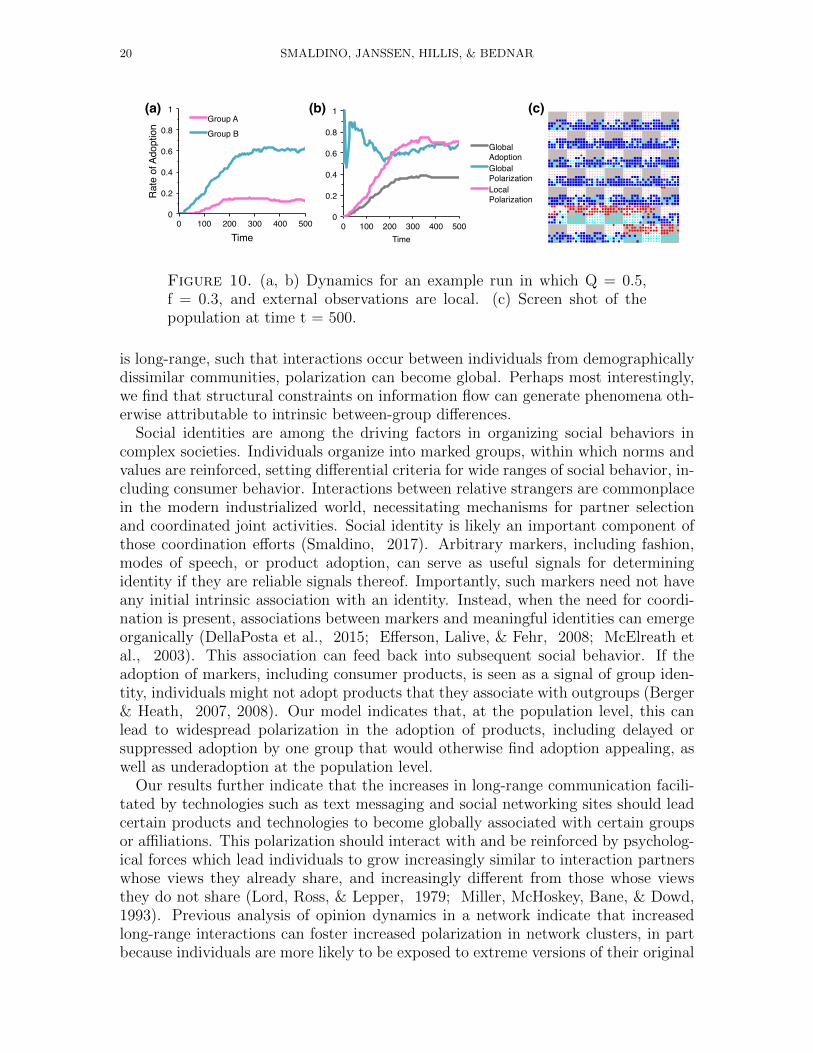
Figure 9b shows the conditions under which the population could achieve globalpolarization (that is, when the innovation was adopted only by one group). Whenpatches were highly skewed, there was a transition from complete polarization to(near) zero polarization as long-range interactions become rarer. When all patcheshad equal numbers of each group, there was almost always some degree of polar-ization, even when one group did not completely dominate. Polarization continuedbecause within each patch, the group that achieves an early majority in adoption lev-els is determined entirely by stochastic events. Figure 10 shows the dynamics of a runin which observations were local and there was no demographic skew (Q = 0.5). Al-though the population structure did not favor either group to be the primary adopterglobally, the nature of observations nevertheless facilitated significant global polar-ization.
5. Discussion
We have constructed a model that takes population structure into account todeepen our understanding of how identity signaling, and particularly outgroup aver-sion, affects the dynamics of product adoption. We find that the emergence of prod-ucts as identity signals, coupled with an aversion to be mistaken for a member of anoutgroup, can dramatically influence the dynamics of how products or other culturalvariants diffuse in a population structure. The network structure of the populationand the way information is transmitted within and between social network clustersalso influences the long-term dynamics of diffusion, resulting in population-wide un-deradoption. Under some conditions, we observe that one group may experiencedelayed adoption or have adoption entirely suppressed. We find that an aversion toadopt products associated with an outgroup can decrease overall rates of adoption,leading to local polarization within network clusters or other communities. Whencommunication is restricted to local networks, or otherwise remains between demo-graphically similar communities, polarization can remain local. When communication
20 SMALDINO, JANSSEN, HILLIS, & BEDNAR
0
0.2
0.4
0.6
0.8
1
0 100 200 300 400 500
Rat
e of
Ado
ptio
n
Time
Group AGroup B
0
0.2
0.4
0.6
0.8
1
0 100 200 300 400 500Time
Global AdoptionGlobal PolarizationLocal Polarization
(a) (b) (c)
Figure 10. (a, b) Dynamics for an example run in which Q = 0.5,f = 0.3, and external observations are local. (c) Screen shot of thepopulation at time t = 500.
is long-range, such that interactions occur between individuals from demographicallydissimilar communities, polarization can become global. Perhaps most interestingly,we find that structural constraints on information flow can generate phenomena oth-erwise attributable to intrinsic between-group differences.
Social identities are among the driving factors in organizing social behaviors incomplex societies. Individuals organize into marked groups, within which norms andvalues are reinforced, setting differential criteria for wide ranges of social behavior, in-cluding consumer behavior. Interactions between relative strangers are commonplacein the modern industrialized world, necessitating mechanisms for partner selectionand coordinated joint activities. Social identity is likely an important component ofthose coordination efforts (Smaldino, 2017). Arbitrary markers, including fashion,modes of speech, or product adoption, can serve as useful signals for determiningidentity if they are reliable signals thereof. Importantly, such markers need not haveany initial intrinsic association with an identity. Instead, when the need for coordi-nation is present, associations between markers and meaningful identities can emergeorganically (DellaPosta et al., 2015; Efferson, Lalive, & Fehr, 2008; McElreath etal., 2003). This association can feed back into subsequent social behavior. If theadoption of markers, including consumer products, is seen as a signal of group iden-tity, individuals might not adopt products that they associate with outgroups (Berger& Heath, 2007, 2008). Our model indicates that, at the population level, this canlead to widespread polarization in the adoption of products, including delayed orsuppressed adoption by one group that would otherwise find adoption appealing, aswell as underadoption at the population level.
Our results further indicate that the increases in long-range communication facili-tated by technologies such as text messaging and social networking sites should leadcertain products and technologies to become globally associated with certain groupsor affiliations. This polarization should interact with and be reinforced by psycholog-ical forces which lead individuals to grow increasingly similar to interaction partnerswhose views they already share, and increasingly different from those whose viewsthey do not share (Lord, Ross, & Lepper, 1979; Miller, McHoskey, Bane, & Dowd,1993). Previous analysis of opinion dynamics in a network indicate that increasedlong-range interactions can foster increased polarization in network clusters, in partbecause individuals are more likely to be exposed to extreme versions of their original
ADOPTION AS A SOCIAL MARKER 21
views (Flache & Macy, 2011). Such polarization might create new ingroup-outgroupdistinctions, leading to further reductions in the adoption of innovations.
If more widespread adoption and the associated reduction of polarization are desir-able goals, the role of social identity cannot be ignored. A pressing example is in theadoption of sustainable or environmentally “friendly” technologies. Firms, advertis-ers, and policy makers should make efforts to reduce the extent to which products areseen as social markers. One possibility is increased attention to research advanced bysocial psychologists on how to reduce ingroup bias and turn opponents into collabora-tors (e.g. Sherif, 1988). Another option might be the introduction of competing butequivalent products to occupy the various niches created by different identity groups.Although the present analysis suggests that social identity salience should be avoidedfor maximal diffusion, this runs counter to the way many companies explicitly andsuccessfully market their products, because in reality brands often compete for differ-ent submarkets. On the other hand, activists looking to decrease the market share ofan environmentally costly product might seek to associate it with one clearly markedgroup to avoid adoption by another group.
The factors influencing innovation diffusion among competing brands are many,and analysis thereof in the context of identity signaling is beyond the scope of thispaper, but it is perhaps helpful to speculate as to potential complications to diffusiondynamics arising from social identity. Consider competition between brands withcross-brand influence. Libai et al. (2009) modeled such a system and noted a rapidtakeoff of the follower brand, which was countered by a persistent “interaction-based”advantage to the first entrant, in which its initial numeric advantage continuously fedback to generate more new adopters. They showed these effects could be observed incellular service markets in Western Europe in the span between 1985-2005. Identitywas not necessary to explain their results, a fact we find unsurprising. We shouldnot expect social identity to be a significant factor in this setting, because cell serviceis not a visible product like a car, a smartphone, or an article of clothing. Forproducts that can serve as a social marker, we expect the dynamics of adoption tobe different. Exactly how group identity and social markers influence cross-brandadoption effects is not clear, but one assumption of cross-brand influence is that theprevalence of one brand increases the likelihood of adoption for the other brand.This effect could potentially be amplified in the case of identity signaling, becausethere would simultaneously be a reminder of the niche being filled by the product,and an incentive to avoid identification with the outgroup. In this case, the timingof a counter-identifying brand is expected to be even more critical than previouslythought. On the other hand, the timing of brand introduction may matter less if theeffect of identity signaling is very strong. We performed some simple analyses withan extension of our model, not presented here, in which two competing brands wereintroduced simultaneously. We found that, under some conditions, each brand couldbecome fully associated with a different identity group, following an initial periodof adoption and dis-adoption as the brands emerged as markers for each group. Arelated possibility is that competing brands may be viewed as categorically similar,leading to cross-brand inhibition. A considered analysis of social identity in diffusiondynamics with competing brands is warranted in future research.
22 SMALDINO, JANSSEN, HILLIS, & BEDNAR
Our model presents a picture of innovation adoption that is necessarily limited.One factor neither of our models explored is differences in population size among thetwo groups. We might expect that outgroup aversion, in the context of groups ofdifferent size, could actually increase the amount of adoption overall, if the largergroup is the adopting group, while suppressing adoption among the minority group.Many factors other than social identity influence decisions to adopt a product, behav-ior, or other cultural variant, including the innovation’s intrinsic quality, the statusor social power of current and potential adopters (sensu Bonacich, 1987), and thecurrent needs and available resources of the individual. Multiple products can existto fit similar niches, each of which may appeal to different identity demographics.Multiple groups exist, not just two. Social identities are complex, hierarchical, andcontext dependent; certain group identities can become more or less salient dependingon personal, social, and environmental circumstances (Ashmore et al., 2004; Roccas& Brewer, 2002; Smaldino, 2017). Moreover, identifying the network structure ofcommunication-related product information can be tricky. Individuals are influencedby direct observation, word of mouth, advertising, and other media. Network positionmatters. For example, individuals with more network ties are often early adopters,while those with fewer network ties are often later adopters (Valente, 1996). Theavailability of products and institutional support for their adoption may work in tan-dem with social identity to foster or impede support for a product. For example,identification as a political liberal or environmentalist might lead a person to becomeinterested in adopting hybrid or electric vehicle technologies, but the feasibility ofthat adoption is highly dependent on the presence of local dealerships and the infras-tructure of charging stations, which in turn may depend on government incentives(Diamond, 2009; San Roman, Momber, Abbad, & Miralles, 2011; Wirasingha,Schofield, & Emadi, 2008). Nevertheless, the simplifications in our model allow anuncluttered examination of the role of social identity and emergent social markers inthe dynamics of innovation adoption.
Acknowledgments
The authors acknowledge the support of the National Institute for Mathematical andBiological Synthesis (NIMBioS), an Institute sponsored by the National Science Founda-tion through NSF Award #DBI-1300426, with additional support from The University ofTennessee, Knoxville. We thank the members of NIMBioS working group, EvolutionaryApproaches to Sustainability, for valuable discussion. For comments on an earlier versionof this manuscript, we thank Jeremy Brooks, Fred Feinberg, Cristina Moya, Karthik Pan-chanathan, and Tim Waring. We are particularly grateful to Tim Waring for leadership inthe NIMBioS working group.
References
Abrahamson, E., & Rosenkopf, L. (1997). Social network effects on the extent ofinnovation diffusion: A computer simulation. Organization Science, 8 , 289–309.
Ashmore, R. D., Deaux, K., & McLaughlin-Volpe, T. (2004). An organizing frame-work for collective identity: Articulation and significance of multidimensionality.Psychological Bulletin, 130 , 80–114.
ADOPTION AS A SOCIAL MARKER 23
Axelrod, R. (1997). The dissemination of culture: A model with local convergenceand global polarization. Journal of Conflict Resolution, 41 , 203–226.
Bakshi, N., Hosanagar, K., & Van den Bulte, C. (2013). Chase andflight: New product diffusion with social attraction and repulsion. Work-ing Paper . Retrieved from http://faculty.london.edu/nbakshi/Bakshi
-Hosanagar-VandenBulte%20July02-2013.pdf
Banerjee, A., Chandrasekhar, A. G., Duflo, E., & Jackson, M. O. (2013). The diffusionof microfinance. Science, 341 , 1236498.
Barnett, G. A. (2011). Mathematical models of the diffusion process. In A. Vish-wanath & G. A. Barnett (Eds.), The diffusion of innovations: A communicationscience perspective (pp. 103–122). New York: Peter Lang.
Barth, F. (1969). Ethnic groups and boundaries. Boston: Little, Brown.Bass, F. M. (1969). A new product growth for model consumer durables. Management
Science, 15 , 215–227.Bass, F. M. (2004). Comments on “a new product growth for model consumer
durables”. Management Science, 50 , 1833–1840.Berger, J., & Heath, C. (2007). Where consumers diverge from others: Identity
signaling and product domains. Journal of Consumer Research, 34 , 121–134.Berger, J., & Heath, C. (2008). Who drives divergence? identity signaling, outgroup
dissimilarity, and the abandonment of cultural tastes. Journal of Personalityand Social Psychology , 95 , 593–607.
Bikhchandani, S., Hirschleifer, D., & Welch, I. (1998). Learning from the behaviorof others: Conformity, fads, and informational cascades. Journal of EconomicPerspectives , 12 , 151–170.
Boccaletti, S., Latora, V., Moreno, Y., Chavez, M., & Hwang, D.-U. (2006). Complexnetworks: Structure and dynamics. Physics Reports , 424 , 175–308.
Bonacich, P. (1987). Power and centrality: A family of measures. American Journalof Sociology , 92 , 1170-1182.
Bradford, H. (2014, March 28). Ford’s answer to cadillac’s classist andgreedy commercial is perfect. Huffington Post . Retrieved from http://
www.huffingtonpost.com/2014/03/28/ford-cadillac n 5050950.html
Brooks, J. S., & Wilson, C. (2015). The influence of contextual cues on the perceivedstatus of consumption-reducing behavior. Ecological Economics , 117 , 108–117.
Burt, R. S. (1980). Innovation as a structural interest: Rethinking the impact ofnetwork position on innovation adoption. Social Networks , 2 , 327–355.
Carley, K. (1991). A theory of group stability. American Sociological Review , 56 ,331–354.
Centola, D. (2010). The spread of behavior in an online social experiment. Science,329 , 1194–1197.
Centola, D., & Macy, M. (2007). Complex contagions and the weakness of long ties.American Journal of Sociology , 113 , 702–734.
Davis, G. F. (2006). Mechanisms and the theory of organizations. Journal of Man-agement Inquiry , 15 , 114–118.
Davis, G. F., & Greve, H. R. (1997). Corporate elite networks and governance changesin the 1980s. American Journal of Sociology , 103 , 1–37.
de Aguiar, M. A. M., Rauch, E. M., & Bar-Yam, Y. (2004). Invasion and extinction
24 SMALDINO, JANSSEN, HILLIS, & BEDNAR
in the mean field approximation for a spatial host-pathogen model. Journal ofStatistical Physics , 114 , 1417–1451.
DellaPosta, D. J., Shi, Y., & Macy, M. (2015). Why do liberals drink lattes? AmericanJournal of Sociology , 120 , 1473–1511.
Delre, S. A., Jager, W., Bijmolt, T. H. A., & Janssen, M. A. (2010). Will it spreador not? the effects of social influences and network topology on innovationdiffusion. Journal of Product Innovation Management , 27 , 267–282.
Diamond, D. (2009). The impact of government incentives for hybrid-electric vehicles:Evidence from us states. Energy Policy , 37 , 972–983.
Dow, M. M., Burton, M. L., & White, D. R. (1982). Network autocorrelation: Asimulation study of a foundational problem in regression and survey research.Social Networks , 4 , 169–200.
Durrett, R., & Levin, S. (1994). The importance of being discrete (and spatial).Theoretical Population Biology , 46 , 363–394.
Efferson, C., Lalive, R., & Fehr, E. (2008). The coevolution of cultural groups andingroup favoritism. Science, 321 , 1844–1849.
Epstein, J. M. (2006). Remarks on the foundations of agent-based generative socialscience. In L. Tesfatsion & K. L. Judd (Eds.), Handbook of computationaleconomics, vol. 2 (pp. 1585–1604). Amsterdam: North-Holland.
Flache, A., & Macy, M. W. (2011). Small worlds and cultural polarization. Journalof Mathematical Sociology , 35 , 146–176.
Funk, S., Gilad, E., Watkins, C., & Jansen, V. A. A. (2009). The spread of awarenessand its impact on epidemic outbreaks. Proceedings of the National Academy ofSciences , 106 , 6872–6877.
Gelles, D. (2014, September 18). Pabst is sold to russian beverage company. NewYork Times . Retrieved from http://dealbook.nytimes.com/2014/09/18/
pabst-is-said-to-near-a-sale/
Laciana, C. E., Gual, G., Kalmus, D., Oteiza-Aguirre, N., & Rovere, S. L. (2014).Diffusion of two brands in competition: Cross-brand effect. Physica A, 413 ,104–115.
Laciana, C. E., & Oteiza-Aguirre, N. (2014). An agent based multi-optional modelfor the diffusion of innovations. Physica A, 394 , 254–265.
Lazarsfeld, P., & Merton, R. (1954). Friendship as a social process: A substantive andmethodological analysis. In M. Berger (Ed.), Freedom and control in modernsociety. New York: Van Nostrand.
Libai, B., Muller, E., & Peres, R. (2009). The role of within-brand and cross-brandcommunications in competitive growth. Journal of Marketing , 73 , 19–34.
Libai, B., Muller, E., & Peres, R. (2013). Decomposing the value of word-of-mouthseeding programs: Acceleration versus expansion. Journal of Marketing Re-search, 50 , 161–176.
Lord, C. G., Ross, L., & Lepper, M. R. (1979). Biased assimilation and attitudepolarization: The effects of prior theories on subsequently considered evidence.Journal of Personality and Social Psychology , 37 , 2098–2109.
Luke, S., Cioffi-Revilla, C., Sullivan, K., & Balan, G. (2005). Mason: A multi-agentsimulation environment. Simulation, 81 , 517–527.
Mark, N. (1998). Beyond individual differences: Social differentiation from first

ADOPTION AS A SOCIAL MARKER 25
principles. American Sociological Review , 63 , 309–330.McElreath, R., Boyd, R., & Richerson, P. J. (2003). Shared norms and the evolution
of ethnic markers. Current Anthropology , 44 , 122–130.McPherson, M. (2004). A blau space primer: Prolegomenon to an ecology of affilia-
tion. Industrial and Corporate Change, 13 , 263-280.McPherson, M., Smith-Lovin, L., & Cook, J. M. (2001). Birds of a feather: Homophily
in social networks. Annual Review of Sociology , 27 , 415–444.Miller, A. G., McHoskey, J. W., Bane, C. M., & Dowd, T. G. (1993). The attitude
polarization phenomenon: Role of response measure, attitude extremity, andbehavioral consequences of reported attitude change. Journal of Personalityand Social Psychology , 64 , 561–574.
Moffett, M. W. (2013). Human identity and the evolution of societies. Human Nature,24 (3), 219–267.
Morvinski, C., Amir, O., & Muller, E. (2014). ‘ten million readers cant be wrong!’or can they? on the role of information about adoption stock in new producttrial. SSRN . Retrieved from http://ssrn.com/abstract=2459289
Newman, M. E. J. (2003). The structure and function of complex networks. SIAMReview , 45 , 167–256.
Peres, R., Muller, E., & Mahajan, V. (2010). Innovation diffusion and new productgrowth models: A critical review and research directions. International Journalof Research in Marketing , 27 , 91–106.
Rand, W., & Rust, R. T. (2011). Agent-based modeling in marketing: Guidelines forrigor. International Journal of Research in Marketing , 28 , 181–193.
Roccas, S., & Brewer, M. B. (2002). Social identity complexity. Personality andSocial Psychology Review , 6 , 88–106.
Rogers, E. M. (1962). Diffusion of innovations. New York: The Free Press.Salganik, M., Dodds, P., & Watts, D. (2006). Experimental study of inequality and
unpredictability in an artificial cultural market. Science, 311 , 854–856.San Roman, T. G., Momber, I., Abbad, M. R., & Miralles, A. S. (2011). Regulatory
framework and business models for charging plug-in electric vehicles: Infras-tructure, agents, and commercial relationships. Energy Policy , 39 , 6360–6375.
Sexton, S., & Sexton, A. (2014). Conspicuous conservation: The prius halo andwillingness to pay for environmental bona fides. Journal of Environmental Eco-nomics and Management , 67 , 303–317.
Sherif, M. (1988). The robbers cave experiment: Intergroup conflict and cooperation.Middletown, CT: Wesleyan University Press.
Simmel, G. (1957). Fashion. American Journal of Sociology , 62 , 541–558. ([1904])Smaldino, P. E. (2017). The evolution of social self: Multidimensionality of social
identity solves the coordination problems of a society. In W. C. Wimsatt &A. C. Love (Eds.), Beyond the meme: Dynamical structures in cultural evolu-tion. University of Minnesota Press.
Smaldino, P. E., Calanchini, J., & Pickett, C. L. (2015). Theory development withagent-based models. Organizational Psychology Review , 5 (4), 300–317.
Strogatz, S. H. (2001). Exploring complex networks. Nature, 410 , 268–276.Tajfel, H., Billig, M. G., Bundy, R. P., & Flament, C. (1971). Social categorization
and intergroup behaviour. European Journal of Social Psychology , 1 , 149–178.
26 SMALDINO, JANSSEN, HILLIS, & BEDNAR
Tiebout, C. M. (1956). A pure theory of local expenditures. The Journal of PoliticalEconomy , 64 , 416–424.
Valente, T. W. (1996). Social network thresholds in the diffusion of innovations.Social Networks , 18 , 69–89.
Watts, D. J., & Dodds, P. S. (2007). Influentials, networks, and public opinionformation. Journal of Consumer Research, 34 , 441–458.
Weigel, D. (2014, July 3). Rolling coal. Slate. Retrieved fromhttp://www.slate.com/articles/news and politics/politics/2014/07/
rolling coal conservatives who show their annoyance with liberals
obama.html
Wilensky, U. (1999). Netlogo. Evanston, IL: Center for Connected Learning andComputer-Based Modeling, Northwestern University. Retrieved from http://
ccl.northwestern.edu/netlogo/
Wimmer, A. (2013). Ethnic boundary making: Institutions, power, networks. Oxford:Oxford University Press.
Wirasingha, S. G., Schofield, N., & Emadi, A. (2008). Plug-in hybrid electric vehicledevelopments in the us: Trends, barriers, and economic feasibility. IEEE VehiclePower and Propulsion Conference, 2008 .