ev diffusion and adoption - heim | skemman
TRANSCRIPT
MS Thesis
Environmental and Natural Resources
Electric Vehicle Diffusion and Adoption
An examination of the major factors of influence over time in the US market
Leandra Poindexter Cooper
Supervisor Daði Már Kristófersson
Faculty of Economics
February 2014
Electric Vehicle Diffusion and Adoption
An examination of the major factors of influence over time in the US market
Leandra Poindexter Cooper
Final thesis for MS-degree in Environment and Natural Resources
Supervisor: Daði Már Kristófersson
Faculty of Economics
School of Social Sciences, University of Iceland
February 2014
3
Electric Vehicle Diffusion and Adoption.
This is a 60 credit thesis to obtain a MS degree in Environment and
Natural Resourses at the Faculty of Economics, School of Social Sciences,
University of Iceland.
© 2014 Leandra Cooper
This thesis may only be copied with the author’s permission.
Printed by: Háskólaprent
Reykjavík, 2014
4
Preface
This 60-credit thesis is a product of the Environmental and Natural Resources
Master’s Program, with a focus in Economics, at the University of Iceland.
The thesis subject was inspired by the emerging market for electric vehicles in the
modern day light-duty passenger vehicle markets around the world. Moving to
Reykjavík provoked me to contemplate the question of what factors most influence
electric vehicle diffusion and adoption on the market, since Iceland seemed to be ideal
for an electric vehicle market (cheap, abundant electricity, high petrol prices and the
majority of the population living in, or in close proximity to, the major cities). Despite
ideal conditions, electric vehicles are a rare sight on Icelandic roads.
The ultimate decision to focus the paper on the United States’ market was based
predominantly on the availability of electric vehicle data and records for the last two
centuries.
Many thanks are in order for the numerous people who have aided the development
of this thesis in one way or another. I would like to thank my thesis advisor, Daði Már
Kristófersson, for his enthusiasm and support throughout the brainstorming and writing
processes. I would also like to thank Brynhildur Davíðsdóttir, whose zeal for economics
motivated me to pursue economic focuses within environmental studies in the first
place. A big thanks to Bjargey Anna Guðbrandsdóttir as well, who has always been there
to answer my questions, even in the most pressing times. Lastly, but certainly not least,
I would like to thank my family for their encouragement, support, and continuous
willingness to help, and to everyone who has put up with me talking about electric
vehicles nonstop for the last year (or more!).
5
Abstract
Electric vehicles (EVs) present an abnormal case of technology diffusion, because EVs
have disappeared from the market twice before. Present-day EV sales constitute the
third ‘phase’ of EV adoption over the last two centuries. In the first two phases, gasoline
cars out-competed EVs because of lower costs, better range, superior infrastructure,
and lack of social vigor for EVs. Despite this weak start, EV sales are rising once again.
This paper investigates the most influential factors in the dynamic market for electric
vehicles to determine why they have returned to the market again and whether the
current market is better suited for EV market diffusion. Analysis of the markets in the
past phases and current phase of EV adoption has shown that that costs (upfront, fuel
and long-term), range, infrastructure, social attitudes and related policies have been the
factors most influential to EV adoption and diffusion. Given the predominant factors’
current trends, the EV market is much better conditioned to adopt EV technology today
than in past phases, and if trends continue as projected, EV technology may become
mainstream within the next two decades.
6
Table of Contents
Preface .................................................................................................................................... 4
Abstract ................................................................................................................................... 5
Table of Contents ................................................................................................................. 6
Figures ..................................................................................................................................... 8
Tables ...................................................................................................................................... 8
Glossary of Terms and Abbreviations .......................................................................... 9
1 Introduction ................................................................................................................ 10
1.1 Report Purpose ................................................................................................................ 11
1.2 Factor Selection ............................................................................................................... 11
1.3 Examining Influential Factors Through the Phases ........................................... 11
2 Phase One: 1890s-1920 ........................................................................................... 13
2.1 Enhancing and Degrading Factors ............................................................................ 13
2.1.1 Range ......................................................................................................................................... 14
2.1.2 Infrastructure ......................................................................................................................... 15
2.1.3 Social Attitudes ...................................................................................................................... 15
2.1.4 Lack of Adaptability and Production ............................................................................ 15
2.1.5 Production and Price ........................................................................................................... 16
2.1.6 Ease of Use ............................................................................................................................... 17
2.2 Summary of Phase One ................................................................................................. 17
3 Phase Two: 1990-2003 ............................................................................................ 18
3.1 Background ....................................................................................................................... 18
3.2 Zero Emission Vehicle (ZEV) Mandate .................................................................... 19
3.3 Enhancing and Degrading Factors ............................................................................ 20
3.3.1 Range and Infrastructure .................................................................................................. 21
3.3.2 Sales and Price ....................................................................................................................... 22
3.3.3 Changing Social Attitudes and Expectations ............................................................. 22
4 Phase Three: 2010-Present ................................................................................... 24
4.1 Background ....................................................................................................................... 24
4.2 2010-Present .................................................................................................................... 25
4.3 Sales ..................................................................................................................................... 28
4.4 Enhancing and Degrading Factors: Technological .............................................. 31
7
4.4.1 Costs ........................................................................................................................................... 32
4.4.1.1 Capital Costs ..................................................................................................................................... 32
4.4.1.2 Long-term Costs .............................................................................................................................. 33
4.4.2 Range ......................................................................................................................................... 34
4.4.2.1 Battery Improvements ................................................................................................................. 35
4.4.3 Infrastructure ......................................................................................................................... 36
4.4.4 Technological Lock-in ......................................................................................................... 36
4.4.5 Electric Integrity: Grid Reliability and Stability ....................................................... 37
4.4.6 Further Opportunities for Advancement in EV Infrastructure .......................... 39
4.5 Enhancing and Degrading Factors: Societal .......................................................... 40
4.5.1 Environmental Considerations ....................................................................................... 42
4.5.2 Policies ...................................................................................................................................... 43
5 Discussion .................................................................................................................... 45
5.1 The Impact of Beginnings ............................................................................................ 47
5.1.1 Phase One ................................................................................................................................. 47
5.1.2 Phase Two ................................................................................................................................ 48
5.1.3 Phase Three............................................................................................................................. 48
5.2 Prospects for the Future ............................................................................................... 49
5.2.1 Stochastic Element ............................................................................................................... 50
5.3 Weaknesses and Further Opportunities ................................................................ 51
6 Conclusion .................................................................................................................... 52
References .......................................................................................................................... 53
Appendix 1 .......................................................................................................................... 60
8
Figures
Figure 1. Increased availability of PEV Models, by Month .............................................. 25
Figure 2. Cumulative sales of PEVs in U.S. since December 2010 .................................... 26
Figure 3. Cumulative PEV sales as estimated by U.S. DOE, versus actual sales ............... 27
Figure 4. Price/ performance ratio of available PEV models. Note: orange
denotes BEVs; blue denotes PHEV. ...................................................................... 31
Figure 5. Comparison of lowest and highest range (in miles) capabilities of
available EVs in different Phases .......................................................................... 46
Tables
Table 1. Summary of Predominant Factors of Influence ................................................. 45
9
Glossary of Terms and Abbreviations
BEV (Battery Electric Vehicle): only uses electricity from the grid
EV (Electric Vehicle): generally refers to any vehicle that runs either partially or completely on electricity (also see ‘Plug-in Vehicle’)
HEV (Hybrid Electric Vehicle): uses both an electric and a gasoline motor. Electricity used is made on-board, therefore there is no plug-in or electricity from the grid.
ICE (Internal Combustion Engine): uses petrol fuel exclusively
PHEV (Plug-in Hybrid Electric Vehicle): similar to the HEV, but the electricity used is both made on-board and from the grid
PEV (Plug-in Vehicle): any vehicle that is charged via electricity from the grid (includes PHEVs, and BEVs) (also see ‘EV’)
V2G (Vehicle-to-Grid): a process by which a enabled PEVs could both receive and store energy in the on-board batteries, as well as transmit energy to the grid when energy demand is high
10
1 Introduction
Technological innovation and acceptance never occur in one dimension. There are a
score of different factors that influence the success or failure of an innovation, only one
of which is technologic performance.
When rural sociologist Everett M. Rogers’ published the first edition of Diffusion of
Innovations in 1963, he recognized four predominant factors that generally influenced
the spread of a technology: the innovation itself, the communication channels used to
diffuse the technology, the social atmosphere in which the technology circulated, and
time (Rogers, 1995). Rogers’ observations fell within the framework of his theory
describing the pattern of market penetration for innovative technologies.
The theory states that a technology, which successfully diffuses into the market,
commonly follows a logistic growth pattern of market penetration until it reaches
maturation. At that point another ‘disruptive’ technology may replace the former
technology, following its own market adoption path. Once a technology gains an
advantage in the market, however, the advantage can continue to grow through
learning and experience, as well as through increases in production scaling, thus further
solidifying the lead of the technology.
As recent growth in electric vehicle (EV) sales has drawn increasing attention to
electric vehicles, EV technology is often mistakenly assumed to be a disruptive
technology originating from the 21st century. In fact, over a hundred years ago, at the
turn of the 20th century, EVs outsold internal combustion engine (ICE) vehicles ten to
one (Billmaier, 2010). EV technology is over a century old, but it is still regarded as new
today because of its socially perceived newness.
The EV presents an atypical case of technologic diffusion—it has been introduced
into the market twice before, each time experiencing some initial market successes
followed by failures. In most cases, when a technology’s market diffusion is stopped by
the success of a competing technology, the former technology can be considered
obsolete. However, EV technology, has re-entered the automotive market for a third
time, despite the overwhelming advantages of the incumbent ICE vehicle, which raises
11
the question of why the present day is different. Do EVs stand a chance this time, or
will they fail again?
To answer this question, the technologic and social factors influencing the market
diffusion process in the past must be identified and compared to the current ones.
1.1 Report Purpose
This report will address this question by examining the historic and present
conditions of EV markets, identifying the predominant factors that influence the success
or failure of the EVs in the diffusion process, and analyzing the market for EVs in the
United States (US). For the purpose of this paper, EV ‘success’ would occur when the
technology transitions to mainstream status and maintains a distinct place in the
market. If the most influential factors can be identified, then better-informed decisions
can be made to prepare for future transportation and fleet development.
1.2 Factor Selection
Several factors are mentioned repeatedly in EV literature, such as vehicle battery
range, initial purchase costs, and the presence of a supportive infrastructure. While
these factors have influenced every phase of EV development throughout history,
several additional factors have also influenced the path of the EV. Within each phase,
the contribution of both ‘enhancing’ factors (those that made EVs favorable to the
public) and ‘degrading’ factors (those that reduced EV market share) will be analyzed
for their effects on the successes and failures of the EV.
1.3 Examining Influential Factors Through the Phases
The history of electric vehicles in the mass market can be broadly categorized into three
major phases:
1. the late nineteenth century and beginning of the twentieth century (1890s-
1920s);
2. a century later at the end of the twentieth century and beginning of the
twenty-first century (1990-2003); and
3. the third phase starting at the turn of the first decade of the 2000s to the
present (2010-present)

12
Referring to these periods of EV presence on the automobile market as phases is
intended to emphasize the fragmented but interrelated experiences within the different
time periods. While EVs were on the market in each of these three phases, the social,
technological, and political conditions in which the EV existed were very different, and
thus warrant further examination.
13
2 Phase One: 1890s-1920
Electric-powered vehicles of different shapes and forms were developed in various
European countries and part of the U.S. intermittently throughout the early and mid-
nineteenth century. By the 1890s EVs had a definite presence on American roads. The
first taxicab company in New York, established in 1897, was the Electric Vehicle
Company (EVC), which owned and operated a fleet of around 10 EVs and serviced
almost 5,000 passengers in their first 18-weeks of operation (Kirsch, 2000). EVs quickly
gained popular appeal in major urban cities, admired for their clean, quiet and reliable
operation (Billmaier, 2010; Kirsch, 2000).
At the turn of the century, around a third of the vehicles on American roads were
electric-powered. In New York City, Chicago and Boston alone, EVs made up 34% of the
city fleets. In 1900, the EVC had over 220 operational cabs in northeast cities, and still
the demand for EV cab services often exceeded the available supply (Koerth-Baker,
2012; PBS, 2009; Kirsch, 2000), suggesting that the window of opportunity for EVs was
wide open.
Just a decade later however, ICEs had gained a hold on the automotive market that
would prove to be unbreakable, leaving only a handful of EVs—mostly service trucks—
on city streets (Madrigal, 2011).
2.1 Enhancing and Degrading Factors
In the first phase, a number of different factors influenced the initial success, and
then the eventual demise of EVs. Some of the notable enhancing factors included their
physical characteristics -- they were virtually noiseless, smog-less and odorless, unlike
their petrol-powered counterparts -- and their reliability (EV cabs were the only
transportation service running in a major snowstorm in NYC, 1898). These enhancing
factors remained constant from the introduction of EVs until their phasing-out.
On the other hand, most of the degrading factors for the EV became issues over time.
For example, one of EVs’ major disadvantages compared to ICEs was the limited range.
14
This factor only became a serious issue when the social role of automobiles changed
from a public service to a consumer good.
2.1.1 Range
In the role of public service vehicles, EVs were expected to travel, almost exclusively,
within local cities. Range for service vehicles determined how many customers they
could handle in a day and therefore influenced the revenue generated. One of the
major taxi companies, the Electric Storage Battery Company (ESB)1 in Manhattan,
recognized that electric cabs’ limited range both reduced their revenue and also made
them less flexible than gasoline cabs. In response, ESB constructed a battery swap
station, which enabled the massive battery packs to be lifted out of the cabs and
transferred to a charging room, using hydraulic pistons and overhead cranes (Madrigal,
2011). The cab would then be stocked with freshly charged batteries and could return
to the streets. The battery swap station solved the range issue for the cabs in
Manhattan.
Given the use of battery swap stations and their niche as urban service vehicles, their
range did not appear to be a serious issue. Furthermore, the electric automobile
companies’ owners had a specific vision for EVs: to be part of an integrated, national,
electric service system for the rapidly growing urban populations. This integrated
system would include electric railways between major cities and EV service cabs within
the cities. The EV automakers did not think urbanites would have any desire to own
their own vehicles. After all, in the early years of the twentieth century, the road
systems could not support long-distance travel by car—only 7% of the US’s 2,000,000
miles of inter-city roads were surfaced at all – and most people were not accustomed to
driving themselves (Madrigal, 2011). Because EV companies’ owners could not see
beyond their vision of an integrated electric transportation system, EVs could not move
beyond their niche market.
1 Parent company of the Electric Vehicle Company (EVC)
15
It was not until the expectations for vehicles changed, however, that the limited
range of EVs became a major degrading factor. Two critical factors changed the
expectations: physical infrastructure and social attitudes.
2.1.2 Infrastructure
The development of the national, long-range roadway system created the foundation
for transportation outside of major cities, unrestricted by train schedules or routes.
Paved roads became common, thus enabling vehicles to travel long-distances -- if they
had the range. While EV recharging station networks had expanded at the beginning of
the century,2 the charging stations were limited to metropolis areas. EVs’ heavy, lead-
acid battery packs of that era could not compete with the high energy density of
gasoline beyond city limits.
2.1.3 Social Attitudes
The immense popularity of bicycles arguably also developed a taste for freedom
from the city landscape and from the limitations of public transportation. For a
relatively small sum a person could purchase a bicycle and commute whenever and
wherever they desired. Unlike the rails and trolleys of the time, bicycles were
unrestricted by schedules or destination. As a result, for many people mobility became
privatized -- a product, rather than a service like that of the EV cabs (Madrigal, 2011).
Fast, powerful cars were becoming much-desired status symbols. The EVs of the time
were intended for intra-city service use however, making their technology seem old-
fashioned.
2.1.4 Lack of Adaptability and Production
The other major degrading factor for EVs was the inability of the major EV company
owners to adapt to changing social and production needs.
One such occasion was presented by the shifting social expectations about vehicle
range. While records show that battery technology improved over the first decade of
the century, tripling the potential range of EVs by 1914 (Cowan & Hulten, 1996), the
2 By 1905, New York and Boston, combined, had nearly 75 charging stations (Cowan & Hulten, 1996).
16
advances were too little and too late to be competitive with the advances of ICEs.
Technologic advances of the ICE outpaced those of the EV, and the major EV
automakers seemed unable, or unwilling, to meet the changing social demands.
On several occasions, the EVC had faced production challenges in meeting massive
orders for its electric carriage. Rather than integrating, upgrading and consolidating
production processes however, the EVC continued to buy vehicle parts manufactured by
numerous suppliers, and paid premiums to acquire competitors’ facilities. Furthermore,
the EVC and its partner companies3 were thought to have intentionally kept vehicle
prices high in order to boost profits for the central holding companies (Kirsch, 2000). EV
companies seemed more concerned with maintaining a high-priced, premium market
rather than developing a mass market (Cowan & Hulten, 1996). As a result, the
companies’ production costs did not drop despite increased production scale, and EV
prices remained high — which soon proved to be a major disadvantage.
2.1.5 Production and Price
In 1908, Henry Ford introduced his Model T gas-powered car. The vehicle’s look was
updated—not like a carriage without a horse, like many vehicles of the time—it defined
its own new shape, more like that of modern vehicles. It also benefited from a highly
efficient production process, the assembly line, which led to increased efficiency and
lower production costs. The reduced production costs further resulted in lower prices
for consumers. Though the price ranges for EVs and ICEs were competitive in 1900,
there was a significant price gap dividing them a decade later. By 1914 the average price
of an EV was just under $3,000, and the Ford town car could be purchased for just
under $650 (Cowan & Hulten, 1996).
Additionally, within the first decade of the 20th century, gasoline also became cheap
and abundant in the US. Major oil field discoveries in Texas and Oklahoma quelled any
fears of oil shortage after the previously largest known domestic oil field, the Petrolia
region in Pennsylvania, had been exhausted (Madrigal, 2011). With easy fuel access and
3 The EVC, the ESB and Columbia and Electric Vehicle Company merged into a single conglomerate.
17
cheap prices, gasoline cars became a much cheaper option than the electric cars of the
time.
2.1.6 Ease of Use
Finally, Charles Kettering's invention of the electric starter in gas-powered vehicles
eliminated the need for hand cranks, making the combustion engine as easy to start as
an EV. Subsequently, EVs no longer had a competitive edge as the user-friendlier choice
and thus lost key niche markets such as that for wealthy women. Also, because the
electric starter utilized a small battery, the subsequent successes and increasing
production of ICE vehicles encouraged battery manufacturers to redirect their R&D
toward smaller batteries for ICEs and away from batteries with increased capacity for
EVs (Cowan & Hulten, 1996). As a result, critical battery performance improvements
that EVs needed to compete with ICEs were halted.
2.2 Summary of Phase One
As the ICE was gaining market share, the electric car companies were suffering an
onslaught of management issues and negative publicity. In 1907, the EVC filed for
bankruptcy (Madrigal, 2011). While the EVC and its partner companies weren’t the only
EV manufacturers in the US, they were keystone in the EV industry, and the downfall of
the EVC marked a turning point in the EV’s demise.
While EVs had some clear enhancing factors in Phase One, the numerous degrading
factors outweighed them, leading to the eventual decline of EVs. EV market penetration
was stunted, and by the 1920s, gas-powered cars had surpassed EVs as the preferred
passenger vehicle. By the 1930s few EVs still remained on American roadways.
18
3 Phase Two: 1990-2003
When EVs reemerged on the automobile market at the end of the twentieth century,
it was under much different conditions than those for the first phase of EV
development. While the market for EVs in Phase One began as a pull market and
experienced high levels of public demand, the EVs of Phase Two were pushed into the
automotive market through political demands, largely without support from the
automotive industry and with little demand for the alternative vehicles in the public.
3.1 Background
In the lead up to Phase Two, several critical factors primed the political atmosphere
that resulted in the drive for EVs in Phase Two. Firstly, air pollution was gaining
recognition from policy-makers, especially in California, where cities such as Los Angeles
were experiencing particularly poor air quality, and it was recognized that motor
vehicles had played a major role in the pollution.
Air quality issues began to get political attention as early as 30 years prior to Phase
Two. In 1959, California enacted legislation that required air quality standards and
motor vehicle emission controls to be developed. Seven years later, in 1966, the
California Motor Vehicle Pollution Control Board established the first tailpipe emission
standards in the nation.
California wasn’t alone in recognizing the issues surrounding vehicle emissions
however. Federal recognition of the air pollution problem, and of EVs as potential
problem-solvers, was also clear. A bill advocating EVs as a method to reduce air
pollution was introduced in Congress that same year, and later, in 1970, the Federal
Clean Car Incentive Program was introduced to encourage low-emission vehicle
development. Despite the lack of EV availability at the time, a Gallup poll suggested that
33 million Americans were interested in EVs (PBS, 2009).
Interest in alternative vehicles and fuel efficiency was only accentuated in the 1970s
as Middle-eastern turmoil caused volatility in the U.S. oil import supply. The Arab Oil
Embargo of 1973 and the Iranian Revolution in 1979 caused U.S. oil supplies to drop,
and consequently gasoline prices spiked. At the same time, the instability caused by the
19
oil shortages drove political enthusiasm for the implementation of fuel-reduction
mechanisms. Since then, every U.S. President has stated the need for the nation to
reduce imported fuel dependency (Fischetti, 2013)—former President Jimmy Carter
even went so far as to declare that, "beginning this moment, this nation will never use
more foreign oil than we did in 1977. Never" (Carter, 1979).4
Responding to the 1973 oil embargo, Congress established the Corporate Average
Fuel Economy (CAFÉ) standards in 1975, which set the average fuel economy for
manufacturers’ passenger vehicle fleets by model year, and established penalties for
failure to comply (National Highway Safety Administration, 2013). The implementation
of these standards not only improved the average fuel efficiency of American passenger
vehicles, but also created a foundation for impact-conscious vehicle design.
While improvements in fuel economy had positive implications for addressing the
issue of vehicle-induced air pollution, California’s southern coastal region was
experiencing higher ozone levels than any other metropolitan area in the country. More
than half the year, air pollution levels exceeded federal air quality standard maximums
(Reinhold, 1989). Consequentially, the local government risked losing federal funding
for transportation infrastructure development (Collantes & Sperling, 2008). The urgent
need for solutions to the air pollution issue in southern California led the California Air
Resource Board (CARB)5 to adopt a resolution that would not only lower emissions from
vehicles, but also require zero-emission vehicles on the market.
3.2 Zero Emission Vehicle (ZEV) Mandate
In 1990, CARB produced a standard, which mandated that major automakers6 must
meet specified, incremental minimum percentages of zero-emission vehicles (ZEVs)
within the production fleet if they were to continue selling vehicles on the California
market. This law came to be known as the ZEV Mandate. While the ZEV Mandate was
4 U.S. crude oil imports in 1977 were around 6.6 million barrels a day, while today, the US imports
around 8.6 million barrels of crude oil a day (U.S. Energy Information Administration, 2013),(U.S. Energy Information Administration, 2013b), with about 72% of the world’s oil reserves still owned by the Organization of the Petroleum Exporting Countries (OPEC) members (U.S. Department of Energy, 2013).
5 CARB is an entity of the Californian government.
6 Automakers with sales greater than 35,000-vehicles/ year (Collantes & Sperling, 2008)
20
part of a broader policy package, the Low Emission Vehicle and Clean Fuels Program,
the language of the program proposal clearly pointed to a political prioritization of EVs
(Collantes & Sperling, 2008), and given the available technology, experts generally
agreed that EVs were the most technologically feasible option to meet the ZEV
requirements (McGrath, 1998; Cowan & Hulten, 1996).
The ZEV Mandate was met with both support and opposition. On one hand, electric
utilities, environmental non-profit organizations, 10 other U.S. states, and the federal
government in the mid-1990s generally supported the push for ZEVs; on the other hand,
automakers and the oil industry opposed it and pushed back (McGrath, 1998).
While the mandate’s plan would have produced a market for around 300,000 -
400,000 EVs in the U.S. by 2003 (Cowan & Hulten, 1996), at the turn of the twenty-first
century, only a handful of EVs were available on the market, and most could only be
leased. Sales barely tipped into the thousands as automakers continued to oppose the
mandate. Furthermore, in 2002, General Motors and DaimlerChrysler sued CARB,
insisting that the mandate contradicted the federal fuel economy standards. In a
politically unusual move, the Bush Administration joined this lawsuit (PBS, 2009). This
led to a weakening, and eventual retraction of the ZEV Standard in 2003. Not long after,
the EVs that had gone out for lease to customers were reclaimed by the automakers
and taken off the road, thus effectively ending the short-lived Phase Two.
3.3 Enhancing and Degrading Factors
In analyzing the factors affecting the diffusion pattern of EVs in the market, it is
necessary to recognize that political factors rather than technological ones brought
about the emergence of EVs in Phase Two. The technology did not emerge as a
competitor on its own—it was essentially selectively pushed into the market as the best
available option to meet political standards. The fundamental S-curve diffusion
dynamics are still recognizable in this phase, but the unique characteristic of the phase
is essential to understanding why diffusion of the EV was not as successful as it might
have been.
Though Phase Two represented only an abbreviated stage of EV market diffusion, it
reintroduced the EVs into political and social consciousness for the first time in several
21
decades, while pressing vehicle research and developments to focus on ZEV technology
and design.
3.3.1 Range and Infrastructure
One of the most notable differences between Phase One and Phase Two EVs is the
battery improvements that occurred between the phases. EVs of the Second Phase
utilized batteries with nearly double the storage capacity of the batteries used in Phase
One. Though some of the Phase Two EVs used Nickel-Metal-Hydride (NiMH) batteries,
the dominant EV battery design was still Lead-Acid-based—the same as in Phase One.
Never the less, improvements in battery design enabled EVs in Phase Two to get around
75-120 miles per charge (Billmaier, 2010), demonstrating a significant improvement
from Phase One EV range.
Despite the improvements, the range of the EVs still could not compete with that of
ICEs; therefore range may have been perceived as a degrading factor of EVs to the
general public. However, because the manufacturing of EVs was quite limited, the early
adopters comprised a niche market of those who adopted the technology despite its
restraints. As such, while the EV range limitations may have prevented mainstream
adoption down the line, given the limited scope of the vehicle production in the early
diffusion of EVs, range alone was not entirely degrading.
Still, batteries with at least 50% better storage capacity than those used in Phase Two
EVs existed in the mid-1990s.7 Though alternative batteries had higher potential than
the Lead-Acid batteries, they were not commercially viable at that time, and had higher
short-term costs (McGrath, 1998). As a result, automakers largely continued to rely on
the more economical Lead-Acid batteries in order to meet the aggressive ZEV deadlines
(Cowan & Hulten, 1996; McGrath, 1998).
The lack of public charging infrastructure during this phase, however, proved to have
a more degrading influence than range alone. Range limitations were only accentuated
by the absence of public charging infrastructure; if EV drivers could recharge on trips,
then drivers wouldn’t need to be as cautious about being able to make the entire
7 In 1995, nickel-cadmium type batteries were capable of storing up to 65Wh/kg, while the lead-acid
batteries stored 40Wh/kg.
22
round-trip distance on a single charge. Additionally, EVs were only an option for those
who owned their homes and could afford to install a pricey charger.
3.3.2 Sales and Price
The ZEV mandate required automakers to develop low-emission vehicles for the
California market, although no market for such vehicles had existed in Phase Two. In
such a case, it should come as no surprise that the initial demand for the vehicles was
restricted to the select niche markets. The EVs of Phase Two were expensive, limited in
quantity and nearly always had closed-leases; however, the vehicles were still
considered “wildly popular” with their drivers8 (Billmaier, 2010).
The crossover Toyota RAV4 EV was the only EV offered for purchase, at $42,000,9
double the average new vehicle price in 2002, and it was sold exclusively between
March 2002 and November 2002. Sales ended the day after CARB rescinded the ZEV
Mandate, at which point Toyota recalled, and destroyed, the 328 EVs that had been
leased (Voelcker, 2010; Billmaier, 2010). Within a year of the ZEV Mandate retraction in
the aftermath of the automaker lawsuit against CARB, all the leased EVs of Phase Two
were withdrawn by the manufacturers—leaving only the approximately 101 RAV4 EVs
that had been purchased in the short window the vehicles were for sale on the roads.
Though high prices and limited markets acted as degrading factors to further EV sales,
the automaker’s restricted production and eventual recall were ultimately the most
detrimental factors to EV sales. Even after production stopped on General Motor’s EV1,
one of the most popular EVs of Phase Two, the waiting list for the vehicle was 5,000
names long (Billmaier, 2010)—suggesting that lack of demand was not the limiting
factor in sales.
3.3.3 Changing Social Attitudes and Expectations
Given that the push for EVs in Phase Two was based on political pressures rather
than social demand, and that the technology was new and limited to California, there
8 Considers both the EV drivers’ perceptions towards the vehicles, but also the demand for the EVs, which
exceeded auto manufacturers’ expectations. Both Toyota and GM publically claimed that their EV model discontinuation was due to a lack of demand however (Billmaier, 2010).
9 The average new car price at the time was $ 21,249 in 2002 $ (U.S.Department of Energy, 2009).
23
was little public knowledge of the vehicles or accommodation for them. Additionally, at
the time, American concern about global warming was at an all-time low, with 45% of
the population believing that global warming would occur sometime in the future, or
wouldn’t occur at all (Saad, Americans' Concerns About Global Warming on the Rise,
2013). Greenhouse gas emissions were not a major concern among the public, limiting
the appeal of ZEVs for consumers. Instead, demand for bigger sport utility vehicles grew
during the 1990s, despite their poor fuel economy, because gasoline prices were low.
Ultimately, when CARB withdrew the ZEV Mandate, automakers quickly returned to
business-as-usual and EVs’ progress ceased. Thus, in assessing enhancing and degrading
features of this Phase, it appears that the manufacturers’ negative attitude towards EVs
was the predominant influencer, eventually halting EV market penetration. Unlike most
technologic diffusion patterns, the same companies producing the incumbent
technology produced the emerging technology. Since EVs were made as compliance
vehicles for a mandate that the automakers did not support, EVs’ diffusion was stunted
by the lack of support from its own makers. Without widespread social demand for EVs
to drive producers, and without sustained political support for the technology and
supporting infrastructure, EVs didn’t stand a chance.
24
4 Phase Three: 2010-Present
The most recent phase of electric vehicle development represents a new window of
opportunity—one that has opened due to a combination of changing political,
technological and social conditions.
4.1 Background
In the time between Phase Two and Phase Three, little development in EV
technology or market diffusion seemed to take place. In the middle years of the decade,
national security, natural disasters and economic declines were the dominant issues
engulfing news media, as well as political and social concerns.
As the first decade of the twenty-first century progressed however, rising gas prices
became an increasing public concern. By 2005, 69% of Americans reported suffering
hardship due to the climb in gas prices, almost 20% of whom described their hardship as
“severe” and affecting their standard of living. Accordingly, fuel economy became more
of a public concern, and when surveyed, over half of respondents stated they would
consider a hybrid electric vehicle for their next car purchase or lease (Moore, 2005;
Saad, 2006). At that time, the average price of gas was $2.65 / gallon.
Gas prices hit a record high of over $4.00/ gallon in July 2008—an increase of 50%
from the average price in 2005. The fuel cost increases, and the strained economy from
the recession, reduced the market demand for transportation, causing car sales to hit
decade-lows and directing what demand there was to smaller and more fuel-efficient
vehicles.
In 2009, under the newly-elected Obama administration, interest in electric vehicles
was recharged by the $2 billion funding for electric vehicle technology and
infrastructure development through the American Recovery and Reinvestment Act,
which was accompanied by the Department of Energy’s provision of $400 million for
plug-in infrastructure development. Additionally, California was granted a waiver of
preemption, enabling the state to implement greenhouse gas standards for motor
vehicles beginning with model year 2009 (U.S. Environmental Protection Agency, 2013).
25
This decision effectively nullified the political pressures behind the lawsuit that halted
the ZEV Mandate in Phase Two.
In that same year, the new electric automaker, Tesla Motors, debuted their first
vehicle, the all-electric Roadster. While the automotive company made a splash in the
media with their high-performance sport-luxury coupe, its MSRP was upwards of
$100,000, thus limiting its purchases not only to the wealthy, but also to technologically
adventurous customers. It was not until the next year, 2010 -- when major automakers
Chevrolet and Nissan released their PEVs intended for mainstream customers -- that the
third phase of EVs in the marketplace began.
4.2 2010-Present
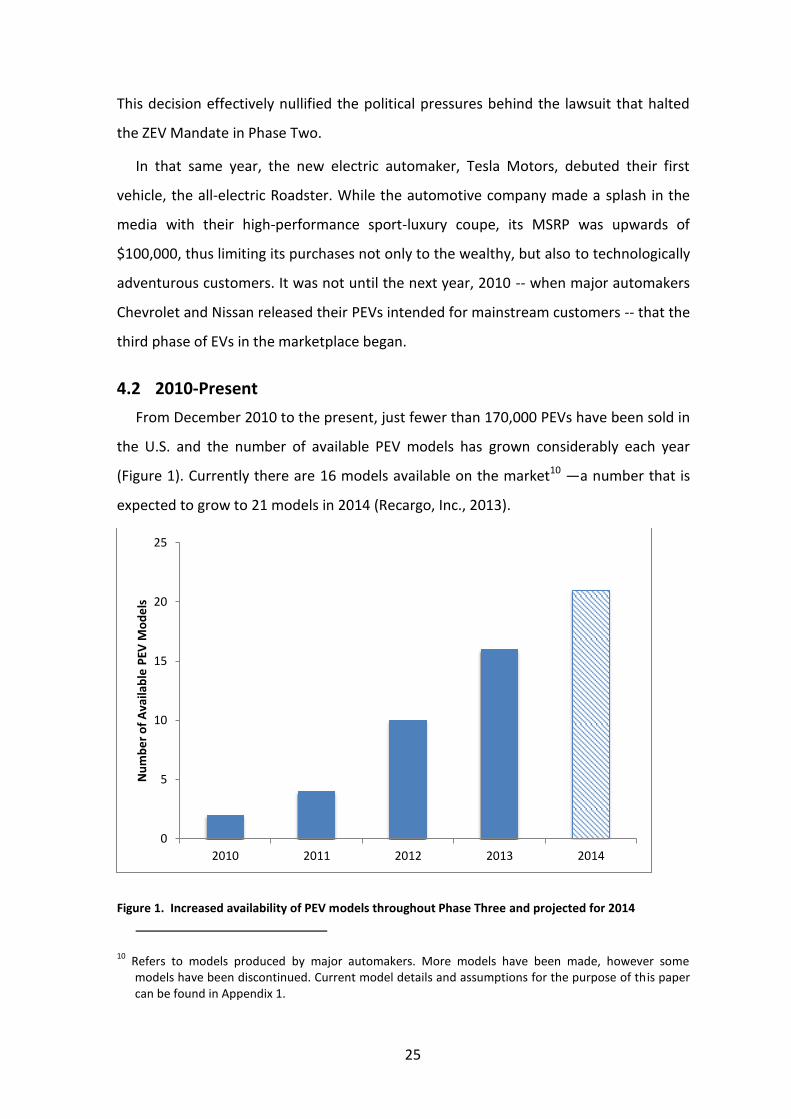
From December 2010 to the present, just fewer than 170,000 PEVs have been sold in
the U.S. and the number of available PEV models has grown considerably each year
(Figure 1). Currently there are 16 models available on the market10 —a number that is
expected to grow to 21 models in 2014 (Recargo, Inc., 2013).
Figure 1. Increased availability of PEV models throughout Phase Three and projected for 2014
10 Refers to models produced by major automakers. More models have been made, however some
models have been discontinued. Current model details and assumptions for the purpose of this paper can be found in Appendix 1.
0
5
10
15
20
25
2010 2011 2012 2013 2014
Nu
mb
er
of
Ava
ilab
le P
EV M
od
els
26
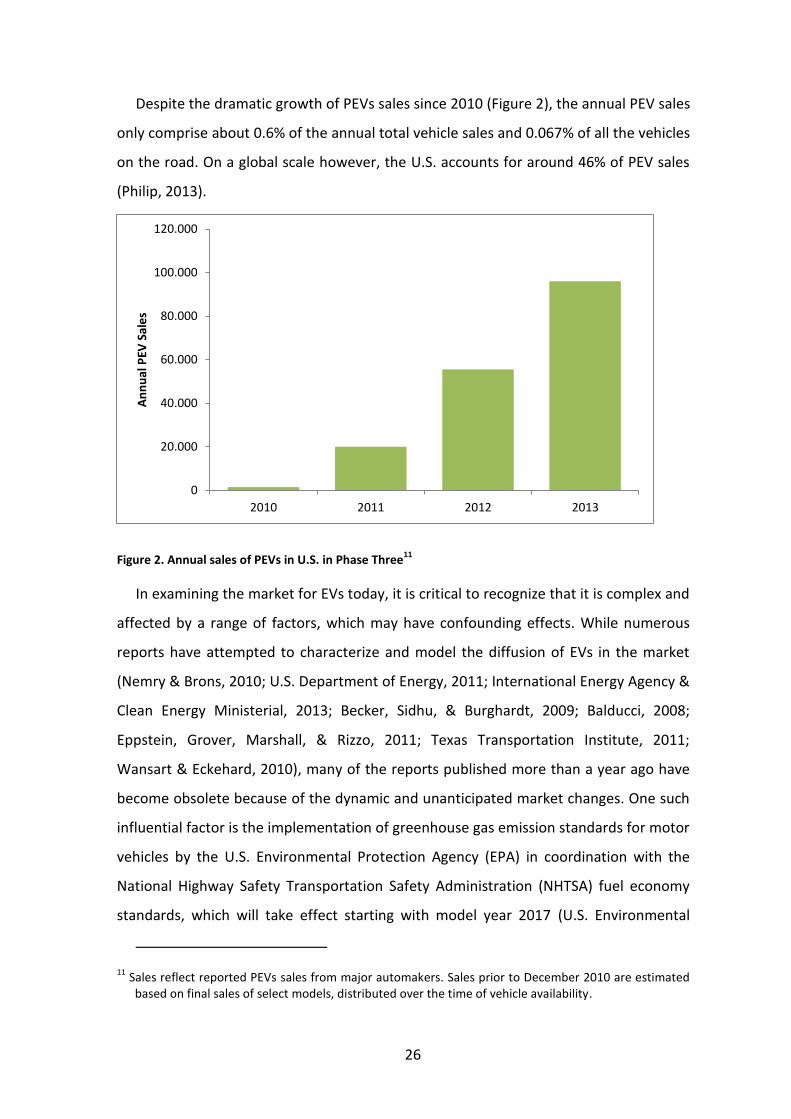
Despite the dramatic growth of PEVs sales since 2010 (Figure 2), the annual PEV sales
only comprise about 0.6% of the annual total vehicle sales and 0.067% of all the vehicles
on the road. On a global scale however, the U.S. accounts for around 46% of PEV sales
(Philip, 2013).
Figure 2. Annual sales of PEVs in U.S. in Phase Three11
In examining the market for EVs today, it is critical to recognize that it is complex and
affected by a range of factors, which may have confounding effects. While numerous
reports have attempted to characterize and model the diffusion of EVs in the market
(Nemry & Brons, 2010; U.S. Department of Energy, 2011; International Energy Agency &
Clean Energy Ministerial, 2013; Becker, Sidhu, & Burghardt, 2009; Balducci, 2008;
Eppstein, Grover, Marshall, & Rizzo, 2011; Texas Transportation Institute, 2011;
Wansart & Eckehard, 2010), many of the reports published more than a year ago have
become obsolete because of the dynamic and unanticipated market changes. One such
influential factor is the implementation of greenhouse gas emission standards for motor
vehicles by the U.S. Environmental Protection Agency (EPA) in coordination with the
National Highway Safety Transportation Safety Administration (NHTSA) fuel economy
standards, which will take effect starting with model year 2017 (U.S. Environmental
11 Sales reflect reported PEVs sales from major automakers. Sales prior to December 2010 are estimated
based on final sales of select models, distributed over the time of vehicle availability.
0
20.000
40.000
60.000
80.000
100.000
120.000
2010 2011 2012 2013
An
nu
al P
EV S
ale
s
27
Protection Agency, 2013). As a result, future vehicles’ designs will have to consider not
just improvements in fuel efficiency but also emission reductions, giving EVs a
competitive advantage since they have the highest fuel economies and the lowest
emissions on the automotive market.
In some ways the changes have aided the progress of EVs in market diffusion. For
example, a recent report found that consumer acceptance is better than originally
predicted and that demand for PEVs has grown faster than expected, due to supportive
policy implementation, low operation costs, expanded PEV selections, and dropping
prices (Marcacci, 2013). In other cases, the conditions today have been less favorable
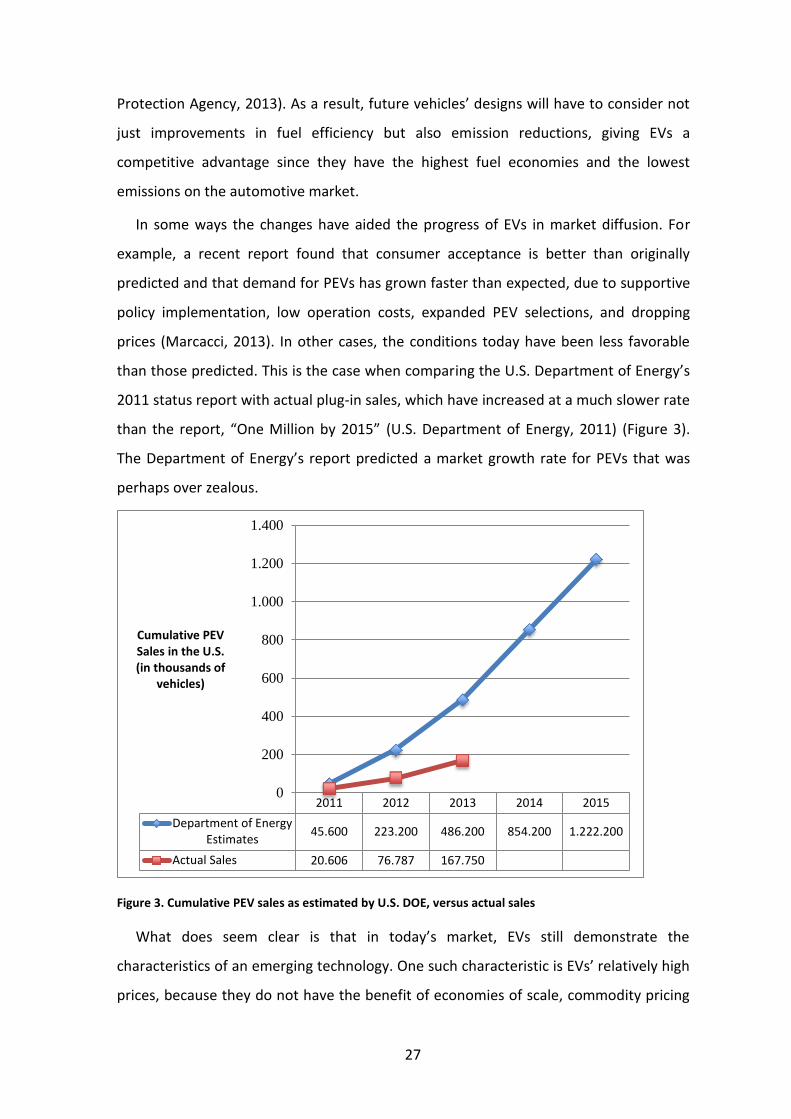
than those predicted. This is the case when comparing the U.S. Department of Energy’s
2011 status report with actual plug-in sales, which have increased at a much slower rate
than the report, “One Million by 2015” (U.S. Department of Energy, 2011) (Figure 3).
The Department of Energy’s report predicted a market growth rate for PEVs that was
perhaps over zealous.
Figure 3. Cumulative PEV sales as estimated by U.S. DOE, versus actual sales
What does seem clear is that in today’s market, EVs still demonstrate the
characteristics of an emerging technology. One such characteristic is EVs’ relatively high
prices, because they do not have the benefit of economies of scale, commodity pricing
2011 2012 2013 2014 2015
Department of EnergyEstimates
45.600 223.200 486.200 854.200 1.222.200
Actual Sales 20.606 76.787 167.750
0
200
400
600
800
1.000
1.200
1.400
Cumulative PEV Sales in the U.S. (in thousands of
vehicles)
28
for raw goods, and learning curve advancement effects (McGrath, 1998). When sales
volumes increase, however, these disadvantageous characteristics should dissipate,
thus enabling EVs to become more competitive.
4.3 Sales
According to estimates, the target market share needed for PEVs to be considered
fixed in the mainstream auto market (and thus successfully diffused), would be 10%
(Hensley, Knupfer, & Pinne, 2009; Wansart & Eckehard, 2010). In order to achieve this
market share in today’s automotive market, however, around 1.2 million plug-ins would
need to be sold annually—meaning that PEV sales would need to increase 1100% from
expected 2013 PEV sales. Cumulative sales for Phase Three PEVs thus far are estimated
to be about 167,750, and PEV market share of new cars is a mere 0.67% however
(Electric Drive Transportation Association, 2013).
While assessments of future EV sales range considerably, recent estimates suggest
considerable growth in PEV sales12 in the next decade, however. Projections suggest
that by 2020, EVs could have around 5-7% market share, while hybrid and all EVs
cumulatively could have as much as 26% of the new car market (Boston Consulting
Group, 2010; King, 2013). Assuming the long-term light-duty vehicle sales trends
remain relatively consistent, passenger vehicle sales in 2020 will be about 15.1 million
(Center For Automotive Research, 2012), in which case a 7% market share would equate
to nearly 1.06 million PEVs sold—450,000 short of a 10% market share, but such a
quantity of vehicle sales would certainly represent a noteworthy commitment to PEVs
by consumers.
The rapid growth of PEVs in Phase Three suggests that mainstream status may be
feasible for the future. By the beginning of the third quarter in 2013, cumulative PEV
sales for Phase Three had already doubled and PEV sales in 2013 alone grew two-fold
from those in 2012. Still, there has been no lack of media reporting that PEV sales are
disappointing. While sales have not met projections such as those outlined in the “One
Million by 2015” report from the Department of Energy (2011), when 100% growth is
12 Compound annual growth rate estimated at 18.6%, which is significantly greater than the predicted
growth for the current passenger vehicle market in the same timeframe (Navigant Research, 2013).
29
considered a disappointment—especially in the early stages of an innovative
technology’s diffusion—the impact of excessive social expectations must be considered.
PEV technology is still in an early-adoption phase, and according to the Diffusion of
Innovations model, the technology’s most rapid growth should not occur until PEVs
enter the phase of mainstream adoption.
There are several factors that still act as barriers to mainstream PEV adoption. One
such degrading factor is the relatively slow production rate of EVs. As adoption is still in
early stages, and demand is inchoate, automakers have been slow to produce the
vehicles for fear that demand will not be enough to sell the vehicles. In some cases
however, demand has exceeded the expectations of the automakers (Webb, 2013; U.S.
Department of Energy, 2011), and dealerships haven’t been able to maintain stock --
such as the subcompact Chevrolet Spark EV, which has limited market availability13. In
mid-2012, Nissan faced a similar issue with its EV, the Leaf, as it was backlogged with
26,000 reservation holders (Berman, 2012). In 2013, the Leaf has maintained its position
as one of the best-selling PEVs on the market. Furthermore, Leaf production (including
the lithium-ion battery) has begun to occur stateside, in Smyrna, Tennessee, which is
expected to boost both production and sales (Voelcker, 2014).
Additionally, in the case of Tesla Motors EVs, surplus demand, rather than lack of
demand, has been the issue. In fact, the waiting period to receive a Tesla vehicle has
been known to exceed a year,14 though this is partly because the vehicles are built-to-
order, and the company itself is relatively new. Despite recently increased production
and exceeding its delivery goal of 20,000 vehicles in 2013, Tesla’s Model S still has a
waiting list. Tesla sales were not limited by demand, but rather battery cell production
restrictions from their supplier, Panasonic, put a ceiling on the Tesla Model S deliveries.
A new agreement between the companies, tripling the battery production, is expected
to alleviate this issue in 2014, however (Elliott, 2013).
While there is clearly considerable interest in PEVs, early consumers have
demonstrated their willingness to pay the incremental price for EVs when specific
13 Only offered for lease in California and Oregon.
14 The current time between ordering a Tesla Model S sedan is approximately 2-3 months (Tesla Motors,
2013), but in 2012 Tesla had over 10,000 backlogged orders (Berman, 2012).
30
characteristic of the vehicles resonate with them (U.S. Department of Energy, 2011). In
the case of Tesla Motor’s Model S EV, the performance (in terms of both range and
handling) and power (it can go from 0 to 60 mph in less than 4 seconds) of the vehicle
has been widely regarded as exemplary, yet the high upfront cost make the vehicle too
expensive for most of the population. Tesla cars are also exclusive, because of the
limited quantity of vehicles available, and classifiable as luxury vehicles based on their
price and sport-vehicle performance. In this case, motivation for purchasing such a
vehicle may also be for status—a motivator that is commonly observed in early
adopters of innovative technology (Rogers, 1995). In the cases of the Chevrolet Spark
EV and the Nissan LEAF, both exceptional performance and relatively low price
(Appendix 1) contribute to the vehicles’ popularity—qualities that have proven to be
critical for demand and acceptance.
Though the Chevrolet Spark is still relatively new to the market, having just been
released in the summer of 2013, it has already been nominated for the Green Car
Report’s ‘Best Car to Buy’ award (Voelcker, 2013a). The vehicle’s popularity, despite its
limited market exposure, may be because it has a higher combined fuel efficiency rating
than any other retail PEV available on the market, or because it can go from 0 to 60 mph
in 7.6 seconds— 50% faster than its gasoline counterpart Spark. The vehicle’s acclaim
also reflects that it offers one of the highest ranges of any PEV on the market, with one
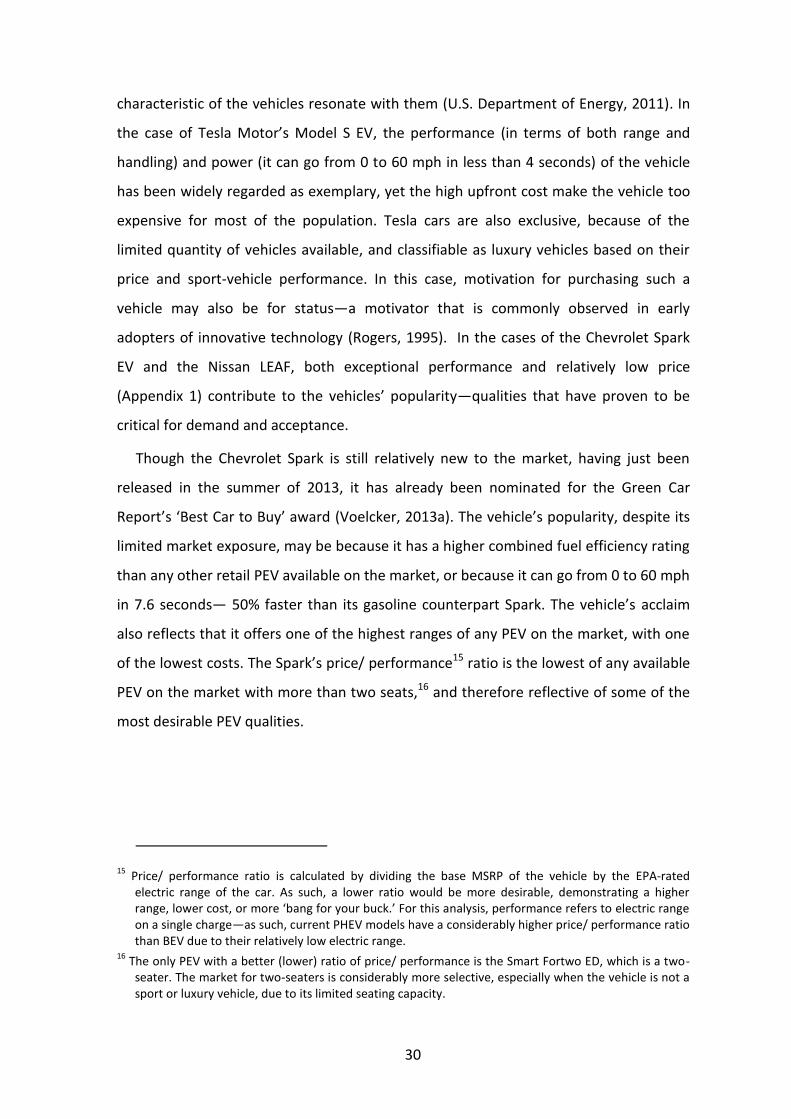
of the lowest costs. The Spark’s price/ performance15 ratio is the lowest of any available
PEV on the market with more than two seats,16 and therefore reflective of some of the
most desirable PEV qualities.
15 Price/ performance ratio is calculated by dividing the base MSRP of the vehicle by the EPA-rated
electric range of the car. As such, a lower ratio would be more desirable, demonstrating a higher range, lower cost, or more ‘bang for your buck.’ For this analysis, performance refers to electric range on a single charge—as such, current PHEV models have a considerably higher price/ performance ratio than BEV due to their relatively low electric range.
16 The only PEV with a better (lower) ratio of price/ performance is the Smart Fortwo ED, which is a two-
seater. The market for two-seaters is considerably more selective, especially when the vehicle is not a sport or luxury vehicle, due to its limited seating capacity.
31
Figure 4. Price/ performance ratio of available PEV models. Note: orange denotes BEVs; blue denotes PHEV.
The Nissan Leaf has the next best price/ performance ratio, and is classified as a
midsize vehicle therefore appealing to those consumers who want more space. This
may be a particularly influential factor in the American auto market, since, of the top
three best-selling vehicles, two are trucks and the third is a midsize car.17
In order to advance technologic diffusion beyond the early adopters, who are
generally the most willing to adopt new ideas, EVs must appeal to the majority of
consumers. There are two predominant conditions necessary for majority appeal:
technological acceptance and societal acceptance.
4.4 Enhancing and Degrading Factors: Technological
For the purpose of this report, technological acceptance is divided into three major
factors affecting the technologic performance of EVs: cost, range and infrastructure.
17 The top three best-selling vehicles in the U.S. (in descending order) are: Ford F-series (pickup truck);
Chevrolet Silverado (pickup truck); Toyota Camry (midsize sedan) (Muller, 2013b).
0
1000
2000
3000
4000
5000
6000
7000
Pri
ce/
Pe
rfo
rman
ce (
$/
EV m
i)
32
4.4.1 Costs
Vehicle costs can be subdivided further into two categories of cost: capital costs and
long-term cost. Capital costs describe the purchase price of the vehicle, and for this
analysis, the MSRP of the vehicle is used as the base price, though dealership prices may
vary. The long-term costs consist of fueling and maintenance, based on national
averages in vehicle use and fuel cost.
4.4.1.1 Capital Costs
As is characteristic of emerging technologies, the relative price of a plug-in vehicle is
higher than that of its gasoline counterpart. As an example, the MSRP for the gasoline
2014 Chevrolet Spark18 is $14,995 while the base price for the EV of the same car is
almost double the price, at $26,685. The steep incremental price of the EV is partly due
to the cost of the vehicle’s 21-kWh Li-ion battery pack, which accounts for around
$10,50019 of the total cost. In the case of the Nissan Leaf, the battery pack accounts for
about a quarter of the vehicle’s price tag20 but in some models it can account for as
much as half of the costs (Kardashian, 2012). Though battery prices have come down
considerably from past prices, more price reduction is needed in order for the upfront
cost of EVs to be price-competitive with ICEs.
Considerable battery price reductions over 50% are anticipated for the near future. A
recent report from Navigant Research suggests that prices may drop to $300/kWh by
2015, and $180/kWh by 2020 (Motavalli, 2013). Using the Chevrolet Spark EV as an
example, these reductions in battery prices could reduce the vehicle MSRP to $22,485
and $19,965 respectively. If the current federal tax credit21 for a new EV purchase were
still available, the consumer cost after applying the credit would drop to $14,985 and
$12,465 respectively. Given these estimates, the capital cost of a Chevrolet Spark EV
would be competitive with the gasoline version by 2015. These estimates assume that
18 Based on specs for the 2014 Chevrolet Spark 1L Automatic FWD (Appendix 1).
19 Based on average Lithium-ion EV battery cost of $500/kWh (Motavalli, 2013; Jaffe, 2013).
20 The LEAF battery pack is valued around $8,000, while the base price for the LEAF SV (mid-range version)
is $31,820. 21
Valued up to $7,500. For the purpose of this report, the full $7,500 credit is used. Federal credits for PHEVs are less—between $2,500- 4,007.
33
the base price of the Spark EV would remain fixed, which may not be the case if
production increases however, in which case costs may come down further.22
Such reductions in the capital costs of the EVs will be necessary in order to make
progress toward mainstream adoption. This has become increasingly clear for retail
vehicle customers, who have been found to be increasingly concerned with upfront
costs, rather than long-term payoffs or lifetime costs of the vehicles. On the other hand,
fleet purchasers tend to base vehicle purchase decisions more on the long-term costs of
vehicle ownership (U.S. Department of Energy, 2011).
The upfront costs of EVs have been in decline recently however. Throughout 2013,
many major automakers offering EVs elected to decrease upfront costs to encourage
sales (Muller, 2013a). These price drops, along with federal incentives, have begun to
make the upfront costs of vehicles much more competitive. For example, the 2013
Nissan LEAF base model, the ‘S,’ has a net value of $21,300 after applying the maximum
federal tax credit available to purchasers. In contrast, the most popular sedan sold in
the U.S., the Toyota Camry, has a base MSRP of $22,235.
An increase in sales, driven by decreasing consumer costs, would have a positive
feedback effect. As sales and production increase, production efficiency should improve
and marginal costs should decline. These benefits of increased sales and production
volume should lead to a further drop in upfront costs of EVs. Additionally, with
predicted declines in battery costs, there is potential for PEVs to be price-competitive
with comparable ICEs well within the next decade.
4.4.1.2 Long-term Costs
In considering long-term costs, the results are more clearly favorable towards the
EVs. Components of the long-term costs include the maintenance and fuel costs.
Overall, maintenance cost for EVs are lower than ICEs because there are fewer moving
parts in EVs, and therefore fewer mechanisms that need maintaining. On average, the
annual maintenance costs are about a third less for EVs than their petrol-powered
22 The estimates also assume that the federal grant would still be available, which may not be the case
since it is intended to stimulate only early PEV sales. As sales continue to grow, the grant may be retracted. Additionally this grant is vulnerable for retraction if budget and/ or political opinion changes.
34
counterparts (Delucchi & Lipman, 2001). Fuel costs can vary considerably for both petrol
and electric cars depending on region and vehicle efficiency. However, the average cost
of driving 100 miles in an EV is a quarter of the average price to drive 100 miles in a gas-
powered car (Union of Concerned Scientists, 2013).23 The typical difference in fueling
costs can amount to an annual fuel savings of $750 - $1,200 for EV owners. However,
the fuel cost savings tend to be heavily discounted by potential buyers (U.S. Department
of Energy, 2011), and consequently the value of the projected fuel savings is diminished.
Still, in examining annual ownership costs of EVs versus ICEs, EVs have a clear
advantage. In comparing one of the most popular EVs on the market, the midsize 2013
Nissan LEAF, with the best-selling midsize sedan on the market, the Toyota Camry, the
estimated annual cost is actually 38% less for the LEAF.24 In considering total costs
however, there are still conflicting accounts of whether EVs or ICEs come out on top.
While some claim that EVs are already cheaper than ICEs on a total-cost basis (Becker
T., 2009), other accounts maintain that ICEs still have the cost-advantage—but that EVs
will have lower total ownership costs within five years (Boston Consulting Group, 2010).
4.4.2 Range
Vehicle range is an issue that is frequently cited in the media as a barrier to
widespread EV adoption. It is therefore necessary to address a newly recognized social
phenomenon called the ‘range paradox.’ There is an observable disparity between the
needed or sufficient range, on the one hand, and the expected or preferred range, on
the other. While the average daily driving range in the United States was found to be
about 40 miles—half of the average EV range—the stated preferences for EV range
have been 4.65-7.5 times higher than the actual daily driving needs (Franke & Krems,
2013; Kodjak, 2012; Duffer, 2013). The significant difference between the stated range
preferences and needs, signals that both technologic improvements, predominantly
from battery development, and more realistic social expectations are needed (the social
factor is discussed later in ‘Social Acceptance’ section).
23 Compares a 2013 Nissan LEAF charged at the national average residential electricity rate, with a
compact gasoline car fueled at $3.65/gallon and fuel economy of 27 mi/gallon. 24
Assuming 15,000 miles driven annually, 55% city, 45% highway, the estimated annual operating cost of a new Camry was $4,332, while the annual operating cost for a new LEAF was estimated to be $2,680.
35
4.4.2.1 Battery Improvements
Among potential technological improvements, the vehicles’ battery packs are the
bottleneck that most limits range. Improving EV battery technology in a similar manner
to how lead acid battery capacities improved between Phases One and Two is critical.
Merely adding more cells to the battery pack would put additional weight to the
vehicle, thus negating some of the added benefits. Fortunately, EV battery innovations
have been occurring at a rapid pace. EV battery technology has improved at a pace of
about 5 -15% per year, and in the last five years alone, battery energy density has
doubled. While the time it takes for innovative battery technology to go from the lab to
commercial use is typically 5 - 7 years, technology that would double the energy density
of current EVs is reported to be available in just a few years, suggesting that the rate of
battery improvement may be increasing (F. North, personal communications, October
18, 2013).
The maturation of ICE technology will also influence when EV technology becomes
competitive, as is true of technologic discontinuity. ICE technology has been under
development for over a century, and there are those who argue that it is approaching
maturity (Rettie, 2013). ICE technology still has some room for improvement with
regard to fuel economy however. A model developed by the University of California’s
Institute of Transportation Studies, found that between the present and 2025-2030, fuel
economy could be doubled from today’s average vehicle standard. Accordingly, these
improvements in ICEs would be the most cost-effective method to reach carbon-
reduction goals. After 2030, however, the model found that PEVs would be more cost-
effective than further improvements in ICEs for meeting later carbon-reduction goals
(Fulton, 2013) — ICE fuel economy improvements alone simply won’t be capable of
meeting stricter fuel economy requirements in the future. This finding suggests that fuel
economy, as a criterion of vehicle performance, may reach technologic maturity in the
next 10-15 years as well.
Conversely, while the EV faces many challenges as an emerging technology, one
benefit is that emerging technologies tend to have the most potential for reaching
higher returns on investment through performance improvements (McGrath, 1998).
36
This may apply to potential improvements in EV batteries, and therefore to vehicle
range.
4.4.3 Infrastructure
EV infrastructure development is another factor that will undoubtedly influence the
adoption patterns of PEVs. While the last twenty years have seen a decline in gas
station numbers in the U.S.,25 today, gas stations still outnumber electric fueling
stations nearly six-to-one26 (U.S. Department of Energy, 2013; U.S. Census Bureau,
2008; Recargo, PlugShare, & PluginCars.com, 2013). EV charging locations, however,
have been increasing rapidly over the course of Phase Three. Between January 2011 and
now, the number of EV charging stations has increased over tenfold, with more than
20,000 stations currently installed and the number continuing to grow progressively as
PEV sales increase (Ingram, 2013).
Still, the relatively small number of EV charging stations drives the social
phenomenon of ‘range anxiety.’ Range anxiety, which stems from public concern over
PEVs’ limited range, is one of the biggest and most pervasive barriers to mass adoption
of PEVs. Infrastructure improvements will be necessary for PEVs to become increasingly
competitive with ICEs because the current infrastructure, which favors ICEs, continues
to instill technologic ‘lock-in,’ thus acting as a substantial degrading factor to EV
progress.
4.4.4 Technological Lock-in
The market can be slow to turn away from its familiar path, even when a
technologically superior innovation enters the market. When steam-powered
locomotives were introduced, for example, it took nearly two decades for them to gain
market dominance over the incumbent ‘technology’ of horses. In 1825, when one of the
first major railways, the Stockton and Darlington Railway, was constructed in northeast
England, it was built to accommodate both horse-driven trains and steam-powered
25 In 1994, over 200,000 gas stations were counted in the U.S. (U.S. Department of Energy, 2008).
26 Currently, the U.S. has over 20,000 electric fueling stations and approximately 117,000 gas stations.
‘Fueling stations’ figures were counted as the number of available outlets however, so the discrepancy in counting style should be noted when comparing the two numbers.
37
locomotives (Cowan & Hulten, 1996). While the steam-powered trains clearly held a
technological advantage over horses for locomotion, the infrastructure did not shift
immediately—the technical ‘lock-in’ or path dependence of society on the incumbent
technology slowed the transition of the emerging technology to mainstream status.
Technological lock-in is based on both social and economic path dependence.
Consumers find comfort in the familiarity of the existing infrastructure for the
incumbent technology. In the case of ICEs, auto repair shops and gasoline stations are
familiar sights, which consumers know how to use and expect to see on major
roadways. In comparison, public EV charging areas are not as abundant, and many areas
still have no publically accessible charging stations. Also gas stations are generally
accessible to the public, whereas 75-80% of all PEV charging is done at the owner’s
home (Shirk, 2013). As such, comparing the charging infrastructure for PEVs and ICEs is
like comparing apples to oranges, since most PEV drivers don’t need public
infrastructure to meet their daily range needs. Still, access to charging stations is socially
desirable as assurance that, if needed, the vehicle could be charged. In general, most
people are quite risk averse towards new technology, and thus the idea of running out
of range with no place to charge feeds the ‘range anxiety,’ which in turn is a barrier to
EV adoption.
Furthermore, those who are stakeholders or investors in the gasoline infrastructure
of today, such as petrol companies and gas station owners, will likely oppose emergent
technologies that would detract from their business. A major shift to PEVs could
redirect revenue from the petrol industry to the electric utility and battery industries.
4.4.5 Electric Integrity: Grid Reliability and Stability
As EV sales grow, the question of how this new power draw will affect the electricity
grid has surfaced. While increased diffusion of electric vehicles on the market will put
more demand on the national grid, data has also shown that the current grid is capable
of supporting such demand. Research from the U.S. Department of Energy’s Pacific
Northwest National Laboratory found that the grid could support up to 150 million EVs,
meaning that 75% of all the passenger vehicles in the nation would have to be PEVs
(Bullis, 2013).
38
EV charging impact depends largely on how it is done, however. There is no threat to
the grid from charging PEVs from a conventional 110-volt outlet connection, as most
owners do. Grid issues have surfaced as a result of home charging station installations,
which can draw between 6.6-20kW from the grid—equivalent to adding up to three
houses onto the grid. In many cases, local grids sized for smaller electrical loads would
struggle with the rapid addition of such electric loads (Bullis, 2013). The issue can be
accentuated because most PEV sales are not evenly distributed across regions but
instead occur in clustered markets, which feel the bulk of the impact.
However, case studies have found that ‘smart metering’ can effectively address the
issue of excessive grid strain during peak demand by allowing electric utilities to receive
up-to-date feedback about electricity usage and by identifying areas of high demand.
Smart metering would enable a utility company to recognize growing demand from EV
charging and consequently to upgrade the local grid.27 Additionally, utilities offering
special ‘off-peak charging’ rates to EV owners for charging their vehicle at night have
demonstrated success in shifting the added electricity load for EVs from 16:00-20:00 to
00:00-01:00 (Schey, Scoffield, & Smart, 2012; Bullis, 2013). By preventing a surge in
electric demand at peak hours, the threat of additional demand from PEVs can be
alleviated.
Further, because PEVs are able to store electricity, they could potentially provide a
service to the utility and overall electric grid. The technologic capability exists for
utilities to ‘communicate’ with PEVs when they are plugged in — having them charge,
and therefore store energy, when the grid has excess supply, avoid charging when there
is high demand in the grid, and in some cases even redistribute energy back onto the
grid during usage surges (Bullis, 2013; Boyle, 2007).
Use of this technology, referred to as vehicle-to-grid (V2G) technology28 could result
in both added grid stability and also in reduced costs from backup power plants and
27 According to utility reports, upgrades performed due to increased EV demand have been part of
routine grid modernization practices, but the additional demand prioritized the neighborhoods with the excessive grid-demand from PEVs (Bullis, 2013).
28 V2G-enabled PEVs, unlike conventional PEVs, have a special connection that allows power to flow both
to and from the vehicle when plugged in (non-V2G-enabled vehicles can only receive a charge).
39
purchased power during peak demands. Fleet or individual V2G-enabled PEV owners
also could benefit from potential utility payments for such a service, valued at $4,000 a
year (Bullis, 2013; Todd, 2013; Boyle, 2007). A recent report from Navigant Research
suggested that by 2022, revenue from V2G systems globally would produce $190.7
million (Navigant Research, 2013a). Even the largest and oldest federal agency, the U.S.
Department of Defense (DoD), is strongly supporting the development of V2G
technology. In 2013 alone it invested around $20 million in select U.S. markets through
the fitting of 500 V2G-enabled electric vehicles. Additionally, Navigant Research projects
that the DoD will acquire approximately 92,400 electrified vehicles (HEVs, PHEVs and
BEVs) within the next decade, with the intention of using V2G systems within
established microgrids in tactical and non-tactical areas for greater energy efficiency
and energy reliability (Navigant Research, 2013a).
4.4.6 Further Opportunities for Advancement in EV Infrastructure
The latest developments in induction charging systems demonstrate a new possibility
for addressing the issue of EV charging, and progressing developments in EV
infrastructure. Recently, startup company HEVO Power introduced a pilot program for
induction chargers in New York City. The collaborative project with New York University
utilizes current manhole covers, turning them into charging zones from which EVs can
get a charge without plugs (Ferro, 2013). Additionally, researchers at North Carolina
University have been developing and improving the induction charging technology with
the aim to develop wireless highway charging ‘stations,’ which could give PEVs a charge
on the move (Shipman, 2013).
A report by the National Renewable Energy Laboratory (NREL) found that if an EV
could charge while driving on the highway, the cost-effectiveness of an EV purchase
would become more favorable (when compared to an ICE). Further, the report found
that even if the price of a connection device were $1,000, the overall consumer cost
would still be lower than that for a combustion or hybrid vehicle (Brooker, Thornton, &
Rugh, 2010).
There are certainly possibilities for further developments in EV infrastructure that
could affect EV range and recharge time. For these developments to positively influence
EV adoption, however they need to be successfully commercialized. If they are, the EV
40
technologic diffusion rate could be even further influenced by new, disruptive
technology.
4.5 Enhancing and Degrading Factors: Societal
Ultimately though, the adoption or rejection of an innovative technology in the
marketplace relies heavily on social acceptance. Diffusion studies have long recognized
that the dispersion and acceptance of new ideas is largely a product of social influence.
Diffusion of Innovation author Everett Rogers further defines diffusion itself as a process
of information exchange through social networks, and notes that the adoption of the
innovative technology relies on the social channels by which its concept is
communicated (Rogers, 1995). In this sense, familiarity and awareness are key
characteristics that influence societal adoption of new ideas and market adoption of
technology.
For most consumers, new vehicle purchases are the second most expensive
investment they will make—second only to housing. Consequently, new car buyers are
often exceptionally risk-averse and tend to prefer well-proven technology (U.S.
Department of Energy, 2011). Time and social word-of-mouth are, and will continue to
be, critical factors in promoting familiarity. As more PEVs are sold, more people will
interact with, hear about, and become familiar with the new technology. Further,
positive feedback effects will continue to increase familiarity and thus drive more
consumers to consider PEV purchases.
In a study examining how BEVs, an infrastructure-dependent emerging technology,
can compete in the long-term with ICEs, which have an established infrastructure
network, the study’s dynamic, systems-thinking model consisted of several prominent
feedback loops affecting BEV sales. Essentially, these feedback loops suggested that:
more charging infrastructure, which allows for more flexibility in usage,
drives more BEV sales;
increased BEV sales create more customer awareness, which further
influences more potential customers;
potential customers incorporate BEVs into their choice sets—a condition
for potential purchase and more BEV sales;
41
rising numbers of potential customers increase information diffusion of
the BEV technology, leading to more potential customers and sales;
as BEV sales increase, experience with the technology increases, which
drives down unit production costs and purchase prices;
lower purchase prices drive more BEV sales;
increased experience drives battery energy density improvements, thus
improving vehicle range, which creates more potential customers and
BEV sales.
The study found that the most influential feedback factor was that provided by
social word-of-mouth effects (Wansart & Eckehard, 2010). Awareness and a positive
perception of the technology were found to be critical in determining the growth of BEV
market shares.
These observations can be applied to any electrified vehicle. Hybrid models, like the
Toyota Prius, have gained immense recognition in the automotive market today, with
50 different hybrid models currently available, and pricing that has become increasingly
competitive with their non-hybrid counterparts. Some hybrid models, such as the 2014
Lincoln MKZ Hybrid, even have the same starting MSRP as the non-hybrid models.
Although hybrids have grown into their popularity, they were initially received with the
same kind of social cautiousness that PEVs face today—despite not requiring
infrastructure or behavioral changes in fueling. While hybrids have taken nearly a
decade to gain a 3% take rate in the automotive market, PEV sales have demonstrated
double the growth rate of the initial hybrid models (Lehner, 2013). Familiarity with the
partially- electrified hybrid models may very well have contributed to the quicker early
growth of PEV sales however, as hybrids have proven to be reliable, popular, and
cheaper to fuel.
While hybrid models introduced the idea of vehicle electrification, they benefited
from the fact that they essentially perform like a highly efficient ICE. There were no
trade-offs in vehicle range or infrastructure requirements. Plug-in hybrids and range-
extended hybrids are comparable in that drivers can ‘fall back on’ their gasoline engine,
while BEVs require a more significant social change. One of the most notable concerns is
42
with range. As discussed earlier, the social perception of range requirements acts as
both a source of range anxiety and also as a barrier to EV sales.
The range paradox is predominantly a matter of inadequate information. A recent
study found that after three months of driving a BEV, drivers were more comfortable
with the limited range, and their stated range preference was more reflective of their
actual driving needs. Additionally, the study found that drivers who had experience with
an ICE with high range were more likely to have an initial stated range preference
similar to that of the ICE (Jaffe E. , 2013; Franke & Krems, 2013). These observations
suggest a critical pattern in social behavior about plug-ins: PEVs are expected to
perform just as well, if not better than, standard combustion vehicles.
Since people have become accustomed to ICEs, they expect that any new technology
should be able to operate in the same way. People are generally resistant to changing
habits, like plugging into an outlet instead of filling up the gas tank, or feeling
comfortable with a car that has a lower driving range. This may be particularly true for
PEVs with higher price tags in today’s market. The general public is very sensitive to the
initial price of a vehicle and will only be willing to pay the incremental cost if the vehicle
has particularly attractive or stand-out qualities to them (U.S. Department of Energy,
2011). For electric vehicles, such qualities may include the quietness, cleanliness, high
torque, avoidance of gas stations, or even the particular model style. If potential
customers find the vehicle model to be particularly reflective of their individual style or
personality, they are more likely to be willing to pay the additional cost for the EV.
Given this attitude, the importance of having a variety of EV models on the market is
apparent. In Phase Three, the number of available vehicle models has grown rapidly
(Figure 1), with current models providing options in almost every price and performance
range.
4.5.1 Environmental Considerations
A feature shared by all PEVs, however, is low or zero tailpipe emissions—a quality of
PEVs that makes them radically different from standard combustion vehicles is their
43
environmental appeal. Since BEVs are considered to have zero emissions,29 and PEVs
have low or no emissions (depending on usage), one of the notable benefits of
increased EV adoption would be the reduction of greenhouse gas emissions, such as
carbon dioxide, as well as smog. Consumers who are particularly environmentally
conscious are more likely to consider externalities like the greenhouse gas emission and
thus to place more value on the prevention of emissions in their new car purchasing
decisions. Therefore, those customers may be willing to pay extra for an EV.
A common concern about the environmental impact of EVs is the impact of the
production process, including the battery, and of the source of electricity. While many
reports have been done on this topic, the results largely depend on the parameters of
the evaluation and on the time of assessment. While it is not within the framework of
this report to critically analyze environmental assessments of EVs, a consensus from
these assessments is that as energy sources with less global warming pollution intensity
are added to the grid, such as renewables like solar, the more environmentally
advantageous EVs become. On the other hand, the pollution caused by burning a liter of
petrol in an ICE is virtually constant (although fuel economy gains can reduce petrol
consumption).
In order to address misinformation and uneven information distribution about the
pollution intensities of electricity sources, the U.S. Department of Energy has designed a
tool called Beyond Tailpipe Emissions that enables a user to input his or her location and
a specific plug-in vehicle model to analyze location-specific emissions. Since the majority
of states have implemented a Renewable Portfolio Standard (RPS) that sets progressive
targets for in-state renewable energy installations, most states’ average carbon
intensity of energy supplies (as well as the nation’s average) have been in decline
(U.S. Energy Information Administration, 2013a).
4.5.2 Policies
Another factor underlying the developments and diffusion of EVs is political
regulation and incentives. In 2011 when the National Highway Safety Administration
and the U.S. Environmental Protection Agency jointly developed both fuel economy and
29 Referring to tailpipe emissions from on-board power sources.
44
greenhouse gas emission standards for future automobiles (U.S. Environmental
Protection Agency, 2013), they paved a progressive path for nationally mandated
emission reductions. That same year, President Obama called for the increased
numbers of EVs on the roads. These national commitments create a framework and
support for the developments of PEVs. Furthermore, hundreds of state and local
incentives and policies are emerging for PEV owners. Such policies include HOV lane
access, free downtown parking, reduced registration fees, waived emission testing and
additional tax credits (on top of the federal tax credit), just to name a few.
Recently, seven states30 have even joined California’s re-established ZEV Mandate,
which outlines a minimum requirement of 10-miles all-electric range for PHEV, and an
overall goal of putting a cumulative 3.3 million ZEVs on the roads by 2025 (Voelcker,
2013b). Furthermore, the eight states (California included) signed onto a memorandum
of understanding that calls for more tax breaks for PEVs, increasing numbers of PEVs in
government fleets and improvements in EV infrastructure (Tonachel, 2013; Nelson,
2013). Given that cost and lack of infrastructure are two of the biggest concerns for
potential consumers, this initiative could encourage more people to consider PEVs in
their choice sets when looking at new cars. Additionally, because the eight states
represent just under a quarter of the national auto market, these commitments help to
magnify the ZEV Mandate’s ability to drive PEV development and diffusion.
30 Representing Connecticut, Maryland, Massachusetts, New York, Oregon, Rhode Island and Vermont.
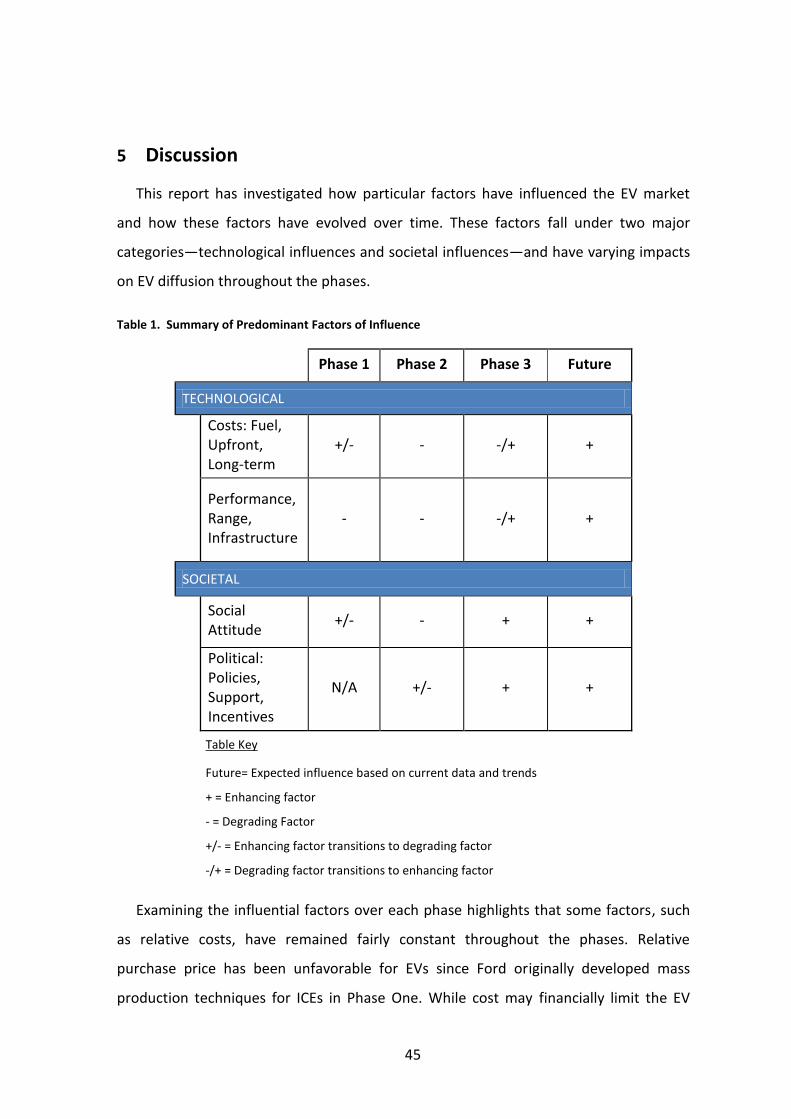
45
5 Discussion
This report has investigated how particular factors have influenced the EV market
and how these factors have evolved over time. These factors fall under two major
categories—technological influences and societal influences—and have varying impacts
on EV diffusion throughout the phases.
Table 1. Summary of Predominant Factors of Influence
Phase 1 Phase 2 Phase 3 Future
TECHNOLOGICAL
Costs: Fuel, Upfront, Long-term
+/- - -/+ +
Performance, Range, Infrastructure
- - -/+ +
SOCIETAL
Social Attitude
+/- - + +
Political: Policies, Support, Incentives
N/A +/- + +
Examining the influential factors over each phase highlights that some factors, such
as relative costs, have remained fairly constant throughout the phases. Relative
purchase price has been unfavorable for EVs since Ford originally developed mass
production techniques for ICEs in Phase One. While cost may financially limit the EV
Table Key
Future= Expected influence based on current data and trends
+ = Enhancing factor
- = Degrading Factor
+/- = Enhancing factor transitions to degrading factor
-/+ = Degrading factor transitions to enhancing factor
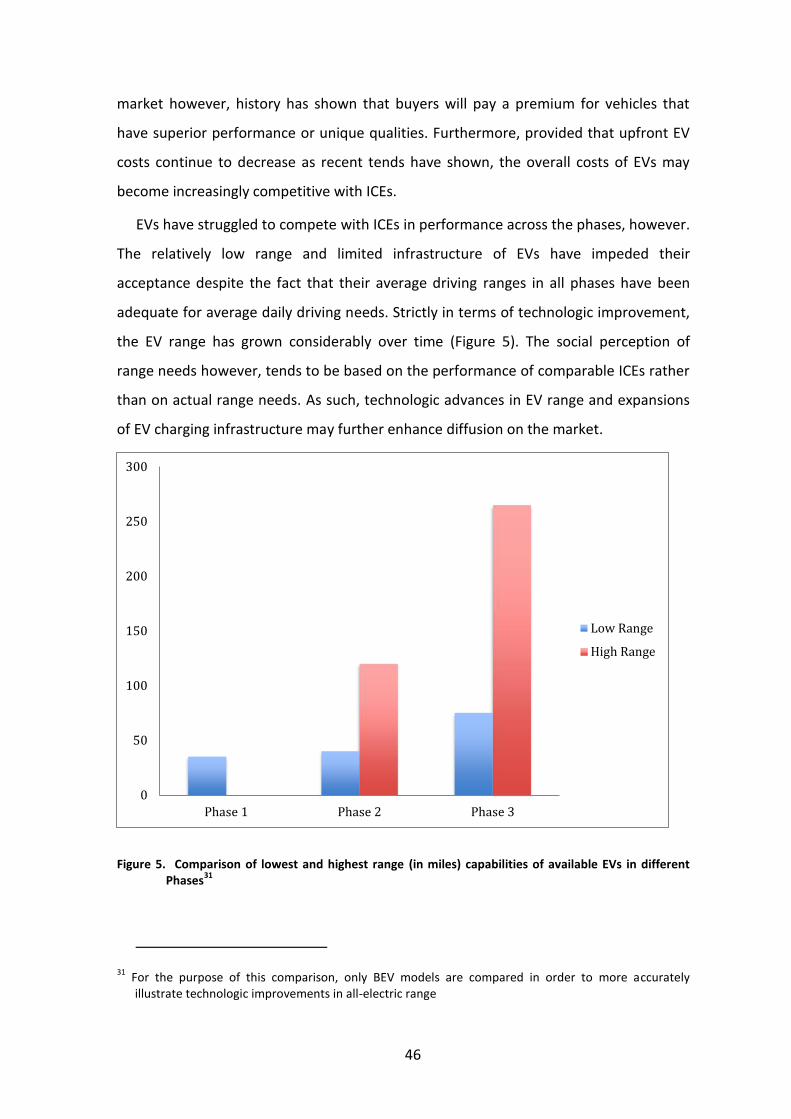
46
market however, history has shown that buyers will pay a premium for vehicles that
have superior performance or unique qualities. Furthermore, provided that upfront EV
costs continue to decrease as recent tends have shown, the overall costs of EVs may
become increasingly competitive with ICEs.
EVs have struggled to compete with ICEs in performance across the phases, however.
The relatively low range and limited infrastructure of EVs have impeded their
acceptance despite the fact that their average driving ranges in all phases have been
adequate for average daily driving needs. Strictly in terms of technologic improvement,
the EV range has grown considerably over time (Figure 5). The social perception of
range needs however, tends to be based on the performance of comparable ICEs rather
than on actual range needs. As such, technologic advances in EV range and expansions
of EV charging infrastructure may further enhance diffusion on the market.
Figure 5. Comparison of lowest and highest range (in miles) capabilities of available EVs in different Phases
31
31 For the purpose of this comparison, only BEV models are compared in order to more accurately
illustrate technologic improvements in all-electric range
0
50
100
150
200
250
300
Phase 1 Phase 2 Phase 3
Low Range
High Range
47
Social attitudes in each phase have been consistently critical to the progress of EV
diffusion. The growing majority showed their desire for independent mobility in Phase
One, for sport utility vehicles during the cheap fuel days of Phase Two, and need for the
combination of fuel-economy and performance in Phase Three. While social attitudes
towards EVs have not been particularly favorable since ICEs became dominant in Phase
One, opinions on EVs will likely become progressively positive as sales and familiarity
increase in the future. Additionally, political factors, such as fuel economy policies and
federal incentives for EVs, have demonstrated the ability to encourage social and
industry acceptance; alternatively, political obstacles, such as the legal proceedings of
the ZEV Mandate in Phase Two, have proven the ability to halt EV progress. If political
support endures or improves, as predicted, its enhancing effect will certainly follow.
Collectively, the evidence suggests that the adoption of EVs as a mainstream
technology depends on the enhancing factors of influence outweighing the degrading
factors in relation to ICEs. Current trends suggest that within the next decade, all factors
may be enhancing, and thus support EV diffusion into the market.
5.1 The Impact of Beginnings
One of the most striking features of EV diffusion is that all three diffusion phases
have been defined predominantly by the conditions in which they started.
5.1.1 Phase One
Since the electric motor had just been invented at the beginning of Phase One,
electric-powered mobility was groundbreaking technology. The early incorporation of
electric motors into carriages and public service cabs was well received and supported
with high demand for nearly a decade. As such, the early EV market showed
characteristics of a pull market.
The decline of EVs at the end of this phase was largely a result of changing social
attitudes, the utilization of mass-production techniques by ICE companies, and the
inability of the main EV companies to adapt to the changing social attitudes and
production methods. The EV automakers of this phase were trying to push EVs to fulfill
their vision of a unified electric transportation plan, rather than responding to social
demands. When gasoline cars came to dominate the roadways, ownership of roads
48
essentially shifted from communities to individuals. However, EVs were originally
intended to unite communities as part of a master plan to connect metropolitan
transportation systems (Madrigal, 2011). The dominance of the gasoline car was not so
much a victory of technology as it was a victory of ideals.
5.1.2 Phase Two
Phase Two began as a result of political action. California’s ZEV Mandate pressed
automakers to develop EV models into a market that wanted utility and sport vehicles.
Low fuel prices and low social concern about emissions set the backdrop for relatively
low demand for vehicles such as the EV. Consequently, automakers developed
compliance vehicles in order to remain in the California auto market, but the models
were available in only a few regions, in limited quantity, and only through closed leases.
Despite the enthusiasm for EVs from a small group of supporters, the ZEV policy
attempted to push market demand and resistant automakers up the steep hill of
diffusion on its own. The government-backed lawsuit actions against CARB kicked the
knees out from the ZEV Mandate, thus causing the diffusion progress to digress as
automakers withdrew their EV models, and ended Phase Two.
5.1.3 Phase Three
Phase Three’s initiation occurred as a result of innovation, policy and social demand.
Just prior to the beginning of Phase Three, the birth of an innovative EV company, Tesla
Motors, along with its introduction of their Roadster model, attracted considerable
publicity in the media and recreated the image of electric cars as sexy performance
vehicles.
Within Phase Three, political support in the form of federal incentives, funding, and
fuel economy requirements, has played a vital role in encouraging EV developments.
Accordingly, EV models from nearly every major automaker have been introduced
recently, and some automakers have more than one plug-in model available.
Furthermore, EV sales in Phase Three have grown more rapidly than the sales in the
other phases, demonstrating increased consumer demand.
Finally, in contrast to the first two phases, social demand for fuel-efficient
automobiles is high. Increasing public concern with energy security, volatile gas prices,
49
the economic recession and environmental issues all played a role in driving consumer
demand for more efficient vehicles. Given the high efficiency, alternative fuel source
and low fueling costs of EVs, public opinion is more favorable towards EVs than it has
ever been before.
It appears that the combination of social factors, political factors, and innovative
technology in Phase Three has opened a window of opportunity for EV diffusion that
was never available before.
5.2 Prospects for the Future
Looking towards future diffusion of EVs, the findings of this study highlight several
factors that, if improved, can promote further EV diffusion.
Diffusion studies have demonstrated that social influences, such as the subjective
evaluations of innovation users in social networks have a considerable effect on
technological perception and on consumers’ adoption decisions (Rogers, 1995). The
influence of seeing more EVs on the streets, knowing people who own (and enjoy) an
EV, and the general information proliferation about EVs will likely encourage more
consumers to consider EVs in their potential choice sets when purchasing a new vehicle.
Additionally, automaker advertising can assist in correcting the informational
asymmetry between ICEs and EVs.
In considering Everett Rogers’ description of the adoption curve, a Navigant Research
survey found that EV technology might be at the tipping point of social adoption. In the
survey, respondents who answered that they would consider a BEV or PHEV as their
first or second choice preference for a new vehicle purchase were further asked to self-
identify themselves within a category of adoption status (i.e. early adopter, early
majority, late majority, or laggard). The survey found that more than 70% of the
respondents considered themselves to be either early majority or late majority
(Navigant Research, 2013c). These findings suggest that the diffusion of the technology
may be at a point that it is now appealing to the majority, rather than just to early
adopters. However, the time lag to reflect such a transition may still be primarily due to
the relatively long turnover rate for vehicles.
Furthermore, favorable economics will continue to be a predominant factor of
influence in EV diffusion. While BEVs on the market today, with 75-100 miles on a
50
charge and prices around $30,000, are more attractive to majority adopters, price
decreases from battery improvements and economies of scale will help to make EVs
appeal to even more consumers. Research suggests that, ideally, BEVs would have a
range of 200 miles and an upfront cost less than $25,000 to become more socially and
economically attractive (Sommer, 2013).
Another consideration in the future of EVs is their role in meeting future fuel
economy and greenhouse gas emission regulations. In terms of maximum cost
effectiveness, fuel economy improvements will be cheaper in the short-term, but within
the next couple of decades, adoption of PEVs will become the more cost-effective
method of satisfying the regulation requirements, according to a study at the University
of California, Davis (Fulton, 2013). Building up the PEV market now would ease this
future transition.
5.2.1 Stochastic Element
In basic economic models of consumer behavior, we assume that it is rational for a
consumer to choose an option from a set of alternatives if the benefits of the option
outweigh the cost, or if the option has greater utility to the consumer than the other
options. We know however, that along with rational thought, there is also a stochastic
element, or randomness in the decision-making process.
Consider the computer keyboard used almost exclusively today, the QWERTY
keyboard (named after the first six alphabetical keys on the keyboard). The layout of the
alphabetical keys was designed to slow down typing. At the time of the QWERTY
keyboard invention, in 1873, typing was done on typewriters, and the predominant
issue with the type technology was that the keys were prone to jamming if adjoining
keys were used too quickly consecutively. Christopher Latham Sholes designed the
QWERTY keyboard to minimize jamming—putting commonly used letters far apart to
slow down typewriters, thus eliminating jamming (Rogers, 1995). Today, when typing is
done on stationary keypads, the QWERTY layout’s original design purpose has been
made obsolete—yet the design persists, even though there is a good alternative.
The Dvorak keyboard, designed by Professor August Dvorak in 1932 as a result of
extensive time-and-motion studies, eliminates the inefficiencies of the QWERTY layout
by arranging the keys to enable the quickest and most efficient typing (Rogers, 1995).
51
The Dvorak keyboard layout could benefit typists by reducing fatigue as well as errors,
while saving time. Yet, despite the clear technological advantages of the Dvorak
keyboard, the QWERTY keyboard is overwhelmingly dominant.
The introduction of an innovative technology into a market with a long withheld
incumbent technology is always an uphill battle against social inertia and path
dependence. Technologic superiority alone cannot secure an emerging technology’s
success on the market. Ultimately, it is society that decides whether or not to adopt a
new technology—and society may not always choose the ‘best’ technology. A
divergence from technologic lock-in requires a shift in social momentum.
5.3 Weaknesses and Further Opportunities
Considering that the EV market is both complex and dynamic, the limited scope of
this report poses an innate weakness. While it has sought to simplify the vast influences
on the EV market, there are numerous topics that warrant further exploration in future
research. Some suggested topics for further studies include:
How technological diffusion differs when incumbent technology and
emerging technology are both produced by same company versus when the
incumbent technology and emerging technology and are from different
companies.
How media (news, advertising, publicity) influences social opinion of
emerging automotive technologies.
Examination of the influence of EV features (e.g. limited range, recharge time,
regenerative breaking) on driving habits (e.g. trip planning, conservative
driving [i.e. aptness to use regenerative breaking rather than acceleration]).
Optimal EV charging site locations based on consumer behaviors and time
devotion at different locations.
Co-benefits of coupled renewable energy (e.g. solar, wind) and EV
investments.
52
6 Conclusion
In considering the question of whether or not EV technology will continue to
progress on the market, or fade out as it has in past phases, the findings of this report
suggest that the current social, technological and political atmospheres are much more
conducive to acceptance and growth of EV technology than in the past.
EVs currently on the market could meet the needs of almost half of U.S. households
(Consumers Union & Union of Concerned Scientists, 2013), and yet the uptake rate of
PEVs is miniscule. Key influential factor developments in EV technology, such as
declining upfront costs, range improvements and infrastructure developments, as well
as further policy support and rising petrol fuel costs, could make EVs even more
competitive with ICEs and attractive to consumers. A major barrier to EV adoption
however is the American public’s lack of familiarity with EV technology.
While many conversations comparing EVs and ICEs seem to focus on the technologic
differences and upfront costs, it is evident that social attitudes, while less quantifiable
than other variables of influence, play a pivotal role in the progression of EV technology.
Future efforts to advance EVs should also aim, along with technological developments,
to improve consumers’ familiarity with EV technology and thus to promote mainstream
status for EVs.
53
References
Balducci, P. (2008). Plug-in hybrid electric vehicle market penetration scenarios. Pacific Northwest National Laboratory.
Becker, T. (2009). Electric vehicles in the United States: A new model with forecasts to 2030. Technical Brief, University of California, Berkeley, Center for Entrepreneurship & Technology (CET).
Becker, T., Sidhu, I., & Burghardt, T. (2009). Electric vehicles in the United States: A new model with forecasts to 2030. University of California, Berkeley, Center for Entrepreneurship and Technology.
Berman, B. (2012, December 26). Moment of truth for Tesla Model S: When waiting list is finished. Retrieved November 14, 2013, from PluginCars.com: http://www.plugincars.com/moment-truth-tesla-model-s-when-waiting-list-finished-125861.html
Billmaier, J. (2010). JOLT!: The impending dominance of the electric car and why America must take charge. Charleston, SC: Advantage Media Group.
Boston Consulting Group. (2010). batteries for electric vehicles: Challenges, opportunities, and the outlook to 2020.
Boyle, E. (2007, November 28). Car prototype generates electricity, and cash. Retrieved November 16, 2013, from University of Delaware: http://www.udel.edu/PR/UDaily/2008/nov/car112807.html
Brooker, A., Thornton, M., & Rugh, J. (2010). Technology improvement pathways to cost-effective vehicle electrification. National Renewable Energy Laboratory.
Bullis, K. (2013, August 16). Could electric cars threaten the grid? Retrieved August 17, 2013, from MIT Technology Review: http://www.technologyreview.com/news/518066/could-electric-cars-threaten-the-grid/
Carter, J. (1979, July 15). Crisis of confidence. Washington, D.C., US.
Center For Automotive Research. (2012, April). CAR’s forecast: U.S. light vehicle sales. Michigan Automotive Focus (2), p. 2.
Collantes, G., & Sperling, D. (2008). The origin of California’s zero emission vehicle mandate. Transportation Research Part A: Policy and Practice , 42, 1302–1313 .
54
Consumers Union & Union of Concerned Scientists. (2013, December). Electric vehicle survey methodology and assumptions. Retrieved December 11, 2013, from http://www.ucsusa.org/assets/documents/clean_vehicles/UCS-and-CU-Electric-Vehicle-Survey-Methodology.pdf
Cowan, R., & Hulten, S. (1996). Escaping lock-in: The case of the electric vehicle. Technological forecasting and social change , 53 (1), 61-79.
Delucchi, M., & Lipman, T. (2001). An analysis of the retail and lifecycle cost of battery-powered electric vehicles. University of California Davis, Institute of Transportation Studies (UCD).
Duffer, R. (2013, November 15). Study of electric vehicle owners finds long way to go on range anxiety. Retrieved November 16, 2013, from Chicago Tribune: http://cars.chicagotribune.com/fuel-efficient/news/chi-electric-vehicle-long-range-anxiety
Electric Drive Transportation Association. (2013, November 5). Electric drive vehicle sales figures (U.S. Market) - EV sales. Retrieved November 10, 2013, from http://electricdrive.org/index.php?ht=d/sp/i/20952/pid/20952
Elliott, H. (2013, November 5). Tesla revenue up 9% as production constraints hinder growth. Retrieved November 14, 2013, from Forbes: http://www.forbes.com/sites/hannahelliott/2013/11/05/tesla-up-9-as-production-hinders-growth/
Eppstein, M., Grover, D., Marshall, J., & Rizzo, D. (2011). An agent-based model to study market penetration of plug-in hybrid electric vehicles. Energy Policy , 39 (6), 3789-3802.
Ferro, S. (2013, October 22). High-tech manhole covers will charge parked electric vehicles. Popular Science .
Fischetti, M. (2013, October 16). 40 Years after OPEC Oil Embargo, U.S. may finally get off imported crude. Retrieved October 18, 2013, from Scientific American: Blogs: http://blogs.scientificamerican.com/observations/2013/10/16/40-years-after-opec-oil-embargo-u-s-may-finally-get-off-imported-crude/
Franke, T., & Krems, J. F. (2013). What drives range preferences in electric vehicle users? Transport Policy , 30, 56-62.
Fulton, L. (2013, November 7). How vehicle fuel economy improvements can save $2 trillion globally and help fund a long-term transition to plug-in vehicles. University of California, Davis: Institute of Transportation Studies.
Hensley, R., Knupfer, S., & Pinne, D. (2009). Electrifying cars: How three industries will evolve. McKinsey Quarterly (3), 87-96.
55
Ingram, A. (2013, October 26). Where are electric-car charging stations? Infographic shows it all. Retrieved November 15, 2013, from Green Car Reports: http://www.greencarreports.com/news/1087971_where-are-electric-car-charging-stations-infographic-shows-it-all
International Energy Agency & Clean Energy Ministerial. (2013). Global EV outlook: Understanding the electric vehicle landscape to 2020. Electric Vehicle Initiative .
Jaffe, E. (2013, September 30). It takes drivers 3 months to warm up to electric vehicles. Retrieved November 5, 2013, from The Atlantic Cities: http://www.theatlanticcities.com/technology/2013/09/it-takes-people-3-months-warm-electric-vehicles/7059/
Jaffe, S. (2013, November 5). The lithium ion inflection point. Battery Power . Navigant Research.
Kardashian, K. (2012, October 23). Why electric vehicles have stalled. Retrieved November 5, 2013, from New Yorker: http://www.newyorker.com/online/blogs/currency/2013/10/why-electric-vehicles-have-stalled.html
King, D. (2013, November 8). Li-ion battery prices still headed way, way down, to $180/kWh by 2020. Retrieved November 14, 2013, from AutoBlog: Green: http://green.autoblog.com/2013/11/08/li-ion-battery-prices-headed--down-180-kwh/
Kirsch, D. (2000). The electric vehicle and the burden of history. New Brunswick, NJ: Rutgers University Press.
Kodjak, D. (2012, December). Consumer acceptance of electric vehicles in the US. Washington, D.C.: The International Council on Clean Transportation.
Koerth-Baker, M. (2012, October 2). Why your car isn't electric. New York Times .
Lehner, P. (2013, November 15). Electric vehicles approach popularity tipping point (op-ed). Retrieved November 16, 2013, from LiveScience: http://www.livescience.com/41267-electric-vehicles-grow-popular.html
Madrigal, A. (2011). Powering the Dream: The history and promise of green technology. Cambridge, MA, USA: Da Capo Press.
Marcacci, S. (2013, September 30). Electric vehicles speeding toward 7% of all global sales by 2020. Retrieved October 5, 2013, from CleanTechnica: http://cleantechnica.com/2013/09/30/electric-vehicles-speeding-toward-7-global-sales-2020/
McGrath, R. (1998). Technological discontinuities and media patterns: assessing electric vehicle batteries. Technovation , 18 (11), 677-687.
56
Moore, D. W. (2005, September 1). Seven in ten Americans hurt by gas prices. Retrieved November 1, 2013, from Gallup: http://www.gallup.com/poll/18286/Seven-Ten-Americans-Hurt-Gas-Prices.aspx
Motavalli, J. (2010). High Voltage: The fast track to the auto industry. New York, NY: Rodale.
Motavalli, J. (2013, November 4). Lithium-Ion Cell Prices Poised for Big Plunge. Retrieved November 14, 2013, from PlugInCars.com: http://www.plugincars.com/lithium-ion-cell-prices-poised-big-plunge-says-navigant-128783.html
Muller, J. (2013b, November 11). The best-selling cars of 2013 aren't really cars at all. Retrieved November 14, 2013, from Forbes: http://www.forbes.com/sites/joannmuller/2013/11/11/the-best-selling-cars-of-2013-arent-really-cars-at-all/
Muller, J. (2013a, July 10). The price of electric vehicles is falling; Is it time to buy? Retrieved July 11, 2013, from Forbes: http://www.forbes.com/sites/joannmuller/2013/07/10/the-price-of-electric-vehicles-is-falling-is-it-time-to-buy/
National Highway Safety Administration. (2013). CAFE - Fuel economy. Retrieved November 3, 2013, from http://www.nhtsa.gov/fuel-economy/
Navigant Research. (2013a). Vehicle to grid technologies.
Navigant Research. (2013b). Electric vehicle market forecasts.
Navigant Research. (2013c). Electric vehicle geographic forecasts.
Nelson, G. (2013, October 24). California, 7 other states sign pact to spur EV sales. Retrieved November 11, 2013, from Auto News: http://www.autonews.com/article/20131024/OEM05/131029939/california-7-other-states-sign-pact-to-spur-ev-sales#axzz2kKTF1OcV
Nemry, F., & Brons, M. (2010). Plug-in hybrid and battery electric vehicles: Market penetration scenarios of electric drive vehicles. European Commission, Joint Research Centre.
PBS. (2009, October 30). Timeline: History of the electric car. Retrieved October 29, 2013, from PBS Web site: http://www.pbs.org/now/shows/223/electric-car-timeline.html
Philip, S. (2013, March 12). GM’s Chevy Volt outsold Nissan Leaf last year, BNEF says. Retrieved November 5, 2013, from Bloomberg: http://www.bloomberg.com/news/2013-03-12/gm-s-chevy-volt-outsold-nissan-leaf-last-year-bnef-says.html
57
Recargo, Inc. (2013, November 5). Meet the fleet. Retrieved November 5, 2013, from PlugInCars.com: http://www.plugincars.com/cars
Recargo, PlugShare, and PluginCars.com. (2013, May). The rise of electric car charging. Retrieved October 28, 2013, from Recargo: http://www.recargo.com/news/infographics/the_rise_of_electric_car_charging/
Reinhold, R. (1989, March 18). Drastic steps are voted to reduce southern California air pollution. New York Times .
Rettie, J. (2013, October 23). Are EV supercars destined to surpass gas-burners? Popular Mechanics .
Rogers, E. M. (1995). Diffusion of innovations (4th ed.). New York: The Free Press.
Saad, L. (2006, April 10). Half of Americans driving less to save gas. Retrieved November 1, 2013, from Gallup: http://www.gallup.com/poll/22303/Half-Americans-Driving-Less-Save-Gas.aspx
Saad, L. (2013, April 8). Americans' concerns about global warming on the rise. Retrieved October 29, 2013, from Gallup Politics: http://www.gallup.com/poll/161645/americans-concerns-global-warming-rise.aspx
Schey, S., Scoffield, D., & Smart, J. (2012). A first look at the impact of electric vehicle charging on the electric grid in the EV Project. 26th Electric Vehicle Symposium (EVS-26). Los Angeles.
Shipman, M. (2013, November 14). New approach advances wireless power transfer for electric vehicles. Retrieved November 15, 2013, from Phys.org: http://phys.org/news/2013-11-approach-advances-wireless-power-electric.html
Shirk, M. (2013, September 25). EV project and INL PEV and infrastructure research update. Clean Cities Quarterly Webinar . U.S. Department of Energy.
Sommer, L. (2013, November 14). Electric cars drive demand for cheaper, more powerful batteries. All Things Considered. National Public Radio (NPR).
Tesla Motors. (2013, November 14). Purchasing. Retrieved November 14, 2013, from http://www.teslamotors.com/models/facts
Texas Transportation Institute. (2011). Electric vehicle market penetration: An examination of industry literature. Strategic Solutions Center.
Todd, M. (2013, October 21). Your electric car may yet generate a small income for you. Pacific Standard .
58
Tonachel, L. (2013, October 24). Eight states team up to win the electric vehicle race. Retrieved October 25, 2013, from NRDC Switchboard: http://switchboard.nrdc.org/blogs/ltonachel/eight_states_team_up_to_win_th.html
U.S. Census Bureau. (2008, June 27). A gas station for every 2,500 people. Retrieved December 28, 2013, from http://www.census.gov/newsroom/releases/archives/county_business_patterns/cb08-96.html
U.S. Department of Energy. (2008, November 28). Fact #548: December 8, 2008 number of gasoline stations continues to decline in 2007. Retrieved October 22, 2013, from Vehicle Technologies Office: http://www1.eere.energy.gov/vehiclesandfuels/facts/2008_fotw548.html
U.S. Department of Energy. (2011). One million electric vehicles by 2015. Government.
U.S. Department of Energy. (2013, September 30). Alternative fueling station counts by state. Retrieved October 22, 2013, from Alternative Fuels Data Center: http://www.afdc.energy.gov/fuels/stations_counts.html
U.S. Department of Energy. (2013). Reduce oil dependence costs. Retrieved October 29, 2013, from fueleconomy.gov: http://www.fueleconomy.gov/feg/oildep.shtml
U.S. Energy Information Administration. (2013a). State-level energy-related carbon dioxide emissions 2000-2010.
U.S. Energy Information Administration. (2013b, September 27). U.S. imports of crude oil. Retrieved October 29, 2013, from http://www.eia.gov/dnav/pet/hist/LeafHandler.ashx?n=PET&s=MCRIMUS1&f=A
U.S. Environmental Protection Agency. (2013, May 14). Regulations & standards. Retrieved November 13, 2013, from http://www.epa.gov/otaq/climate/regulations.htm
Union of Concerned Scientists. (2013, October 7). Infographic: Electric vehicles -- Oil savings in action. Retrieved October 25, 2013, from Clean Vehicles: http://www.ucsusa.org/clean_vehicles/smart-transportation-solutions/advanced-vehicle-technologies/electric-cars/electric-vehicle-infographic.html
Voelcker, J. (2010, July 7). Electric-car drive report: 2002 Toyota RAV4 EV crossover. Retrieved November 11, 2013, from Green Car Reports: http://www.greencarreports.com/news/1043811_electric-car-drive-report-2002-toyota-rav4-ev-crossover
Voelcker, J. (2013a, November 6). Green Car Reports' Best Car To Buy Nominee: 2014 Chevrolet Spark EV. Retrieved November 7, 2013, from Green Car Reports: http://www.greencarreports.com/news/1088220_green-car-reports-best-car-to-buy-nominee-2014-chevrolet-spark-ev
59
Voelcker, J. (2013b, November 10). Next Toyota Prius Plug-In to have 10 miles of electric range: Here's why. Retrieved November 11, 2013, from Green Car Reports: http://www.greencarreports.com/news/1088251_next-toyota-prius-plug-in-to-have-10-miles-of-electric-range-heres-why
Voelcker, J. (2014, January 3). Plug-in electric car sales for 2013 near double previous year's: Update. Retrieved January 3, 2014, from Green Car Reports: http://www.greencarreports.com/news/1089443_plug-in-electric-car-sales-for-2013-almost-double-last-years
Wansart, J., & Eckehard, S. (2010). Modeling market development of electric vehicles: From system analysis to dynamic modeling. Systems Conference, 2010 4th Annual IEEE (pp. 371-376). IEEE.
Webb, A. (2013, November 1). Chevy Spark EV becoming sleeper hit, but stock is limited. Retrieved November 4, 2013, from PlugInCars.com: http://www.plugincars.com/chevy-spark-ev-becoming-sleeper-hit-128696.html
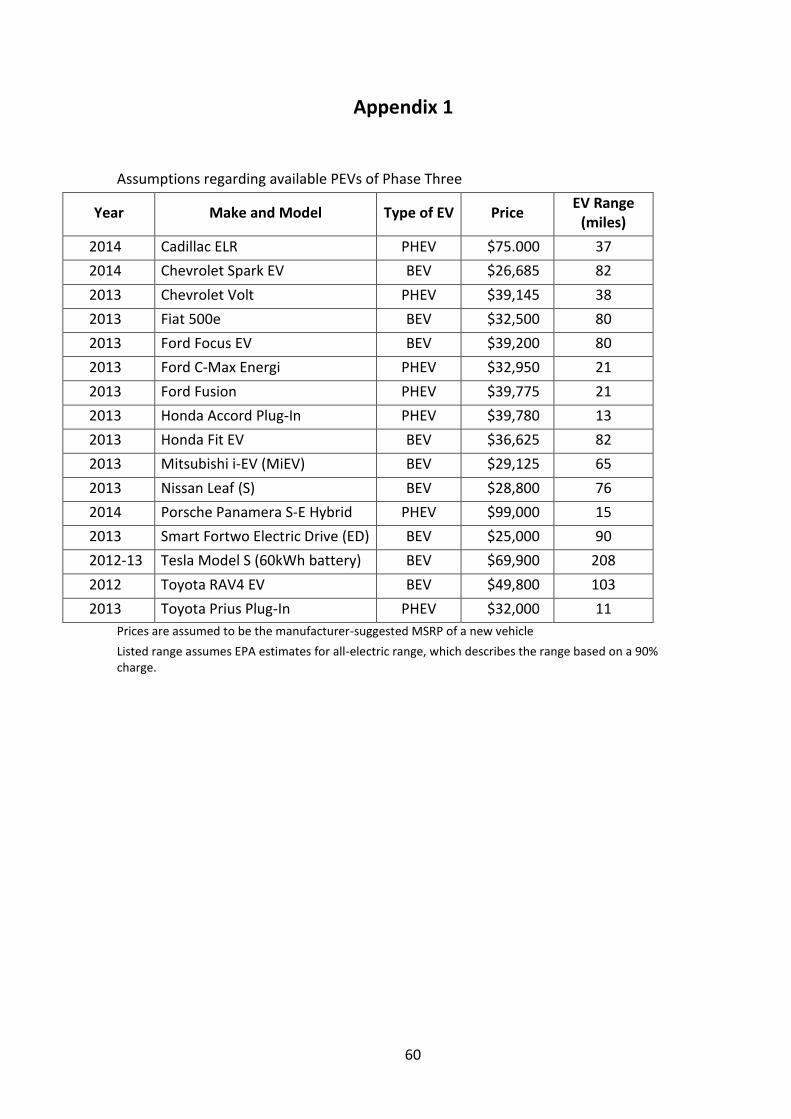
60
Appendix 1
Assumptions regarding available PEVs of Phase Three
Year Make and Model Type of EV Price EV Range
(miles)
2014 Cadillac ELR PHEV $75.000 37
2014 Chevrolet Spark EV BEV $26,685 82
2013 Chevrolet Volt PHEV $39,145 38
2013 Fiat 500e BEV $32,500 80
2013 Ford Focus EV BEV $39,200 80
2013 Ford C-Max Energi PHEV $32,950 21
2013 Ford Fusion PHEV $39,775 21
2013 Honda Accord Plug-In PHEV $39,780 13
2013 Honda Fit EV BEV $36,625 82
2013 Mitsubishi i-EV (MiEV) BEV $29,125 65
2013 Nissan Leaf (S) BEV $28,800 76
2014 Porsche Panamera S-E Hybrid PHEV $99,000 15
2013 Smart Fortwo Electric Drive (ED) BEV $25,000 90
2012-13 Tesla Model S (60kWh battery) BEV $69,900 208
2012 Toyota RAV4 EV BEV $49,800 103
2013 Toyota Prius Plug-In PHEV $32,000 11
Prices are assumed to be the manufacturer-suggested MSRP of a new vehicle
Listed range assumes EPA estimates for all-electric range, which describes the range based on a 90% charge.

61