addressing radial feeder challenges with microgrids
TRANSCRIPT

—
Addressing Radial Feeder Challenges with Microgrids
by Randall September, ABB

—
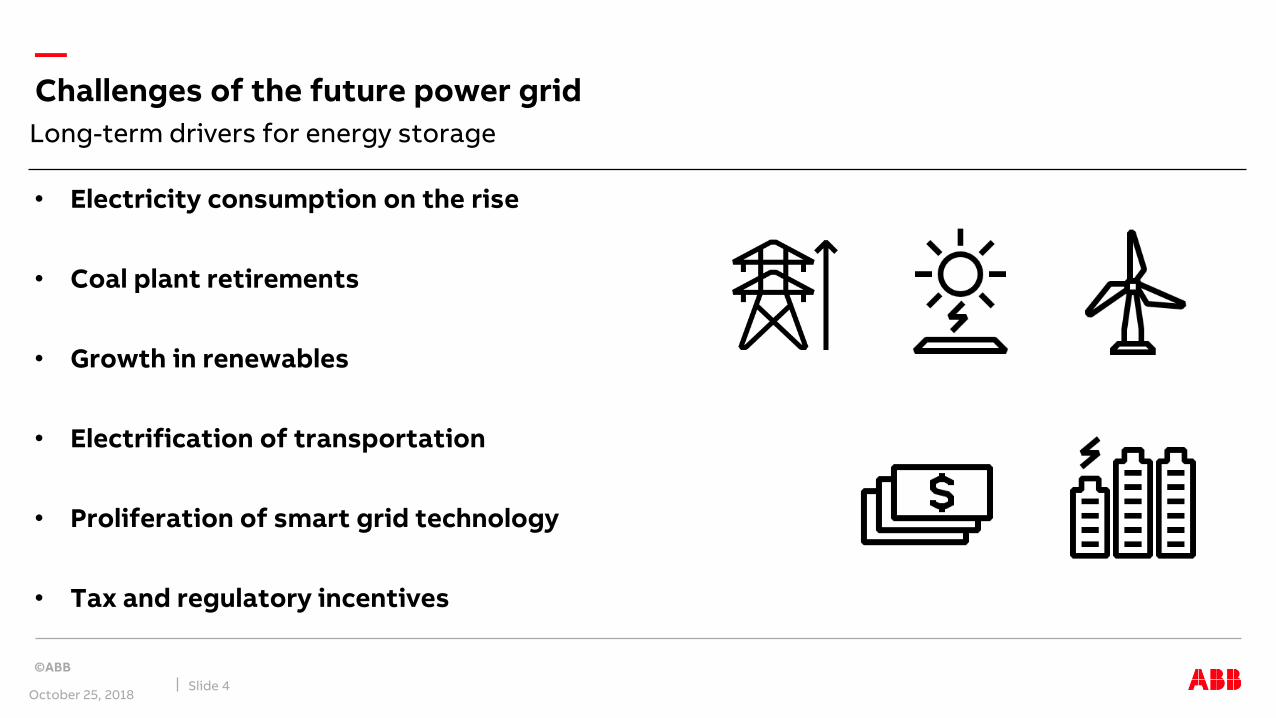
• Challenges of the future power grid
• Overview of Radial Feeder Challenges
• How can Microgrid help
• What ABB has to offer
• Radial Feeder Microgrid Business Case
• Summary
October 25, 2018 Slide 2
Agenda
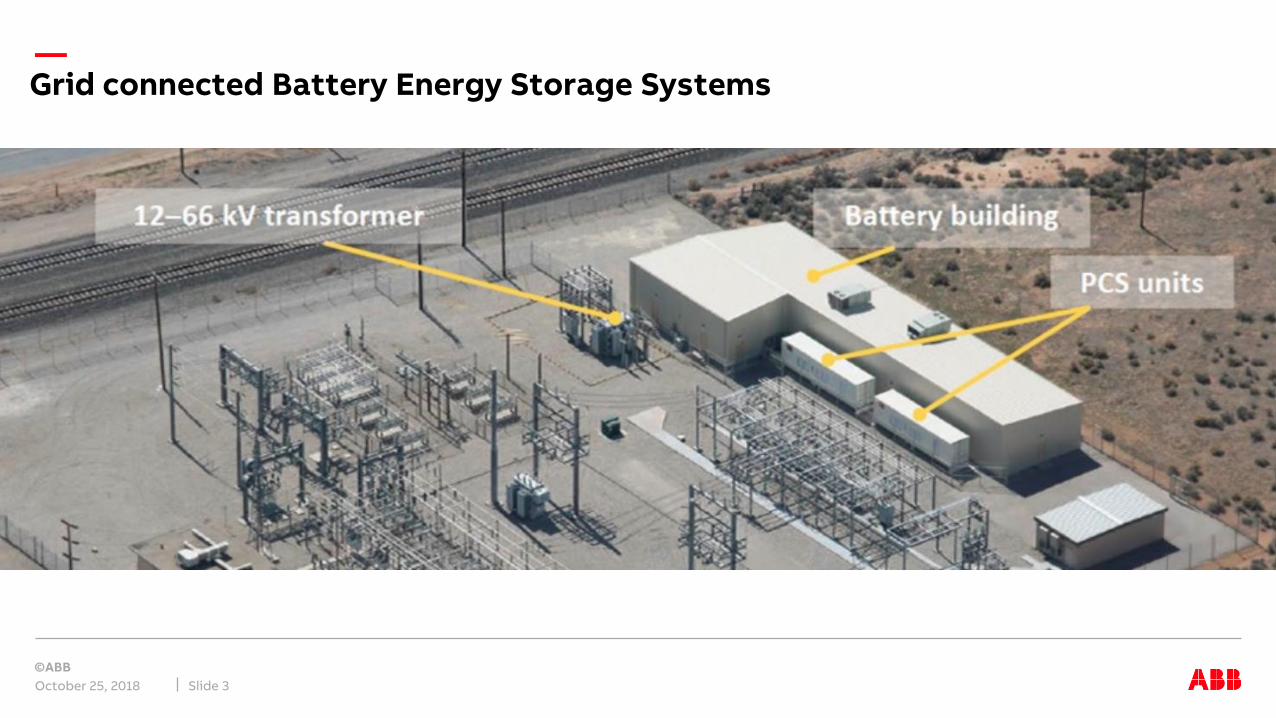
—Grid connected Battery Energy Storage Systems
October 25, 2018 Slide 3
—
Long-term drivers for energy storage
Challenges of the future power grid
• Electricity consumption on the rise
• Coal plant retirements
• Growth in renewables
• Electrification of transportation
• Proliferation of smart grid technology
• Tax and regulatory incentives
October 25, 2018Slide 4

—Executive Summary
October 25, 2018 Slide 5
Challenges for distribution utilities Microgrid benefits
• Defer distribution system upgrades while manage expected demand growth
• Improve reliability performance and resiliency
• Provide voltage regulation and increase hosting capacity of network for additional renewable penetration
• Decrease demand charges by peak shaving
• Radial feeders in need of capacity upgrades for the demand growth.
• Below-average reliability and power quality metrics
• Voltage issues due to the increased Solar Photovoltaic (PV) penetration
• Peak demand charges for Distribution utility
Target is distribution utilities that can own energy storage

—Microgrid
* Islanded mode: ability to provide power independently from the main power gridOctober 25, 2018 Slide 6
Microgrid Definition
Distributed energy resources and loads that can be operated in a controlled, coordinated way either connected to the main power grid or in “islanded”* mode.
Microgrids are low or medium voltage grids without power transmission capabilities and are typically not geographically spread out.
ABB has +331 MW global installed capacity of Microgrid and BESS
Solar PV power plant
Wind power plant
Remote asset management
and data analytics
Advanced powerdistribution and
protection
Conventional power
Grid connection
Modular scalable energy storage and grid
stabilization
Commercial loads
Industrial loads
Distributed control system Residential
loads

—Grid connected energy storage applications
ESS
Integration of
renewables
1-100 MW,1-10 hPeak shaving
0.5-10 MW, 1 h
220 kV
110 kV
20 kV ring
20 kV
Conventional
central
generation
Variable
renewable
generation
220 kV
Load leveling
for generation utilization
10-1000 MW, 1-8 h
ESS
110 kV Industry/
Large commercial
Load center
20 kV
ESS
Spinning reserve
In case of line loss
10-500 MW, 0.25-1 h
Load levelingfor postponement of grid upgrade
1-10 MW, 1-6 h
ESS
ESS
Frequency regulation
1-50 MW, 0.25-1 h
220 kV
110 kV
ESS
Solar PV time shift
1-100 kW, 2-6 h
ESS
0.4 kV
Residential/Small commercialESS
Microgrid
Stabilization
0.1-5 MW,
5 min
October 25, 2018 Slide 7

—Radial Feeder challenges

—Load Growth Challenge
October 25, 2018 Slide 9
Radial feeder Load forecast, substation capacity
Distribution system cannot host the expected demand growth in future due to substation capacity
Distribution utility with radial feeders in need for capacity upgrade
Substation
Circuit Breaker
Voltage Regulator
Voltage Regulator
Solar PV
Aggregated Load
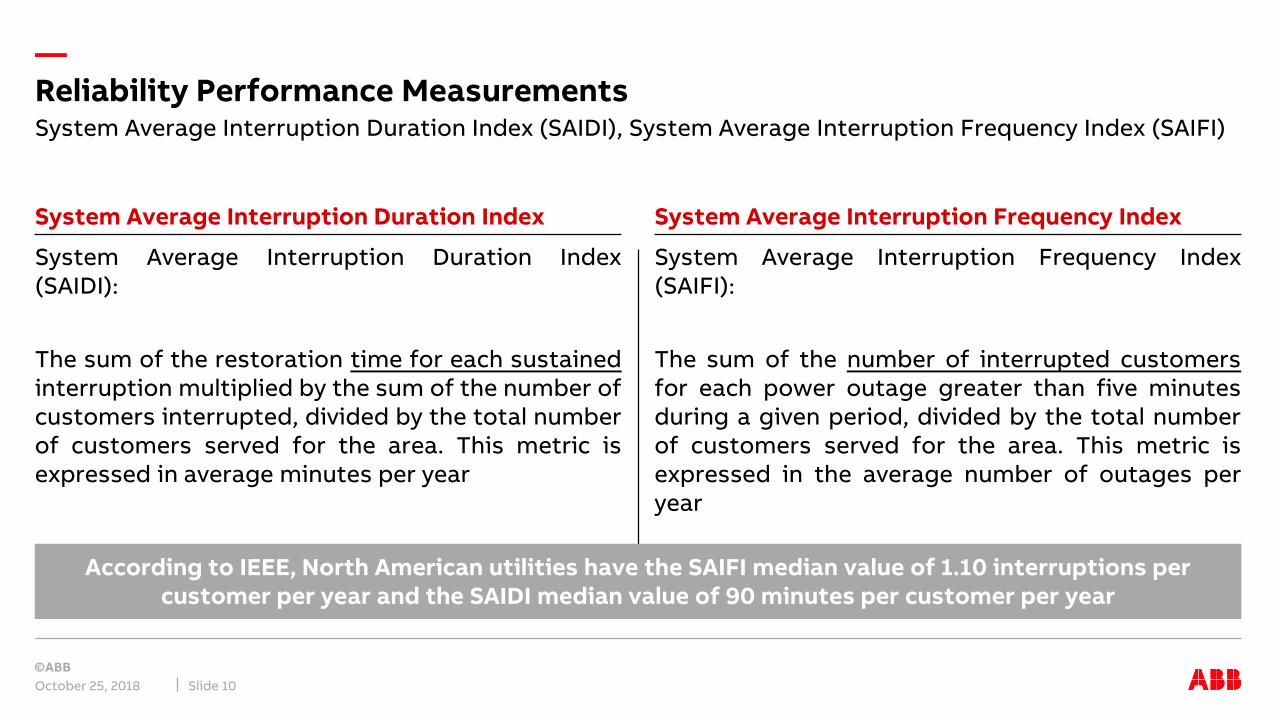
—Reliability Performance Measurements
October 25, 2018 Slide 10
System Average Interruption Duration Index System Average Interruption Frequency Index
System Average Interruption Frequency Index(SAIFI):
The sum of the number of interrupted customersfor each power outage greater than five minutesduring a given period, divided by the total numberof customers served for the area. This metric isexpressed in the average number of outages peryear
System Average Interruption Duration Index(SAIDI):
The sum of the restoration time for each sustainedinterruption multiplied by the sum of the number ofcustomers interrupted, divided by the total numberof customers served for the area. This metric isexpressed in average minutes per year
According to IEEE, North American utilities have the SAIFI median value of 1.10 interruptions per customer per year and the SAIDI median value of 90 minutes per customer per year
System Average Interruption Duration Index (SAIDI), System Average Interruption Frequency Index (SAIFI)

—Reliability Performance for Utilities
October 25, 2018ABB AbilityTM Velocity Suite, https://new.abb.com/enterprise-software/energy-portfolio-management/market-intelligence-services/velocity-suite
Slide 11
US utility categories and reliability performances

—Economic Impacts of Reliability Performance
October 25, 2018“Decision Addressing The General Rate Cases of San Diego Gas & Electric Company and Southern California Gas Company and The Proposed Settlements”, June 2016Finish Electricity Market Act, 2018, “Compensation for Power Cuts”
Slide 12
Example from San Diego Gas & Electric
1. Penalty/ Reward Scheme
2. Non-Delivered Energy (Costumer compensation Finnish Electricity Market Act)
Impacts SAIDI System Worst Circuit
Target (minutes)
60 585
Dead Band +/- 2 +/- 35
Increment 1 10
Annual Improvement
1%
Reward Increment
375 kUSD 125 kUSD
Penalty Increment
375 kUSD 125 kUSD
Maximum 3 MUSD 1 MUSD
SAIFI System Worst Circuit
Target (outages)
0.51 4.40
Dead Band +/- 0.02 +/- 0.35
Increment 0.01 0.10
Annual Improvement
1%
Reward Increment
375 kUSD 125 kUSD
Penalty Increment
375 kUSD 125 kUSD
Maximum 3 MUSD 1 MUSD

—Voltage Issues
ABB AbilityTM Velocity Suite, https://new.abb.com/enterprise-software/energy-portfolio-management/market-intelligence-services/velocity-suiteJ. Bank, B. Mather, J. Keller, and M. Codington, “High Penetration Photovoltaic Case Study Report,” NREL, 2013
October 25, 2018 Slide 13
Does voltage regulation impact….
US Solar Global Horizontal Irradiance Map with Planned and Operating Solar Generating Units (By ABB AbilityTM Velocity Suite)
Over Voltage: The PV generationincreases the line voltage at the feed-inpoint.
Voltage Fluctuations: Clouds causefrequent voltage changes. Voltageregulators have ~30 second operationaldelay.
In the existence of solar PV, VRs need toget replaced every year due to hundredsof thousands operation (mechanicalswitching) per year.
Impact of PV on the radial feeder voltage regulation

—Charges for Peak Demand
ABB NAM Reference Case,https://new.abb.com/enterprise-software/energy-portfolio-management
SANDIA Report, “Green Mountain Power (GMP): Significant Revenues from Energy Storage”, SAND2017-6164, May 2017.October 25, 2018 Slide 14
Transmission Charge Capacity Charge (ABB NAM Reference Case)
Distribution utilities pay charges related to the peak demand - Example New England Independent System Operator (ISO)
0
50
100
150
200
20
18
20
19
20
20
20
21
20
22
20
23
20
24
20
25
20
26
20
27
20
28
20
29
20
30
20
31
20
32
20
33
20
34
20
35
Re
gio
na
l Ne
two
rk S
erv
ice
s (
$/
kW
-
yea
r)
Year
0
50
100
150
200
20
18
20
19
20
20
20
21
20
22
20
23
20
24
20
25
20
26
20
27
20
28
20
29
20
30
20
31
20
32
20
33
20
34
20
35
Ca
pa
cit
y M
ark
et
Pri
ce
($
/k
W-y
ea
r)
Year

—Radial Feeder Microgrid Business Case

—Radial Feeder Business Case – Problem Definition
October 25, 2018 Slide 16
Distribution Utility Challenges Power System Assumptions
Location: Long radial feeders with geographic restrictions
• Peak demand exceeds the substation capacity in 5 years.
• The capacity upgrade is required to manage the load growth.
• The utility pays the peak demand charges to ISO/RTO.
• The reliability performance is below the target and utility pays the penalty.
• The utility is facing increased O&M cost for voltage issues by solar PV
Load 8 MWp, 5.5 MW avg, 1% growth rate
Substation Capacity
8.5 MW
Solar PV 800 kWp
Utility Rate 0.12 USD/kWh (50% grid fee), 2% inflation rate
SAIDI 420 minutes per customer per year
SAIFI 3 times per customer per year
Reliability Impact
125 kUSD-Year as a Penalty/ Reward, 2% inflation rate
Demand Charge
100 USD/kW-Year as transmission charge, 12 USD/kW-Month as a capacity charge, 2% growth rate
System O&M Cost
425 kUSD, including extra maintenance for VRs.
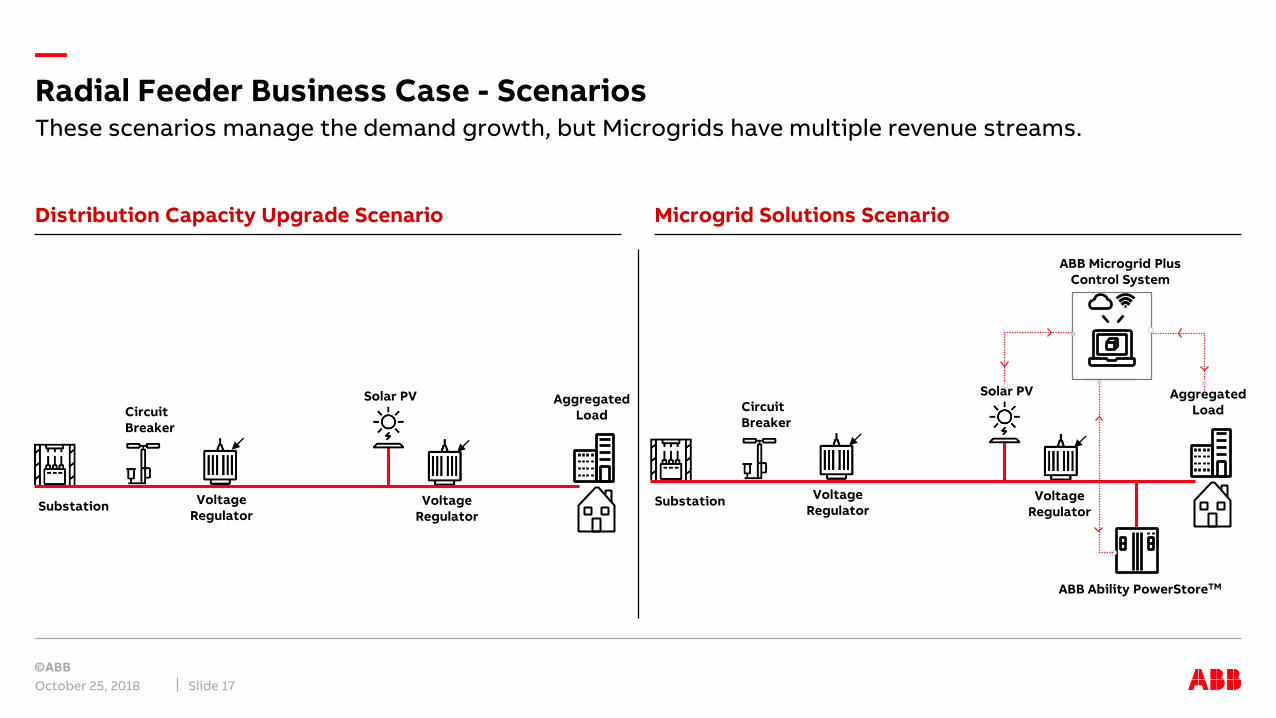
—Radial Feeder Business Case - Scenarios
October 25, 2018 Slide 17
Distribution Capacity Upgrade Scenario Microgrid Solutions Scenario
These scenarios manage the demand growth, but Microgrids have multiple revenue streams.
Substation
Circuit Breaker
Voltage Regulator
Voltage Regulator
Solar PV
ABB Microgrid Plus Control System
ABB Ability PowerStoreTM
Aggregated Load
Substation
Circuit Breaker
Voltage Regulator
Voltage Regulator
Solar PV Aggregated Load

—Scenario 1: Distribution Capacity Upgrade
October 25, 2018 Slide 18
Qualitative description
Peak Demand
Voltage Regulation
2
4
Distribution Capacity Upgrade
Distribution utility pays the penalty for low reliability performance.
1
Reliability 3
The operation and maintenance cost is increased due to the voltage issues occurred by PV integration.
Distribution utility pays the investment for capacity upgrades. This covers the load growth during the project duration considering the lead time.
Distribution utility pays for the capacity charge and transmission charge related to the peak demand.

—Scenario 1: Distribution Capacity Upgrade
Microgrid Knowledge Report for Berkley, published on August 17, 2018.October 25, 2018 Slide 19
Benefits Costs
Upgrade Cost 1 MUSD per mile*
Distance 5 miles
Lead time 5 years
• Manage the expected demand growth
• No impact on Peak demand charges
• No impact on reliability performance
• No impact on voltage regulation and relative maintenance costs
Quantitative description

—Scenario 2: Microgrid Solutions
October 25, 2018 Slide 20
Qualitative description
Peak Demand
Voltage Regulation
2
4
Microgrid
Distribution utility receives the reward for high reliability performance
1
Reliability 3
Voltage regulators need to switch less due to the battery voltage regulation
Distribution utility invests in Microgrid solution with lower lead time to manage the expected demand growth
Distribution utility pays less demand charge due to the Microgrid peak shaving capability
Microgrid improves resiliency and increase hosting capacity of distribution system for renewable integration

—Scenario 2: Microgrid Solutions
Lazard levelized cost of storage analysis,October 25, 2018 Slide 21
Benefits Costs
• Manage the expected demand growth by peak shaving
• Reduce Peak demand charges by 20%
• Improve reliability performance and receive rewards of 125 kUSD per year
• Decrease system O&M costs relative to voltage regulators by 25%.
Quantitative description of Microgrid (5.5 MW, 16.5 MWh)
Microgrid total cost 470 USD/ kWh**
Battery replacement cost after 10 years
175 USD/ kWh
Lead time 1 year
Microgrid O&M Cost 0.2% Microgrid CAPEX

—Microgrid Impact on Reliability Performance
October 25, 2018 CIGRE Technical Brochure (TB635) and ISBN: 978-2-85873-33835Slide 22
Reliability performance Indices
Assuming an availability of 98% for the energy storage(𝑃𝐸), a 100% probability of successfully transitioning toislanding mode (𝑃𝑀𝐺), and that 0 minutes are requiredfor the Microgrid to transfer to islanding mode (𝑡𝑀𝐺)with an ABB Ability PowerStoreTM and Microgrid Pluscontrol system.
• 𝑆𝐴𝐼𝐹𝐼 = 𝑆𝐴𝐼𝐹𝐼𝐵𝑎𝑠𝑒 𝑃𝑀𝐺𝑃𝐸𝑆 + 1 − 𝑃𝐸𝑆 =0.06 𝑜𝑢𝑡𝑎𝑔𝑒𝑠 𝑝𝑒𝑟 𝑐𝑢𝑠𝑡𝑜𝑚𝑒𝑟 𝑝𝑒𝑟 𝑦𝑒𝑎𝑟
• 𝑆𝐴𝐼𝐷𝐼 = 𝑆𝐴𝐼𝐹𝐼𝐵𝑎𝑠𝑒 𝑃𝑀𝐺𝑃𝐸𝑆𝑡𝑀𝐺 +𝑆𝐴𝐼𝐷𝐼𝐵𝑎𝑠𝑒
𝑆𝐴𝐼𝐹𝐼𝐵𝑎𝑠𝑒1 − 𝑃𝐸𝑆 =
8 𝑚𝑖𝑛𝑢𝑡𝑒𝑠 𝑝𝑒𝑟 𝑐𝑢𝑠𝑡𝑜𝑚𝑒𝑟 𝑝𝑒𝑟 𝑦𝑒𝑎𝑟
Reliability performance has improved significantly with the islanding capability
Substation
Circuit Breaker
Voltage Regulator
Voltage Regulator
Solar PV
ABB Microgrid Plus Control System
ABB Ability PowerStoreTM
Aggregated Load

—Radial Feeder Business Case- Results
October 25, 2018 Slide 23
20 years project life time with 9% discount rate
Microgrid is the economic solution for the Distribution utility with radial feeder in need for capacity upgrade
Scenario 1: Distribution System Upgrade Scenario 2: Microgrid
CAPEX 5 MUSD 7.8 MUSD
OPEX 27.3 MUSD 21.9 MUSD
Revenue 32.7 MUSD 34 MUSD
Net Present Value 0.4 MUSD 4.3 MUSD
Internal Rate of Return 10% 15%
Payback Period 10 years 6 years

—Summary

—Microgrid Business Case for Radial Feeder
October 25, 2018 Slide 25
Key Takeaways
• Defer Distribution System Upgrade
• Manage Demand Growth
• Provide Peak Shaving
• Improve Reliability Performance
• Provide Voltage Regulation
• Increase Hosting Capacity of Distribution System
• Improve Resiliency
PowerStore™ Battery

—Developing a microgrid project from concept to commission
October 25, 2018 Slide 26
The project lifecycle
Concept Feasibility studyDetailed
engineeringSupply
Installation& commissioning
Optimization
Main business drivers
Business case
Analysis
Data collection
Social & Environmental Economic & Operational
Technical Site conditions, solar, wind, generation and load
Financial Subsidies, OpEx Costs, Fuel price
Technical viability Financial analysis
Different tools are required for each stage of the project lifecycle
– HOMER Quickstart (http://quickstart.homerenergy.com/)
– Financial model
– HomerPro (Energy flow)
– Power factory, PSSE, PSCAD (Loadflow, Stability, Protection)
– MatLab (Tuning)
Each tool has its own specific application
Operations & Maintenance
Microgrid Project Lifecycle