accountabilityandtesting.brevardschools.orgaccountabilityandtesting.brevardschools.org/school...
TRANSCRIPT

DRAFT
Brevard County Public SchoolsSchool Improvement Plan
2013-2014
Name of School: Area:
Principal: Area Superintendent:
SAC Chairperson:
Superintendent: Dr. Brian Binggeli
Mission Statement: Jupiter Elementary is a collaborative and diverse community that focuses on engaging each child with a challenging and rigorous curriculum that fosters creativity, innovation and literacy for the 21st century.
Vision Statement: Jupiter Elementary School will challenge our diverse community of learners, establish a positive and productive school culture, set high expectations for achievement, and encourage independent, self-directed learning.
JUPITER ELEMENTARY AREA I
CYNTHIA H. HARRIS DR. MARK MULLINS
STACY CIRINO
Page 1

Brevard County Public SchoolsSchool Improvement Plan
2012-2013RATIONAL – Continuous Improvement Cycle Process Data Analysis from multiple data sources: (Needs assessment that supports the need for improvement)
SCHOOL IMPROVEMENT PLAN DATA ANALYSIS
FCAT: SUBGROUPS- BASED ON % MEETING HIGH STANDARDS % 3 + NOTE: DATA ON DEMO REPORT AND INDV FILE
FCAT: SUBGROUPS- BASED ON % MEETING HIGH STANDARDS % 3 +
NOTE: DATA ON DEMO REPORT AND INDV FILE
READING 2011 2012 2013 MATH 2011 2012 2013TOTAL POPULATION 71% 59% 51% TOTAL POPULATION 71% 51% 50%WHITE 72% 65% 64% WHITE 73% 60% 62%BLACK 69% 44% 37% BLACK 65% 41% 31%HISPANIC 67% 58% 47% HISPANIC 67% 55% 51%ED 67% 54% 46% ED 69% 50% 45%ELL NA 42% 34% ELL NA 29% 29%EWD 44% 24% 31% EWD 42% 22% 31%
FCAT: SCHOOL GRADE CRITERIA ( DATA ON SCHOOL GR. REPORT)
FCAT: SCHOOL GRADE CRITERIA (DATA ON SCHOOL GR. REPORT)
READING 2011 2012 2013 MATH 2011 2012 2013LEVEL 1 16% 16% 23% LEVEL 1 23% 24% 27%LEVELS 3 and Above 80% 30% 25% LEVELS 3 and Above 80% 24% 26%LEVELS 4 & 5 35% 29% 23% LEVELS 4 & 5 30% 27% 20%LEARNING GAINS (LG) 72% 54% 52% LEARNING GAINS 77% 53% 62%LOWEST 25% (LG) 67% 79% 59% LOWEST 25% (LG) 71% 69% 68%
WRITING (3.5 +) WRITING (3.5 +) 86% 25% 27%
SCIENCE (% 3 +) SCIENCE (% 3 +) 60% 34% 45%
Florida Alternate Assessment (FAA) NOTE: DATA ON THE FAA REPORTREADING 2011 2012 2013 MATH 2011 2012 2013
LEVELS 1, 2,3 0 0 0 LEVELS 1, 2,3 0 0 0LEVELS 4,5,6 0 0 1 LEVELS 4,5,6 1 1 2LEVELS 7,8,9 1 1 2 LEVELS 7,8,9 0 0 1Proficient LVS 4-9 1 1 3 Proficient LVS 4-9 1 1 3
WRITING 2011 2012 2013 SCIENCE 2011 2012 2013LEVELS 1, 2,3 0 0 0 LEVELS 1, 2,3 0 0 0 LEVELS 4,5,6 0 0 0 LEVELS 4,5,6 0 0 0 LEVELS 7,8,9 0 1 0 LEVELS 7,8,9 0 0 3Proficient LVS 4-9 0 1 0 Proficient LVS 4-9 0 0 3
Page 2

COMPREHENSIVE ENGLISH LANGUAGE LEARNING ASSESSMENT (CELLA)LISTENING/SPEAKING 2011 2012 2013 READING 2011 2012 2013
KG 9% 19% 20% KG 0% 0% 10%1 83% 92% 94% 1 17% 17% 56%2 91% 86% 77% 2 82% 33% 31%3 33% 29% 50% 3 17% 12% 0%4 43% 44% 53% 4 29% 56% 27%5 67% 43% 73% 5 33% 29% 36%6 80% 100% 67% 6 20% 33% 33%7 NA NA NA 7 NA NA NA8 NA NA NA 8 NA NA NA9 NA NA NA 9 NA NA NA
10 NA NA NA 10 NA NA NA
WRITING 2011 2012 2013KG 0% 6% 0%1 17% 33% 38%2 18% 50% 23%3 8% 12% 0%
CELLA NOTE: REPORT % PROFICIENT BY GRADE LEVEL (DATA ON THE CELLA REPORT)
4 0% 22% 33%5 17% 43% 55%6 20% 83% 67%7 NA NA NA8 NA NA NA9 NA NA NA
10 NA NA NA
School Percentage Scoring Satisfactory and Above
GradeLevel
Reading(Achievement Level 3
and Above)
Mathematics(Achievement Level 3
and Above)
Science(Achievement Level 3
and Above)Writing Essay
(3.5 and above)
2011 2012 2013 2011 2012 2013 2011 2012 2013 2011 2012 2013
Brevard
JUPITER ELEMENTARY SCHOOL (2191)
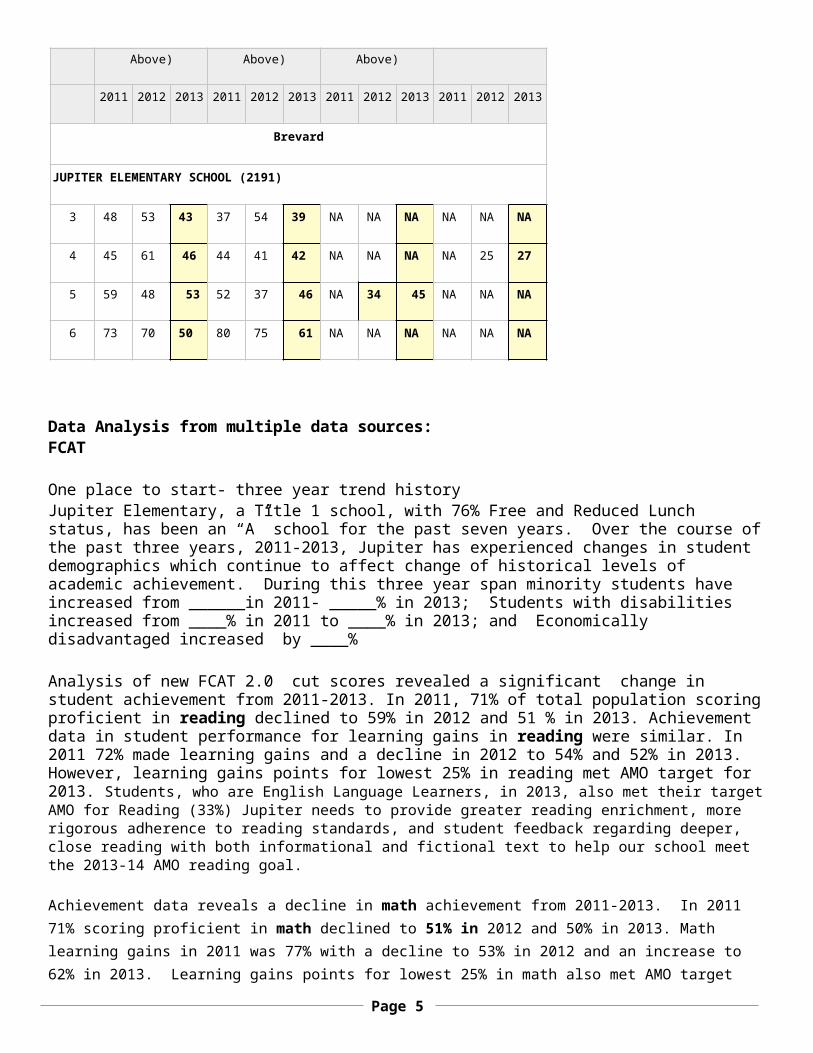
3 48 53 43 37 54 39 NA NA NA NA NA NA
4 45 61 46 44 41 42 NA NA NA NA 25 27
5 59 48 53 52 37 46 NA 34 45 NA NA NA
6 73 70 50 80 75 61 NA NA NA NA NA NA
Page 3

Data Analysis from multiple data sources:FCAT
One place to start- three year trend historyJupiter Elementary, a Title 1 school, with 76% Free and Reduced Lunch status, has been an “A” school for the past seven years. Over the course of the past three years, 2011-2013, Jupiter has experienced changes in student demographics which continue to affect change of historical levels of academic achievement. During this three year span minority students have increased from ______in 2011- _____% in 2013; Students with disabilities increased from ____% in 2011 to ____% in 2013; and Economically disadvantaged increased by ____%
Analysis of new FCAT 2.0 cut scores revealed a significant change in student achievement from 2011-2013. In 2011, 71% of total population scoring proficient in reading declined to 59% in 2012 and 51 % in 2013. Achievement data in student performance for learning gains in reading were similar. In 2011 72% made learning gains and a decline in 2012 to 54% and 52% in 2013. However, learning gains points for lowest 25% in reading met AMO target for 2013. Students, who are English Language Learners, in 2013, also met their target AMO for Reading (33%) Jupiter needs to provide greater reading enrichment, more rigorous adherence to reading standards, and student feedback regarding deeper, close reading with both informational and fictional text to help our school meet the 2013-14 AMO reading goal. Achievement data reveals a decline in math achievement from 2011-2013. In 2011 71% scoring proficient in math declined to 51% in 2012 and 50% in 2013. Math learning gains in 2011 was 77% with a decline to 53% in 2012 and an increase to 62% in 2013. Learning gains points for lowest 25% in math also met AMO target for 2013. Jupiter needs to provide greater math enrichment, more rigorous adherence to math standards, and student feedback regarding mathematical thinking to help our school achieve the 2013-14 AMO math goals.
Jupiter Elementary School’s most significant FCAT growth occurred in science. We wanted to increase the percentage of our level 3’s and above by 5% from 34% to 39% for 2013 and the percentage of level 4 and 5’s from 8% to 16%. In 2013, 45% or 52 out of 115 students scored level 3 or higher and 24% or 28 out of 115 students scored level 4 or 5. Overall science achievement increased by 11%. The number of high performing science students increased by 16%. Jupiter will continue to offer a rigorous science standards based curriculum as well as after school and Saturday enrichment programs.
FCAT writing in 2013 showed a significant decline from 2011-2013 of students scoring 3.5 or more. In 2011 86% scored 3.5 and above and declining in 2012 to 25 % scoring 3.5 and above . However, student performance results increased by 1% in improvement in 2013 and met AMO target. Overall writing performance declined from 2011-2013 and student performance was also impacted by new scoring criteria. The rubric scoring of writing was 2.9 which was the same score as in 2012. Jupiter’s score was below the district with a significant decline in overall student performance. Writing across the content areas will be a target area for the 2013-2014 school year.
School wide Jupiter subgroup student performance data show achievement gaps continue to exist for black students, free and reduced lunch students and students with disabilities. Data does show that our SWD are beginning to close the gap and met AMO target by safe harbor.. Closing the achievement gap for all subgroups is an area of focus for 2013-2014 school year. We must commit to more rigor and relevant learning for students in math and reading. Trends over the past three years (2011, 2012, 2013) show a decrease in Level 4’s and 5’s, a decrease Level 3’s and above in both reading and math.
Page 4
CELLA:Jupiter has a diverse population of English Language Learners. In 2012-13, we had 72 ELL students in grades K-6. The integration of different cultures into our community offers opportunities for enrichment as well as challenges. On FCAT 2.0 2011, 19% scored satisfactory in reading, on FCAT in 2012, 42% scored satisfactory in reading, in 2013, 34% scored satisfactory in reading and made the AMO target. Cella testing showed similar progress with increasing growth in KG, 1st, 3rd, 4th and 5th grades for Listening and Speaking. In Reading, progress occurred in KG, 1st, 5th and 6th grades while writing improved in 1st, 2nd, 4th, and 5th grades. Writing and Math AMO targets were not met for ELL students in 2013. At the present time (2013-14), Jupiter has 61 ELL students in K-6 and three are non English speakers. Although language learning is progressing, Jupiter needs to be more effective with universal math concepts for these ELL students.
Student Surveys: 39% of surveyed students are challenged to do their best when they participate in the teaching and learning process and 39% of surveyed students are challenged to do their best when they work with others to solve problems. Both student responses indicate that student needs are highly aligned to CCSS standards of self-directed and collaborative learning. Here is an area where teachers can increase student rigor with participatory and collaborative lessons.
Commonalities: Teachers share common planning times and use common assessments, DARLA (2012-13), BELAA (2013-14), DARMA , FAIR, DIBELS Next (2013-14) Treasures (2012-13) and Journeys (2013-14) to monitor student performance and growth. Lesson plans (2012-13) were guided with NGSS and beginning implementation of CCSS. 2013-14 plans find blended implementation of CCSS with review of NGSS standards for FCAT 2.0 in 2014. Teachers are experiencing difficulty with implementation and integration of CCSS and the increased rigor of high stakes testing. Our academic goal for the end of 2014 is to reach AMO targets in all academic areas.
Best Practice: (What does research tell us we should be doing as it relates to data analysis above?)Best Practice for 2013-14
Three Year PlanRationale: . . .”Standards provide a consistent, clear understanding of what students are expected to learn, so teachers and parents know what they need to do to help them. The standards are designed to be robust and relevant to the real world, reflecting the knowledge and skills that our young people need for success in college and careers. With American students fully prepared for the future, our communities will be best positioned to compete successfully in the global economy.” (CCSS, 2010)
Data analysis tells us that based on 2013 FCAT scores, Jupiter has a curriculum problem. Practices that can help improve instruction are those based on Max Thompson’s evidence based strategies. What’s going well? Teachers have common planning times to have grade specific professional development and to share best practices among the team. Teachers progress monitor students through A3, Success Maker reports, and district assessments which inform instruction. Teachers are doing well in targeted small group instruction especially in science.Utilization of the six shifts, full implementation of Common Core State Standards, and the onset of a new reading series, however, are areas that need more support. Standards based instruction with more corrective feedback, use of advanced organizers with informational and complex text, focus on content vocabulary, and use of high order questioning/discussion/writing by both teachers and students will increase the rigor and relevance of classroom learning.Observable measures would include:
Posted standards, focus wall, essential questions, student goals Class room organization that allows for both small and large group collaboration and discussion Lesson plans that include both long passages and short complex reading and integration of CCSS
Page 5

standards Small group re-teaching that reflects corrective feedback of un-mastered standards. Student samples of data/evidence based writing Observation of student discussion/debate based on evidence Observation of student created in depth research and products
Robyn Jackson, Never Work Harder than your Students and other Principles of Great Teaching (2009) writes, “Master teachers spend more time unpacking the standards and objectives than they do planning learning activities because they understand that clear learning goals will drive everything else they do.”
“The most powerful single modification that enhances achievement is feedback. The simplest prescription for improving education must be dollops of feedback.”(John Hattie, 1992, p.9)
What research says we should be doing in science?In science, the teacher needs to become less involved in direct instruction and more involved in facilitating learning through modeling, guiding and using assessment to adjust instruction (National Science Foundation, 1999). This is where differentiated instruction, on-going progress monitoring and varied assessments become essential. Teachers create a variety of entry points to ensure that students of differing abilities, strengths, and needs are considered. Students then have varying opportunities to demonstrate their knowledge based on the differentiated instruction and, hence a differentiated assessment. It has been said that feedback is often too little, too late, too vague, presented in the wrong form, and therefore lacking in impact (Jensen, 1998a, p. 54).
Analysis of Current Practice: (How do we currently conduct business?) Reading:The District adopted reading program, Treasures, completed its sixth year of implementation. K-2 teachers confidently teach the necessary skills and strategies following the common core state standards. Teachers in 3-6 continued with the NGSS and pacing guides and begin implementation of CCSS. New teachers collaborate and plan with veterans to maximize their instructional skills. The ninety minute reading block is scheduled with fidelity and encompasses whole group, differentiated small groups, vocabulary study, phonemic awareness/phonics (as needed), writing, Reader’s Theater, and independent reading. Teachers use interest inventories and parent surveys to pinpoint student and parent interests and needs. Student goal setting and conferencing with students support student independence in the learning process. Supplemental resources include: Success Maker, Triumphs, PASI/PSI, Heggerty, Scholastic Reading Inventory, Reading Counts, Text Talk, Million Word Challenge, Reading Club, Writing Club, book resources, and after school programs. Common planning for grade levels facilitates: discussion of student data, formation of flexible groups for remediation and enrichment, mini PD training, creation of common assessments, and review of team Smart Goals. Kindergarten-sixth grade teacher leaders attended Max Thompson’s Learning Focused/Curriculum Mapping training in 2013. Teacher leaders in grades 3-6 also attended the CCSS/ELA training to begin unpacking CCSS/ELA standards. Those teachers then trained fellow teachers to unpack standards to prepare for full implementation of CCSS in 2013-14. The Literacy Coach, Title I teachers and assistants provide support for the reading program through book talks, modeling, professional development, classroom observations, creating classroom libraries, small group tutoring, mentoring, conferencing/providing feedback with teachers and students, and reading with students.The Reading Vertical Team continued to forge links among grade levels and to develop a greater understanding of the CCSS spiral of reading/language arts learning and instruction. Educational Services (SES) after school at Jupiter, at off campus sites, or in students’ homes. This program for economically disadvantaged students re-teaches and reinforces basic reading skills. Further, After School Programs at Jupiter run concurrently and reach additional students needing support. Finally, our School Aged Child Care and Explorer programs help students with computer skills and reading homework while they’re waiting for parental pick-up. Mathematics:The District adopted math program, Envision, for K-5 is in its fourth year of implementation. Sixth grade utilizes Florida Math Connects Plus. Veteran teachers in all grade levels implement their respective series,
Page 6

confidently teaching the necessary skills and strategies, and following the pacing guide. New teachers collaborate and plan with the veterans to maximize their learning. Math classes are scheduled for a sixty minute block. New materials introduced in 2012-13 were Developing Number Concepts for grades K-2 and Florida Ready Math for grades 3-6. The Math Coach modeled lessons in classrooms. Common planning for grade levels facilitates regular math discussion of student data, formation of flexible groups for remediation and enrichment, mini PD training, creation of common assessments, and review of team Smart Goals. Teachers in grades K-6 attended the Learning Focused/Curriculum Mapping training in 2013. Full implementation of the CCSS began in the fall of 2012 for K-2. The Math Coach demonstrated research-based materials (Super Source, Van de Walle, and Thinking Maps) during faculty and grade level meetings throughout the year. Additional interactive, laminated materials were distributed to grade level teams to encourage student engagement and math thinking processes.The Math Vertical Team continued to forge links among grade levels and to develop a greater understanding of the CCSS spiral of mathematics learning and instruction. The team disaggregated and analyzed 2011-12/2012-13 math data to improve targeted mathematics instruction for 2013-14.Jupiter hosted an active business partner, Space Coast Credit Union, on our campus once per week. Our goal is to provide real life experiences in mathematics for fifth grade students. Students are trained as bank tellers and visited a local off campus branch for training. Our chief concern in mathematics for 2013-14 is the difficulty with geometry and measurement noted in the 2012-13 FCAT math scores. Teachers were encouraged to utilize more manipulative pieces and real-world application activities. More math common assessments aligned with CCSS will be created in 2013-14. Writing:Kindergarten through second grade participated in writing instruction and assessment based on CCSS. Third through sixth grade participated in writing instruction and assessment based on the Next Generation Sunshine State Standards. Teachers used the following resources to plan and initiate writing instruction: Brevard County Writing Plan, Piece by Piece, Developing Artistic Writing with Engaging Literature, Developing the Craft, Developing Ideas, and Developing Writing+ Skills. The District Resource Teacher for Writing provided professional development in every grade level. She also gave additional support for third and fourth grade teachers. Teachers used Anchor Sets from the state to help evaluate student writing and to be models for student writing. Jupiter students participated in the Young Authors’ Conference and in Discovering Quality Literature. Content Literacy and the English Language Arts (ELA) Common Core State Standards include a shift for writing focusing on citing multiple sources for evidence-based text, summarizing text and perspectives, and use of higher order thinking, both in questioning and responses. This shift aligns with the research from Learning Focusd lessons highlighted in Moving Schools: Lessons from Exemplary Leaders. Writing becomes more strategic and comprehension more efficient using the framework to formulate higher level questioning and higher order thinking skills to help students understand how multiple text sources are compared or contrasted, a more complex thinking skill for understanding text. When students are able to write their thoughts on paper completely, they internalize their learning and are better able to retain the information for application. Writing with a purpose, both for essay and short and extended response, understanding text structure, summarizing, and critical thinking help to fully address the prompt or questions. Science:During the 2012-2013 academic year, all 5th grade teachers taught in a self-contained classroom which meant that each teacher was responsible for teaching all subjects. Teachers use the National Geographic Science book as the primary textbook for the year. Teachers allocated 30 minutes for at least 3 times a week for science instruction. Jupiter Elementary employed a full time Title 1 Science Teacher to teach a weekly 40 minute science lab to grades 3rd through 6th. The Title 1 Science Teacher also worked with all fifth grade classes during whole group science instruction once a week to assist with hands on labs in the classroom or offer specific content instruction on difficult concepts covered in class. In terms of science assessments, the majority of teachers use the summative assessments provided at the end of science textbook chapters when they complete a subject chapter. Teachers rarely formally assess a student’s knowledge of individual benchmarks before or during instruction; rather the use of the summative assessment tool, a traditional test, shows mastery of several benchmarks all at once. This current practice limits necessary feedback for student improvement. Instruction may continue to the next chapter without ensuring that 70% or more of the class demonstrates mastery of individual benchmarks within a specific body of knowledge. The ability to offer more differentiated assessments and at a more frequent pace is identified as an area that needs improvement.
Page 7

CONTENT AREA: X Reading X Math X Writing X Science Parental
InvolvementDrop-out Programs
Language Arts
Social Studies
Arts/PE Other:
School Based Objective: (Action statement: What will we do to improve programmatic and/or instructional effectiveness?)
Jupiter Elementary staff will implement standards based instruction that focus on Max Thompson’s evidence based strategies.
Strategies: (Small number of action oriented staff performance objectives)
Barrier Action Steps Person Responsible
Timetable Budget In-ProcessMeasure
1. A Limited experience with common core state standards
!. B. Need to use/ understand integrated CCSS
1. CCSS training w/GPS1. Training for integrated standards2. Model lessons with integrated standards3. Training in Close Reading
ELA Common Core TeamELA TrainerAdministrationReading CoachMath CoachScience Resource Teacher
August 2013-May 2014
October 2013, PDD
PD ScheduleExit SlipsERO documentsModel Lessons
2. A. Lack of integration of writing into content areas2. B. Lack of consistent use of content vocabulary2, C Limited use of Document based Questions
1.. Training in fluency and comprehension checks2. Training in writing essential questions aligned with DBQ3. Training with ELA rubric for writing
ELA Common Core TeamDistrict Level Writing Support- Dr. Dwenger, Ms. PhelpsDBQ trained teachers
October 2013-
February 2014
$500.00Subs for training
Reflective feedback formsExit SlipsTraining Agenda
3. A Limited requirement of high level text specific questions for teachers and students 3. B. Limited use of interactive discussion
1. Training in forming high level text specific questions.2. Follow up training on Essential Question for unit and lessons
Literacy CoachPrincipalAssistant PrincipalTeacher leaders
January 2014 Classroom walk throughs
EVALUATION – Outcome Measures and Reflection
Qualitative and Quantitative Professional Practice Outcomes: (Measures the level of implementation of the professional practices throughout the school)
Page 8

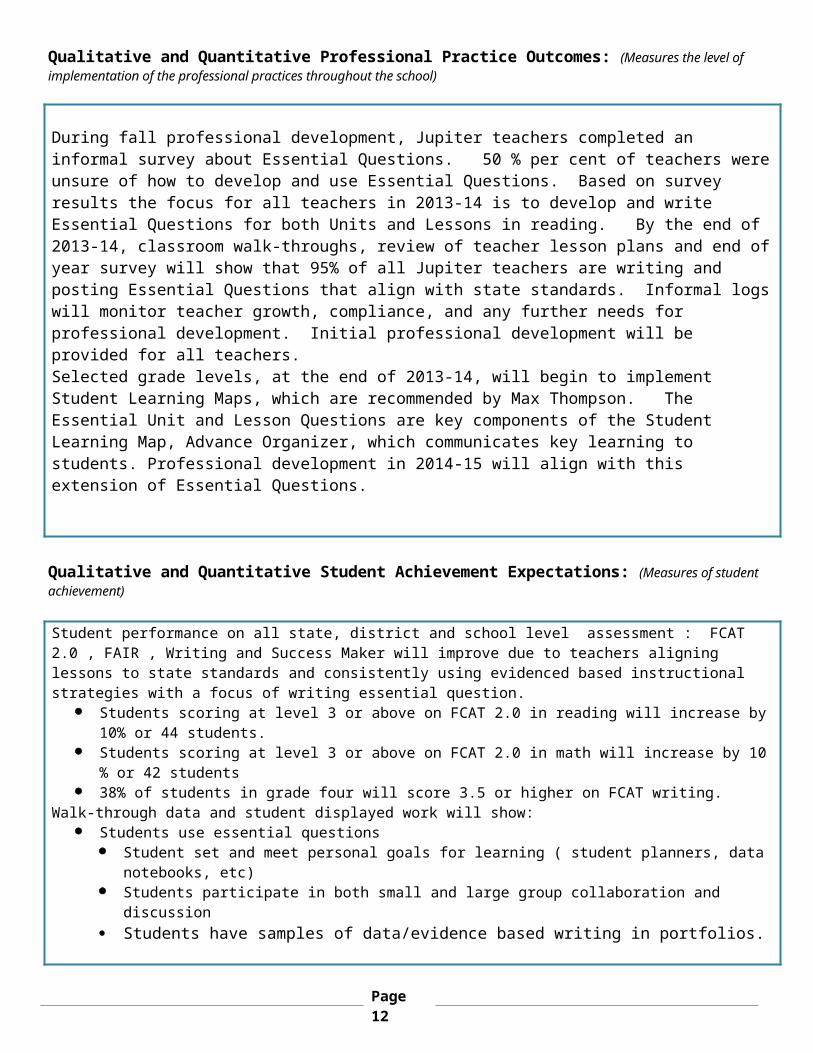
During fall professional development, Jupiter teachers completed an informal survey about Essential Questions. 50 % per cent of teachers were unsure of how to develop and use Essential Questions. Based on survey results the focus for all teachers in 2013-14 is to develop and write Essential Questions for both Units and Lessons in reading. By the end of 2013-14, classroom walk-throughs, review of teacher lesson plans and end of year survey will show that 95% of all Jupiter teachers are writing and posting Essential Questions that align with state standards. Informal logs will monitor teacher growth, compliance, and any further needs for professional development. Initial professional development will be provided for all teachers.Selected grade levels, at the end of 2013-14, will begin to implement Student Learning Maps, which are recommended by Max Thompson. The Essential Unit and Lesson Questions are key components of the Student Learning Map, Advance Organizer, which communicates key learning to students. Professional development in 2014-15 will align with this extension of Essential Questions.
Qualitative and Quantitative Student Achievement Expectations: (Measures of student achievement)
Student performance on all state, district and school level assessment : FCAT 2.0 , FAIR , Writing and Success Maker will improve due to teachers aligning lessons to state standards and consistently using evidenced based instructional strategies with a focus of writing essential question.
Students scoring at level 3 or above on FCAT 2.0 in reading will increase by 10% or 44 students. Students scoring at level 3 or above on FCAT 2.0 in math will increase by 10 % or 42 students 38% of students in grade four will score 3.5 or higher on FCAT writing.
Walk-through data and student displayed work will show: Students use essential questions
Student set and meet personal goals for learning ( student planners, data notebooks, etc) Students participate in both small and large group collaboration and discussion Students have samples of data/evidence based writing in portfolios.
APPENDIX A(ALL SCHOOLS)
Reading Goal1. Improve core level reading instruction through the
implementation of common core state standards.
2013 Current Level of
Performance(Enter percentage information and the number of students that percentage reflects i.e.
28%=129 students)
2014 Expected Level of
Performance(Enter percentage
information and the number of students that percentage reflects i.e. 31%=1134 students)
Anticipated Barrier(s):1. Limited experience with common core state standards 2. Integration of writing into content areas3. Consistent use of content vocabulary4. Limited use in using Document based Questions5. Limited requirement of high level text specific questions
Strategy(s):
Page 9

1. Provide professional development on integration of common core state standards. 2. Provide professional development on integration of writing into all content areas. 3. Provide professional development on how to use content vocabulary. 4. Provide professional development on forming essential questions.FCAT 2.0Students scoring at Achievement Level 3Increase the number of students scoring a level 3 in reading in grades 3-6 from 25% or 110/441 to 30% or 132/441 – an increase of 5% or 22 students.
Barrier(s): 1. Limited experience with common core state standards 2. Integration of writing into content areas3. Consistent use of content vocabulary4. Limited use in using Document based Questions5. Limited requirement of high level text specific questions
Strategy(s):1. Provide professional development on integration of common core state standards. 2. Provide professional development on integration of writing into all content areas. 3. Provide professional development on how to use content vocabulary. 4. Provide professional development on forming essential questions.
3rd Grade – 25% (27/109)
4th Grade – 19% (21/113)
5th Grade – 27% (31/114)
6th Grade – 30% (31/105)
Total AchievementLevel 3 – 25%
(110/441)
3rd Grade – 30% (33/109)
4th Grade – 24% (27/113)
5th Grade – 32% (36/114)
6th Grade – 35% (37/105)
Total AchievementLevel 3 – 30%
(132/441)
Florida Alternate Assessment: Students scoring at levels 4, 5, and 6 in Reading
Barrier(s):
Strategy(s):
N/A N/A
FCAT 2.0Students scoring at or above Achievement Levels 4 and 5 in ReadingIncrease the number of students scoring level 4 or 5 in reading in grades 3-6 from 23% or 100/441 to 28% or 123/441 – an increase of 5% or 23 students.
Barrier(s): 1. Limited experience with common core state standards 2. Integration of writing into content areas3. Consistent use of content vocabulary4. Limited use in using Document based Questions5. Limited requirement of high level text specific questions
Strategy(s):1. Provide professional development on integration of common core state standards. 2. Provide professional development on integration of writing into all content areas. 3. Provide professional development on how to use content vocabulary. 4. Provide professional development on forming essential questions.
3rd Grade – 18% (20/109)
4th Grade – 27% (30/113)
5th Grade – 25% (29/114)
6th Grade – 20% (21/105)
Total Achievement – Level 4/5 – 23%
(100/441)
3rd Grade – 23% (25/109)
4th Grade – 32% (36/113)
5th Grade – 30% (34/114)
6th Grade – 25% (26/105)
Total Achievement
Level 4/5 – 28% (123/441)
Florida Alternate Assessment:Students scoring at or above Level 7 in ReadingMaintain the level of performance for students taking the Florida Alternate Assessment, 100% or 3/3 students.
Barrier(s): 1. Limited experience with common core state standards 2. Integration of writing into content areas3. Consistent use of content vocabulary4. Limited use in using Document based Questions5. Limited requirement of high level text specific questions
Strategy(s):
5th – 100% (3/3) 6th – 100% (3/3)
Page 10

1. Provide professional development on integration of common core state standards. 2. Provide professional development on integration of writing into all content areas. 3. Provide professional development on how to use content vocabulary. 4. Provide professional development on forming essential questions.Florida Alternate Assessment:Percentage of students making learning Gains in ReadingMaintain the level of performance for students taking the Florida Alternate Assessment, 100% or 3/3 students.
Barrier(s): 1. Limited experience with common core state standards 2. Integration of writing into content areas3. Consistent use of content vocabulary4. Limited use in using Document based Questions5. Limited requirement of high level text specific questions
Strategy(s):1. Provide professional development on integration of common core state standards. 2. Provide professional development on integration of writing into all content areas. 3. Provide professional development on how to use content vocabulary. 4. Provide professional development on forming essential questions.
5th – 100% (3/3) 6th – 100% (3/3)
FCAT 2.0Percentage of students in lowest 25% making learning gains in ReadingIncrease the percentage of students in grades 4-6 in the lowest 25% who make learning gains in reading to 75%.
Barrier(s): 1. Limited experience with common core state standards 2. Integration of writing into content areas3. Consistent use of content vocabulary4. Limited use in using Document based Questions5. Limited requirement of high level text specific questions
Strategy(s):1. Provide professional development on integration of common core state standards. 2. Provide professional development on integration of writing into all content areas. 3. Provide professional development on how to use content vocabulary. 4. Provide professional development on forming essential questions.
Florida Alternate Assessment:Percentage of students in Lowest 25% making learning gains in Reading
Barrier(s): 1. Limited experience with common core state standards 2. Integration of writing into content areas3. Consistent use of content vocabulary4. Limited use in using Document based Questions5. Limited requirement of high level text specific questions
Strategy(s):1. Provide professional development on integration of common core state standards. 2. Provide professional development on integration of writing into all content areas. 3. Provide professional development on how to use content vocabulary.
Total of students in grades 4-6 that
made learning gains – 59%
Total of students in 4-6 to make learning gains –
75%
Page 11
4. Provide professional development on forming essential questions.
Ambitious but Achievable Annual Measurable Objectives (AMOs). In six years school will reduce their Achievement Gap by 50%:
Baseline data 2012-13:Overall, 36% of whites, 63% of blacks, 53% of Hispanic students are not making satisfactory progress in reading.
Using the 2012-2013 Adequate Yearly Progress
Report…the following
percentages are those students who
did not make satisfactory
progressStudent subgroups by ethnicity NOT making satisfactory progress in reading :
White:
Black:
Hispanic:
Asian:
American Indian:
Enter numerical data for current level of performance
36% (39/109)
63% (29/100)
53% (27/82)
N/A
N/A
Enter numerical data for expected level of
performance68%
60%
64%
N/A
N/AEnglish Language Learners (ELL) not making satisfactory progress in ReadingBaseline Data 2012-13, 66% or 30 students did not make satisfactory progress in reading. For 2013-14, decrease the percent of ELL not making satisfactory progress in reading to 60% or 27 students.
Barrier(s): 1. Limited experience with common core state standards 2. Integration of writing into content areas3. Consistent use of content vocabulary4. Limited use in using Document based Questions5. Limited requirement of high level text specific questions
Strategy(s):1. Provide professional development on integration of common core state standards. 2. Provide professional development on integration of writing into all content areas. 3. Provide professional development on how to use content vocabulary. 4. Provide professional development on forming essential questions.
66% (30/45) 33%
Students with Disabilities (SWD) not making satisfactory progress in ReadingBaseline data 2012-13, 69% or 50 students did not make satisfactory progress in reading. For 2013-14, decrease the percent of SWD not making satisfactory progress in reading to 55% or 40 students. Barrier(s): 1. Limited experience with common core state standards 2. Integration of writing into content areas3. Consistent use of content vocabulary4. Limited use in using Document based Questions5. Limited requirement of high level text specific questions
Strategy(s):1. Provide professional development on integration of common core state standards.
69% (50/72)45%
Page 12

2. Provide professional development on integration of writing into all content areas. 3. Provide professional development on how to use content vocabulary. 4. Provide professional development on forming essential questions.Economically Disadvantaged Students not making satisfactory progress in ReadingBaseline data 2012-13, 54% or 144/267 students were not making satisfactory progress in reading. For 2013-14, decrease the percent of economically disadvantaged students not making satisfactory progress in reading to 37%. The number of economically disadvantaged students fluctuates so the exact number of students will not be known until testing occurs.Barrier(s): 1. Limited experience with common core state standards 2. Integration of writing into content areas3. Consistent use of content vocabulary4. Limited use in using Document based Questions5. Limited requirement of high level text specific questions
Strategy(s):1. Provide professional development on integration of common core state standards. 2. Provide professional development on integration of writing into all content areas. 3. Provide professional development on how to use content vocabulary. 4. Provide professional development on forming essential questions.
54% (144/267) 63%
Reading Professional DevelopmentPD Content/Topic/Focus Target
Dates/ScheduleStrategy(s) for follow-up/monitoring
Integration of writing into content areas
School year 13/14 Exit slips, development of model lessons, use GPS rubrics to evaluate
writing samples Common core training with
Journeys GPS notebookSchool year 13/14 Exit slips
Close Reading School year 13/14 Techniques for close reading
Essential Questions School year 13/14 Posted essential questions
Integration of reading into content areas
School year 13/14 Lesson plans, development of model lessons
Text based evidence School year 13/14 Exit slips, lesson plans, development of model lessons
CELLA GOAL Anticipated Barrier
Strategy Person/Process/
Monitoring2013 Current Percent of Students Proficient in Listening/Speaking:
To increase the percentage of
Little to no exposure to
English language
Teacher modeling; poetry ESOL TeacherESOL AssistantsDistrict Resource
TeacherAssistant Principal
3 -6 – 61% (22/36)
Page 13

student proficiency in Listening/Speaking to 65%2013 Current Percent of Students Proficient in Reading:
To increase the percentage of student proficiency in Reading to 35%.
Lack of higher order questions
Reading using text based evidence
2013 Current Percent of Students Proficient in Writing:
To increase the percentage of student proficiency in Writing to 47%.
Writing format Sentence Imitation
Mathematics Goal(s):1. Improve core level math instruction through the integration of common core state standards and new generation sunshine state (NGSS) standards.
2013 Current Level of Performance
(Enter percentage information and the number of students
that percentage reflects)
2014 Expected Level of Performance
(Enter percentage information and the number of students
that percentage reflects)
Barrier(s): 1. Limited experience with common core state standards 2. Integration of writing into content areas3. Consistent use of content vocabulary4. Limited amount of corrective feedback
Strategy(s):1. Provide professional development on integration of common core state standards. 2. Provide professional development on integration of writing into all content areas. 3. Provide professional development on how to use content vocabulary. 4. Provide professional development on providing corrective feedback.FCAT 2.0Students scoring at Achievement Level 3Increase the number of students in grades 3-6 scoring level 3 in math from 26% or 116/440 to 31% or 137/440 – an increase of 5% or 21 students.
Barrier(s): 1. Limited experience with common core state standards 2. Integration of writing into content areas3. Consistent use of content vocabulary4. Limited amount of corrective feedback
Strategy(s):1. Provide professional development on integration of common core state standards. 2. Provide professional development on integration of writing into all content areas. 3. Provide professional development on how to use content vocabulary. 4. Provide professional development on providing corrective feedback.
3rd Grade – 27% (29/109)
4th Grade – 21% (24/113)
5th Grade – 31%(35/114)
6th Grade – 27% (28/104)
Total AchievementLevel 3 – 26%
(116/440)
Florida Alternate Assessment: Students scoring at levels 4, 5, and 6 in MathematicsMaintain the level of performance for students taking the Florida Alternate Assessment, 67% or 2/3 students.
5th Grade – level 5 - 67% (2/3)
6th Grade – levels 4, 5, & 6 - 67% (2/3)
3 – 6 – 28% (10/36)
3 – 6 – 42% (15/36)
Page 14

Barrier(s): 1. Limited experience with common core state standards 2. Integration of writing into content areas3. Consistent use of content vocabulary4. Limited amount of corrective feedback
Strategy(s):1. Provide professional development on integration of common core state standards. 2. Provide professional development on integration of writing into all content areas. 3. Provide professional development on how to use content vocabulary. 4. Provide professional development on providing corrective feedback.FCAT 2.0Students scoring at or above Achievement Levels 4 and 5 in MathematicsIncrease the number of students in grades 3-6 scoring levels 4 and 5 in math from 20% or 90/440 to 25% or 110/440 – an increase of 5% or 20 students.
Barrier(s): 1. Limited experience with common core state standards 2. Integration of writing into content areas3. Consistent use of content vocabulary4. Limited amount of corrective feedback
Strategy(s):1. Provide professional development on integration of common core state standards. 2. Provide professional development on integration of writing into all content areas. 3. Provide professional development on how to use content vocabulary. 4. Provide professional development on providing corrective feedback.
3rd Grade – 13% (14/109)
4th Grade – 20% (23/113)
5th Grade – 16%(18/114)
6th Grade – 34% (35/104)
Total AchievementLevel 3 – 20%
(90/440)
Florida Alternate Assessment:Students scoring at or above Level 7 in MathematicsIncrease the number of students scoring at level 7 or above from 33% or 1/3 students to 100% or 3/3 students.
Barrier(s): 1. Limited experience with common core state standards 2. Integration of writing into content areas3. Consistent use of content vocabulary4. Limited amount of corrective feedback
Strategy(s):1. Provide professional development on integration of common core state standards. 2. Provide professional development on integration of writing into all content areas. 3. Provide professional development on how to use content vocabulary. 4. Provide professional development on providing corrective feedback.
5th Grade – 33% (1/3) scored level 9
6th Grade – 100% (3/3)
Florida Alternate Assessment:Percentage of students making learning Gains in MathematicsIncrease the number of students making learning gains in math on the Florida Alternate Assessment from 33% or 1/3 students to 100% or 3/3 students.
Barrier(s): 1. Limited experience with common core state
5th Grade – 33% (1/3)
6th Grade – 100% (3/3)
Page 15

standards 2. Integration of writing into content areas3. Consistent use of content vocabulary4. Limited amount of corrective feedback
Strategy(s):1. Provide professional development on integration of common core state standards. 2. Provide professional development on integration of writing into all content areas. 3. Provide professional development on how to use content vocabulary. 4. Provide professional development on providing corrective feedback.FCAT 2.0Percentage of students in lowest 25% making learning gains in MathematicsIncrease the number of students in grades 4-6 making learning gains in math from 68% to 75%, an increase of 7%.
Barrier(s): 1. Limited experience with common core state standards 2. Integration of writing into content areas3. Consistent use of content vocabulary4. Limited amount of corrective feedback
Strategy(s):1. Provide professional development on integration of common core state standards. 2. Provide professional development on integration of writing into all content areas. 3. Provide professional development on how to use content vocabulary. 4. Provide professional development on providing corrective feedback.
Total of students 4-6 that made
learning gains – 68%
Florida Alternate Assessment:Percentage of students in Lowest 25% making learning gains in MathematicsIncrease the number of students in grades 4-6 making learning gains in math from to 100% or 3/3 – an increase of 0% or 3 students.
Barrier(s): 1. Limited experience with common core state standards 2. Integration of writing into content areas3. Consistent use of content vocabulary4. Limited amount of corrective feedback
Strategy(s):1. Provide professional development on integration of common core state standards. 2. Provide professional development on integration of writing into all content areas. 3. Provide professional development on how to use content vocabulary. 4. Provide professional development on providing corrective feedback.
N/A 6th Grade - 100% (3/3)
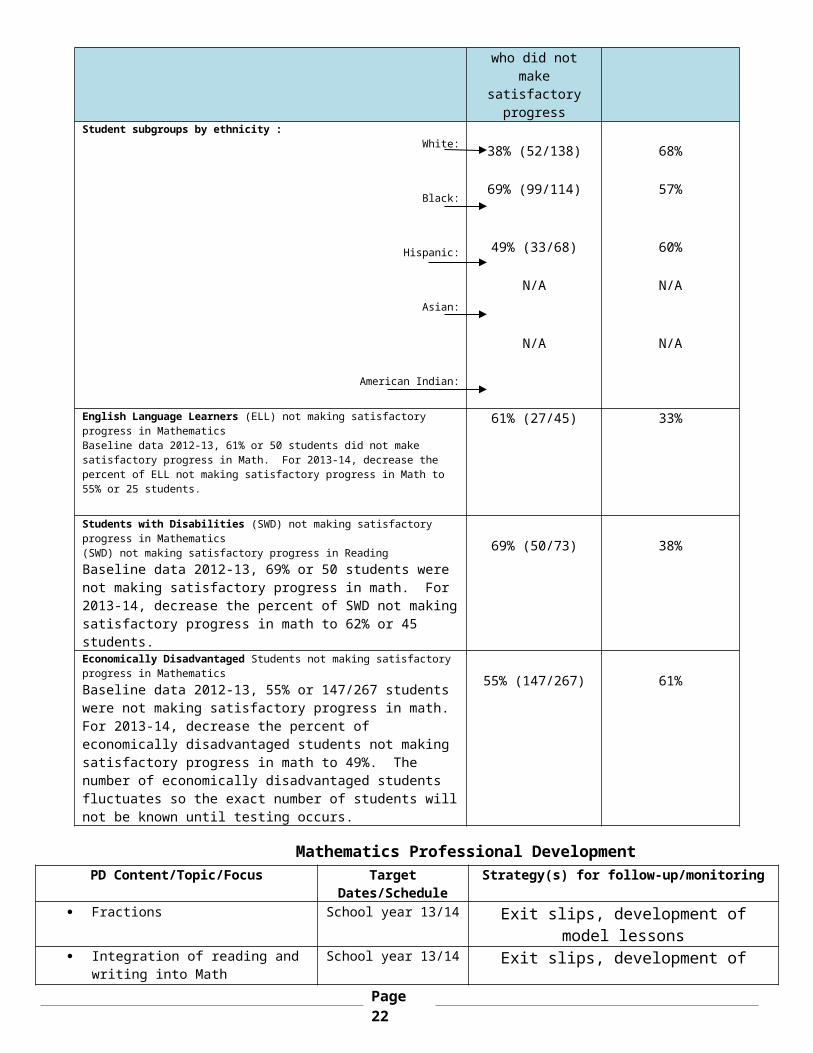
Ambitious but Achievable Annual Measurable Objectives (AMOs). In six years school will reduce their Achievement Gap by 50%:
Baseline Data 2012-13:Overall, 38% of whites, 69% of blacks, and 49% of Hispanics are not making satisfactory progress in Math.
Using the 2012-2013 Adequate Yearly Progress
Report…the following
percentages are those students
who did not make
Page 16

satisfactory progress
Student subgroups by ethnicity :White:
Black:
Hispanic:
Asian:
American Indian:
38% (52/138)
69% (99/114)
49% (33/68)
N/A
N/A
68%
57%
60%
N/A
N/AEnglish Language Learners (ELL) not making satisfactory progress in MathematicsBaseline data 2012-13, 61% or 50 students did not make satisfactory progress in Math. For 2013-14, decrease the percent of ELL not making satisfactory progress in Math to 55% or 25 students.
61% (27/45) 33%
Students with Disabilities (SWD) not making satisfactory progress in Mathematics(SWD) not making satisfactory progress in ReadingBaseline data 2012-13, 69% or 50 students were not making satisfactory progress in math. For 2013-14, decrease the percent of SWD not making satisfactory progress in math to 62% or 45 students.
69% (50/73) 38%
Economically Disadvantaged Students not making satisfactory progress in MathematicsBaseline data 2012-13, 55% or 147/267 students were not making satisfactory progress in math. For 2013-14, decrease the percent of economically disadvantaged students not making satisfactory progress in math to 49%. The number of economically disadvantaged students fluctuates so the exact number of students will not be known until testing occurs.
55% (147/267) 61%
Mathematics Professional DevelopmentPD Content/Topic/Focus Target
Dates/ScheduleStrategy(s) for follow-up/monitoring
Fractions School year 13/14 Exit slips, development of model lessons
Integration of reading and writing into Math
School year 13/14 Exit slips, development of model lessons
Close Reading for word problems and identifying essential questions
School year 13/14 Techniques for close reading; posted essential questions
Corrective feedback School year 13/14 Lesson plans; small group instruction for remediation
Writing
To develop evidence based writing across the curricula in all core subjects.
2013 Current Level of Performance(Enter percentage information and the number of students that percentage reflects)
2014 Expected Level of Performance(Enter percentage information and the number of students that percentage reflects)
Barrier(s):
Page 17

1. Writing is currently taught in isolation.
2. Need for training in evidence based writing and writing across the curricula based on CCSS for writing and Brevard County rubrics.
Strategy(s):
1. Provide professional development for teachers in techniques for evidence based writing across core subjects using multiple sources including higher level texts.
2. Use Brevard County rubrics to guide instruction and monitor student growth in writing integration of core subjects.
3. Provide grade level training in critical thinking skills, text-based evidence, discussion/debate, and interactive/technological activities to focus writing integration across the curricula.
4. Continue to utilize advance organizers to increase writing organization.
FCAT: Students scoring at Achievement level 3.5 and higher in writing 27% (31/113)
Scored a level 3.5 or above on Florida Writes
44% (40/109)
+ 17% increase in students scoring a level 3.5 or above on Florida Writes
Florida Alternate Assessment: Students scoring at 4 or higher in writing n/a n/a
Science Goal(s)(Elementary and Middle)1. To improve core
instruction by providing differentiated assessments to facilitate ongoing feedback for students.
2013 Current Level of Performance
(Enter percentage information and the number of students
that percentage reflects)
2014 Expected Level of
Performance(Enter percentage information and the number of students that percentage
reflects)
Page 18

2. To provide more opportunities for inquiry based learning coupled with embedded formal assessments and real world science applications.
Barriers (s)1. Time for Collaboration in
best science instruction practices & setup for classroom labs
2. Science Vocabulary 3. Experience in Inquiry
Based Learning4. New teachers without
training and practice in the foundational differentiated instruction
5. Limited training in effective science instruction
Strategy (s):1. Form a Science Vertical
Team to facilitate more Professional Development for best science instruction based on research proven practices
2. Offer extended time in science inquiry with After School Science Program
3. Identify at least 24 students for science small group learning with Title Science Teacher for 5th grade students and more real world exposure to concepts
4. Identify high performing students at the end of 4th grade for Summer Camp Invention program to increase creativity and critical thinking skills
5. Continue participation in Harris Super Science Saturday for teacher professional development in inquiry based learning and to extend student
45% (52/112)Scored a level 3 or
above on the Science FCAT 2.0
50% (57/113)
Page 19

exposure to science concepts
6. Weekly modeling of differentiated science assessments and instruction for 5th grade teachers by Title 1 Science teacher
FCAT 2.0 Students scoring at or above Achievement Levels 4 and 5 in Science:
17% (20/112)
Florida Alternate Assessment:Students scoring at or above Level 7 in Science
100% (3/3) N/ANo 5th grade
students taking FAA
APPENDIX C
(TITLE 1 SCHOOLS ONLY)
Highly Effective Teachers Describe the school based strategies that will be used to recruit and retain high quality, highly effective teachers to the school.
Descriptions of Strategy Person Responsible Projected Completion Date
1. Brevard Induction Program Principal, Asst. Principal on-going
2. Opportunities for professional development District Resource Teachers on-going
3. Assigned to CMA Team (Collaborative Mutual Accountability)
Principal, Asst. Principal 1st semester
4. Mentors Principal, Asst. PrincipalCET trained teachersMath and Literacy Coaches
on-going
5. Common planning times Principal 1st semester6. Encourage teacher leadership Principal, Asst. Principal on-going7. My Florida Teacher.com Principal, Asst Principal As needed
Non-Highly Effective Instructors Provide the number of instructional staff and paraprofessionals that are teaching out-of-field and/or who are not highly effective. *When using percentages, include the number of teachers the percentage represents (e.g., 70% [35]).
Number of staff and paraprofessionals that are teaching out-of-field/and who are not highly
effective
Provide the strategies that are being implemented to support the staff in becoming
highly effectiveN/A
For the following areas, please write a brief narrative that includes the data for the year 2012-13 and a description of changes you intend to incorporate to improve the data for the year 2013-14.
Page 20

MULTI-TIERED SYSTEM OF SUPPORTS (MTSS) (Identify the MTSS leadership team and it role in development and implementation of the SIP along with data sources, data management and how staff is trained in MTSS)
The MTSS Team comprises the Literacy Coach, the school psychologist, the guidance counselor, administration, support personnel (e.g. speech/language pathologist, behavior analyst, occupational therapist, and the ELL teacher), classroom teachers, and resource teachers. The Team meets bimonthly on the first and third Wednesdays of each month. Our MTSS meetings alternate with the IPST Team, which allows for easy interchange of data and information between the groups. Faculty training is held during pre-planning for both MTSS and IPST procedures. New teachers that come onboard are trained individually. Agendas are sent out prior to the bimonthly meetings so teachers have time to invite parents to attend.
Data sources used but not limited to are: Classroom performance—weekly tests, common assessments, work samples, observation District required assessments—BELAA, DRMA, writing prompts, RR, DIBELS Next State required assessments—FAIR, FCAT Diagnostic assessments—DAR, Gates, ERDA, KBIT, modality tests, behavior plans Progress monitoring—PASI, PSI, Heggerty, RR, observation, DIBELS Next Intervention strategies/materials—Rewards, Voyager Passport, Text Talk, Write In Readers (Journeys),
Barton, Lindamood-Bell, Starlite, Literacy and Reading Toolkit FCRR binders, Phonics Lesson Library, Math manipulatives, interest inventories
Reflection on Jupiter’s MTSS process indicates a need for closer monitoring of student interventions and growth, adjustment of student Tier Levels throughout the year, and monitoring of student absences, suspensions, and tardies. Loss of instructional time during the school day is extremely important for 2013-14 since SES program has ended. Greater fidelity will be essential to ensure students get the instruction they need.
Implementation of the Positive Behavior Support Plan in 2012-13 alleviated many serious student referrals. It facilitated behavioral interventions for the MTSS process. This plan will be used again in 2013-14 with even greater fidelity and success. BPS professional development was held for Jupiter staff again at the start of 2013-14 school year to ensure complete faculty and staff buy-in.
The MTSS team is very involved in the School Improvement Plan. In school-wide data collection and monitoring, to working with the grade level teams, to individualized testing and evaluation, to helping teachers with PGP’s, to providing professional development on learning techniques and strategies, to learn the MTSS process. The MTSS team impacts the school culture of learning and student growth.
In 2012-13, 77 students were referred to MTSS. Of the 77 students, 8 students were placed into the exceptional education program, 2 students received a 504 plan, 67 students rolled over to our current list for 2013-14 (26 on monitor status, 23 on Tier 2, and 18 on Tier 3).
PARENT INVOLVEMENT:Jupiter Elementary understands the need for parental involvement to make every program at Jupiter more successful. By offering family-focused activities, we make parents feel more comfortable at Jupiter and more engaged in their child’s learning. The school offers many opportunities to participate, both at school and within the school community. During the school year, 2012-2013, Jupiter offered a variety of opportunities for parents to become involved, gain a better understanding of the academics and share in celebration of Jupiter’s achievements. Make and take activities help bond the families together as parents and students work together. Teachers follow up with the students and parents to gather feedback to improve future parent nights. Families unable to attend night activities are invited to come to the school for a daily session or materials can be sent home by request. Some examples are: Family Support Team, Puerto Rican Day Parade, Walk to School Day, Palm Bay Holiday Parade, Book Fair, Carnival, Art and Music Festival. To build capacity for parental involvement in 2013-14, Jupiter will focus on providing programs at varied times during the day, offering choices for parents, and accommodating their working hours. The annual Title I meeting, curriculum nights such as Reading, Math, Science, Writing Nights and Open House will continue this year. To bridge the gap between home and school Title I will provide off-campus homework nights in the Jupiter community.
Page 21
Jupiter Elementary sponsors Parenting Partners, a specially designed program for parents that provides support toward hurdles they may face at home. A team of teachers and staff train parents how to relate to their children during daily activities, take charge as the head of the household, setting boundaries and establishing schedules with expectations. Students participate in these trainings during the parents’ homework that is given to the parents to conduct during the week. Following a homework assignment, discussion of the results allows time for questions and answers plus a time to provide celebration of each parent’s accomplished practices.
A special resource available to parents and students is the Jupiter Elementary Explorers University. This program provides opportunities for students and their families to continue to learn new skills and discover new abilities after the school day has ended. Students learn both academic and enrichment skills in an interactive environment. Parents participate in parent training provided by the Explorer staff four times per year. Another family resource is available through teacher or staff recommendation in which families in transition may receive supplies for the weekend from the food bank. These Jupiter facilitated programs help support learning.
Parents receive communication in a variety of ways at Jupiter. Jupiter provides multi-language materials/translations for families that need information in their native languages. Face-to-face may not be the best means of communication so Jupiter sends home monthly newsletters, weekly postings on the marquee, individual letters home to grade levels or smaller groups, emails, recorded messages sent via telephone, and intercom. Jupiter teachers, Jupiter Media Specialist, and Jupiter Tech Specialist with the support of the District Office of Education Technology work together to address the needs of students and families. We plan and implement appropriate programs, services, and training opportunities. Parents learn to access EDLINE for student current grades and information as well as the school website via internet. We conduct surveys, discussions, and evaluations to determine the on-going improvement of Title I programs at Jupiter via School Advisory Council meetings, Parent/Teacher Organization meetings and throughout the year.
In 2012-13, we had a Science, Math, Reading, Writing and Music/Art Night for parents. Total attendance for all nights was participation 478 parents out of a total enrollment of 864 students.Curriculum Night Parents attended Percentage (of total
enrollment)Goal for 2013-14 (of total enrollment)
Science 46 5% 15%Math 10 1% 11%Reading 65 8% 18%Writing 7 1% 11%K-2 Reading/Math 46 14% 24%Music/Art 350 41% 51%
ATTENDANCE: (Include current and expected attendance rates, excessive absences and tardiness)Jupiter’s attendance rate trend for the past four years met the benchmark of 95% with an average of 95% over the course of nine months. Jupiter’s attendance directly impacts student achievement. Baseline data from 2012-13 of lowest 25%:
Total number of students in lowest 25% = 59 students 33 of those students or 56% had more than 9 absences
Goal for 2013-14: To decrease student absences of the lowest 25% by 50%.Intervention/Strategies:
MTSS process, bimonthly meetings Family Support Team Guidance Counselors Family Liaison Principal/Assistant Principal Monthly monitoring of student attendance Mentors for students Attendance Plans Parent conferences
Page 22

SUSPENSION:21 students were suspended from Jupiter out of 68 total student suspensions during the 2012–13 school year. The reduction in suspensions is attributed to the implementation of the Positive Behavior Support Plan during 2012-13 school year.
DROP-OUT (High Schools only):
POSTSECONDARY READINESS: (How does the school incorporate students’ academic and career planning, as well as promote student course selections, so that students’ course of study is personally meaningful? Describe strategies for improving student readiness for the public postsecondary level based on annual analysis of the High School Feedback Report.)
Page 23