accountabilityandtesting.brevardschools.orgaccountabilityandtesting.brevardschools.org/school... ·...
TRANSCRIPT
Brevard County Public SchoolsSchool Improvement Plan
2014-15
Name of School: Area:
Principal: Area Superintendent:
SAC Chairperson:
Superintendent: Dr. Brian Binggeli
Mission Statement:
To prepare teachers with the pedagogical knowledge, teacher practice, skills, and core content knowledge in and by “working enthusiastically and in concert” so that every child will experience academic, social and emotional success.
Vision Statement:
To give students at Robert Louis Stevenson Elementary School of the Arts every opportunity to live and lead a quality and rewarding life in the 21st Century by offering many ways “to explore matters of the mind and also of the heart.”
Communication of School Improvement Plan: Briefly explain how the mission, vision and school improvement plan is communicated to all stakeholders.
The dissemination of data begins our conversation once the results have been disaggregated; first with the teaching staff upon their arrival during preplanning week. Once the results have been internalized to determine the trends at the school level, researching best practices to narrow the “gap” in achievement is conducted. Both teachers and administrators actively seek new ways to improve instruction. During the first School Advisory Council meeting as well
Final Version 7.20.14
Robert Louis Stevenson Elementary North
Michael Corneau Dr. Laura Rhinehart
Laene Keith

as at Open House, parents are brought into the process to begin communicating school results and with an indication as to where the school improvement process will head for the school year. During the many meetings that follow, stakeholders are able to provide input about how to best increase student achievement. The School’s weekly newsletter will also provide an array of information ranging from not only standardized test results, but also the client survey, student survey and initiatives that the school will tackle during the school year. The school makes every effort to make the connection to the district’s initiatives (its strategic plan) so that there is an obvious unifying thread that links local level efforts to district and even state and federal goals and intiatives. Stevenson posts its School Improvement Plan on the school website which we have been told is actively seen/read by a variety of stakeholders interested in having students attend our school and by prospective teachers applying for employment. We readily have copies available in the front office for viewing the School Improvement Plan.
Brevard County Public SchoolsSchool Improvement Plan
2014-15
Part 1: Planning for Student Achievement
RATIONALE – Continuous Improvement Cycle Process
Data Analysis from multiple data sources: (Needs assessment that supports the need for improvement-Examples may be, but are NOT limited to survey data, walk-through data, minutes from PLC’s or Dept. Mtgs. Move away from talking about every single data source and determine your rationale. Much like the PGP, what is your focus and why?)
Considerations/Examples: What are the areas of success? Where are concerns? What trends do you see? What kind of data are you looking at within your school? What data do you use for teacher practice? How are teachers planning? Are plans Standards Driven? Are Essential Questions meaningful? What do CWT tell you about instruction? How will you monitor the depth of implementation?
Move any Action Steps that have become standard practice to this section.
Data Review SUMMARY:
Robert Louis Stevenson Elementary School of the Arts has earned an “A Rating” on the Florida School Report Card since the school’s inception. Our 738 points, earned in 2014, are based on proficiency levels of 97% in Reading, 97% Math, 94% in Writing, and 94% in Science (100% of students were tested). Overall, the scores are the highest in the district, and the 3rd highest among elementary schools in the state. Learning gains were 84% in reading and 88% in Mathematics. Most notable is the fact that 100% of the school’s lowest 25% in Reading evidenced a learning gain (up from 78% in 2012-2013), while 84% of the lowest 25% in Mathematics evidenced a learning gain (up from 80% in the 2012-2013 school year).
The 2014 results of the Florida Comprehensive Assessment Tests (FCAT) represents an increase in scores from the 2012-2013 school year. Stevenson’s results for the 2012-2013 school year, yielded a total of 685 points, based on
Final Version 7.20.14

proficiency levels of 95% in Reading, 93% in Mathematics, 93% in Writing and 88% in Science. Learning Gains for students were calculated at 78% in Reading and 80% in Mathematics.
Analysis of reporting categories do not reveal any areas at any grade level that stand out as problematic or of concern. Student performance remains consistent and at the highest levels in both the District and State. While data to support any specific conclusion is difficult to isolate, it is our belief that the implementation of a standards-based curriculum and attention to both the level of rigor and fidelity with which lesson planning and formative assessments are implemented can be attributed to our level of success.
READING:
Third Grade: In the area of Reading, RLS students achieved a Mean Developmental Score of 223, ranking second in
Brevard County and sixth in the State of Florida. The District average Mean Developmental Score was 204 while the State average score was 200. 96% of students scored a level 3 (grade level) or higher. 76% of our third graders achieved a level 4 or 5 (38% each) and no students scored a level 1. Only five schools in the State of Florida had a great number of students scoring at levels 4 and 5.
The 2014 results reflect a one percentile point decline in the percentage of students achieving at levels 3, 4 and 5 (97% in 2013), however, the Mean Developmental Score remained constant at 223.
Final Version 7.20.14

Fourth Grade: Stevenson Fourth Graders achieved an average Mean Developmental Scale Score of 234. The District average score was 215 while the State average was 213. 97% of Stevenson fourth graders achieved at a level 3 or higher, with 82% scoring a level 4 or 5. Stevenson’s fourth graders achieved
Final Version 7.20.14

the second highest score. The 2013 results indicated a Developmental Mean Score of 235 and 95% of students achieving at levels 3, 4 and 5. While the Developmental Mean Score decreased by one point, the percentage of students achieving at levels 3, 4 and 5 increased by two percentile points.
Final Version 7.20.14

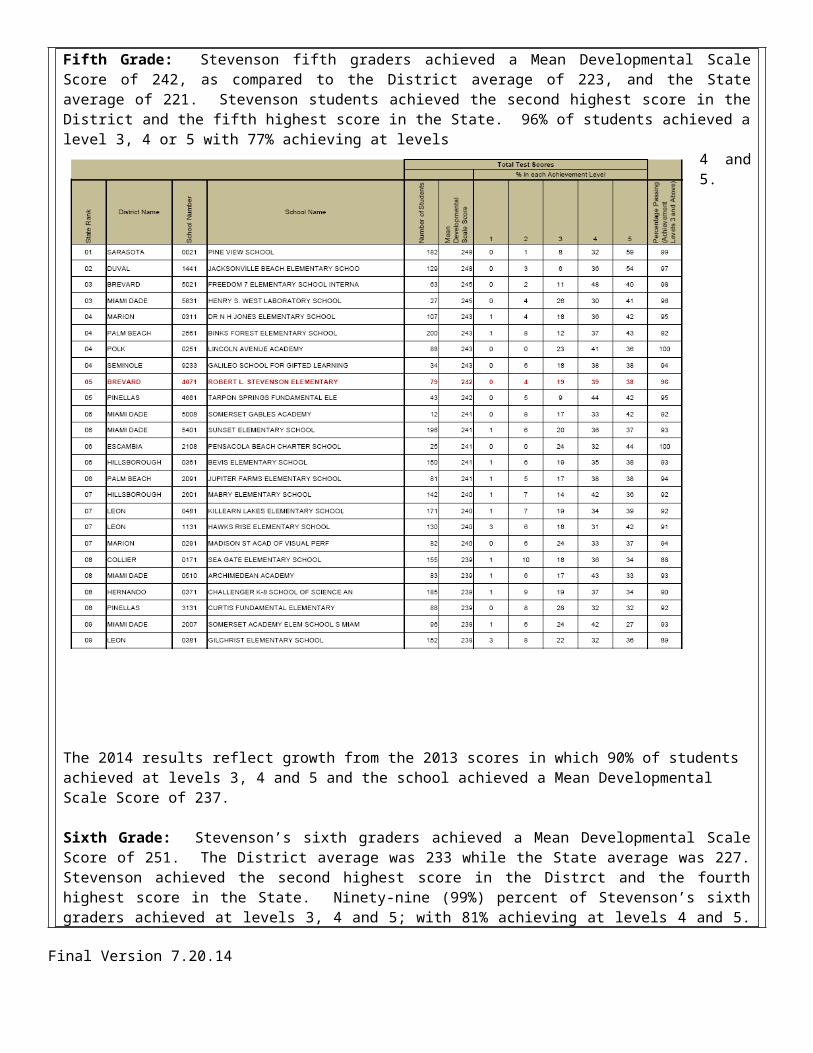
Fifth Grade: Stevenson fifth graders achieved a Mean Developmental Scale Score of 242, as compared to the District average of 223, and the State average of 221. Stevenson students achieved the second highest score in the District and the fifth highest score in the State. 96% of students achieved a level 3, 4 or 5 with 77% achieving at levels 4 and 5.
The 2014 results reflect growth from the 2013 scores in which 90% of students achieved at levels 3, 4 and 5 and the school achieved a Mean Developmental Scale Score of 237.
Sixth Grade: Stevenson’s sixth graders achieved a Mean Developmental Scale Score of 251. The District average was 233 while the State average was 227. Stevenson achieved the second highest score in the Distrct and the fourth highest score in the State. Ninety-nine (99%) percent of Stevenson’s sixth graders achieved at levels 3, 4 and 5; with 81% achieving at levels 4 and 5. Only three schools in the State had more students scoring at level 5.
Final Version 7.20.14
These scores represent an increase from 2013 scores (249 Mean Developmental Scale Score, and 98% of students scoring at levels 3, 4 and 5).
MATHEMATICS
Third Grade: Stevenson third graders achieved a Mean Developmental Scale Score of 221 as compared to the District Average 204 and the State average of 201. Stevenson ranked second in Brevard County and sixth in the State of Florida. Of particular note is the fact that 100% of Stevenson’s third graders performed at levels 3, 4 and 5. Seventy (70%) percent of RLS third graders scored at levels 4 and 5.
The 2014 scores reflect considerable growth from the 2013 scores. In 2013 the school the same Mean Developmental
Final Version 7.20.14

Scale Scores (221),however eleven (11%) percent of students scored a level 2 and one (1%) scored a level 1 resulting in 87% of students achieving a level 3, 4 or 5.
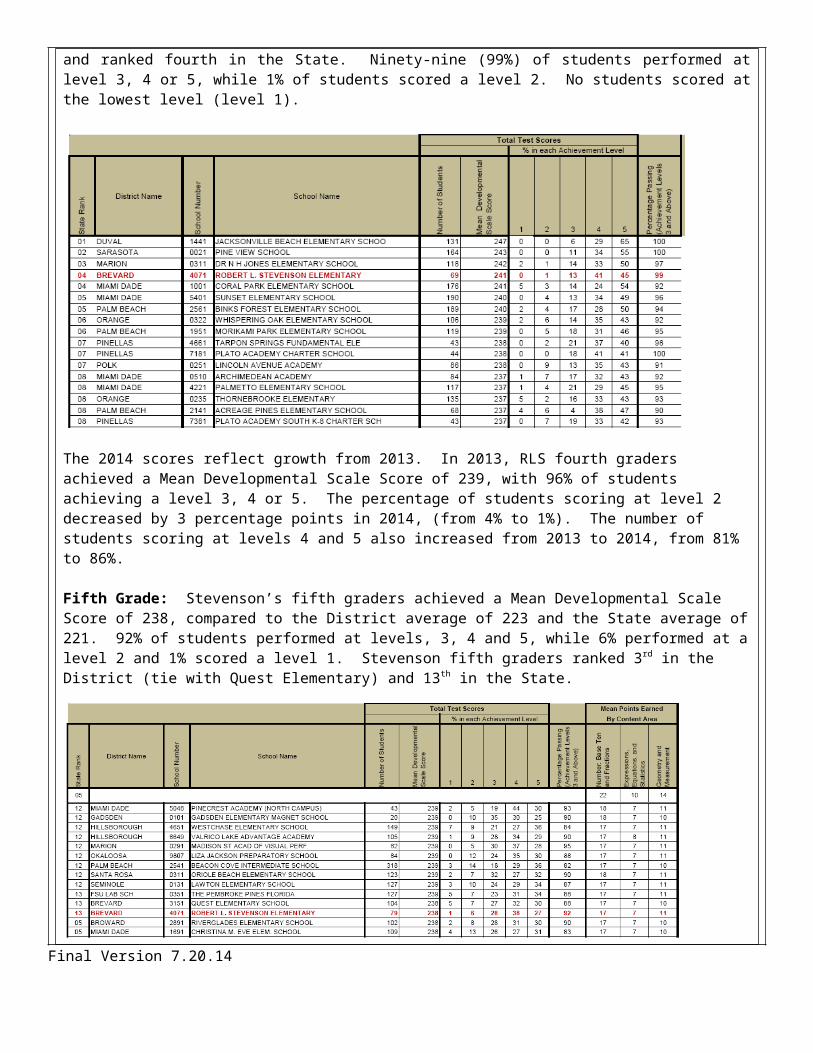
Fourth Grade: Stevenson fourth graders achieved a Mean Developmental Scale Score of 241, compared to the State average and District average of 216. Stevenson’s fourth graders were the highest scoring students in the District and ranked fourth in the State. Ninety-nine (99%) of students performed at level 3, 4 or 5, while 1% of students scored a level 2. No students scored at the lowest level (level 1).
Final Version 7.20.14

The 2014 scores reflect growth from 2013. In 2013, RLS fourth graders achieved a Mean Developmental Scale Score of 239, with 96% of students achieving a level 3, 4 or 5. The percentage of students scoring at level 2 decreased by 3 percentage points in 2014, (from 4% to 1%). The number of students scoring at levels 4 and 5 also increased from 2013 to 2014, from 81% to 86%.
Fifth Grade: Stevenson’s fifth graders achieved a Mean Developmental Scale Score of 238, compared to the District average of 223 and the State average of 221. 92% of students performed at levels, 3, 4 and 5, while 6% performed at a level 2 and 1% scored a level 1. Stevenson fifth graders ranked 3rd in the District (tie with Quest Elementary) and 13th in the State.
2014 results remain constant with 2013 scores. In 2013, RLS students achieved a Mean Developmental Scale Score of 237 with 91% of students performing at levels 3, 4 or 5. Of note however, is the fact that percentage of students scoring a level 4 or 5 increased in 2014 to 65% (57% in 2013). The percentage of students scoring at a level 1 or 2 was also decreased by 2% (2014- 1% level 1; 6% level 2 / 2013- 1% level 1, 8% level 2).
Sixth Grade: Stevenson’s sixth graders achieved a Mean Developmental Scale Score of 254, compared with the District average of 236 and the State average of 226. Ninety-six (96%) of students achieved a level 3, 4 or 5 with 88% achieving a level 4 or 5.
Final Version 7.20.14
Stevenson achieved a Mean Developmental Scale Score of 252 in 2013 with a 98% pass rate. Of note however, is the increase of students moving from level 3 to level 4 and from level 4 to level 5.
Writing: Writing has been a point of pride at the school for several years, and the results of the 2014 Writing Assessment continue that tradition. Students achieved a Mean Score of 4.2, resulting in the highest score in the District and the third highest score in the State.Ninety-three (93%) of students achieved a score of 3.5 or above. The District Mean Score was 3.1 while the State outperformed the District slightly at 3.2.
In 2013, students achieved a Mean Score of 4.4, and were ranked third in the state. While RLS decreased by two-tenths of a percent, it is interesting to note, that in 2013 the highest score in the state was 4.7, while in 2014 it was 4.5 (a two-tenth of a percent decrease). Similarly, the second ranking school also reflected a two-tenths of a percent decrease.
Science: Stevenson achieved a Mean Scale Score of 224, as compared to the District average of 205 and the State average of 201. This score is the second highest in the District (tie with West Melbourne School for Science) and the 8th highest in the State. Ninety-four (94%) of students achieved a level 3, 4 or 5, with 70% scoring level 4 or 5.
Final Version 7.20.14

One student achieved a level 1 on the assessment.
In 2013, Stevenson achieved a Mean Score of 219 with an 88% “pass rate.” The results of the 2014 assessment indicate considerable growth in this area.
Reflection: Our current practice is that teachers are conducting, on a more routine basis, “Close Read Strategies” through the use of an array of informational text. Teachers had the opportunity to explore and learn how to engage students more in looking at text structure and text features, more informational text and “writing to respond” to questions based on selected readings. Students were better engaged in their own learning because they had to respond to text through an array of questions that helped them to analyze the author’s position on a given topic. Students learned to defend their answers verbally in a collegial and congenial manner under a controlled teacher-led environment. Over many weeks through the use of our PLT’s (Vertical Team meetings), teachers shared experiences, viewpoints, and on how to appropriately guide students using the Close Reading method. While similar to the Common Core State Standards, the Florida Standards will be reviewed and shared with teachers to show them the similarity between the two sets of standards as well as the minor differences that the Florida Standards expects student to master. During vertical team meeting, teachers will exchange ideas to develop appropriate and well scaffold curriculum that aligns to the Florida Standards. Grade level teams will use the Literacy Design Collaborative Model Framework to further develop grade level specific learning modules. As part of Stevenson’s second year plan to continue to have all grade level teams developing appropriate and purposeful curriculum that not only includes the English/Language Arts but also content specific standards in both science and social studies, Stevenson will make all attempts to include in our module development the inclusion of mathematics as well as the arts in order that our students experience a fully blended curriculum (problem solving through cross-disciplinary work).
In mathematics, students will be asked to show all of their work that will help them to examine how they arrive at an answer and not only articulate a process that they used to get to an answer. Attending to precision is about computation. Students need to understand the importance of having a correct/exact answer.
Last year, our school was primed for moving in this direction. We had acquired knowledge about different formative
Final Version 7.20.14

assessments a focus, in part, from the 2012-13 School Improvement Plan thereby giving us new direction for the 2013-14 School Improvement Plan. As we moved to the development and design our own lessons (LDC) in our learning modules (known as “mini lessons” within the unit), we included what has been learned about how to infuse formative assessments, as well as how to direct instruction for students based on learning needs and their personal readiness levels in math which will be incorporated in our new module development. Due to the development of our R.L.S. Writing Framework, teachers received a practical guide to implement different skills expected to be visible in student writing after the teacher modeled the use of those skills. This year, teachers will move the students writing experience from the use of exit writing slip, summaries, and essays to forming more complete argument papers (something we experimented with last year) based on three different forms of text by different authors. Students will be required to piece information together by forming conclusions where they have to defend and justify their answers. To have students take a position about a stated topic will be a new component where to test their reasoning skills will be imbedded into their writing practices. A Stevenson modular development team was formed over the summer to include 18 teachers, that worked to create/develop 2 modules to “kick start” the school year. One module would integrate science skills and the other social studies. Each grade level currently has two modules that have been reviewed by all members of the grade level teams. Modules vary in length depending on the grade level, but a minimum of four weeks to a maximum of 8 weeks is the duration of any of our modules. During Pre-Planning Week’s Professional Development Day, grade levels leads shared information developed during the summer. Each grade level team member actively provided input about the module which would be taught during the first quarter. During grade level team meetings, modules will be reviewed in depth by teachers and administration. Unlike last year, when we were introducing “the module idea,” this year, extensive focus will be placed on results and outcomes of all our modules.
Best Practice:(What does research tell us we should be doing as it relates to data analysis above?)What does the research say about your findings? Evidenced based? What practices can you put into place to work on what the data says is impeding student achievement?
Based on what you are seeing; what teachers are doing well; what you need to change and improve…RESEARCH SAYS YOU SHOULD…
The foundation of the Common Core State Standards and the Florida Standards are defined by adding a focus on rigor. Stevenson has defined this for many years by setting high expectations for each grade level in the areas of English, Language Arts, and Mathematics. The standards set rigorous benchmarks. The impact on student learning will depend on the implementation of the standards. Authentic rigor includes high expectations for students with increased support for students and an increased demonstration of learning by students. Today’s definition of rigor is to create an environment in which each student is expected to learn at high levels, where each student is supported so he or she can learn at high levels, and each student demonstrates his or her own learning at high levels. We cannot assume that simply adopting the standards is enough to provide a rigorous classroom environment. Rigor includes an emphasis on what is to be taught in conjunction with how to teach, and how students show that they have learned the content. By providing open-ended assignments where students need to think about their answers, teachers can chunk information into smaller bits so students can achieve more through the use of information that has been scaffold thereby bringing layers of complexity to the topic. By teachers having students focus on strategies that focus on content in a more deliberate and structured manner, students will begin to feel successful in the classroom because their understanding to think about something new will grow which will result in their “feeling successful.” Last year, Stevenson worked hard to activate the acquisitive nature of students by not about telling students what they will be doing, but rather what students will learn. This is an excellent way to shift the ownership to students thereby allowing the teacher to facilitate their learning through many forms of student learning that is supported by complex questioning and through activities and lessons that differentiate instruction based on readiness levels of students. While this will continue to remain a major emphasis in our
Final Version 7.20.14

thinking, this year’s school improvement plan will look more critically at what student motivation looks like in elementary school. This will be further explained in this year’s plan based on what leading education experts say.
At Stevenson, the use of formative feedback means that instructional strategies are used to assess student’s work on a regular basis in a manner that provides feedback so the student may be permitted to pose questions as well as permitting the teacher to redirect their instruction (at a time most needed which will help to lend support to student learning). It is only through the teacher’s active listening can “learning in the moment” actually be beneficial to students. Teacher engagement is as important as the students responding to instruction (student engagement). Through classroom “walk-throughs,” it should be observed that there is a focus on a student’s ability to reason and think as well as on achievement – leading to an increase in test scores. It is important that every teacher at Stevenson find language that helps students to understand the meaning of “rigor” and what active learning engagement looks like through models of learning.
Last year, we successfully implemented the idea of “instructional rounds” where groups of teachers and administrators went into classrooms to see varying levels of student engagement as they “attacked the curriculum” presented by teachers. Two sessions of instructional rounds were held; one in the fall and the other in the late winter. Eleven teachers participated in the first instructional round. During the second set of instructional rounds eighteen teachers actively participated in meaningful discussions about what student engagement looked like in exemplary classrooms. This year, it is anticipated that there will be an increased number of teachers participating which will be well over half of the staff (thus far 27 teachers have signed on). In order to continue to effect change so that formative feedback is consistently and routinely provided as well as understanding the idea of “rigor,” Stevenson has placed on its calendar to hold three sets of instructional rounds, one during each of the first three quarters of the school year. This is where the disbursement of School Improvement funds will be placed. It is Stevenson’s operational belief that “staff development and training” is the key to student success. A new set of “look fors” has been created to help guide teachers and administrators as instructional rounds are conducted. These “look fors” will be introduced during pre-planning week upon teachers arrive to school. It is anticipated that deeper and more meaningful discussions will occur after each instructional round thereby elevating the level of purposeful teaching and learning.
Analysis of Current Practice: (How do we currently conduct business?)
Move any Action Steps that have become standard practice to this section.
The Literacy Design Collaborative Framework was introduced last year to all teachers as a structural framework to develop original curriculum that would be intentionally taught to our students. Each module unit was carefully crafted to appropriately scaffold information so that a level of complexity brought about appropriate academic rigor. “Built-ins” were established as “non-negotiables” that helped to keep the academic focus on not only the standards but also keeping in alignment the assessment used to assess student knowledge and product development – a gauge to determine the level of independent mastery a child acquired at the end of the lesson (Backward Design planning). In comparison to last year, this year, a deeper focus will be placed on what has been learned as teachers have now become accustomed to the framework to now begin and reflect, appraise and redefine our lesson development where cohesion of each lesson will bring better quality unit/module design. To ask, “Was what we wrote in our lesson aligned to the expected outcomes of our intent? In reality, were students actually able to perform each stage of the lesson (mini lessons) with fidelity?” Hence, can we actually apply knowledge that is believed to be theoretically correct?
During Pre-Planning Week, administration provided each teacher with a survey of questions in order to begin to analyze this process and beginning with teacher “buy-in.” Unanimously across all grade levels (100%), everyone indicated that the LDC curriculum framework was worth its continuation. The survey explored where future staff development needs would
Final Version 7.20.14

be needed in order to further assist teachers. Because the LDC model intends to have a high level of student engagement as a major component to learning, this idea alone has led to further study about how to seek new and improved ways to keep students actively and attentively learning throughout the learning cycle of each lesson taught (B.E.S.T. – Brevard Effective Strategies for Teaching). This idea will be further explored in the Best Practice section of this year’s School Improvement Plan.
Best Practice: (What does research tell us we should be doing as it relates to data analysis above?)What does the research say about your findings? Evidenced based? What practices can you put into place to work on what the data says is impeding student achievement?
Based on what you are seeing; what teachers are doing well; what you need to change and improve…RESEARCH SAYS YOU SHOULD…
“They just are not motivated to stick with it.” You will often hear teachers say this when a student gives up on school. Many times as educators, we find ourselves asking the age old question, “We know that learning is stickier if students have to struggle a little with a particular topic or content area, but how do we get them past the hand-holding? 99% of the time, we have students at Stevenson Elementary School that do not know when they should ask an adult for assistance and when it is necessary that they be more self-directed in their own learning. According to a study, “Building a Grad Nation” there is a substantial share of our own American teenagers remaining spectacularly unmotivated and unengaged in schooling. Did it begin in elementary school? In a separate study conducted by Stanford University, Psychologist Carol Dweck, a graduate of Harvard, found that short term efforts to motivate students to meet external goals such as a prize(s) for exhibiting behavior or improved test scores damage “motivation” in the long term. Experts warn that to motivate students properly requires teachers to be careful by helping students distinguish simple enthusiasm from true academic drive. To get students to think about things in a deeper way is a “big shift” in the way we have been teaching.
While there are many studies that reveal that motivation varies from students who come from higher levels of poverty to others, at Stevenson, we too experience varying degrees of engagement from students thereby bringing standardized test scores down. Too often, we have witnessed either teachers, parents and our students that receive “passing grades” acknowledging their acceptance without acknowledging what could have been done to improve the score. Is it acceptable to ask students to perform moderately well to assigned tasks? What messages are learned by students from the adult interacting with them this way? Are there better ways to address the child that is not working to their potential or at their optimal best?
In an article by Sarah Sparks, “An Age-old Problem Gets New Attention”, (2014), there is much focus and attention on academic skills all of which is in response to federal and state testing and accountability requirements which has led to many schools having less time to build students’ motivation and perseverance. Have these testing initiatives used to boost reading and math proficiency helped or hurt students’ academic drive, and even at a young age? In looking critically at Stevenson’s standardized test scores, the staff has begun to ask what factors impact student engagement and motivation? In polling staff, they said that student engagement and motivation is very important to the progress a child makes academically. When comparing a poll recently conducted by Education Week, Stevenson’s results mirror what Education Week concluded which is that 88% of teachers view active student engagement as critical to a student’s overall success in school. Thomas J. Kane, an economics professor from the Harvard Graduate School of Education, is quoted as saying that, “A great school experience is when you have had enough exposure to teachers who are great at cultivating motivation, it then becomes second nature to students.” Teachers who encourage their students to look at failure as an opportunity to learn become the best mentors and instructional coaches. It is not about saying to students that if you “get the topic immediately” you are “smart” and that finding things “easy” is
Final Version 7.20.14

always a “good sign”, and finding things “difficult” is a “bad sign.” This is not the message great schools send their students. Teachers who affirm with students the necessity to “learn to adjust what you are doing” as a critical assessment of one’s intellectual ability is to have students re-evaluate what went wrong. This is the better way to manage such discourse.
Based on mounting research that has been conducted by Sparks, she suggests that the greater benefit to students comes when classes are organized to encourage them to try challenging new tasks as well as to bounce back from failure. Teachers grapple with what such classrooms look like in practice. The question that she poses is, “If the real challenge is that people learn well from failure, from mistakes, why then must we wait for it to happen?” “Why can’t teachers design for it?” So, hypothetically, if Stevenson teachers allowed students to learn better through failures, then perhaps the long-term failures would be minimized. Studies have indicated that when students are allowed the time to struggle with new problems on their own first, were better able to evaluate different variations of the problem using different methods to solve it, and they showed deeper understanding of the underlying problem/solution related to the concept. Dweck, renowned Stanford Psychologist, noted that when students cope with failure, can help them to better understand “growth mindset” – a state in which a person believes that intelligence or skill is a product of effort rather than inherent, unchanging ability. Such thinking has shown to improve a student’s likelihood of succeeding in work and other life outcomes.
During the 2014-15 school year, Stevenson’s teachers and administration will be conducting school-wide classroom walk-throughs/instructional rounds. These will be done three times over the first three quarters of the school year with specific “look fors” in mind. The first round will include how and what student engagement looks like and where student’s emotional/academic drive is tested. Finding the correct challenge of discomfort will be the “look for” as differentiated instruction will vary greatly in the development of strong lesson design. The second instructional round of the second quarter will include the observing of the continued development of the LDC modules of study, where teachers will see and study how students are responding to the scaffolding of these units as levels of complexity in thinking is presented that builds greater understanding conceptually through any array of skills. The third instructional round will include teachers observing how students go about to connect different text features both in written and oral form. To keenly “look for” how a student is cognizant of their use of grammar and conventions using formal oral and written language will help better to understand a student mastery of speaking and listening skills and their increased awareness of their learning, drive and motivation to learn.
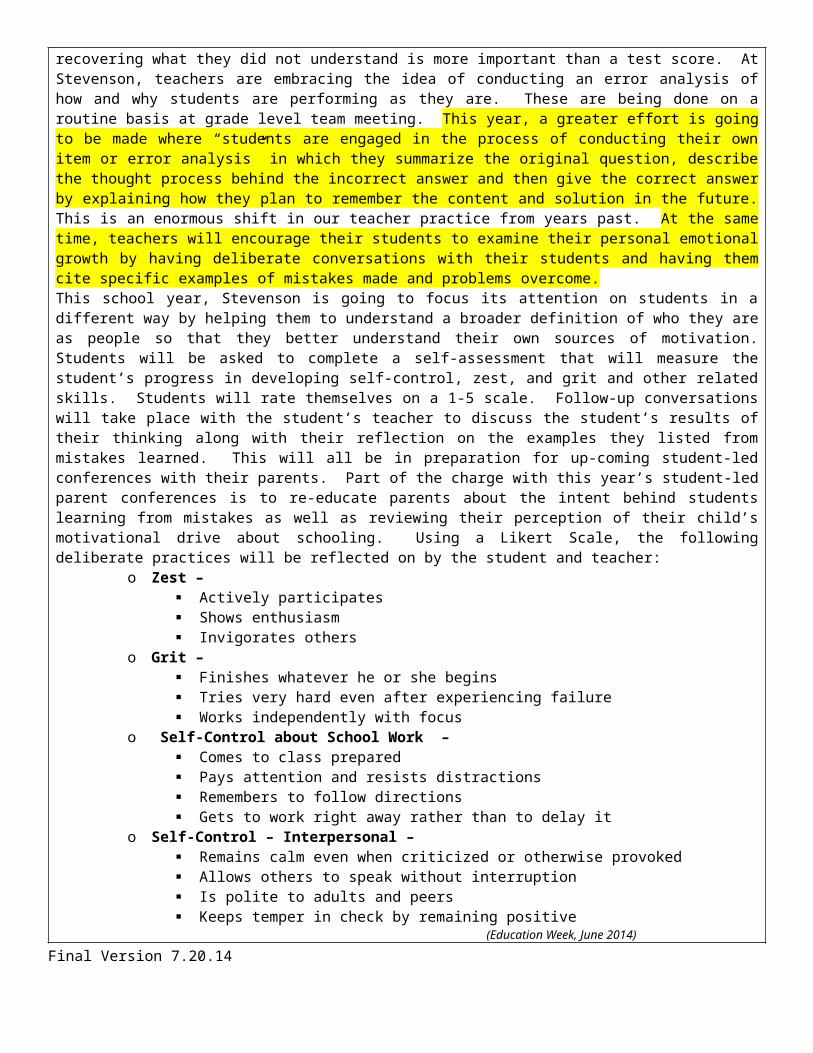
Stevenson staff continues to look deeply at test results as to why certain students score well one year, less well the following, to then rise again a year later. After discussion about why this trend continues to occur, one cannot merely accept that “it is hard to maintain perfection!” The overarching question that has been raised is, “What message can we send a student on a more consistent basis about self-efficacy, motivation, and work? It is believed that the message that students need to internalize is that struggle is an essential part of a great classroom climate. As a staff, we are concluding that when things are hard, and they should be hard, things should be fun. Teachers have to be able to recognize and engage with students when they have the thought that they have the problem wrong and therefore believe they are “bad at doing it” or that they are being permitted to be less driven (motivated) to try to correct the problem thereby bring about a correct or more complete solution. Stevenson is going to put forth tremendous effort to persuade students to move outside their comfort zone by making sure they learn from mistakes. By providing immediate and constant feedback on whether the student has fully or partially, or not at all mastered, the specific skill or content is how teachers will provide information to students regularly. Students will come to understand that options for recovering what they did not understand is more important than a test score. At Stevenson, teachers are embracing the idea of conducting an error analysis of how and why students are performing as they are. These are being done on a routine basis at grade level team meeting. This year, a greater effort is going to be made where “students are engaged in the process of conducting their own item or error analysis” in which they summarize the original question, describe the thought process behind the incorrect answer and then give the correct answer by explaining how they plan to remember the content and solution in the future. This is an enormous shift in our teacher practice from years past. At the same time, teachers will encourage their students to examine their personal
Final Version 7.20.14

emotional growth by having deliberate conversations with their students and having them cite specific examples of mistakes made and problems overcome.This school year, Stevenson is going to focus its attention on students in a different way by helping them to understand a broader definition of who they are as people so that they better understand their own sources of motivation. Students will be asked to complete a self-assessment that will measure the student’s progress in developing self-control, zest, and grit and other related skills. Students will rate themselves on a 1-5 scale. Follow-up conversations will take place with the student’s teacher to discuss the student’s results of their thinking along with their reflection on the examples they listed from mistakes learned. This will all be in preparation for up-coming student-led conferences with their parents. Part of the charge with this year’s student-led parent conferences is to re-educate parents about the intent behind students learning from mistakes as well as reviewing their perception of their child’s motivational drive about schooling. Using a Likert Scale, the following deliberate practices will be reflected on by the student and teacher:
o Zest – Actively participates Shows enthusiasm Invigorates others
o Grit – Finishes whatever he or she begins Tries very hard even after experiencing failure Works independently with focus
o Self-Control about School Work – Comes to class prepared Pays attention and resists distractions Remembers to follow directions Gets to work right away rather than to delay it
o Self-Control – Interpersonal – Remains calm even when criticized or otherwise provoked Allows others to speak without interruption Is polite to adults and peers Keeps temper in check by remaining positive
(Education Week, June 2014)
Can the Stevenson staff influence their student’s ability to learn as well as provide different material to help them learn better?Current brain research states that emotions are intimately tied to learning. When students are afforded the opportunity to connect highly emotional relevant and meaningful daily life experiences learning math, science, reading, writing and social studies, teachers have a created a state of mind for their students that is more at ease with the topic.
(Journal Magazine, June, 2014)Brain research has also shown the positive and negative effects that students’ emotional state can have on the affective filter in the amygdala (part of the limbic system of the brain). There is a release of dopamine to the brain when a student receives intrinsic praise. Dopamine in the brain brings about pleasurable feelings, especially when learning is taking place in a safe learning environment, where risk-taking is encouraged and hard work and challenging tasks are expected, and not viewed as confusing or threatening. Through Dusatel’s work, he concluded that if students feel threatened, then the process of their learning is disrupted, because the student is most likely to pay attention to the idea of threat rather than the prefrontal cortex of the brain remaining focused on problem solving and higher level thought processes take place on the instructional task. The cortex upon threat shuts down all thinking. To counteract this, teachers must allow students time and opportunity to interact with material. If the teacher is the only one talking, the teacher is the only one learning. Stevenson will continue to build on modules of study using the LDC (Literacy Design Framework) where brain compatible thinking is included in the development of
Final Version 7.20.14

these modules.
Stevenson’s focus will continue to stem on the idea of experiential and project-based learning. Experts suggest that, “Discovery learning or learning by doing is very powerful if rigorously structured.” Teachers will have ample time to discuss the merits of rote learning to learning experientially. Both are needed. But when is the best time to have that occur in the lesson design? When does the role of executive function take place? Is this too, part of the building block for learning? How does a teacher strategically fit it in to the lesson design? These are the range of questions our modules of study will focus on this school year to build better cohesion.
The Incorporation of Common Core Standards – Speaking and Listening, and Writing to ExplainLanguage is how we think; it’s our operating system (noted Doug Fisher and Nancy Frey, authors of “Content- Area Conversations and How to Plan Discussion-Based Instruction for Diverse Learners”, 2008.“Because talk represents thinking, classrooms should be filled with it. Yet in most classrooms, talk is frequently limited and used to check comprehension rather than develop thinking.” In today’s classroom with evolution of Common Core Standards, it is not enough for teachers to have students hear academic speech from the teacher, they must use academic discourse with peers if they are to acquire it. Providing time and structures for purposeful classroom discussion allows students to own the words and ideas of content taught.”
The six Anchor Standards for Speaking and Listening provide teachers with a blueprint. The first anchor standard SL.1 has a specific goal in mind; to guide students by preparing them to participate effectively in a range of conversations an collaborations with diverse partners, building on other’s ideas and expressing their own clearly and persuasively. Interpersonal skills are paramount to a student’s success where the expectation progresses through the grade levels as skills become more complex, thinking then moves from asking clarifying questions and citing textual evidence to elaborating, drawing conclusions, paraphrasing, modifying views in light of new information, and setting rules through the carrying out of assigned roles in varied discussion groups. Without structure in place, classroom discussions will be ineffective and notably awkward. It has been evidenced that some of our students do not know how to effectively initiate or maintain a conversation, especially in an academic environment. Instructional supports such as rubrics detailing well-crafted arguments, graphic organizers to help students capture details of a topic, or multiple representations of key vocabulary relevant to the topic are posted in the classroom can alert students to the newly required metacognitive skills they need to sustain academic rigor. A strategy that Stevenson teachers will explore and adapt this school year is the use of Himmele’s “Bounce Cards” – a conversation prompt that provides students with clues for “bouncing ideas” off of another student’s idea, summarizing information, and posing questions. These will be distributed as bookmarks called the “Stevenson Bounce Card” thereby cuing students’ conversational skills until discussion flows naturally, all of which will become so ingrained that they will respond automatically in any and all conversations centered in subject area content. As a part of this strategy, teachers will provide their students with many opportunities by requiring them to participate in small group discussions where they write on a topic presented in a video they watched, or to a read-aloud, or even group conversation. Teachers will assess students listening skills as much as they are assessing their verbal skills by having students write to respond to questions related to the video presentations. (A revisit of Junior Great books with the idea of inquiry and exploration will be discussed with teachers at team meetings.)
This year, the Stevenson staff will effectively explore effective collaboration norms and guidelines that have been established by the work of R. Garmston’s “Expeditionary Learning” (2010). Garmston states that in order to cultivate a climate where every student is focused on ongoing positive growth and improving student achievement, Seven Norms of Collaboration must be imbedded in instructional practice. House Meeting discussions will focus on the following 7 (seven) points at the start of the school year:
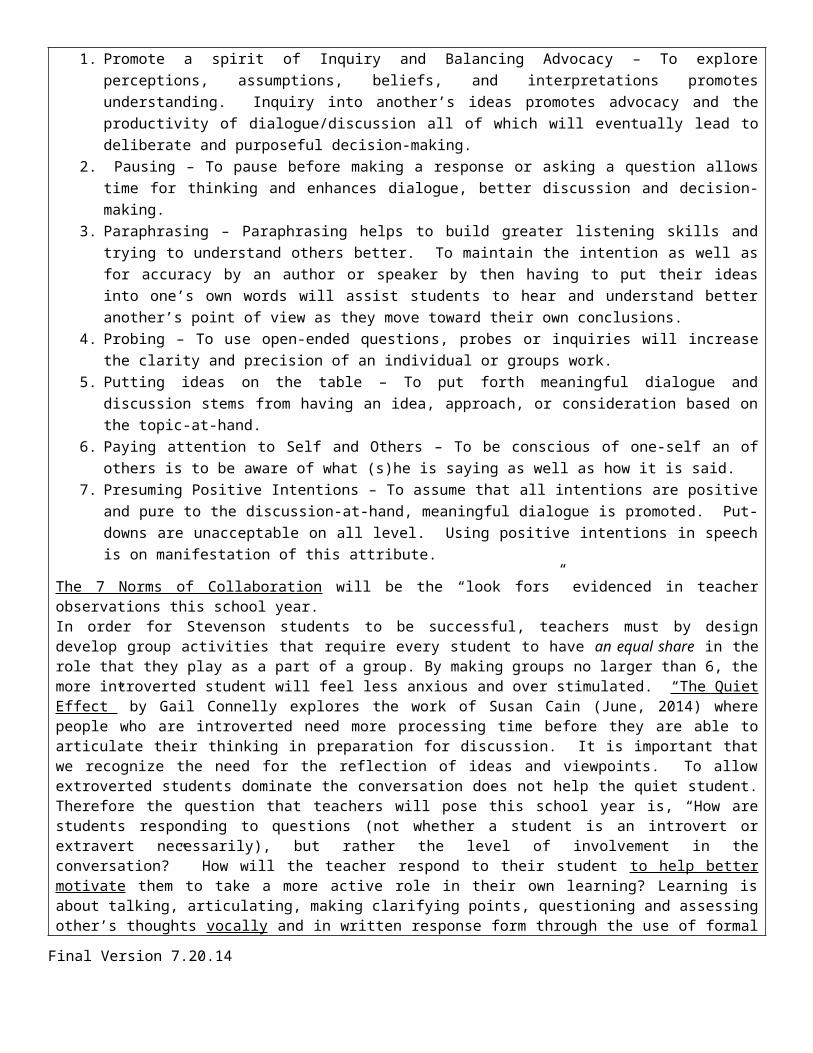
1. Promote a spirit of Inquiry and Balancing Advocacy – To explore perceptions, assumptions, beliefs, and interpretations promotes understanding. Inquiry into another’s ideas promotes advocacy and the productivity of dialogue/discussion all of which will eventually lead to deliberate and purposeful decision-
Final Version 7.20.14

making.2. Pausing – To pause before making a response or asking a question allows time for thinking and enhances
dialogue, better discussion and decision-making.3. Paraphrasing – Paraphrasing helps to build greater listening skills and trying to understand others better. To
maintain the intention as well as for accuracy by an author or speaker by then having to put their ideas into one’s own words will assist students to hear and understand better another’s point of view as they move toward their own conclusions.
4. Probing – To use open-ended questions, probes or inquiries will increase the clarity and precision of an individual or groups work.
5. Putting ideas on the table – To put forth meaningful dialogue and discussion stems from having an idea, approach, or consideration based on the topic-at-hand.
6. Paying attention to Self and Others – To be conscious of one-self an of others is to be aware of what (s)he is saying as well as how it is said.
7. Presuming Positive Intentions – To assume that all intentions are positive and pure to the discussion-at-hand, meaningful dialogue is promoted. Put-downs are unacceptable on all level. Using positive intentions in speech is on manifestation of this attribute.
The 7 Norms of Collaboration will be the “look fors” evidenced in teacher observations this school year.In order for Stevenson students to be successful, teachers must by design develop group activities that require every student to have an equal share in the role that they play as a part of a group. By making groups no larger than 6, the more introverted student will feel less anxious and over stimulated. “The Quiet Effect” by Gail Connelly explores the work of Susan Cain (June, 2014) where people who are introverted need more processing time before they are able to articulate their thinking in preparation for discussion. It is important that we recognize the need for the reflection of ideas and viewpoints. To allow extroverted students dominate the conversation does not help the quiet student. Therefore the question that teachers will pose this school year is, “How are students responding to questions (not whether a student is an introvert or extravert necessarily), but rather the level of involvement in the conversation?” How will the teacher respond to their student to help better motivate them to take a more active role in their own learning? Learning is about talking, articulating, making clarifying points, questioning and assessing other’s thoughts vocally and in written response form through the use of formal written language as described and the established “school-wide writing framework.”
RtI – Important Guiding Questions:Let’s begin by identifying exactly what IDEA is. Specifically, Individuals with Disabilities Education Improvement Act, 2004 outlines Response to Intervention (RtI) as a process for continuously improving achievement for students struggling to learn and to reduce the number of students who are being referred for special education services. The goals from this legislation mandates that students meet the standards and achieve through appropriate evidenced-based instruction and intervention methods, products and practices and all of which may be measured using standardized testing. Response to Intervention is the practice of providing high-quality instruction or intervention matched to students needs using a learning rate over time and level of performance to make important educational decisions to guide future instruction.
Through the use of tiered instruction (3), services data collection is integrated to inform decisions at each tier and it is through the problem solving method that interventions are determined. Intervention plans address academic or behavioral concerns about students. It is through continuous monitoring of student learning that goals are set to increase achievement for the student. Teaching, therefore calls for the knowledge and use of relevant instructional practices as well as multiple strategies and techniques that scaffold instruction to assure that students reach increasing levels of service for different content areas of study (math, reading, writing, science, social studies). Because RtI is a tiered service-delivery model, which
Final Version 7.20.14
means that different levels of service instruction/and or assistance are provided, students receive their instruction at whatever tier (or level) they need the support. (Berch and Mazzoccor, 2007)
Various uses of cognitive and metacognitive strategies are to be identified and used in meeting the needs of a wide range of students. At times additional use of instructional materials – manipulatives, graphic organizers, visuals, models are necessary to support conceptual understanding.
It is in light of our students that traditionally score high on standardized tests, yet waiver in their demonstrating with consistency high levels, that the implementation of more effective RtI strategies will be utilized as a plan to better serve students. In part, a focus this year of our grade level teams will be to create a greater awareness by teams of educators committing to the development and implementation of instructional practices with the RtI process (Fletcher, Denton, and Tilly, 2006). The following listed strategies will be reviewed with staff.
1. Collaboration with colleagues about instruction, intervention, assessment practices, classroom accommodations and accountability will be held during grade level team meetings.
2. Participation as a team member in a school-wide effort to improve student performance while sharing specific information related to students who struggle will be a part of routine discussion at team meeting.
3. A collection of multiple source data from assessments both summative and formative as well as observations interviews, in a timely fashion to assure proactive problem solving and instructional planning for students will experience difficulty with content will be addressed.
4. Research and provide products that are research-based in nature that addresses and identifies instructional and behavioral student concerns.
5. *Disseminate a model that addresses identified students of concern where time is built into the weekly schedule for certificated teaching staff to work with students on improving identified skill deficits that may impact their achievement goals.
6. *Learn how to better facilitate problem solving methods using the grade level teams as a point of reference as well as the guidance counselor, staffing specialist, behavior analyst, and school psychologist.
7. *Teachers who are sighted to help an individually identified student (one-on-one instruction) will have this time identified on their weekly schedule. These interventionists will focus on vocabulary, well scaffold approaches using graphic organizers, and manipulatives during these weekly sessions. Progress monitoring will be shared with the classroom teacher by the interventionist. The purpose of these meetings is to provide not only service to the student but to also affirm for the classroom teacher that the student is in need of support as well as providing a different way to provide the identified support. Students will be expected to “talk” by explaining their answers and if possible their area of misunderstanding as stated in the above Speaking and Listening portion of the Stevenson School Improvement Plan.
*A strategy beginning with an asterisk will be clearly evidenced though the use of schedules, meeting agenda, minutes of meetings, lesson design plan books.
The result of this strategy as part of the Stevenson School Improvement Plan is for teachers to think about how we as teachers see how students learn, and to hold professional conversations by the interventionist and classroom teacher about what possible next steps will aid the student so that continued progress is made whether it is a student progressing at high levels or a student who is lower functioning thereby needing remediation at a greater level. Assessment data will be used to determine the student’s learning rate and level of performance. This will be seen through the use of relevant instructional practices as well as multiple strategies and techniques found through well scaffold instruction. This approach calls for us to minimize the “wait to fail” approach and instead improve learning through high-quality instruction and intervention in addition to the classroom instruction. It is a belief that together educators can make a difference in a student’s performance. (Based on an article, “RtI in Math Class” by Gina Gresham and Mary Little, August, 2012)
Final Version 7.20.14
Literacy Design Collaborative:Stevenson staff will conduct its own research this year, teacher by teacher, to see if they can make a difference with every individual student that they are assigned. To explore the idea that every child is valued through the value times expectancy model means that if each student values an activity more, the teacher can expect greater success thereby increasing motivation (the formula is V x E = M). For Stevenson staff, the charge is to create engaging curriculum through units of study that are hands-on, collaborative in nature, fun, and coming to “grips” with high-level concepts that require the application/demonstration of skills where an end product is the means for providing evidence where students writing is incorporated into lessons that requires reflective thinking and processing of the work demand that was asked through the targeted question or essential question (Literacy Design Collaborative). This is a continuation of last year’s School Improvement Plan which was to familiarize, understand, and implement the LDC curriculum framework. Teachers this year have greater exposure to the framework, will move module development to the greater level in continuity through better scaffold lessons, better increased levels of complexity in thinking all of which will increase the level of academic rigor, student engagement, and with special attention to the individual student’s motivational drive.
As the teaching staff embarks on the delivery of instruction, the continuation of regularly scheduled team meetings and “house meetings” (vertical team meetings) will be held weekly. Through deliberate practice, both teachers and administrators will explore and discuss ideas that focus on what, how, and why we teach particularly when, and in conjunction, to focus on what common assessments will be used to progress monitor student performance both formative and summative. This year, our goal is that we will make every concerted effort to develop modules of study that will be sent to the Literacy Design Collaborative for “vetting” our units of study as a means to receive constructive feedback and possibly to receive recognition for the development of academically rigorous standards-driven instruction and curriculum development. To implement three modules per grade level is our school-wide goal. The inclusion of all components regarding motivation, student reflection, the Reflection Progress Monitoring Survey, R.L.S. Bounce Card, Student-Led/Parent Conferences, and RtI will be factored into LDC modules.
LDC/STEAM: The Last QuarterScience, Technology, Engineering, Arts and Mathematics will be the school’s focus during the final quarter of the school year where teachers will have been involved in the preplanning of the LDC/STEAM module during the 3 rd
quarter of the school year. The anticipation is that this module will last 4 (four) weeks where implementation will occur around the standardized testing calendar.
Background information: What is STEAM?S.T.E.M. is an acronym for Science, Technology, Engineering and Mathematics, and STEM Schools focus on these subjects to help our nation's youth gain the skills required to succeed in today's challenging world. This includes the ability to think critically, solve complex problems, and drive advancements in science and technology. The added bonus is when you add an “A” to the word STEM it becomes STEAM. “A” stands for Arts. The newly emerging program STEAM program at Stevenson will be called RLS - Pave the Way.
The future stability of our economy is unknown and the United States faces many challenges if it is to continue to prosper and compete with other countries in the world. Parents will also take comfort in knowing that science and engineering jobs are growing 70 percent faster than other occupations. This means students with STEM/STEAM education will be at an advantage when competing for the high-tech, high-wage jobs of the future. This was fueled by America's high demand for educated individuals to fill the job openings requiring highly skilled workers in order to keep some of the nation's most innovative company’s here in the U.S. Stevenson to wants to remain on the cutting edge of what our students are going to need if they are to remain competitive in the world market as they seek employment. Therefore to be career ready means to be education able.
STEM Schools are emerging across the nation, to keep America ranked as one of the leading nations in technological
Final Version 7.20.14

breakthroughs and scientific research. However, just like all important programs, funding can often be scarce or inadequate. Private investors and state programs are scraping together enough money to advance the STEM School program because they understand that investing in our nation's education is one of the most important strategies for maintaining a strong, stable economy in the future.
The U.S. Immigration and Customs Enforcement has compiled a list of STEM designated degrees. This list is intended for foreign students who are studying in the U.S. on a valid student visa so they may qualify for certain optional training programs. But this is also a good reference for American students, their parents and teachers, and it show that STEM can be integrated into a variety of interests. Today’s American employers are having a difficult time finding sufficiently skilled workers for those jobs. The reason for poor results in STEM (STEAM) subjects has been extensively examined by leading experts in education whose work has been used in the development of the new Common Core State Standards and the Next Generation Science Standards. By improving curriculum standards there is a serious attempt to ensure a strong foundation in science subject before entering high school. Stevenson Elementary School seeks to propel more students into STEAM well prior to entering high school and even junior high school. This is due to information that has been published by International Student Assessment (PISA). They explain that fifteen-year olds in the U.S. today are “of average range in ability” in science and reading literacy, and below average in mathematics, compared to their counterparts in [other industrialized] countries.”
U.S. Secretary of Education, Arne Duncan, spoke these grim words on the bleak December day in late 2013 when the international tests in math, science, and literacy were released. No less disconcerting was the secretary’s warning that the nation’s educational problems are not limited to certain groups or specific places. The “educational challenge in America is not just about poor kids in poor neighborhoods,” he said. “It’s about many kids in many neighborhoods. The [test] results underscore that educational shortcomings in the United States are not just the problems of other people’s children.”
In making his comments, Secretary Duncan challenged those who cling to an old belief that the nation’s educational challenges are confined to its inner cities. Most affluent Americans remain optimistic about the schools in their local community. In 2011, Education Next asked a representative sample to evaluate both the nation’s schools and those in their own community. The affluent were especially dubious about the nation’s schools—only 15 percent conceded them an A or a B. Yet 54 percent gave their local schools one of the two top ratings.
Public opinion is split on how well the nation’s schools educate students of different abilities. In 2013 Education Next asked the public whether local schools did a good job of teaching talented students. Seventy-three percent said the local schools did “somewhat” or “extremely” well at the task, as compared to only 45 percent who thought that was true of their capacity to teach the less-talented.
The IFO Center for the Economics of Education and Innovation stated that, “To see whether this optimistic assessment of the nation’s ability to teach the more able student is correct, we draw upon the latest tests of student achievement and find that, as Secretary Duncan has said, the nation’s “educational shortcomings” are not just the problems of the other person’s child. We have given special attention to math performance because math appears to be the subject in which accomplishment is particularly significant for both an individual’s and a country’s economic well-being.
When viewed from a global perspective, U.S. schools seem to do as badly teaching those from better-educated families as they do teaching those from less well educated families. Overall, the U.S. proficiency rate in math (35 percent) places the country at the 27th rank among the 34 OECD countries that participated in the Program for International Student Assessment (PISA). That ranking is somewhat lower for students from advantaged backgrounds (28th) than for those from
Final Version 7.20.14

disadvantaged ones (20th).
There are examples of excellence. The six states with high proficiency rates (58 to 62 percent) among students from families with high levels of parental education rank among the OECD top 13 on this measure. But students from these states are a small portion of the U.S. student population, and other states rank much lower down the international list. In many places, students from highly educated families are performing well below the OECD average for similarly advantaged students.
There can be little doubt that education shortcomings in the United States spread well beyond the corridors of the inner city or the confines of low-income neighborhoods where many parents lack a high school diploma. While bright spots can be identified—particularly in some states along the country’s northern tier—the overall picture is distressing to those concerned about the potential evolution of economic well-being of the United States in the 21st century.
Conventional Wisdom:
Not everyone agrees that the nation’s schools are in trouble. In their apology for the American school, David Berliner and Gene Glass seek to reassure Americans by trying to isolate the problem to minority groups or those of low income. “In the United States, if we looked only at the students who attend schools where child poverty rates are under 10 percent, we would rank as the number one country in the world,” they write.
These claims are highly misleading. The important question to ask is, Do students with similar family background do better in the United States than in other countries?
Defenders of the American school also like to compare the highest-performing states within the United States to all students in other countries. “Massachusetts…scored so high that only a few Asian countries beat it,” Berliner and Glass declare. “The states of Massachusetts, Minnesota, and Colorado…ranked among the top-performing nations in the world.” It is true that Massachusetts schools stand up to world competition, but it is important to keep in mind that the K–12 students living in Massachusetts are just 2 percent of the nation’s total. One cannot generalize to the country as a whole from this small state.
The Study:
Our state-by-state data come from the 2011 tests administered to representative samples of U.S. students in 8th grade by the National Assessment of Educational Progress (NAEP). Country-by-country data come from the PISA tests, which are administered by the Organization for Economic Co-operation and Development (OECD). In 2012, OECD administered the PISA tests to representative samples of students at the age of 15 in 68 jurisdictions, including all 34 OECD countries. The analysis compares U.S. performance to those of students in the other OECD countries.
The proficiency and advanced standards used in this study follow those developed by NAEP. To equate proficiency and advanced performance rates across states and countries, we execute a crosswalk between the NAEP and PISA tests by identifying levels of performance on PISA that yield equivalent proportions of U.S. students that meet the NAEP proficiency and advanced standards (see Methodology sidebar).
To assess overall performance, they identify the percentage of students in the high school class of 2015 who are performing at proficient and advanced levels of achievement in math. (While not
Final Version 7.20.14
reported here, they also looked at reading and science, and the results are broadly similar to those for math.) They focus on how each state within the United States ranks relative to all 33 other OECD countries.
To ascertain whether the challenges facing the United States are concentrated among the educationally disadvantaged, we identify for each state and country the proficiency rate of students from families with parents of high, moderate, and low levels of education. If the problems are concentrated in ways that some would have us believe, U.S. students from families with high parental education should compare favorably with similarly situated students abroad. Such a finding would support the oft-repeated claim that the achievement challenges are limited to those who come from disadvantaged families (measured here by low levels of parental education).
How Well Do U.S. Schools Educate Different Students? According to NAEP, 35 percent of the members of the U.S. class of 2015 reach or exceed the proficiency level in math. Based on our calculations, this percentage places the United States at the 27th rank among the 34 OECD countries (see Figure 1). The percentage of students who are math proficient is nearly twice as large in Korea (65%), Japan (59%), and Switzerland (57%). Other countries with performances that clearly outrank the United States include Finland (52%), Canada (51%), Germany (50%), Australia (45%), France (42%), and the United Kingdom (41%). To see whether the low U.S. ranking in math is due mainly to social class factors separate and apart from the schools, we next identify proficiency ratings for students from families with differing amounts of parental education. Low parental education. Only 17 percent of these U.S. students are proficient in math (see Figure 2). This is half or less than the percentage of similarly situated students (those whose parents also have low levels of education) in Korea (46%), the Netherlands (37%), Germany (35%), and Japan (34%). Among OECD countries as a whole, the United States ranks 20th, placing it slightly ahead of Austria and France and just behind Denmark and the United Kingdom. In simplest terms, many other countries do a much better job of educating young people whose parents lack a high school diploma. Moderate parental education. The relative standing of the United States is even worse among students from moderately well-educated families. The math proficiency rate (26%) for this group is again around half the rate enjoyed by Switzerland (57%), Korea (56%), Germany (52%), and the Netherlands (50%). Other major countries that outperform the United States include Japan (48%), Canada (43%), Poland (43%), the United Kingdom (39%), and France (35%). When it comes to instructing the children of the moderately well educated, the United States comes in at the 30th rank among the 34 OECD countries, 10 ranks lower than was the case for students from families with low parental education. High parental education. The percentage proficient of 15-year-olds from families with high parental education is conventionally thought to be the exception to this bleak picture. Indeed, the proficiency rate of 43% is higher than the rate for families with low (17%) or moderate (26%) levels of education. But the relative standing of the United States vis-à-vis other OECD countries remains near the very bottom (see Figure 3), at the 28th rank. When viewed from a global perspective, U.S. schools seem to do as badly teaching those from better-educated families as they do teaching those from the less well educated. Countries with high proficiency rates among students from better-educated families include Korea
Final Version 7.20.14

(73%), Poland (71%), Japan (68%), Switzerland (65%), Germany (64%) and Canada (57%). Perhaps the only comfort the United States can take is that it is only 5 percentage points behind its mother country, the United Kingdom (48%). Across the OECD, there is a strong relationship between the math performance of students from families with high and with low educational backgrounds. Mexico and Chile are particularly weak at educating those from better-educated families, however. Conversely, Poland and Slovakia are particularly weak at educating students from families with less education, given the performance of those from families with high education. The relative performance of the U.S. education system is pretty much the same across social groups. It is weak at the bottom, no less weak at the middle, and just as weak with respect to educating the most-advantaged. As Secretary Duncan said, it is not a problem of some other person’s child. Ranking States The overall math proficiency rate of 15-year-olds varies widely among the states—from a high of 51 percent in Massachusetts to a low of 19 percent in Mississippi. Striking differences remain when one divides students according to parental education. For students from families with low parental education levels, Texas (28%) and New Jersey (25%) have the highest proficiency rates, well ahead of Massachusetts and Minnesota (both at 18%), putting them in 7th and 8th place among U.S. states for this category of students. Maryland and Illinois are at about the national average, while New York, in 27th place, falls slightly below. California (9%), West Virginia (6%), and Utah (5%) rank at embarrassingly low levels. (See the interactive map for a picture of the overall pattern throughout the 50 states.) Many people assume that students coming from families with high education levels are keeping up with their peers abroad. Indeed, in some parts of the United States that is in fact the case. More than 62 percent of students from Massachusetts families with high levels of parental education are proficient in math, placing that state just behind Germany (64%) and Switzerland (65%), two of the top-five OECD countries. Only a bit further back are Vermont, Minnesota, Colorado, New Jersey, and Montana, all of which have a proficiency rate of 58 percent or 59 percent for students from better-educated families. Internationally, that places these states in the same league as the Czech Republic (58%), Canada (57%), and Finland (56%), which are among the OECD top 13. But those six states are the highest-performing states in the Union. Other states rank much lower down the international list. In many places, students from highly educated families are performing well below the OECD average for similarly advantaged students. For example, Wisconsin, if ranked as a country on this measure, would come in 21st, just below Ireland. California is large enough to be an OECD country in its own right. If it were, its 43 percent proficiency rating would place it 30th, just below Italy, and New York’s 40 percent rating entitles it to assume position number 31, just below Turkey. Florida’s 38 percent rating gives it the 32nd position, just below Sweden, which has registered an abysmal performance given its level of economic development. Ranked near the bottom, Alabama, West Virginia, and Louisiana do worse than all OECD countries with the exception of Chile and Mexico. You will note in the chart below, Florida’s ranking among state-to other states and our state to other countries.
Final Version 7.20.14

Similar to the international comparisons, states that rank well for math education among students with high parental education tend also to rank highly for students from less-advantaged backgrounds. But some high-performing states, such as Massachusetts, Vermont, and Colorado, do relatively better with students from families with higher educational backgrounds than they do with their less-advantaged
Final Version 7.20.14

peers.
Advanced Performance in Math
The U.S. economic strength has been built in large part through its record of invention and innovation, things that themselves depend upon the country’s historic strength in science, technical, engineering, and math fields (STEM). The pool of people prepared to go into these fields in the future is dependent on students who have developed advanced skills in math and science in school.
Eight percent of the U.S. class of 2015 proved its merit by scoring at the advanced level on the NAEP in math. That could be regarded as a triumph were it not for the fact that it leaves the United States 28th on the OECD list. Other countries do a much better job at bringing students up to the advanced level of performance. The eight world leaders are Korea (30%), Japan (23%), Switzerland (20%), Belgium (19%), the Netherlands (18%), Germany (17%), Poland (16%), and Canada (16%). Disturbingly, our neighbor to the north turns out twice as high a percentage of students at the advanced level in math as the United States.
The percentage scoring at the advanced level is only 2 percent for U.S. students from families with low levels of educational attainment and only 4 percent for students from moderately educated families. Those disgraceful numbers could be offset by unusually high performances among the better-educated, however. Does the United States achieve a breakthrough at least among this group? Some may wish to take pride in the fact that 12 percent of the students from better-educated families reach the advanced level in math. But such pride is misplaced, as the feat still leaves the United States in the 28th position out of the 34 OECD countries. Only Sweden, Spain, Turkey, Greece, Chile, and Mexico do worse.
Advanced Performance by State:
The four states with 13 percent or more students performing at the advanced level in math are Massachusetts, New Jersey, Minnesota, and Vermont, with the Bay State taking honors with 15 percent of its students scoring at that level. All of these states rank alongside the top 13 OECD countries, and Massachusetts ranks 9th, just below Canada, though still well below Korea and Japan. With less than 7 percent of students performing at the advanced level, New York and California rank 31st, just ahead of Turkey and Greece. The two lowest-performing states, Alabama and Louisiana, however, do outrank the two lowest-performing OECD countries—Chile and Mexico.
The same states—Massachusetts, New Jersey, Minnesota, and Vermont—are top performers on this measure for students from families with high educational backgrounds; in all four plus Colorado, 18 percent or more of such students perform at the advanced level. That places them in the same league as Canada and France but well behind Korea, Poland, Japan, Switzerland, Belgium, and Germany. But only 15 percent perform at this level in Pennsylvania and 14 percent in Wisconsin, and less than 10 percent do so in New York, Michigan, and Florida. If states do well with students from better-educated family backgrounds, they tend to do well with those from less-educated ones. But there are clear exceptions to this pattern. West Virginia, Louisiana, and Mississippi score particularly badly on their capacity to teach students from more-educated backgrounds.
Conclusions:
Final Version 7.20.14
Lacking good information, it has been easy even for sophisticated Americans to be seduced by apologists who would have the public believe the problems are simply those of poor kids in central city schools. Our results point in quite the opposite direction. We find that the international rankings of the United States and the individual states are not much different for students from advantaged backgrounds than for those from disadvantaged ones. Although a higher proportion of U.S. students from better-educated families are proficient, that is equally true for similarly situated students in other countries. Compared to their counterparts abroad, however, U.S. students from advantaged homes lag severely behind.
As long as the focus remains on distinctions within the United States, then the comfortable can remain comforted by the distance between suburbia and the inner city. But once the focus shifts to countries abroad and fair, apples-to-apples comparisons are made, it becomes manifest that nearly all of our young people—from privileged and not-so-privileged backgrounds—are not faring well.
Some say that we must cure poverty before we can address the achievement problems in our schools. Others say that our schools are generally doing fine, except for the schools serving the poor. Bringing an international perspective correctly to bear on the issue dispels both thoughts.
The United States has two achievement gaps to be bridged—the one between the advantaged and the disadvantaged and the one between itself and its peers abroad. Neither goal need be sacrificed to attain the other”.
Eric A. Hanushek is senior fellow at the Hoover Institution of Stanford University. Paul E. Peterson is professor of government and director of the Program on Education Policy and Governance at Harvard University. Ludger Woessmann is professor of economics at the University of Munich and director of the IFO Center for the Economics of Education and Innovation. An unabridged version of this report is available at hks.harvard.edu/pepg/.
Stevenson’s Focus:
Stevenson has much to celebrate due to its accomplishments. To have 100% of its lowest 25% of students making learning gains in reading this past year is being attributed to the fidelity in which Professional Learning Teams are working closely together to better align standards and to what and how we teach. To understand the best and most relevant/current practices provides students and teachers alike with a “cutting edge/progressive mindset on learning, all of which makes our students college and career ready. This can only come with a highly focused “charge” that is targeted toward student/school improvement. It is with insight from the information above that Stevenson will continue to focus heavily on the delivery of instruction as well as lead to the availability of new instructional resources for teachers to use. Stevenson will also engage students in making them, as well as their parents, better aware of the opportunities for careers depending on STEAM education all of which will be incorporated into the established LDC Framework of modular development.
It has been said that when thinking about schooling in the 21 st Century, and it is everyone’s mission to learn as well as to effectively communicate, along with that how to think, and how to relate with others one’s thoughts and point of view. Mathematics concerns itself with quantifying and ordering things and applying reasoning skills. Understanding science means that one seeks knowledge about how the world around us and how it functions logically through what is actually observed. Math and science do not have an exclusive domain in how we think – for the arts has a role, and combined together play in indispensable part of what can be described as “critical thinking.” They equip us with the ability to interpret, evaluate, solve and verify. With new curriculum standards, it is Stevenson’s aim to find new ways in teaching curriculum, to have students fully apply their knowledge by developing products through their personal application of skills learned as well as to use computer technology as a means to transform the delivery of learning and instruction. New digital curriculum resources come in a variety of formats. Looking into a greater use of digital libraries that are filled with rich content is equally necessary. Exploring the idea of creating digital lessons, using e-books, on-line material, interactive software and apps are a part of schooling in the 21 st Century. As teachers
Final Version 7.20.14

familiarize themselves fully with the Literacy Design Framework for the creation and development of modules of study, time will be spend by staff to also fully explore the integration of science, mathematics, engineering and technology which will blend the curriculum further so that students capacity to think increases through reading and writing, speaking and listening (all of which represents the new curriculum standards – The Florida Standards/Next Generation Standards in Science and Social Studies, Art and Music, as well as the States newly adopted Florida Standards).
With staff development comes parent development as well. Our parents will need to be educated about the needs of what students must have in order to be college and career ready. During School Advisory Meetings and Parent Liaison Meetings, at Open House and during future parent training meetings, every possible opportunity will be taken to help assist parents in understanding not only LDC curriculum development but also what STEM/STEAM is about and how Stevenson is embarking on new “ground” in a way to further enhance the need for children to be college and career ready.
Side Note: Stevenson will explore the following website about STEM certification to see if this may apply to our staff in the future.
http://www.stemschool.com/articles/getting-your-school-stem-certified-project-lead-the-way/
CONTENT AREA:
Reading Math Writing Science Parental Involvement
Drop-out Prevention Programs
Language Arts
Social Studies
Arts/PE Other:
School Based Objective: (Action statement: What will we do to improve programmatic and/or instructional effectiveness?)
Teachers will work collaboratively to develop and implement cohesive learning modules using the Literacy Design Curriculum Framework where through the use of backward design by taking into consideration the product and writing pieces that students will produce will be addressed. It will start with the essential questions (template task) that is aligned to the standards based instruction that well scaffold mini-lesson that build from simple ideas to complex thoughts about a given content/topic area. Students will demonstrate their thinking by defending, justifying, referencing, distinguishing varied viewpoints of others to eventually form arguments about a topic through varied readings. By building quality relationships with students, better active engagement will occur thereby addressing students’ attentiveness to their own learning and motivation in order for them to be successful.
Strategies: (Small number of action oriented staff performance objectives)
Barrier Action Steps Person Responsible
Timetable Budget In-ProcessMeasure
1.Ignite/ initiate
1. Define motivation
Principal, Assist. Principal,
September 30th $0.00 Meeting Agenda
Final Version 7.20.14

student learning
2. Conduct teacher/parent meetings
Teachers, Parents
2. Observe engaging classrooms where students apply knowledge
1. Hold instructional rounds with teachers and administration2. Conduct Classroom Walk-throughs3. Observe teachers both formally and informally
Principal, Assist. Principal, Teachers
Year-long $3000.00 from SAC funds
Devise a schedule for instructional rounds, calendar of events, hold discussions, create a survey questionnaire for observations
3. Show/Use a “look for” instrument of what active engagement looks like for teacher to understand
Develop and use the instrument with teachers and administrators
Administration and teachers
First three Quarters
$0.00 Collect instrument used
4. Disaggregate data by reviewing percentage of students passing
1. Review the numbers of those passing and not2. Conduct an item by item analysis of tested items 3. Review the new tools: Launch Pad, Blackboard, ProGoe, and Performance Matters
Principal, Assist. Principal, Teachersby grade level
Quarterly $0.00 Spreadsheet and agenda Item from varied meetings
4. Implement the Self- Reflection Card
1. Survey teachers about LDC and survey students through a student/self-reflection on motivational drive to school work
Principal, Assistant Principal, Teachers, Students
Quarterly $0.00 Reflection Survey
5. Improve motivation of all students
Through varied instruments evidenced at Student/Parent Led Conferences
Students, Parents and facilitated by teachers
Twice yearly $0.00 Surveys
6. Increase student
1. Implement the “Himmile
Teachers Daily $0.00 Observed in classroom walk-
Final Version 7.20.14

participation level in class every day(Awareness of the learning cycles from B.E.S.T. and their direct purpose.
Bounce Cards” throughs
7. Develop a participation rubric to be incorporated in every LDC Module to increase student motivation and awareness for self-directed learning
1. Study rubrics as part of the LDC framework for modulesPreparation in vetting modules; looking at end results and cohesion of lessons
Administration and Teachers
1st Quarter $0.00 Module of Study Unit Designs
8. Increase the level of response to intervention in more timely manner
1. Review and adopt the 7 RTI process strategies
Administration and Teachers
August, 2014 $0.00 Agenda item from grade level team meetings,Response to intervention implementation strategies and teachers schedules
9. Increase students view of their own self-efficacy
Develop a school-wide RTI plan to champion student success
Administration All School Year $0.00 Show TED about building relationship and incorporate meeting time with teacher schedules.
10. Develop/implement 3 module units ready to submit for vetting through LDC
1. Create 3 units of study to cover material for 8 weeks with a student summative assessment in writing
Teachers and administration
Quarterly $0.00 Evidence in classroom observations, walk-throughs, and printed module designs
11. Increase the writing experience in preparation for writing to reading
Develop a “mock writes” experience for all grade levels by building it into the schedule
Created by Administration and implemented by teachers
Monthly $0.00 Evidence the mock writes products at all grade level
Final Version 7.20.14

12. Explore the incorporation of STEAM in LDC module development
1. Examine/implement the possibility and feasibility of future STEAM classrooms/lessons through Media Class and GSP
Principal and select Teachers
1st Quarter Unknown at this time
School Visitation
13. Develop exposure to career choices
Plan a STEAM Career Day
Teachers, Guidance committee,Parents and Community
3rd quarter $0.00 Newsletter, sign-in sheet of all volunteer presenters
14. Meet with district expert, Mr. Dennis Sobolski, STEM Resource Teacher
1. Discuss STEAM and the potential launching of it for the last quarter, visiting schools with him as prescribed by him (Live Research)
Principal, Asst. Principal, and select Teachers
1st, 2nd, 3rd and 4th Quarter
Substitutes will be used to observe other teachers in STEM classrooms.
Agenda and minute of meetings, observations reflections, School Visits, Student DemonstrationsParent invites to school demo nights
15. Narrow the gap of parental understand-ing about FL Standards, LDC and STEAM
Train parents about school curriculum initiatives that will serve their children for schooling and career readiness in the 21st century
Principal, Assistant Principal, Teachers
1st Quarter2nd Quarter, 3rd
and 4th Quarter
$0.00 SAC Meetings and Parent Liaison Meetings
16. Further the understanding of Teachers in curriculum Design
Form a Principal’s Book Club:
Wiggins or Learning in the Fast Lane by Rollins
Principal, Teachers
1st, 2nd, 3rd
Quarter$400.00 SAC Funds
17. Train parents about the LDC curriculum work and STEAMAnd PineView Elemtary Staff
Hold meetings for parents so that they may learn more about today’s meaning of what college and career readiness is
Administration and teachers
1st and 2nd
Quarter$0.00 Agenda and
minutes to meetings, Newsletters
18. Present articles
Read articles pertinent to the
Principal and Asst. Principal
Year-long at greade level
$0.00 Meetings, articles,
Final Version 7.20.14
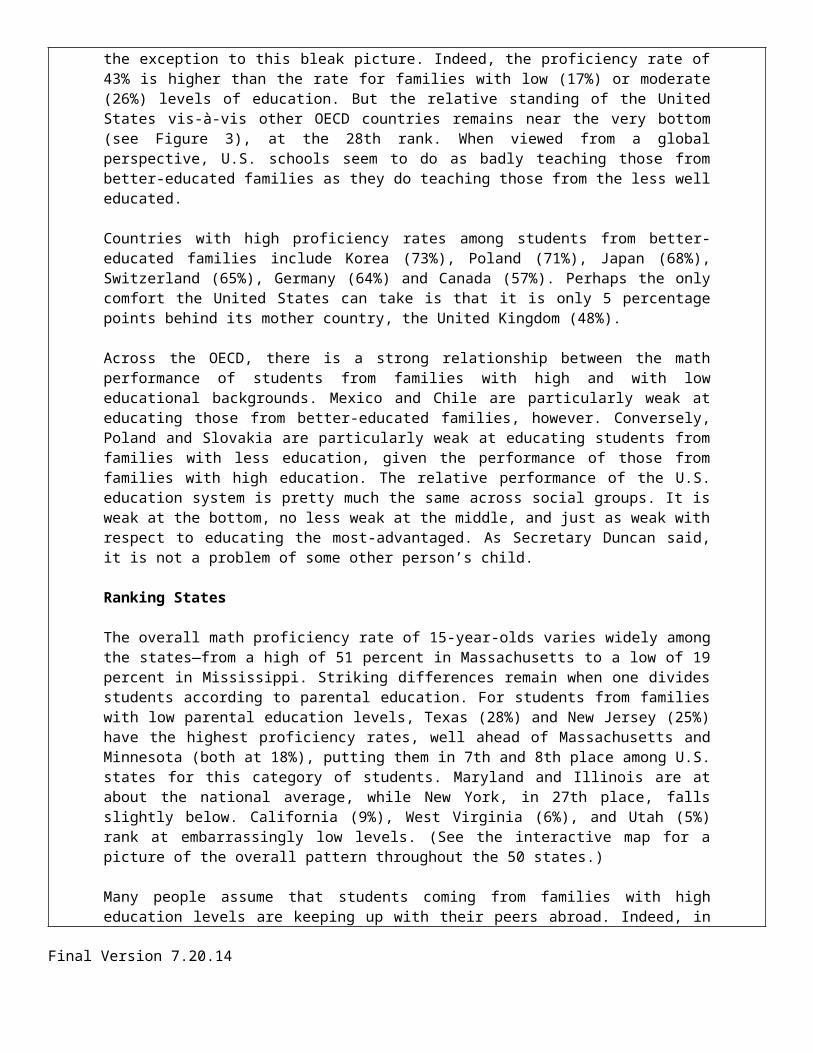
about STEM/STEAM
subject on STEM and motivating students classrooms and lesson design, technology needs
Teacher Leaders team meetings and vertical team meetingsHeld on Monday, Tuesday or Thursdays
classroom visits
EVALUATION – Outcome Measures and Reflection- begin with the end in mind .
Qualitative and Quantitative Professional Practice Outcomes: (Measures the level of implementation of professional practices throughout the school) Where do you want your teachers to be? What tools will you use to measure the implementation of your strategies? How will you measure the change in adult behavior? What tool will be used to measure progress throughout the year? Use real percentages and numbers.
Quantitative - Through Benchmarks, cumulative tests, and FS Assessments, Stevenson will work hard to maintain the top 5% ranking of all schools in Florida with the intent to increase it. Currently, Stevenson is ranking in 3rd spot in the state.Quantitative – Decrease the percentage of the lower 25% of students scoring level 1, 2, 3, by 5% on the new standardized FSA and to increase the percentage of students scoring 4s and 5s in reading, math, science and the new writing assessment.
Because Stevenson is scoring Stevenson would like to see an increase in its reading proficiency rate from its current 84% by increasing it to 88%. In mathematics it currently has a proficiency rate of 88% and to see an increase to 91% will be an enormous stretch. Our students made learning gains in math up from the year before to 84% and to see an increase by 3% would be our stretch goal in math. In Science, 94% scored at proficiency. To see our proficiency rate increase by 3% would bring continued favorable results.
Quantitative – Develop mock-writes reading and writing prompts that will be scored, rated against the school/grade level norm and evaluated for effectiveness in preparation for standardized testing. A baseline will be created after our first “mock writes” is given in order to determine how students are responding to high level questions in writing after reading an array of text. (TBA)
Qualititative - Two district surveys; one the Client Survey and the other the Student Survey as well as a survey about our overall program including Student/Parent Led Conferences will be tabulated to give us indication about our program from the stakeholder’s point of view. Stevenson is confident in defining academic rigor, curriculum development, implementation of backward design through LDC and that standards based instruction will bring further success to our students. It is through continued staff development evidence by House Meetings (Vertical Teaming) and Grade Level Team meetings that training occurs as well as disaggregating different data points throughout the school year. We continue to stress what the “big people are doing” by seeing if we walk the walk and talk the talk while walking!” Qualitative – Grade Level Team MeetingsQualitative – Vertical Team Meetings – HOUSESQualitative – Professional Development Training Days and Early Release Days
Final Version 7.20.14

Qualitative – A student survey that reflects students thoughts about LDC modules will be conductedQualitative/Quantitative – To increase parental awareness of Literacy Design Collaborative and STEAM in the form of school-wide presentations will be conducted.
Qualitative and Quantitative Student Achievement Expectations: (Measures student achievement)Where do you want your students to be? What will student achievement look like at the end of the school year 2014-15? What tool will be used to measure progress throughout the year?
Stevenson students need to be able to justify an answer through the use of their own reasoning skills by articulating both verbally and in writing using formal language to express themselves. The new FSA assessment results where students are asked to read varied text and respond to information from them by succinctly writing answers that apply their reasoning skills and by justifying through referencing text, understanding and applying vocabulary will be incorporated into their language acquisition.
Stevenson is in the process of developing “mock reading and writes days” where students will fully implement their skills as a form of formal practice on varied days of the week in order that they are prepared for like questions and possible readings found on standardized tests. These mock reads and writes will be reviewed at team meetings to discern trends and patterns of reading and writing that cause students difficulty. From the team’s diagnosis, the information will be used to reteach skills that have been defined as “difficult” for students at that time. To assess students on a formative level earlier than later will help to address misunderstanding of content and writing structures well before formal assessments are administered.
Students will through Himmel’s bounce card be prompted about remaining highly focused and engaged actively in their own learning. Students will be asked to self-reflect through an array of questions (reflection survey) that will be shared at Student/Parent Led Conference time. To hold students accountable for learning by asking them to cognitively analyze and reflect their behavior associated with their output (actions), it is anticipated that they will increase the own level of learning and understand better why they have the result they have. It is anticipated that there will be an increase in test scores.
Plan Career Day where STEAM experts present career choices to students.
Part 2: Support Systems for Student Achievement (Federal, State, District Mandates)
For the following areas, please write a brief narrative that includes the data for the year 2014-2015 and a description of changes you intend to incorporate to improve the data for the year 2014-2015. Instructions and support are provided in each section to assist with what data you may include. The instructions are intended to be a guide and may be deleted from each cell to allow for appropriate typing space.
Final Version 7.20.14

MULTI-TIERED SYSTEM OF SUPPORTS (MTSS)/RtI This section meets the requirements of Sections 1114(b)(1)(B)(i)-(iv) and 1115(c)(1)(A)-(C), P.L. 107-110, NCLB, codified at 20 U.S.C. § 6314(b) and Senate Bill 850.a) Describe the process through which school leadership identifies and aligns all available resources (e.g., personnel,
instructional, curricular) in order to meet the needs of all students and maximize desired student outcomes. Include the methodology for coordinating and supplementing federal, state and local funds, services and programs.
b) Describe your school’s data-based problem-solving processes for the implementation and monitoring of your MTSS and SIP structures to address effectiveness of core instruction, teacher support systems, and small group and individual student needs.
c) Provide the person(s) responsible, frequency of meetings, and any problem-solving activities used to determine how to apply resources for the highest impact
d) Describe the systems in place that the leadership team uses to monitor the fidelity of the school’s MTSS.e) Describe the plan to support understanding of MTSS and build capacity in data-based problem solving for staff and parents.
(See Accountability and Testing website/SIPTOOLS/MTSS for a checklist that may help you with this section.)
The system currently in place at Stevenson, "Performance Matters” is a repository for collecting data from a variety of sources - FCAT, FAIR, and Florida Assessment. It uniquely may cluster data in a way to analyze it in a variety of ways.For instruction in Reading, District required assessments, RTI interventions, parent conferences, and anecdotal notes. All of these allow the school to quickly and easily disaggregate data in a variety of ways.
Year-to-year comparisons for individuals, or groups of students; and subject area trends is easily and readily available to both teachers and administrators at any time. Detailed information in the form of graphs, scale scores, and developmental learning gains are available. Comparisons may be made from grade to grade, teacher-to-teacher and across the disciplines. Using the DuFours training that was provided in July, 2010 was invaluable because it demonstrated a more in depth analysis of how the numbers (individual student results) may assist teachers in learning more about which students made actual gains strand-by-strand in a given subject rather than just an overall score in the subject. This information is highly useful in determining if there is a consistency taking place in a teacher's delivery model as well. If several students show a lack of mastery in a given area, further investigation as to why this occurred will be witnessed as a result of this kind of analysis. Teachers have been trained to effectively assess students using the principles of Robert Marzano by having them effectively use B.E.S.T. practices that provide students with quality formative assessment strategies that will glean deeper learning of varied content as it is being learned/taught. The RTI moves from Tier 1, Tier 2 or Tier 3 in a progressive manner that narrows the focus so that greater intensive instruction is offered. Strategies are specific to the student's individual needs. Stevenson has also adopted a homework policy that is as differentiated as the delivery of instruction. Stevenson does not necessarily subscribe to a one-size fits all philosophy. Teachers take into account each child’s innate abilities (modalities of learning), as well as motivational factors. Individualized plans center on "big picture ideas" while focusing in individual student differences and needs. Teachers have been made well aware of "Blooms Taxonomy" and the importance of what type of questions are asked ranging from low to high level complexity.
Describe the plan to train staff on RtI/MTSS:Stevenson has been training the entire staff about RTI/MTSS over three years. It remains committed still in helping teachers to develop better responses to intervention so that students benefit from quality instruction that is specific to the individual's needs. Teachers also learn how to present information to parents about RTI as it relates to the individual problem solving team (IPST) process. Between whole-group faculty meetings, and specific grade level team meetings, an array of questions are encouraged so that teachers and administrators learn how to tackle the concerns that center on student performance.Our school counselor, administration, the IPST and Leadership team avail themselves to and teacher who is interested in gaining more experience, their insight, and expertise in how to identify the best intervention so that students respond well thereby bringing optimal learning. Administrators review every RTI plan on every student. At progression planning meetings, these plans are reviewed (December and May) to see if they are making a positive difference.Plans are routinely shared by administration with the exclusion of the student's name so that teachers may learn how well written plans impact student performance. Such plans as well as looking at new data and comparing it to old data
Final Version 7.20.14

helps to determine if particular strategies are better suited than others.
PARENT AND FAMILY INVOLVEMENT: (Parent Survey Data must be referenced) Title I Schools may use the Parent Involvement Plan to meet the requirements of Sections 1114(b)(1)(F) and 1115(c)(1)(G), P.L. 107-110, NCLB, codified at 20 U.S.C. § 6314(b). Consider the level of family and community involvement at your school (this may include, but is not limited to, number of parent engagement opportunities offered in the school year; average number of parents in attendance at parent engagement opportunities; percent of parents who participated in parent engagement opportunities; percent of students in lowest performing quartile or subgroups not meeting AMOs whose parent(s) participated in one or more parent engagement opportunities).
Annually, Stevenson’s client survey indicates that there are many positive actions occurring that are of great benefit to our families. The results indicate the following: Excellent Good FairParents view the staff as very helpful- 75% 22% 3%Parent view the staff as friendly- 70% 23% 5%A Responsive Principal- 64% 28% 7%A Responsive Assistant Principal- 82% 16% 2%Responsive Teachers- 80% 19% 2%Office Personnel- 72% 21% 5%Child Care- 73% 22% 4%Parents rated information on the report card as- 81% 17% 2%Classroom instruction is rated- 72% 25% 3%Technology satisfaction- 52% 45% 4%Clean School Environment- 60% 36% 4%Quality I.E.P. program/plan- 74% 28% 2%Overall School Satisfaction- 80% 18% 2%
High level of academic focus – 95% of parents stated yes to the questionAre academic events at school useful to attend – 97% of parents answered yes to the questionHomework issued is helpful – 47% answered excellent and 42% rated it goodStudy skills helpful – 49% answered yesSchool Clubs – 52% answered yesKnowledge about Common Core Standards – 36% answered they are knowledgeableParents feel very well informed- 59% answered yes to the question
An area of focus this school year will be to increase the level of awareness for parents by 90% about the new Florida Standards/Common Core Standards and how Literacy Design Collaborative Curriculum Framework and STEAM will dovetail nicely to help prepare students for 21st Century College and Career Readiness.
STUDENT SURVEY RESULTS (Required):Address Elements of Student Survey Results found in the District Strategic Plan and describe how you will improve student perceptions of these indicators.
Strategic Plan Indicators: Promotes 21st Century Skills 1.4.2, 1.4.3, 1.4.4, 1.4.5 Safe Learning Environment 2.2.2, 2.2.3, 2.2.4, 2.2.5
Elementary Student Survey: 21st Century Skills – Refer results pages 3 – 4 Online Safety – Refer results pages 4 - 6 School Safety – Refer results pages 6 - 7
Secondary Student Survey: 21st Century Skills – Refer results pages 4 - 6 Online Safety – Refer results pages 6 - 7 School Safety – Refer results pages 7 – 8
Stevenson students survey results are as follows:
Final Version 7.20.14
75% stated - I want to succeed 25% stated – I do not worry about mistakes 56% stated – Being right is important to me 72% stated – They are comfortable with who they are 55% stated – They liked working with others to solve problems 56% stated – They liked to participate in the teaching and learning process 52% stated – They liked project demonstrations followed by discussion 66% stated – They understand that reliable information comes from many sources 21% stated – They believe that reliable information must look good *Students do not believe that they are involved in a lot of project-based learning in all subjects to include Reading, Mathematics, Science, Social Studies, Reading and Writing (interestingly – no arts were included!) How well am I learning 21st Century Skills: Teamwork – 80% very good Speaking and Listening - 76% very good Critical Thinking – 74% very good Use of Technology Presentations – 80% very good Real world issues – 62% have Conduct research – 74% do Learn online safety from parents – 12% From friends – 4.5% Never heard of it – 85% Received hurtful email – 15% Mean comment passed online – 17% Friended someone on line not knowing the person – 21% Feeling they have been cyber bullied – 90% Feeling threatened by students at school – 8% Involved in spreading rumors – 17% Involved in physical fight at school – 2%
Next steps: Through the classroom teacher and media specialist, students need to be involved in conversations that will help them to better understand the need to be safe when on line. The yellow highlights above indicate three areas of concern: Never heard of internet safety, friending people they do not know, and feeling as if they were cyber bullied.
Other comments: Need for a better school lunch program More recess time to play More technology availability Rid the field of the bugs and ants
LDC modules will continue to address student’s active engagement in 21st Century skills and technology us to solve and present possible solutions through active research conducted “live” and on line. Student survey results indicate that we are well on our way toward involving students in their learning through the use of technology, but more is needed. To earmark more funding to better equip our classrooms remains a priority goal.
Final Version 7.20.14

Early Warning Systems (SB 850)1. Describe the school’s early warning system and provide a list of the early warning indicators used in the system. This list must include the following:
ELEMENTARY Attendance below 90 percent, regardless of whether absence is excused or a result of out-of-school
suspension One or more suspensions, whether in school or out of school Course failure in English Language Arts or mathematics Level 1 score on the statewide, standardized assessments in English Language Arts or mathematics Students who are not proficient in reading by third gradeSECONDARY
Attendance below 90 percent, regardless of whether absence is excused or a result of out-of-school suspension
One or more suspensions, whether in school or out of school Course failure in English Language Arts or mathematics Level 1 score on the statewide, standardized assessments in English Language Arts or mathematics
2. Provide the following data related to the school’s early warning system: The number of students by grade level that exhibit each early warning indicator listed above The number of students identified by the system as exhibiting two or more early warning
indicatorsFill in BLANKS with Number of Students
Grade Level K 1 2 3 4 5 6 7 8 9 10 11 12 Total
Attendance <90
8 14 5 10 12 9
1 or more ISS or OSS
0 0 0 0 0 0 0
Level 1 in Reading or Math
0 0 0 0 0 0 0
Course Failure in ELA or Math
0 0 0 0 0 0 0
Students exhibiting 2 or more indicators
0 0 0 0 0 0 0
3. Describe all intervention strategies employed by the school to improve the academic performance of students identified by the early warning system (i.e., those exhibiting two or more early warning indicators).
For 14 years, Stevenson has had an attendance rating of 95% or higher (generally ranging near the 97% mark. The records clerk manages a wide range of student data. She is the person that is in communication with parents when a child is absent from school. After three consecutive days, a family is communicated with to find out why the child is absent from school and when they will likely return to school. Parents are required to write a note expressing the absenteeism each time a child is absent which is placed in the cumulative file. Upon five days out of school, administration informs the parent about School Board Policy through the form of a letter home. Parent and administration inform parents during orientation meetings about The Stevenson Attendance Policy, “Perfect Attendance Recognition Awards” and illness and how that is handled.
Final Version 7.20.14

Stevenson has not traditionally had attendance issues with students not coming to school. Daily attendance is monitored by the teacher first, and then followed up by the records clerk Notes are expected from all parents and phone calls are made to parents from the records clerk to inquire
about the absentee Upon the fifth day out of school during any semester, a letter is written to the parent reminding them of the
Board Policy on Attendance The letter includes the loss of instructional time and missed learning experiences that cannot be replicated If a student is out more than 9 days per semester a second letter is written to parents expressing grave
concern about failing the school year due to excessive absenteeismWhile our report does not show level 1 students being of concern, this report does evidence that some students will be more closely monitored due to absenteeism and the impact on their grades.
CTE/STEM:1. All Levels
a) # of STEM-related experiences provided for students (e.g. robotics competitions; field trips; science fairs)b) Participation in STEM-related experiences provided for students
Science Fair will be held at Stevenson in February with participation in the North Area Fair in March (last year Stevenson one 13 Award at the Area Fair with 2 best of Shows and 2 awards that carried a stipend with them for students.
Stevenson placed 8th in the OM World Competition last year, will be involved in STEM classes offered through the Media teacher and GSP classroom all year long.
Stevenson has a robotics team that meets after school and participate in local team challenges and competitions.
Stevenson Elementary School Michael Corneau October 8, 2014
_________________ _________________________ __________
School Name Principal’s Signature Date
Final Version 7.20.14