accountabilityandtesting.brevardschools.orgaccountabilityandtesting.brevardschools.org/school...
TRANSCRIPT
Brevard Public SchoolsSchool Improvement Plan
2015 – 2016
Name of School: Area:
Principal: Area Superintendent:
SAC Chairperson:
Superintendent: Dr. Desmond Blackburn
Mission Statement:
To inspire and empower lifelong learning.
Vision Statement:
A model community of excellence and success.
Stakeholder Involvement in School Improvement Planning: Briefly explain how stakeholders are involved in the development, review, and communication of the SIP.
Parent, student, teacher, and EDI survey results are shared with the staff, parents, and School Advisory Council; all who are able to provide input for the school based goal, strategies, barriers, action steps, and evaluation. End of year student assessment data and behavior data is also shared with all stakeholders. These group members collaborate and discuss positive things happening in the school, and areas for improvement. The data drives the SIP goal(s). Once the goal(s) are established, a team works collaboratively on the School Improvement Plan (SIP). Each grade level provides input and areas to improve/change during grade level meetings. Parents are introduced to the SIP draft at Open House and are encouraged to provide input on a survey. The SAC members are given a copy of the draft for review and provide input. According to the responses, changes are made to the SIP by the SIP writing team that consists of administration and the
1 | P a g e
Cambridge Elementary Magnet School Central
Dr. Wendy Smith Jane Cline
Lisa Derr

leadership team. The newsletter and Edline page will communicate the SIP goals to the parents and community members. The SIP is monitored and reviewed twice per year by the SAC and the staff. School-wide data are made available at that time for progress monitoring purposes. Adjustments to the SIP are made if necessary.
Brevard Public SchoolsSchool Improvement Plan
2015-2016
Part 1: Planning for Student Achievement
RATIONALE – Continuous Improvement Cycle Process
Data Analysis from multiple data sources:What are the areas of successful professional practices and what data shows evidence of improvements? What are the concerns with professional practices and how are they revealed with data?
Areas of successful professional practices and what data shows evidence of improvementsQuantitative and Qualitative data sources support the School Improvement Plan (SIP) school wide objective for teachers to understand, plan, and implement standards based instruction in all content areas to increase student achievement. Classroom walk through data show that teachers were not consistently planning and teaching to the depth, or full intent of the standards. Feedback data in ProGOE support lesson plans and instruction observations indicated that some teachers were still planning lessons based on activities or the textbook rather than planning lessons based on the standards. Student engagement can be improved by teachers planning lessons to include students collaborating, writing, and producing evidence of mastery rather than the teacher being in control of the entire lesson. However, teacher lesson plans do show that essential questions are being used to consistently frame instruction.
Essential questions are posted in the classrooms, however referring students back to the essential question can be improved. Authentic learning center activities that support the standards can be improved to include more of a focus on the standards for independent activities. Two grade levels were beginning to create common assessments and use the data to drive future instruction. More training on common assessments and using the Unify program will enable teachers to research questions from a bank of test questions in order to create common assessments based on the standards. Prioritizing standards and using the Understanding by Design (UbD) model will be used to create lesson designs for the 2015 – 2016 school year.
Results of the EDI survey showed that teachers value the peer culture and professional development at Cambridge Elementary. Eighty percent of responders reported Cambridge is a good place to teach and learn. Instructional planning was a concern for teachers, scoring 7.7 with -0.7 top-quartile comparison as reported by EDI results.
The SIP will focus on meeting with small groups of teachers during Early Release Wednesdays to promote collaboration and cooperation from Title One Teachers and administration while planning for instruction. Each Wednesday will focus on one group: K – 1st, 2nd – 3rd, and 4th – 6th. This should help improve the 50% of responders who stated the school has dedicated time for teachers to analyze interim assessments and to re-teach content based on student performance, 51% who reported the Common Core will help prepare students for college and career, and the 63% who stated the training received on the Common Core will help improve teaching practice.
Concerns with professional practices and how are they revealed with data?
2 | P a g e

Pre-survey results of the 29 classroom teachers who were employed as teachers at Cambridge in the 2014 – 2015 school year revealed that 27% planned lessons or units beginning with the end goal or an assessment task all the time, while 55% planned some lessons with the end in mind, and 14% planned several lessons with the end in mind.
78% of responding teachers reported their grade level teaches the same standard at the same time while 21% reported somewhat teaching the same standard. Eighty-nine percent of teachers responded the grade level teams used common formative assessments, other than the district assessments while 10% responded no common formative assessments were used. Only 34% of teachers responded being an expert on understanding the full intent of the grade level standards, while 52% followed the pacing guide and teacher editions to guide standard-based instruction.
Fourteen percent of teachers responded a need for more time and training in order to develop a better understanding of the depth of the standards. When responding to priority standards, 48% of teachers were confident in knowing which standards were priority while 42% responded knowing somewhat of the priority standards, and 10% were not aware of the priority standards. Teachers reported that they were unaware of Understanding by Design (28%), while 55% were somewhat familiar with Understanding by Design, and only 17% were familiar with Understanding by Design.
Cambridge Elementary Magnet School’s Demographics:
African America: 35.86%White: 30.81%Hispanic: 23.54%Multi-racial: 9.32%Asian: 0.47% Behavioral data:
Referral percentages from student population by race:
ESE:25.56%
Hispanic: 4.32%
African American: 63.53%
White: 18.61%
Multi-racial: 13.53%
In-school suspension percentages from student population by race:
ESE: 26.5%
Hispanic:5.13%
African American: 67.52%
White: 17.09%
Multi-racial: 10.26%
3 | P a g e

Out-of-school suspension percentages from student population by race:
ESE: 22.58%
Hispanic: 6.45%
African American: 64.52%
White: 12.9%
Multi-racial: 16.13%
What are the areas of successful student achievements and what data shows evidence of improvements?
BELAA: Reading Proficiency
Grade Level: October (AP1) Jan/ Feb (AP2) Percentage Gain
First 71% 74% 3%
Second 56% 61% 5%
Third 55% 58% 3%
Fourth 52% 63% 11%
Fifth 66% 71% 5%
Sixth 76% 76% 0%
The 2014 – 2015 Brevard English Language Arts Assessment (BELAA) results showed that grades first through fifth increased their reading proficiency from AP1 to AP2 by an average of 5.4%. Although sixth grade did not show a percentage gain from AP1 to AP2, the proficiency rate that scored above the district average was maintained.
SuccessMaker Reading Results 2014-2015:
4 | P a g e

Cambridge Elementary defines school wide proficiency in Success Maker as 70% or higher. The following grade levels scored above proficiency:
Grade Level:
Initial Placement: End of Year Placement: Percentage of Adequate Progress:
First 1.05 2.27 83.96%
Third 2.77 3.77 87.34%
Fourth 3.74 4.71 89.55%
Fifth 5.05 6.11 82.28%
2014 – 2015 SuccessMaker reading results show that first grade, third grade, fourth grade, and fifth grade students exceeded the established 70% schoolwide goal. Kindergarten, second grade, and sixth grade did not meet the schoolwide goal of 70% (see chart below).
SuccessMaker Math Results 2014-2015:
Cambridge Elementary defines school wide proficiency in Success Maker as 70% or higher. The following grade levels scored above proficiency:
GradeLevel:
InitialPlacement:
End of Year Placement: Percentage of Adequate Progress:
Kindergarten 0.52 0.74 70.27%
First 1.12 1.98 94.34%
Second 2.37 3.25 87.8%
Third 3.28 3.81 93.67%
Fourth 4.11 4.68 100%
Fifth 4.73 5.39 100%
Sixth 5.73 6.18 98.48%
All grade levels met or exceeded the schoolwide goal of 70% on Success Maker math.
FAIR:
5 | P a g e

Grade Level: AP1 AP3Third 11% 33%Fourth 8% 23%Fifth 24% 38%Sixth 10% 19%
Third through sixth grade students demonstrated growth in their Probability of Literacy Success (PLS) from AP1 to AP3. An average growth of 15% was present among grade levels.
What are the concerns with student achievements and how are they revealed to the data?
BELAA: Reading Proficiency
Based on 2014-2015 school data our concerns are as follows:
Grade Level: October (AP1) Jan/Feb (AP2) End of Year
D C D C D C
First 79% 71% 80% 74% 70% 67%
Second 64% 56% 69% 61% 68% 65%
Third 65% 55% 68% 58%
Fourth 61% 52% 65% 63%
Fifth 67% 66% 67% 71%
Sixth 64% 76% 63% 76%
D= District Average (%)C= Cambridge Average (%)
Though sixth grade students scored above district averages, they did not make any progress from AP1 to AP2. The 2015 – 2016 goal of standards based instruction will ensure that instruction is rigorous and standards driven. This will help teachers align instruction based on prioritized standards, thus improving student achievement.
FAIR:
Grade Level: AP1 AP36 | P a g e

PLS PLSD C D C
Third 34% 11% 56% 33%
Fourth 32% 8% 42% 23%
Fifth 36% 24% 48% 38%
Sixth 33% 10% 42% 19%
D= District Average (%)C= Cambridge Average (%)PLS= Probability of Literacy Success
According to the FAIR data above, grades third through sixth scored significantly below district averages on AP1 and AP3. Throughout the 2015 – 2016 school year, teachers will monitor FAIR data to determine areas of concern and use standards based instruction to differentiate instructional strategies needed to increase proficiency in targeted subskills.
Success Maker Reading Results 2014-2015:
Cambridge Elementary defines school wide proficiency in Success Maker as 70% or higher. The following grade levels scored below proficiency:
Grade Level:
Initial Placement:
End of Year Placement: Percentage of Adequate Progress:
Kindergarten 0.13 0.34 64%Second 2.15 3.56 46.34%Sixth 5.96 6.67 63.64%
According to the 2014-2015 SuccessMaker Reading data kindergarten, second grade, and sixth grade performed below the proficiency average of 70%. First grade, third grade, fourth grade, and fifth grade students were not a concern because they scored significantly above the targeted proficiency rate. Concerns will be addressed by utilizing the students’ individualized weekly SuccessMaker reports. Teachers will use the data to guide small group instruction so that students’ individual needs are being met.
Concluding Analysis: Based on the 2014 – 2015 data from multiple sources, students are not adept in showing proficiency with the ELA Florida Standards. Therefore, the 2015 – 2016 focus of teachers at Cambridge Elementary School will be to increase their knowledge of the standards in order to prioritize grade level ELA standards, create lessons with the end in mind based on the depth and rigor of the standards, and deliver lessons that will expose students to the grade level standards that will all help increase student achievement.
What other areas of strength or opportunity that are revealed in data from leading indicators?
The Early Release Wednesday time will also allow administrators to meet with smaller groups of teachers to improve the 51% who reported leaders at my school seek out feedback from teachers. Surveys from teachers at the end of the year revealed that teachers were not comfortable with the current MTSS process and could benefit from a better understanding of the process to help meet their students’ needs. With 16 new teachers and a new principal, and 19 teachers in years 0 – 2, one focus will be to elicit help from the district MTSS trainer, and meet as a leadership team to develop goals and a plan to teach the MTSS process to the staff.
7 | P a g e

Attendance data: Annual Attendance Rate was 95.16%. Classrooms are awarded Cougar Paws for everyone being in attendance and dressed in uniform, as part of the Positive Behavior Support (PBS) system.
Analysis of Current Practices:
Describe action steps that have become non-negotiable, things that you will continue doing. The action steps in the 2012 – 2013, 2013 – 2014, and 2014 – 2015 SIPs will be maintained, due to these being research-based and supported teaching practices. While we will adapt the focus of our on-site staff development to include prioritizing standards and using the Understanding by Design model, we will continue the following practices because they produced positive results:
Teachers will use Differentiated Instruction (DI): process, product, procedure based on student need/data – Training will be offered at ESF for new teachers to learn differentiated skills and strategies. Staff members previously trained on DI strategies will mentor new teachers who may have not been trained as of yet. Cambridge has a DI trainer as a member of the Title I team who will be providing training, modeling, and support of DI strategies.
Every teacher will continue to create and post essential questions (EQs) to frame teaching and learning tasks designed to create critical thinking
Students will engage in writing across the disciplines to summarize, clarify, justify, explain, list, give examples, etc.
Using progress monitoring/goal setting tools (data notebooks and charts, use of the Baseball Card in Unify) teachers will provide meaningful feedback and guidance to students
Utilize activity wheel teachers as our Special Help in Everyday Learning Development Team (S.H.I.E.L.D.) to support grades 2 – 6 one day per week and continue providing small group instruction allowing classroom teachers the opportunity to observe/collaborate with other teachers and strengthen professional practices
Offer Dinner and Data Nights allowing students the opportunity to share academic progress monitoring and improvement goals with their family
Utilize Positive Behavior Support (PBS) Tier 1 strategies to encourage all students to be active learners and take responsibility for their learning. Tier 2 Interventions and Tier 3 Interventions will be used as needed
Provide a Walk to Intervention model at each grade level to provide additional support for struggling students outside of the 90 minute block (Leveled Literacy Intervention)
Math instruction provided in small group settings and the utilization of math centers to reinforce skill acquisition based on the standards
Monitor the amount of literary and informational text used for instruction to provide a balanced literacy program
Monitor student progress in reading and math using Pearson’s Success Maker computer assisted instruction in grades 1st-6th
Reflection on practices that may impede student achievement include: Reading fluency skills and understanding of vocabulary (unfamiliar words) that impede students’
reading comprehension Students have a disconnect between understanding of vocabulary when presented orally and then
when asked in written form or for future recall Increased assessment rigor requiring demonstration of academic and content vocabulary
8 | P a g e

High percentage of Title 1 families are unfamiliar with new practices and new Florida Standards High percentage of families unfamiliar with how to support language acquisition and vocabulary
development Sixteen teachers new to Cambridge may be unfamiliar with DI strategies
Best Practice:
Based on research, as it relates to the data analysis above, what should be best practices in the classroom?
Create positive relationships with students and families to support an encouraging and progressive culture for education. According to Ellerbrock, Abas, DiCicco, Denmon, Sabella, and Hart (2015) students who face challenges outside of school can improve their ability to focus on academics when a caring classroom community provides emotional support. Students’ needs are met and there is a sense of belonging and identification in a safe, shared, open, and student-centered school atmosphere.
Standards based instruction in all content areas. Research by Snow-Renner and Lauer (2005) revealed that standard based instruction can have a positive influence on student achievement and teacher instruction as long as teachers are exposed to training that includes content knowledge and guided practice in applying the new technique, and structural supports that are aligned with standards and student learning. Substantial change takes time; therefore, a sustained focus at the district and school level is needed because teachers must have opportunities to learn, practice, and observe reform-oriented strategies and the effects on student learning. Eisenhower National Clearinghouse (2004) concluded standard based instruction includes standards delineating what matters, providing clarity and a fixed point of reference for teachers and students, guiding instruction so it is focused on student learning, providing a common language to encourage conversation about student learning, and assisting in identifying struggling students. The following four embedded central strategies should exist: inquiry and problem solving, collaborative learning, continual assessment embedded in instruction, and higher-order questioning.
Essential Questions will guide lessons. Wiggins (2007) defined essential questions as an important, vital, “at the heart of the matter”, or essence of the issue. Essential questions should be important questions that recur throughout one’s life; broad in scope, and timeless in nature. Questions are essential when they help students make sense of important but complicated ideas and knowledge.
Use the backwards design to develop lessons: Understanding By Design. Wiggins (2007) introduced a template for designing lessons based on beginning with the Desired Results (goals, understandings, essential questions, and what students should know at the end of the unit. Next, the Assessment Evidence will include performance tasks or other evidence to assess student learning, followed by the Learning Activities outlining the daily lesson plans based on the standards. Bransford, Brown, and Cocking (2000) revealed students should not only become familiar with factual knowledge, but develop a conceptual framework of concepts and ideas that facilitate meaning and learning. Use of common formative and summative assessments to have data chats among grade level teachers. Formative assessments were found to improve the pedagogical practices of teachers and provided specific
9 | P a g e

instructional support for lower performing students; thus increasing student achievement (Dunn & Mulvenon, 2009). Whether an assessment is defined as formative or summative, depends on how the teacher uses the data. Formative assessments provide quantitative and qualitative feedback for the teacher in order to produce a better understanding of the material by the student. Summative evaluation may be defined as the assessment based data for the purpose of assessing academic progress and recognizing students’ standing relative to an established criterion. Both types of assessment provide opportunities for teachers to disaggregate data and plan for future instruction and/or remediation or acceleration; differentiated instruction.
Differentiated instruction based on students’ needs. McQuarrie, McRae, and Stack-Cutler (2008) found using differentiated instruction consistently yielded positive results and that students with mild or severe learning disabilities received benefits from instruction in small groups or with targeted groups of students. Guiding principles for differentiated instruction include focusing on essential ideas and skills in the content areas and the elimination of ancillary activities; responding to individual student differences such as prior knowledge, interests, engagement, and learning styles; grouping students by shared interest, topic, or ability; integrating ongoing and meaningful assessments; and continually assessing, reflecting, and adjusting content, process, and product based on students’ needs. Tomlinson (1999) warned moving toward differentiation is a long-term change process of learning and implementing new strategies.
Positive Behavior Support Model, data tracking. School-wide Positive Behavior Interventions and Supports is a systems approach to establishing the social culture and behavioral supports needed for all children in a school to achieve both social and academic success. Data from the 2014 – 2015 school year indicated that office discipline referrals decreased by 7%. Cambridge’s in-school suspensions decreased by 30%, and out-of-school suspensions increased by 11%. The PBS tracking system which is provided by the University of South Florida’s PBS Program, suggested that discipline issues/referrals increased during the month of February. This may possibly be due to upcoming state assessments or students and teachers becoming lax in the expectations set forth in the beginning of the school year. Therefore, there will be a concentrated effort in reinforcing positive behavior support when teachers and students return from the semester break, 2016. Additionally, research concluded that referrals often happen when students are outside of the general education classroom suggesting the need for consistent expectations, enforcement of the RAPS, throughout the campus and not just in the classroom.
Develop a system/process for Cambridge Elementary teachers to support the MTSS (Multi-Tiered System of Support). Teacher survey results revealed that 80 percent of grade levels responding to the survey were confused on the MTSS process and frustrated with the data collection expectations of the students. Therefore, a focus on establishing an MTSS process for Cambridge will be scheduled. Classroom teachers and the leadership team will meet throughout the year with the district MTSS trainer to establish a procedure and protocol for Cambridge Elementary. These meetings will allow time to discuss concerns of students and the tracking of data. The MTSS team will act as a collaborative group to suggest strategies for student success and support.
School-Based Goal: What can be done to improve instructional effectiveness?
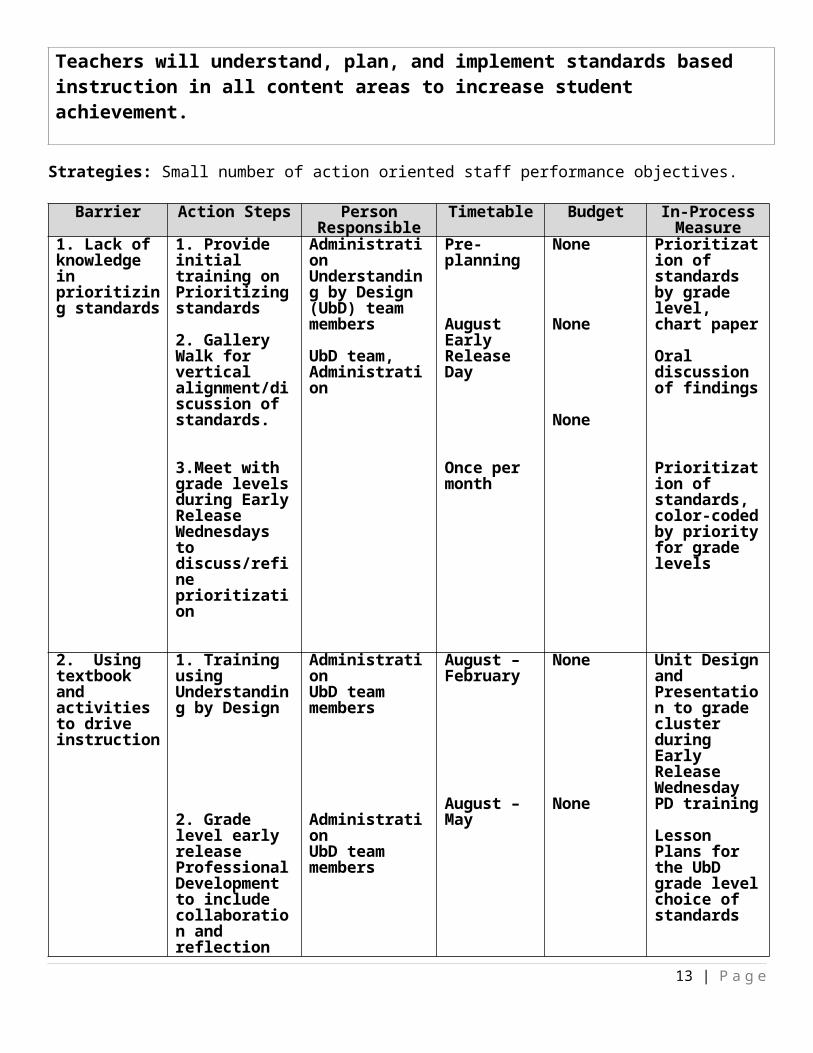
Teachers will understand, plan, and implement standards based instruction in all content areas to increase student achievement.
Strategies: Small number of action oriented staff performance objectives.
10 | P a g e

Barrier Action Steps Person Responsible
Timetable Budget In-ProcessMeasure
1. Lack of knowledge in prioritizing standards
1. Provide initial training on Prioritizing standards
2. Gallery Walk for vertical alignment/discussion of standards.
3.Meet with grade levels during Early Release Wednesdays to discuss/refine prioritization
AdministrationUnderstanding by Design (UbD) team members
UbD team, Administration
Pre-planning
August Early Release Day
Once per month
None
None
None
Prioritization of standards by grade level, chart paper
Oral discussion of findings
Prioritization of standards, color-coded by priority for grade levels
2. Using textbook and activities to drive instruction
1. Training using Understanding by Design
2. Grade level early release Professional Development to include collaboration and reflection on standards and lesson development
3. Informal classroom observations with specific feedback to change instruction from Administration
AdministrationUbD team members
AdministrationUbD team members
Administration
August – February
August – May
October - April
None
None
None
Unit Design and Presentation to grade cluster during Early Release Wednesday PD training
Lesson Plans for the UbD grade level choice of standards
ProGOE Informal Observation Data
3. Limited knowledge of the Multi-Tiered System of Support
1.Brainstorming meeting
District MTSS trainer, leadership team, school psychologist, and
August None Plan for implementation of Cambridge MTSS system
11 | P a g e

(MTSS) process
2. MTSS overview to staff
3. MTSS process with student data
4. MTSS Follow Up Meeting
5. Future MTSS follow-up
staffing specialist
2. District MTSS trainer, administration, leadership team, grade level team members
3. District MTSS trainer, administration, leadership team, grade level teams
4. District MTSS trainer, Reading Coach, administration, and Guidance Counselor to facilitate grade level meeting as a follow up from September training
5. District MTSS trainer, Reading Coach, administration, and Guidance Counselor
2. August grade level meetings
3.September 2 hour training and collaboration with grade level teams
4. October
5. As needed
None
Substitute Funds to cover 2 hour blocks, 2 days
None
5. None
Cambridge MTSS booklet
Data chats, review of Tier 2 and 3 progress, discussion of students in need, MTSS meeting notes, IPST Forms
MTSS meeting notes, student data, MTSS forms when needed
MTSS meeting notes, MTSS forms when needed
4. Lack of feedback for teachers on lesson plans based on standard based instruction
1.Administrators to provide specific feedback in ProGOE; offering meetings with teachers to discuss feedback
2.Based on need, provide teachers support through Title I Teachers, Reading Coach, and district trainings
1.Administration
2.Administration, Title I Teachers, Reading Coach, and district trainings
1.October – May
2.September – May
None
2.Possible sub costs if not able to be covered by Title I Teachers
1. ProGOE feedback and scoring; schedule of classroom informal observations by administrators
2.Improved scoring in ProGOE, training, implementation of skills in lesson plans
12 | P a g e
5. Staff lacking the knowledge of 2014 – 2015 end of year behavior data and trends. There are 16 new teachers, lack of knowledge on Positive Behavior Support (PBS) system
1.Preplanning Presentation and review of PBS also including 2014 – 2015 end of year behavior data/trends.
2. Group of 3 teachers to be trained in Classroom Coaching Training
1.PBS Coach
2.PBS Coach1 intermediate and 1 primary teacher
1.August
2.September
1.August
2.September
1.Agenda and PowerPoint
2. Primary and Intermediate representatives to train grade levels. 3 teachers will become mentor to beginning teacher on positive behavior strategies.
3. Monthly PBS Team Meetings
6. Proper training in Leveled Literacy Intervention (LLI) - use with fidelity for Walk to Intervention with K-6th students.
1.Staff training in LLI
2. Leadership team and grade level teams
1. LLI Consultant and teachers from Cambridge trained in LLI summer of 2015
2. Create and schedule LLI groups and plan for other intervention groups
1.Initial September training and follow up during Winter as needed
2. September, October, and as needed to adjust groups
1.None
2.None
1.Grade level LLI groups, data
2. LLI groups, Grade Level intervention schedule
EVALUATION – Outcome Measures and Reflection- begin with the end in mind .
Qualitative and Quantitative Professional Practice Outcomes: Measures the level of implementation of professional practices throughout your school.
13 | P a g e

100% of classroom teachers will produce an Understanding By Design unit including lesson plans that support standard based instruction to include lessons and activities supporting the full intent of the standards.
The UbD unit, including lesson plans for the unit, will be completed by all classroom teachers. The lessons will be observed and scored by administrators in ProGOE. Specific feedback will be provided during the construction of the UbD unit by administration and Title One teachers who will collaboratively work with grade levels during early release Wednesdays’ professional development.
100% of classroom teachers will have more than the two required informal observations completed by administration. The informal observations will be scored and the teacher will be provided specific feedback noted in ProGOE in suggestions to improve in a specific dimension or element.
End of year EDI (or similar) survey results will reveal that 90% of planned lessons will begin with an end goal or assessment task, and increase of 63% from the 27% reported in the spring of 2015. The focus on prioritizing standards will result in 80% of teachers responding being an expert on understanding the full intent of the grade level standards, a 46% increase from the spring of 2015. Prioritizing standards will also increase the percentage of teachers being confident in knowing which standards were priority from 48% in the spring of 2015 to 80% in the spring of 2016. There will be an increase of 63% (17 to 80) of teachers being familiar with the Understanding by Design process.
Qualitative and Quantitative Student Achievement Expectations: Measures student achievement.
According to the end of the year 2015 FAIR results, students in third through sixth grade showed an overall percentage improvement in Probability of Literacy Success. Historically, standardized test results (FCAT) for Cambridge showed students were not proficient in Reading. FAIR results, although improved in grades three through six, still show a low percentage of students scoring in the green for Probability of Literacy Success:
Third Grade (Baseline 11% to 33% probability at the end of the 2015 school year)Fourth Grade (Baseline 8% to 23% probability at the end of the 2015 school year)Fifth Grade (Baseline 24% to 38% probability at the end of the 2015 school year)Sixth Grade (Baseline 10% to 19% probability at the end of the 2015 school year)
2016 end of year FAIR data (AP3) will reveal the Probability of Success for third grade through sixth grade to show an increase of 30 percentage points on Success of Probability from baseline FAIR results (AP1) to end of year 2016 FAIR data (AP3). This is an increase of 15% improvement from AP3 2015 end of year FAIR results.
2014 – 2015 discipline data, as reported in the Positive Behavior Support (PBS) model revealed the following discipline referral data: 532 total referrals for the school year. The suspension data reported 130 out of school suspensions for the 2014 – 2015 school year.
2015 – 2016 discipline data, as reported in the Positive Behavior Support (PBS) model will reveal a decrease of 25% in referral, totaling 392 referrals. Suspension rates will decrease by 50% to a total of 58 referrals.
14 | P a g e

Part 2: Support Systems for Student Achievement
(Federal, State, and District Mandates)
For the following areas, please write a brief narrative that includes the data from the year 2014-2015 and a description of changes you intend to incorporate to improve the data for the year 2015-2016.
15 | P a g e

16 | P a g e
MULTI-TIERED SYSTEM OF SUPPORTS MTSS/RtI This section meets the requirements of Sections 1114(b)(1)(B)(i)-(iv) and 1115(c)(1)(A)-(C), P.L. 107-110, NCLB, codified at 20 U.S.C. § 6314(b) and Senate Bill 850.
School leadership identifies and aligns with all available resources (e.g. personnel, instructional, curricular) in order to meet the needs of all students:
MTSS Leadership Team consist of the following stakeholders: Administration – Dr. Wendy Smith (Principal) and Kori Hurst (Assistant Principal), Dr. Sarah Brothers (Guidance Counselor), Title I staff: Sandra Marines (Title I ELA-Intermediate), Rick Dillon (Title I ELA/ Math Primary), Abbey Turner (Title I Math-Intermediate), Mary Anne Pitman (Literacy Coach), and Coordinating Teacher, Eric Jacobson (Positive Behavior Support Coach). Their purpose is to coordinate the efforts of the Cambridge MTSS system and to support Positive Behavior Support (PBS).
MTSS stakeholders’ objectives: in order to ensure that IPST documents are completed with fidelity, the guidance counselor, with support from a designated grade level team leader, work collaboratively, to assist members of the grade level teams with the completion of IPST documents. This affords stakeholders to gather relevant information in the domains of sound instruction, curriculum, learning environment, and the student through the use of interviews, reviews, observations, and assessments to determine contributing factors to the problem. During this process, grade levels meet (data team meetings) in an effort to explore and utilize interventions that will foster academic success for students of concern. This endeavor includes consultation and assistance from Title I staff and district personnel, thorough record keeping of meetings held, utilization of data meeting checklists for tracking required documents, as well as, the implementation of the tiered-levels of support.
Cambridge beliefs align with the Continuous Improvement Model. This model affords all stakeholders to work, unitedly, to improve services to students by using this four step quality model—the plan-do-check-act (PDCA) cycle Deming Institute (2015). [https://www.deming.org/theman/theories/pdsacycle] This process allows the team of professionals to identify opportunities to (Plan) and implement interventions that foster academic change for students of concern. This encompasses “walk-to- intervention”, where blocks of time are scheduled, within the school day for every grade level, to allow for additional and specific academic support for all students. (Do) Implement the change on a small scale (Tier 3), when Tier 2 interventions do not suffice. (Check) by using data to analyze the results of the change and determine whether it made a difference, and (Act) if the change was successful. Teachers will continue to implement interventions and assess results as required. If the change doesn’t work, interventions are modified or requests for additional support from district personnel, is solicited in order to determine if services are needed through ESE programs.
In addition to interventions during the school day, Cambridge offers an After School Program (ASP) for students. Students who are in grades 3 through 6 and are working below grade level are given additional support in reading and math, twice a week for approximately eight weeks.
To ensure that all stakeholders obtain a thorough understanding of the MTSS process, grade level training from Shelly Dickinson (MTSS Facilitator) will be conducted. This training will assure that all stake holders are receiving consistent information concerning the MTSS process. The Guidance Counselor and Literacy Coach will be attending MTSS meeting, throughout the year, to stay abreast of changes/ updates to the MTSS process. They will convey what transpired at each meeting to ensure that all Cambridge stakeholders have up-to-date information. Staffing Specialist, School Psychologist, and other district professional (as needed) will also, provide MTSS support to Cambridge stakeholders through consultation, review of data, and intervention recommendations.
The Literacy Coach and Title I teachers will be responsible for consulting, monitoring, sharing strategies, and reviewing materials that are appropriate for grade level interventions. This is inclusive of modeling the instruction for intervention groups. Peer coaches and Title I teachers will also assist with staff training and provide feedback.
The Primary ELA/Math Title I teachers for grades K- 3, will provide support, model strategies, and review materials for reading and math instruction for primary grade levels. This will also include modeling and

(TITLE 1 SCHOOLS ONLY)
Highly Qualified Teachers Describe the school based strategies that will be used to recruit and retain high quality, highly qualified teachers to the school.
Descriptions of Strategy Person Responsible Projected Completion Date
1. Cambridge Elementary Magnet School welcomes pre-service teachers from both Eastern Florida State College and the University of Central Florida.
Administration Trained Supervising Teachers
May 2016
2. Our teachers allow the education majors to observe them in the classroom and welcome them as tutors in the America Reads, Brevard Reads, and Eastern Florida State College Buddies Program
AdministrationTeachersSACC Coordinator
May 2016
3. Each new teacher hired at Cambridge receives a CET mentor teacher and is assisted by our Mentor Council Representative, National Board Certified Teachers, our Reading Coach, our Title I Coordinator, Peer Coaches, as well as writing, science, and math contact members.
AdministrationTitle I TeachersTeacher MentorsPeer Coaches
May 2016
4. B.E.S.T. practices and Instructional Performance Appraisal System Observation criteria will be used to create a system for continuous improvement of instruction and supervision based on a common vision of effective teaching.
Administration May 2016
5. Our goal is to have 80% of the teaching staff hold a master’s degree or higher or National Board Certification by 2020.
AdministrationTeachers
May 2020 (Strategic Plan Goal)
17 | P a g e

Non-Highly Qualified Instructors Provide the number of instructional staff and paraprofessionals that are teaching out-of-field and/or who are not highly qualified. *When using percentages, include the number of teachers the percentage represents (e.g., 70% [35]).
Number of staff and paraprofessionals that are teaching out-of-field/and who are not highly
qualified
Provide the strategies that are being implemented to support the staff in becoming highly qualified
13% (7) are currently out of field for ESOL Daniel Sweeney Wendy Bryson Erik Jacobson (awaiting DOE approval) Mary McMenamy Katelyn Pitts Jaycie Tipton Monique Vargas (awaiting DOE approval)
All teachers are currently completing professional development ESOL course work being offered
through the District by years end
CTE/STEM:
1. All Levels
a) Number of Science Technology Engineering Math (STEM) related experiences provided for students (e.g. field trips; science fairs, Odyssey of the Mind) – Eleven.
b) Participation in STEM-related experiences provided for students – Cambridge Science Lab will continue on the activity Wheel for grades 2nd-6th, continued use of Cocoa High School Feeder Chain STEM Grant Netbook computers for 5th and YOGA computers for 6th grade, Lagoon Quest field trip, Cambridge Science Fair, Central Area Science Fair, STEM based Science After School Program (ASP) for 5th grade students, Kennedy Space Center field trip, Engineering Design Challenges, 5th grade Zoo School at the Brevard Zoo , Odyssey of the Mind, and Keep Brevard Beautiful Recycling Program.
By having science on the activity wheel, grades 2nd-6th are able to participate in integrated science activities through hands on experiences. Additionally, students are engaged in STEM activities in their classrooms and hands on field trips. The students will strengthen their understanding of the natural world and increase their knowledge of technology through the use of the NGSSS standards for Science.
18 | P a g e