https://webfiles.uci.edu/setrumbo/public/impr s/trumbore_imprs_1.ppt
TRANSCRIPT

https://webfiles.uci.edu/setrumbo/public/IMPRS/Trumbore_IMPRS_1.ppt

Some Energy is reflected to space
Earth is an Open System for Energy
Earth intercepts
energy radiated by
the sun
Some Energy is absorbed and heats
the earth; this drives biogeochemical
cycles
Earth has temperature, so emits radiation
(energy) to space
A comparatively very small flux of heat from
radioactive decay of elements within earth –
drives lithosphere cycles

Earth is a closed system for all elements heavier than helium
Implications:
Finite availability of resources
Changes propagate through system
Biogeochemical cycles – movement of elements between litho-, hydro-, bio-, atmosphere

Tools and some basics
• Biogeochemistry Scientific study of the chemical, physical, geological, and biological processes and reactions that govern the composition of the natural environment, and the cycles of matter and energy that transport the Earth's chemical components in time and space. (from wikipedia)
• Global Biogeochemical Cycles Descriptions of the movement of elements (e.g. C, N, S, O, P) among global spheres (biosphere, hydrosphere, pedosphere, atmosphere, lithosphere, antrhoposphere)
• Why study them? Humans have altered most cycles in ways that are having global importance (at least on timescales of the next few millennia); biogeochemical cycles control the composition and longterm evolution of Earth’s atmosphere and climate

Abundance of elements in solar system depends on nucleosynthesis
H, He are most abundant (not shown here) (from big bang, fusion of H to form He in stars)
Elements like 12C, 16O, 20Ne up to 56Fe formed by burning He in massive stars (burning releases energy)
Elements heavier than 56Fe are formed in supernovae
A few elements (cosmogenic nuclei) still formed – more later
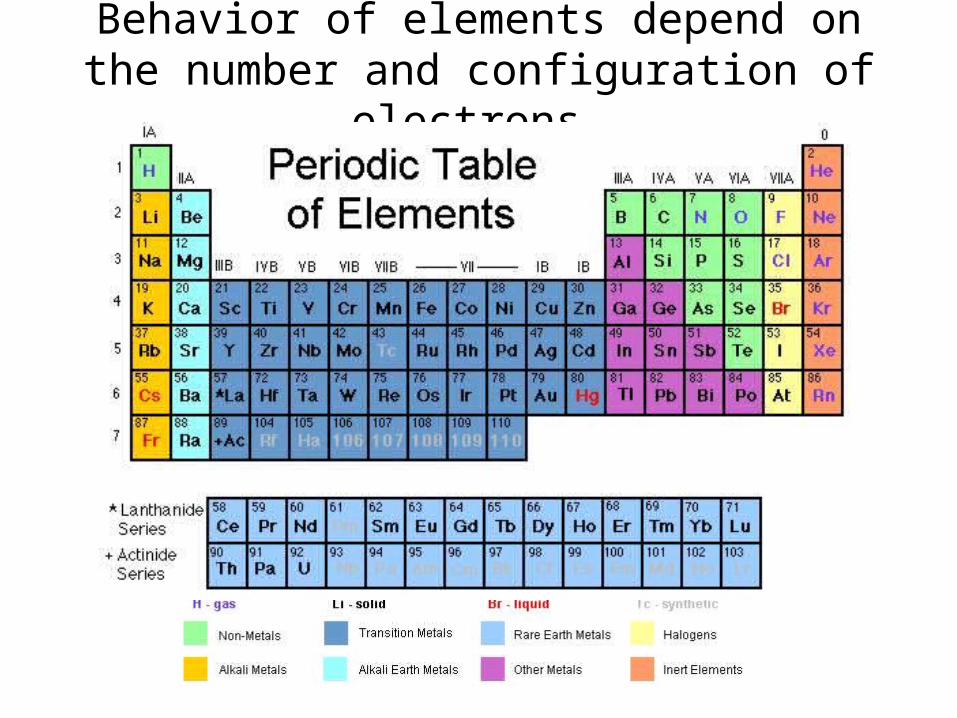
Behavior of elements depend on the number and configuration of electrons
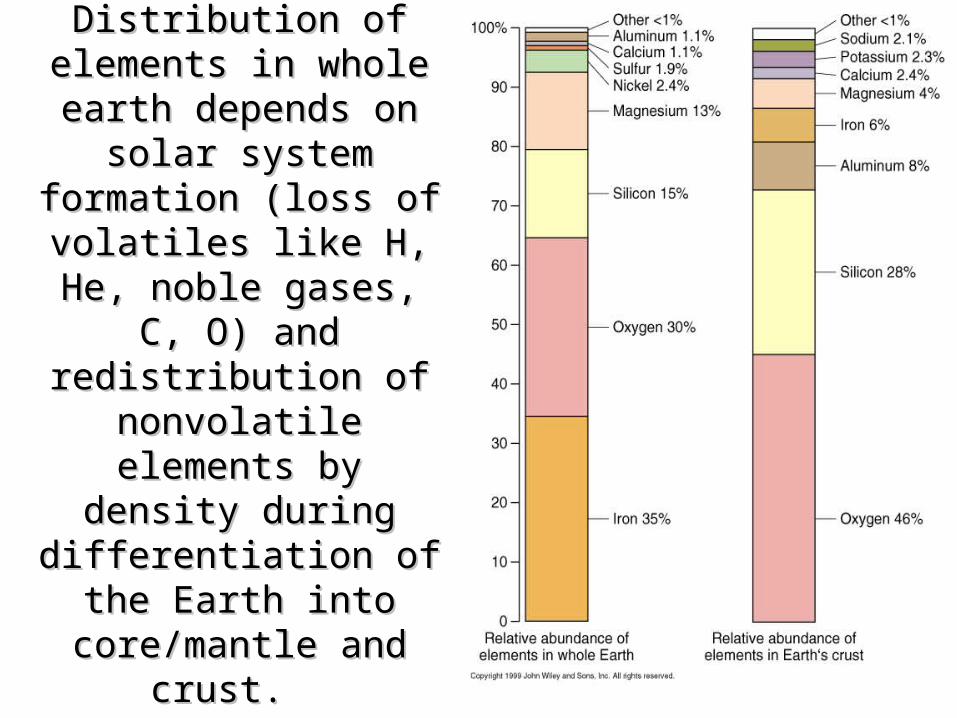
Distribution of elements Distribution of elements in whole earth depends in whole earth depends
on solar system on solar system formation (loss of formation (loss of
volatiles like H, He, volatiles like H, He, noble gases, C, O) and noble gases, C, O) and
redistribution of redistribution of nonvolatile elements by nonvolatile elements by
density during density during differentiation of the differentiation of the
Earth into core/mantle Earth into core/mantle and crust. and crust.

Earth’s biogeochemical cycles depend fundamentally on the composition of the Earth – what elements it is made up of and the lithosphere cycles that operate to distribute them between earth and the earth’s surface/ocean/atmosphere system where we live
We will ignore (for the most part) these long-term (multi-millennial) cycles that exchange material between inner and outer earth components (mantle/surface) ; these cycles are driven by lithosphere processes with energy from radiodecay of nuclides in the mantle/core
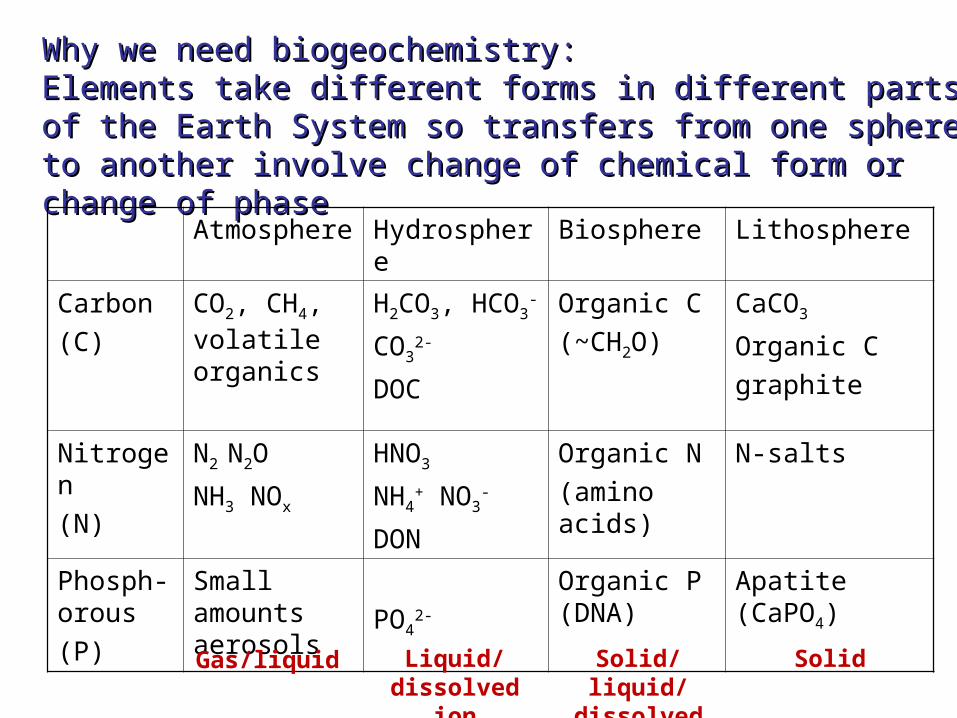
Why we need biogeochemistry:Why we need biogeochemistry:Elements take different forms in different parts of the Elements take different forms in different parts of the Earth System so transfers from one sphere to another Earth System so transfers from one sphere to another involve change of chemical form or change of phaseinvolve change of chemical form or change of phase
Atmosphere Hydrosphere Biosphere Lithosphere
Carbon
(C)
CO2, CH4, volatile organics
H2CO3, HCO3-
CO32-
DOC
Organic C
(~CH2O)
CaCO3
Organic C
graphite
Nitrogen
(N)
N2 N2O
NH3 NOx
HNO3
NH4+ NO3
-
DON
Organic N
(amino acids)
N-salts
Phosph-orous
(P)
Small amounts aerosols
PO42-
Organic P (DNA)
Apatite (CaPO4)
Gas/liquid Liquid/ dissolved ion
Solid/liquid/ dissolved ion
Solid

The Bio-part: Biogeocemical Cycles involve elements essential to life: C, N, O, P, S, H, and Si
These are interrelated through stoichiometry of living things, e.g. Ocean Redfield Ratio (Redfield, Ketchum, and Richards,1963)
106CO2 + 16 NO3- + HPO4
2-+ 122 H2O + 18 H+ <=>
(CH2O)106(NH3)16(H3PO4) + 138 O2
Ocean C:N:P is ~ 106:16:1 (not always!!)On land, ratios are different – C:N and C:P can be much higher because plant structural material is built out of C-rich materials
like cellulose (C6H12O2)Stoichiometry means: Element balance (same number on
each side of the equation – reactants and products)Charge balance (electroneutrality)
Charge balance

Example: equation of State for Gases – needed to understand expression of gas abundance in the atmosphere and relate
volume occupied to amount and state variables (physical conditions:T,P)
PV = nRT
Partial pressures (how we express gas concentrations)
pT = (p1 +p2 +…pn)V = (n1 + n2 +…Nn)RT
e.g. Carbon dioxide = 360 ppm or
360 x 10-6 moles CO2 per mole air or
360 atmospheres CO2 per 1 atmosphere total air pressure
Thermodynamics (relationship between energy and chemistry):


Units – mixing ratio
ppm = parts per million
Or
1 mole CO2 per mole air
Covariance of O2 and CO2 is fixed by stoichiometry of biological (photosynthesis) and nonbiological (dissolution) and human (fossil fuel burning) processes

Dynamic EquilibriumThe reaction coefficient (Keq) - relates the concentrations
(activities) of reactants and products for a system at dynamic equilibrium. Can be determined from energetics of the system: ΔG = ΔG0 + RT ln (Keq)
The reaction quotient - ratios of actual concentrations; tells you if you are at equilibrium or not.
Equilibrium is dynamic – reactions are occurring but rates balance so there is no macroscopic change in the system observable; the distribution of reactants and products represents maximizes entropy in the universe

CH4 + 2O2 CO2 + 2H2OCurrent concentrations of gases in the atmosphere:
CH4: 2 ppm
(2 x 10⁻⁶ mol CH4/mol air)
O2 : 21%
(0.21 mol O2/mol air)
CO2 380 ppm
(380 x 10-6 mol CO2/mol air
H2O: ~1% water vapor in atmsophere
(.01 mol H2O/mol air)
224
22
2
))((
)()(
aOaCH
aCOOaHKeq
Where a is activity = concentration or ideal pressure times a correction factor to represent the role of molecular interactions that might interfere with the ability to participate in reactions –’nonideal’ conditions. In this course, we will ignore these complications and use concentration or partial pressure rather than activity.
Keq is determined (from thermodynamic constants – see notes) to be ~10140Is methane in the atmosphere at
equilibrium??? i.e. Q equals Keq?

Lovelock and Gaia
• The atmosphere is not at chemical equilibrium with ocean/land surfaces
• Gases are present in nonequilibrium concentrations because they are continuously produced and consumed by biological processes
• Feedbacks between those gases and the life that produces them maintain the atmosphere in a state conducive to the continuation of life
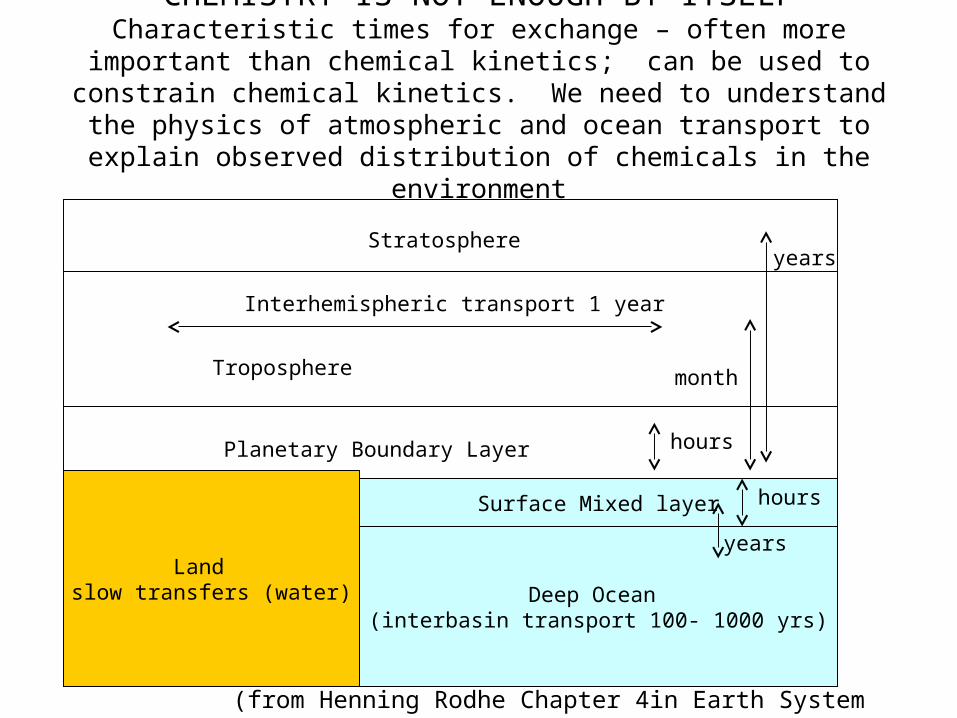
CHEMISTRY IS NOT ENOUGH BY ITSELFCharacteristic times for exchange – often more important than
chemical kinetics; can be used to constrain chemical kinetics. We need to understand the physics of atmospheric and ocean transport to
explain observed distribution of chemicals in the environment
Surface Mixed layer
Deep Ocean (interbasin transport 100- 1000 yrs)
years
hours
Planetary Boundary Layer hours
monthTroposphere
Interhemispheric transport 1 year
Stratosphere
Land slow transfers (water)
years
(from Henning Rodhe Chapter 4in Earth System Science)

The Global Atmospheric Circulation
Barbara Summey, NASA Goddard Visualization Lab
Timescales for mixing of gases in the atmosphere:
Zonal – weeksEquator to pole – weeksAcross the equator – 1 year (because of convergence at the ITCZ)
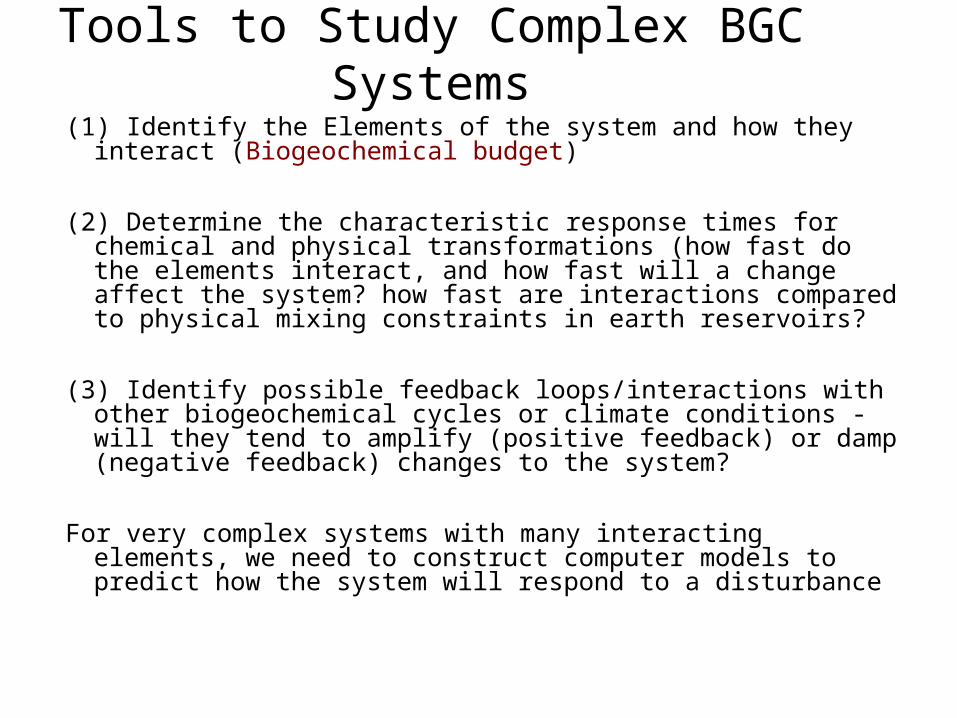
Tools to Study Complex BGC Systems
(1) Identify the Elements of the system and how they interact (Biogeochemical budget)
(2) Determine the characteristic response times for chemical and physical transformations (how fast do the elements interact, and how fast will a change affect the system? how fast are interactions compared to physical mixing constraints in earth reservoirs?
(3) Identify possible feedback loops/interactions with other biogeochemical cycles or climate conditions - will they tend to amplify (positive feedback) or damp (negative feedback) changes to the system?
For very complex systems with many interacting elements, we need to construct computer models to predict how the system will respond to a disturbance
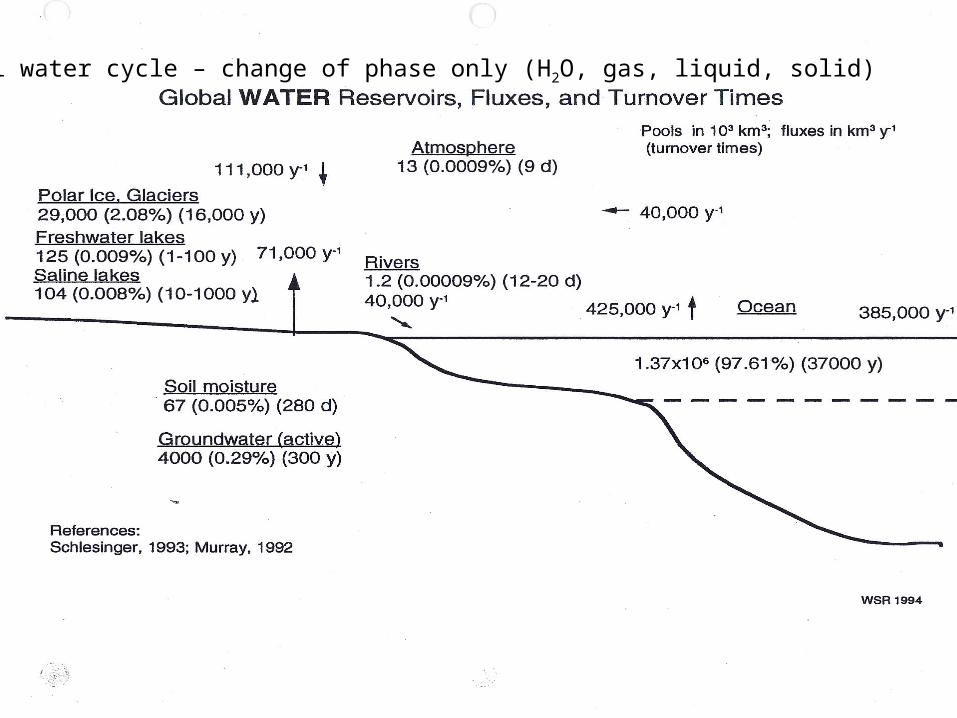
Global water cycle – change of phase only (H2O, gas, liquid, solid)

• Reservoir = the amount of the material of interest in a given form. A reservoir has a finite capacity and in studying it we define its exchanges with other reservoirs.
Water in a lake, water in the atmosphere, water in the ocean. Example: Water in the atmosphere: 13 x 103 km3
Water in the ocean: 1.37x 10⁹ km3
• Flux = the amount of material added to (Source) or removed from (Sink) the reservoir in a given period of time.
An example of a flux is the evaporation of water from the surface of a lake or ocean (in which the ocean reservoir is a source of water for the atmosphere).
Ocean fluxes: In: rivers + precipitation = (40,000 + 385,000) x 103 km3 a-1
Out: evaporation = 425,000 ) x 103 km3 a-1
Atmosphere fluxes: (out)= precipitation = (111,000 + 385,000) x 103 km3 a-1
Residence Time – how long to empty the reservoir (Reservoir size/Flux out) Ocean: 37,000 year
• A reservoir that is at Steady State shows no change in mass with time(Sources or fluxes in = Sinks or fluxes out)

Rodhe’s three key terms for expressing the dynamics of cycling for geochemical reservoirs
• Turnover time This is the time it would take to empty (or fill) the reservoir. At steady state this is the amount of material in reservoir divided by the sum of all fluxes out or sum of all fluxes in.
• Mean (average) Residence Time This is the average time spent in the reservoir by individual atoms - measurable as the age of atoms leaving the reservoir
• Mean Age This is the average the average time spent in the reservoir by all the atoms currently in the reservoir (measurable as the age of atoms in the reservoir)
For a HOMOGENEOUS reservoir at STEADY STATE (i.e. not changing in amount with time) all three of these terms are equal. However, we make our biggest mistakes in defining systems to be homogeneous (i.e. all elements in the reservoir have the same probability of leaving) when they are not.
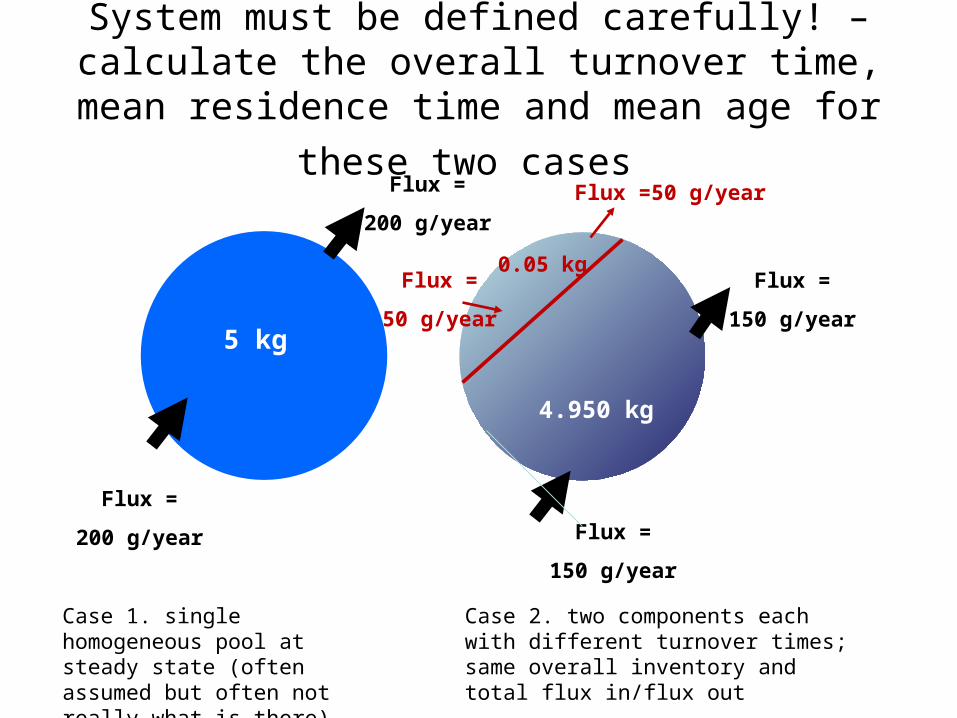
System must be defined carefully! – calculate the overall turnover time, mean residence time and
mean age for these two cases
Flux =
200 g/year
Flux =
200 g/year
5 kg
0.05 kg
4.950 kg
Flux =
50 g/year
Flux =50 g/year
Flux =
150 g/year
Flux =
150 g/year
Case 1. single homogeneous pool at steady state (often assumed but often not really what is there).
Case 2. two components each with different turnover times; same overall inventory and total flux in/flux out

Heat Capacity and The Earth's Heat Storage
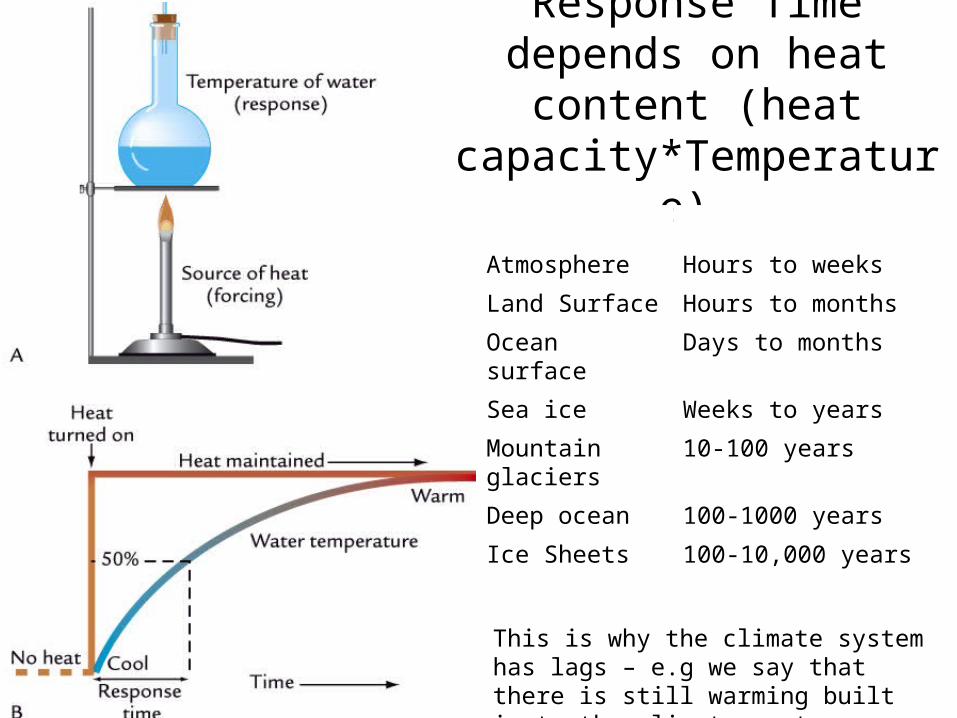
Response Time depends on heat content (heat
capacity*Temperature)
Component Response time
Atmosphere Hours to weeks
Land Surface Hours to months
Ocean surface Days to months
Sea ice Weeks to years
Mountain glaciers
10-100 years
Deep ocean 100-1000 years
Ice Sheets 100-10,000 years
This is why the climate system has lags – e.g we say that there is still warming built in to the climate system.
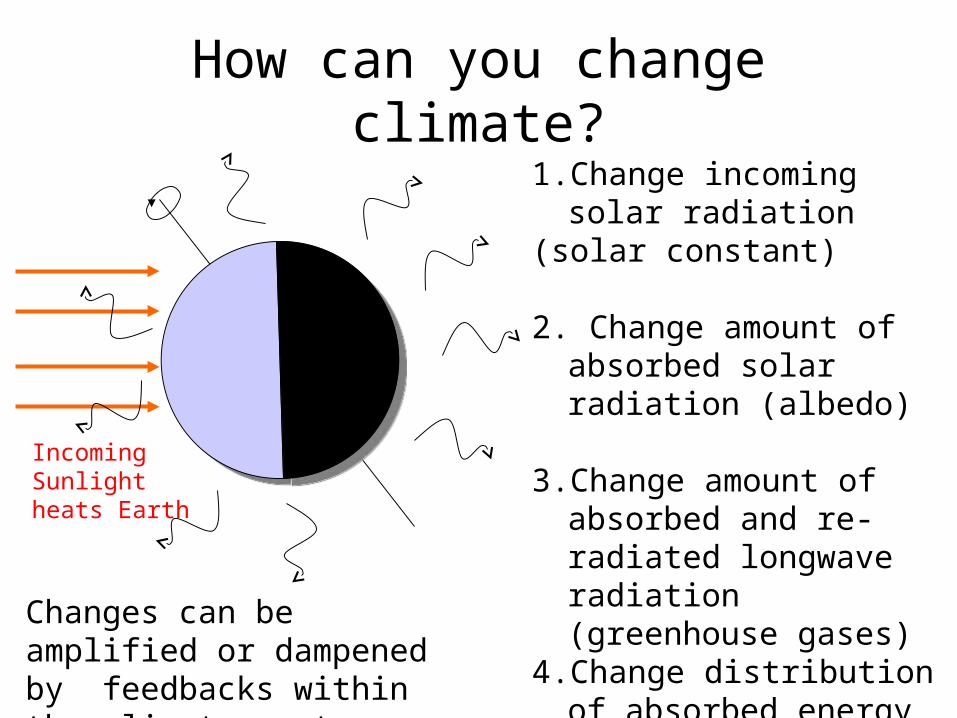
How can you change climate?
IncomingSunlight heats Earth
1. Change incoming solar radiation
(solar constant)
2. Change amount of absorbed solar radiation (albedo)
3. Change amount of absorbed and re-radiated longwave radiation (greenhouse gases)
4. Change distribution of absorbed energy (internal climate system)
Changes can be amplified or dampened by feedbacks within the climate system
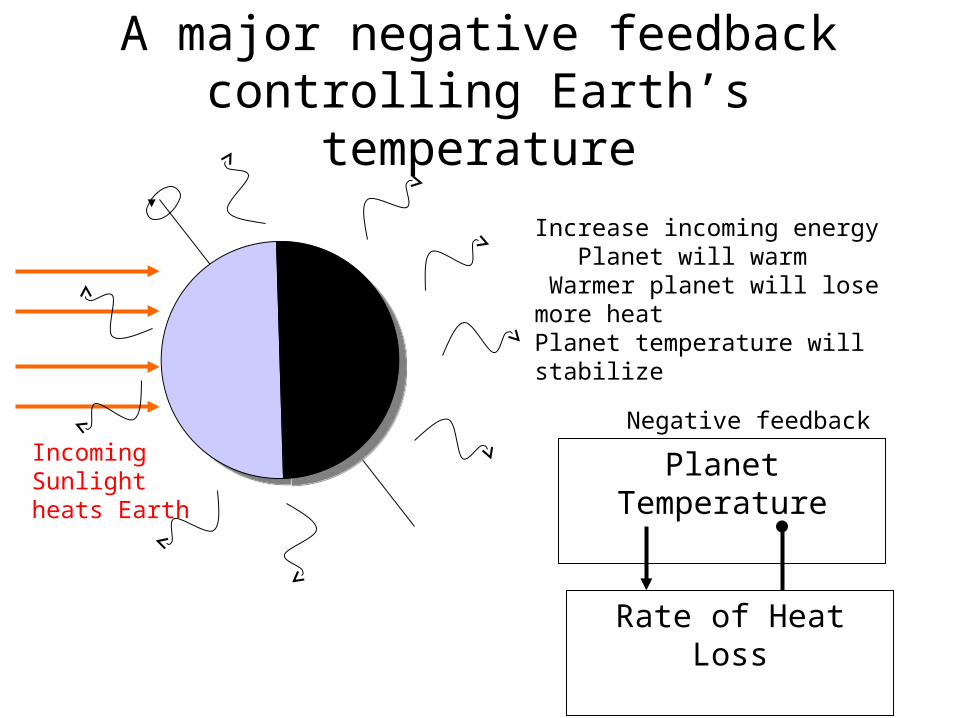
A major negative feedback controlling Earth’s temperature
IncomingSunlight heats Earth
Planet Temperature
Rate of Heat Loss
Negative feedback
Increase incoming energy Planet will warm Warmer planet will lose more heatPlanet temperature will stabilize
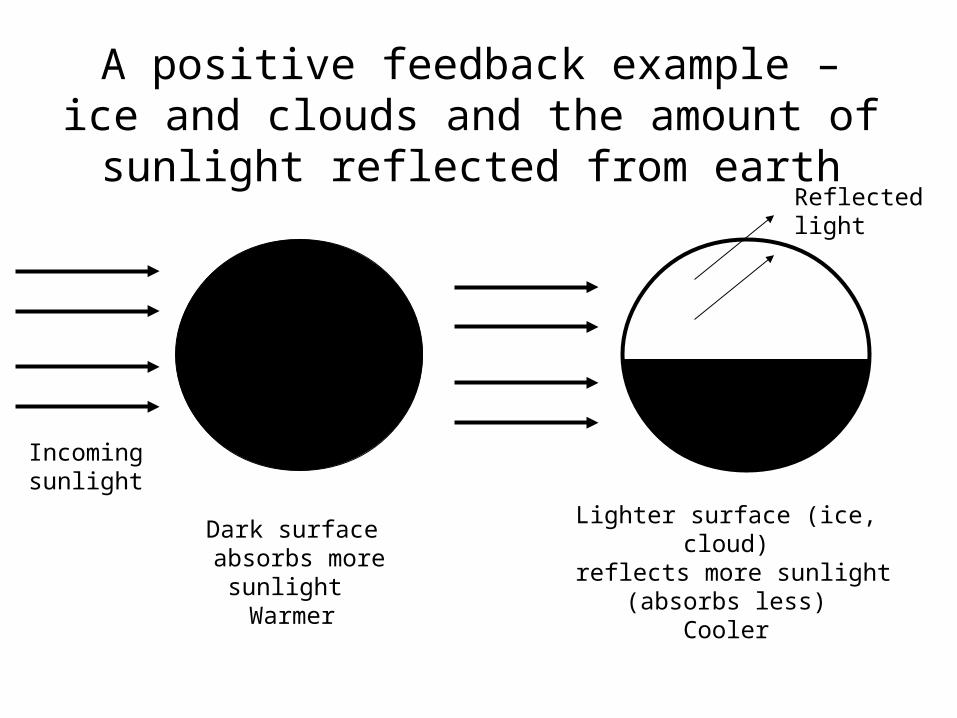
A positive feedback example – ice and clouds and the amount of sunlight reflected
from earth
Dark surface absorbs more sunlight
Warmer
Lighter surface (ice, cloud) reflects more sunlight (absorbs
less)Cooler
Reflected light
Incomingsunlight

This is a feedback because the amount of ice depends on the temperature of the planet
– colder = more ice
Amount of sunlight reflected
Temperature of planet
Amount of ice
Step 1 Identify the elements of the system that interact. In this case the output (reflected sunlight) affects the input (sunlight absorbed at planet surface), both influence planet’s temperature

If more sunlight is reflected, temperature cools
Amount of sunlight reflected
Temperature of planet
Amount of ice
This is a negative coupling – an increase in reflected sunlight causes a decrease in the temperature of the planet
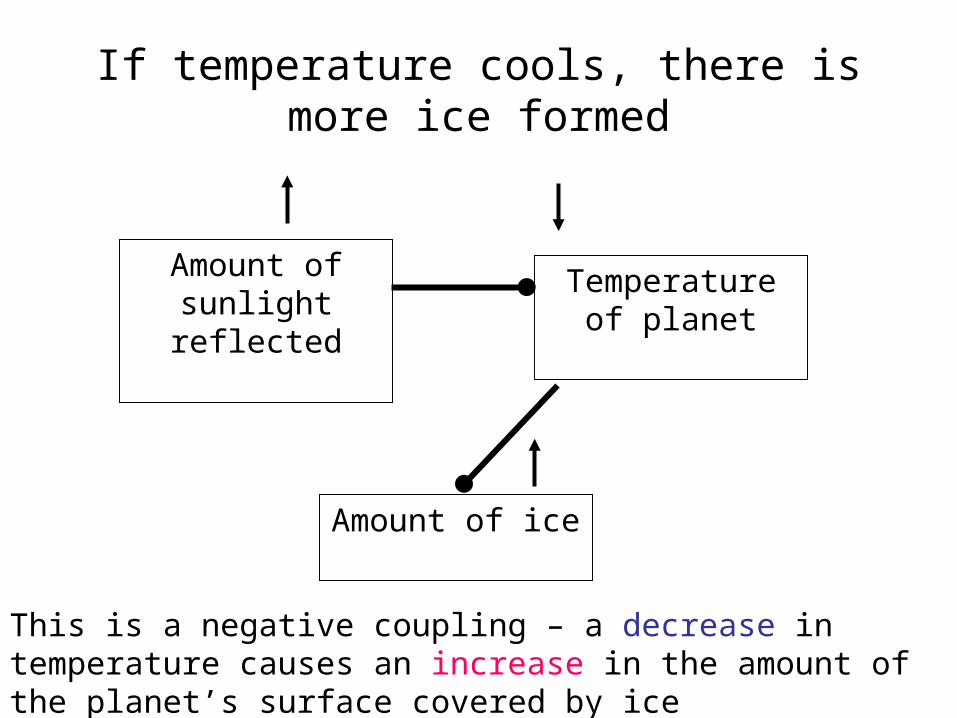
If temperature cools, there is more ice formed
Amount of sunlight reflected
Temperature of planet
Amount of ice
This is a negative coupling – a decrease in temperature causes an increase in the amount of the planet’s surface covered by ice

If there is more ice, there will be a greater amount of sunlight reflected
Amount of sunlight reflected
Temperature of planet
Amount of ice
This is a positive coupling – an increase in ice coverage causes an increase in the amount incoming sunlight reflected
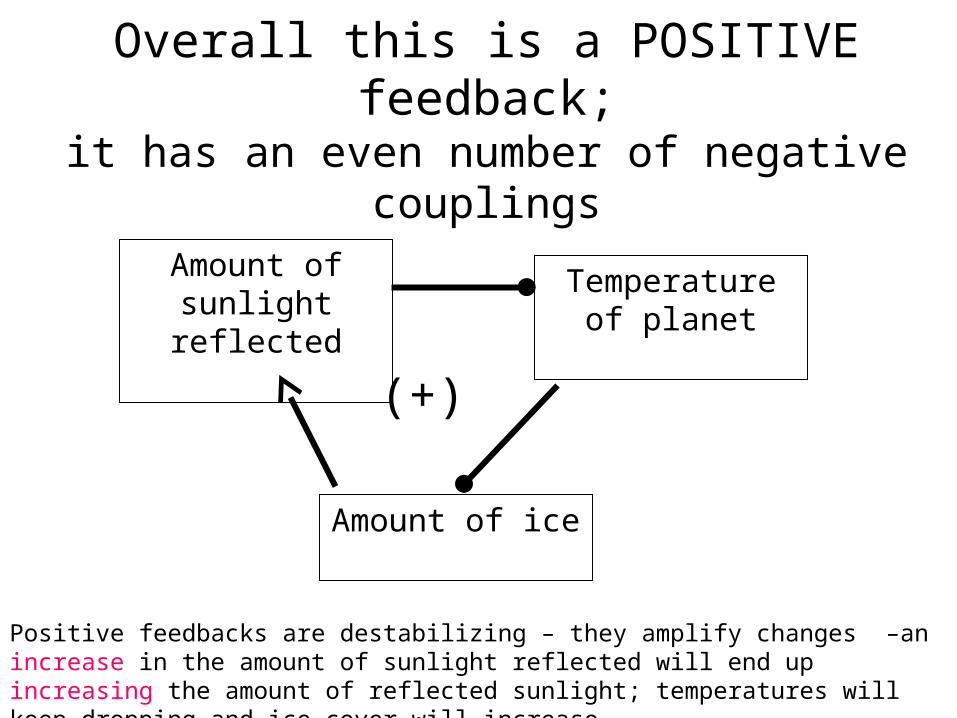
Overall this is a POSITIVE feedback;it has an even number of negative couplings
Amount of sunlight reflected
Temperature of planet
Amount of ice
Positive feedbacks are destabilizing – they amplify changes –an increase in the amount of sunlight reflected will end up increasing the amount of reflected sunlight; temperatures will keep dropping and ice cover will increase
(+)

The “Snowball Earth”hypothesis –
At one point (~700 million years ago) Earth may have been entirely ice covered and much colder because of a ‘runaway’ ice – reflectance feedback
Which begs the question – how did we get out of the frozen state? There must be another process at work …more later on

Example – Feedbacks between climate and Greenhouse Gases (more gases = warmer
average temperature)
Atmospheric Stock of GHG
(radiative forcing)
Global Warming
Water (vapor, clouds, ice)
• What is the magnitude of these GHG feedbacks?
• How do they affect climate predictions?
Natural greenhouse gas processes (CO2, CH4, …)

Emily Stone (NSF)
Ice core data imply large, positive greenhouse gas feedbacks
Torn and Harte. Missing feedbacks, asymmetric uncertainties, and the underestimation of future warming, GRL, 2006.
Ice cores effectively integrate over all feedback mechanisms and record the net result.
EPICA Ice Core 650,000 year record
Temp
CO2
CH4
Age (yr B P) 0 600,000
Temperature changes recorded in ice cores are larger than the forcing we can understand that operates on the same timescales/periodicity (orbital variations). Greenhouse gases change after temperature in ice cores, implies positive feedback

How is the feedback effect quantified?
TF Ti
1 g
g = feedback gain, g < 1
g C
T
T
C
gg
Total g = sum of independent g’s
= gCO2 + gCH4 + gGCM
Ti TF Temperature
atm CO2
www.nersc.gov
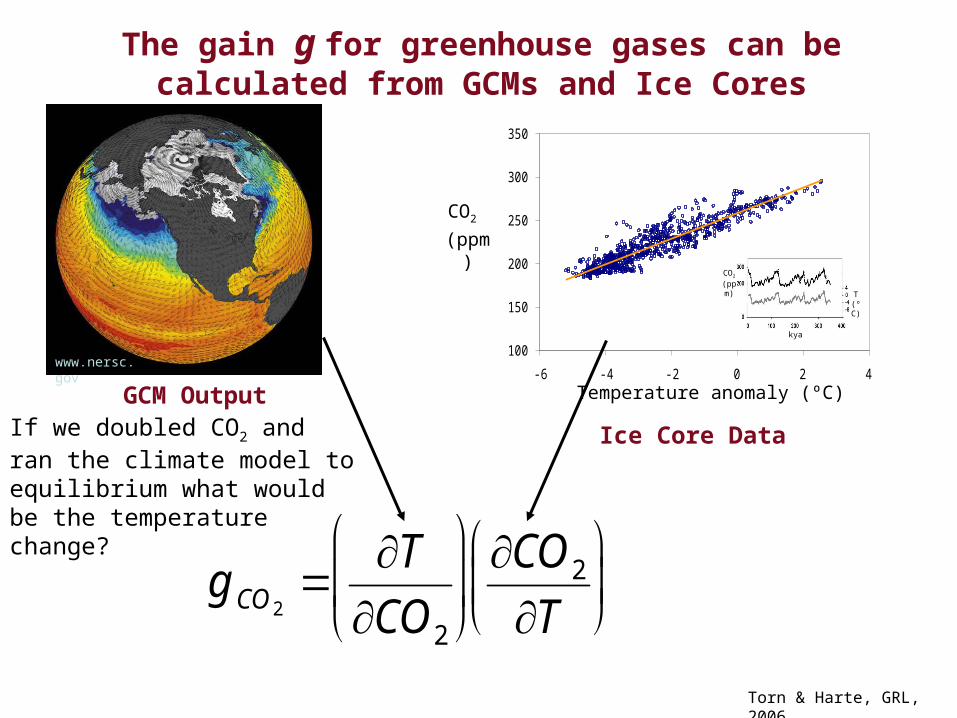
g CO2
T
CO2
CO2
T
100
150
200
250
300
350
-6 -4 -2 0 2 4
CO2
(ppm)
Temperature anomaly (ºC)
CO2
(ppm) T
(ºC)
kya
GCM Output
Ice Core Data
The gain g for greenhouse gases can be calculated from GCMs and Ice Cores
Torn & Harte, GRL, 2006
If we doubled CO2 and ran the climate model to equilibrium what would be the temperature change?

Summary: Studying Global Biogeochemical Cycles and the underlying biogeochemical processes that control them, gives us constraints for understanding how those cycles can be altered – by humans, by climate variation, etc.Tools for analyzing Global Biogeochemical Cycles
– define reservoirs appropriately - determine if the system can be approximated by
steady state - determine the turnover time
-various methods for quantifying fluxes (ocean, land, etc)
- how do those fluxes couple to climate/other biogeochemical cycles?
- what are the major feedbacks/couplings and are they positive/negative?
- can we quantify feedbacks via calculation of gain?

Earth System Science is different
• The Earth has history and it influences what we observe today
• We have only one (no replication, except in models)
• Things do not often change in isolation
Paleoclimate (sunlight variation effects)
(effects of volcanoes)

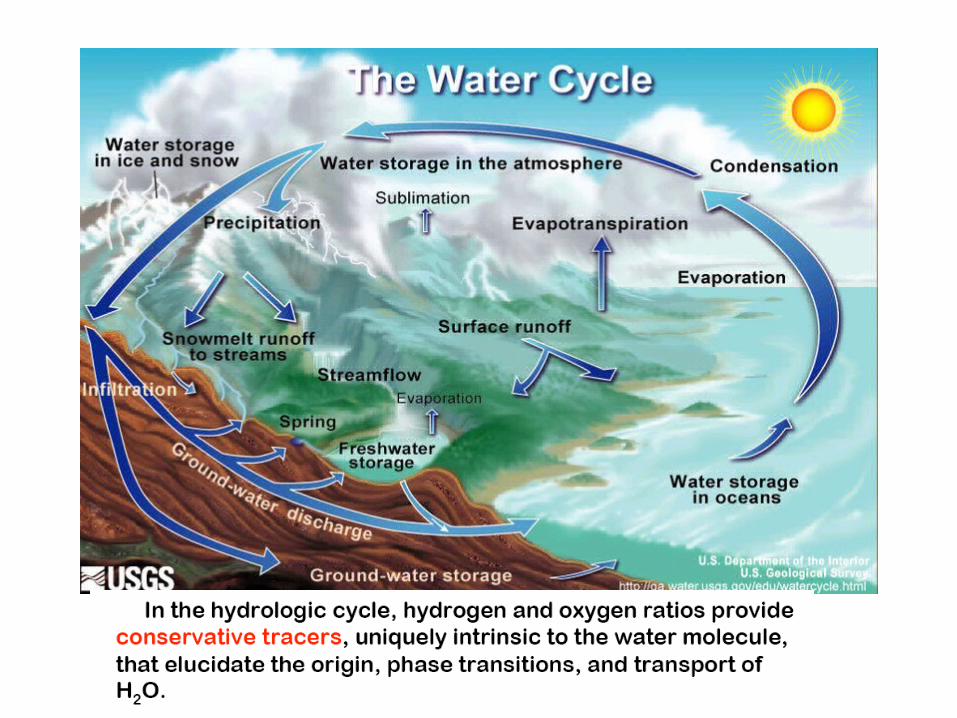
Tracers– another useful tool
Isotopes (or tracer analogs) of an element provide very useful information for global biogeochemical cycles
Same chemistry, slightly different rates of reaction
How do isotopes of H and O help us understand the water cycle?

Isotopes of an element have the same number of protons (therefore chemistry) but different numbers of neutrons
(mass)
12C 98.9% (6 protons, 6 neutrons) 13C 1.1 % (6 protons, 7 neutrons) 14C ~1.1x 10⁻¹⁰ % (6 protons, 8 neutrons)Isotopes that are unstable decay radioactively –
14C decays to 14N
Isotopes of carbon contain different information:13C variations – patterns in the environment reflect mass-
dependent fractionation (partitioning among phases at equilibrium and differences in reaction rates), mixing of
sources14C variations – Reflects time since isolation from
exchange with atmosphere or mixing of sources 42

http://www.science.uottawa.ca/~eih/ch1/ch1.htm#enai

Isotope Fractionation• Fractionation refers to the processes that cause partial separation of
two isotopes of the same element, producing reservoirs with different ratios of rare to abundant isotopes.– Mass dependent fractionation
• equilibrium isotope fractionation - due to differences in bond energies of isotopes in compounds
• kinetic isotope fractionation- due to differences in average velocity or reaction rates of different isotopes
• Both depend only on the mass of the isotope and are called mass dependent fractionation; both will fractionate, say 18O/16O about twice as much as 17O/16O because the mass difference between 18 and 16 is ~ twice that of 17 and 16
– Mass-independent fractionation – generally requires higher energies – e.g. those associated with photolysis. At higher temperatures/energies, the distribution of isotopes among bond types is random rather than by bond energy, so that there is no difference between 18O/16O and 17O/16O

Interatomic distance
Potential Energy H-H
H-D
Dissociation Energy (E) E l E p
Why do isotopes fractionate? Small differences in mass mean small differences in chemical bond strength and vibrational frequency ()
1
2k
,
m1m2
m1 m2
Vibrations are quantized, E(vib) = h(n+1/2) n=0,1,2,3 ½(h (n=0) is called the Zero-Point Energy (ZPE)
Pot
entia
l ene
rgy

Example: Characteristic constants of H2O and D2O
(From Hoefs, 1973, Stable isotope geochemistry)
Property H2O D2O
Density (20 C) 0.9982 1.1050
Temperature of greatest density 4.0 11.6
Mole volume (20C) cm3/mole 18.049 18.124
Melting point (760 torr, C) 0.00 3.82
Boiling point (760 torr, C) 100.00 101.42
Vapor pressure (at 100C in torr) 760.00 721.60
Viscosity (@20.2 C in centipoises) 1.00 1.26
Ionic product a 20C 1x10-14 0.16 x 10⁻¹⁴

H
D
O
O
N
N
C
C
light
heavy
abundant
rareR ,,,
16
18
14
15
12
13
100011000tantan
tan xR
Rx
R
RR
dards
sample
dards
dardssample
Element Standard R
Carbon Pee Dee Belemnite (calcium carbonate)
13C/12C = 0.011237218O/16O = 0.002671
Nitrogen Atmospheric N2 0.0036765
Hydrogen, Oxygen
VSMOW (standard mean ocean water)
D/H = 0.0001557618O/16O = 0.00200520
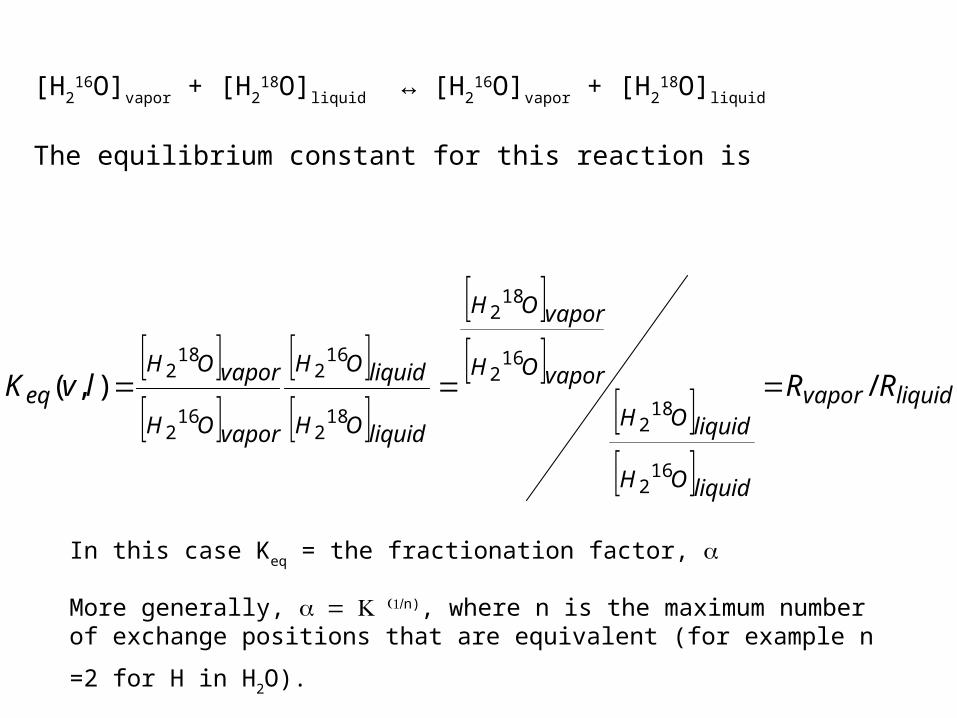
[H216O]vapor + [H2
18O]liquid ↔ [H216O]vapor + [H2
18O]liquid
The equilibrium constant for this reaction is
liquidvapor
liquidOH
liquidOH
vaporOH
vaporOH
liquidOH
liquidOH
vaporOH
vaporOHeq RRlvK /),(
162
182
162
182
182
162
162
182
In this case Keq = the fractionation factor,
More generally, n), where n is the maximum number of exchange
positions that are equivalent (for example n =2 for H in H2O).

What accounts for the differences in stable isotope content among reservoirs?
€
=
H218O
H216O sample
−H2
18O
H216O s tan dard
H218O
H216O s tan dard
⎡
⎣
⎢ ⎢ ⎢ ⎢
⎤
⎦
⎥ ⎥ ⎥ ⎥
x1000 =
H218O
H216O sample
H218O
H216O s tan dard
−1
⎡
⎣
⎢ ⎢ ⎢ ⎢
⎤
⎦
⎥ ⎥ ⎥ ⎥
x1000

Dansgaard – GlobalTemperature – 18O relation in precipitation
Used to turn ice core records D or 18O into Temperature
However, the ‘global’ line has been shown to be a series of ‘regional’ relationships.
http://www.science.uottawa.ca/~eih/ch3/ch3.htm#tt18ocip
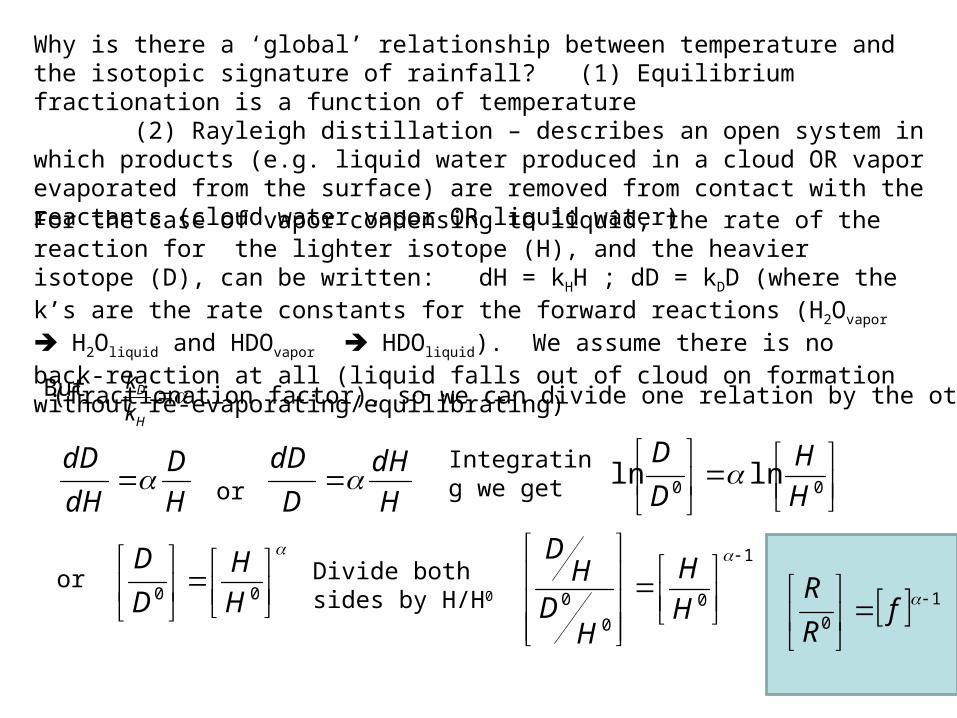
Why is there a ‘global’ relationship between temperature and the isotopic signature of rainfall? (1) Equilibrium fractionation is a function of temperature (2) Rayleigh distillation – describes an open system in which products (e.g. liquid water produced in a cloud OR vapor evaporated from the surface) are removed from contact with the reactants (cloud water vapor OR liquid water)
For the case of vapor condensing to liquid, the rate of the reaction for the lighter isotope (H), and the heavier isotope (D), can be written: dH = kHH ; dD = kDD (where the k’s are the rate constants for the forward reactions (H2Ovapor H2Oliquid and HDOvapor HDOliquid). We assume there is no back-reaction at all (liquid falls out of cloud on formation without re-evaporating/equilibrating)
H
D
k
kBut (fractionation factor), so we can divide one relation by the other:
H
D
dH
dD
H
dH
D
dDor
Integrating we get
00
lnlnH
H
D
D
Divide both sides by H/H0
or
00 H
H
D
D
1
0
fR
R1
0
0
0
H
H
HD
HD

Trópicos Altas Latutudes
D= -40‰18O= -13‰
Océano Continente
D= -80‰18O= -15‰
D= -25‰18O= -3‰
D= -110‰18O= -17‰
D= -45‰18O= -5‰
Ocean
Tropics
Continent
High Latitudes
D, 18O = 0

Liquid
Open systems and isotopes: Rayleigh distillation
(removal of one phase or component after equilibration)
For example, continuous removal of liquid from vapor as rain
1
0
fR
R
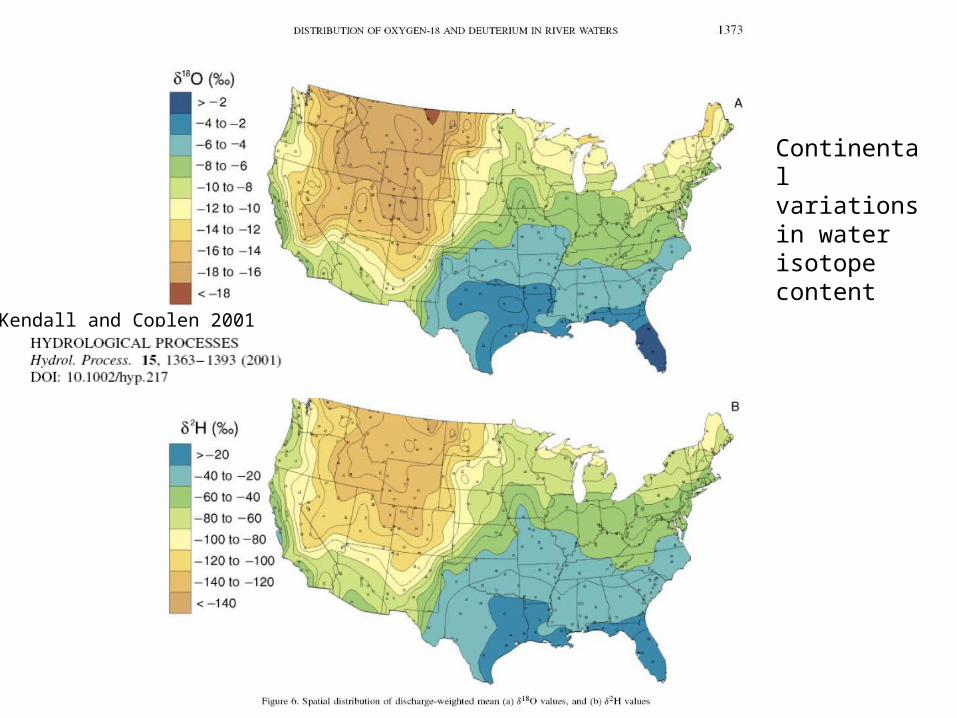
Kendall and Coplen 2001
Continental variations in water isotope content

Rates from radioactive isotope tracersThere is one naturally occurring, radioactive
isotope of hydrogen (tritium)
Tritium (3H) is the radioactive isotope of H that decays by emitting an electron from the nucleus (converts a neutron to a proton, thereby producing 3He.Radioactivity = rate of decay = k(T), with the decay constant: 0.05626 yr-1
For modern water isolated from the atmosphere, 3H is a major source of 3He. For each 3H that decays one 3He atom is produced. The natural abundance of 3H is usually expressed in Tritium Units (TU):1 TU = 1 3H atoms per 1018 H atoms = 1.100 10-19 mol/gpure water = 66,846 atoms/gpure water

3H is produced naturally in the atmosphere, but the ‘natural’ amount has largely been exceeded by 3H produced by nuclear weapons tests
www.wrq.eawag.ch/.../methoden/tritium_input
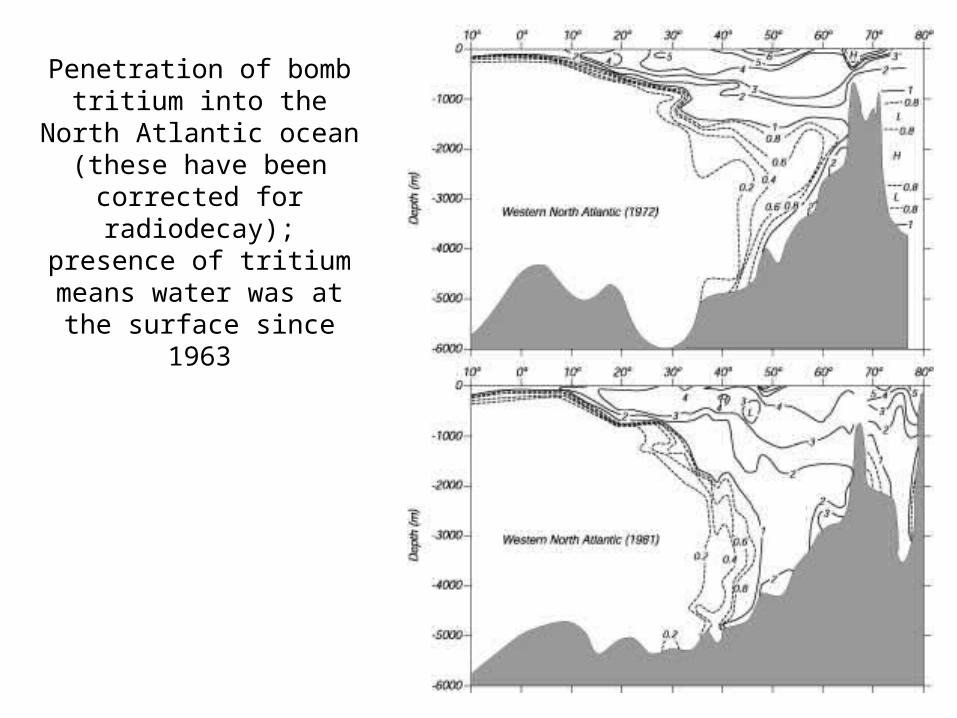
Penetration of bomb tritium into the North Atlantic
ocean(these have been corrected for radiodecay); presence of tritium means water was at the surface since 1963