accenture spend trends report - q4 2014
TRANSCRIPT

Accenture Spend Trends ReportQ4 2014
2 Copyright © 2015 Accenture. All rights reserved.
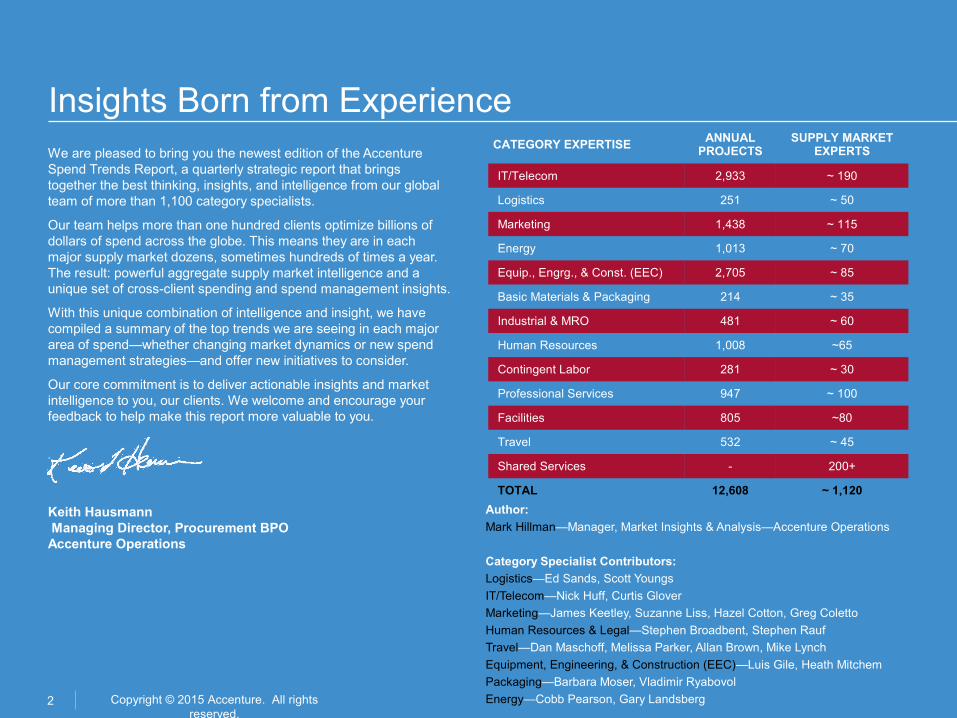
Insights Born from ExperienceWe are pleased to bring you the newest edition of the Accenture Spend Trends Report, a quarterly strategic report that brings together the best thinking, insights, and intelligence from our global team of more than 1,100 category specialists.
Our team helps more than one hundred clients optimize billions of dollars of spend across the globe. This means they are in each major supply market dozens, sometimes hundreds of times a year. The result: powerful aggregate supply market intelligence and a unique set of cross-client spending and spend management insights.
With this unique combination of intelligence and insight, we have compiled a summary of the top trends we are seeing in each major area of spend—whether changing market dynamics or new spend management strategies—and offer new initiatives to consider.
Our core commitment is to deliver actionable insights and market intelligence to you, our clients. We welcome and encourage your feedback to help make this report more valuable to you.
Keith Hausmann Managing Director, Procurement BPOAccenture Operations
Author:
Mark Hillman—Manager, Market Insights & Analysis—Accenture Operations
Category Specialist Contributors:
Logistics—Ed Sands, Scott Youngs
IT/Telecom—Nick Huff, Curtis Glover
Marketing—James Keetley, Suzanne Liss, Hazel Cotton, Greg Coletto
Human Resources & Legal—Stephen Broadbent, Stephen Rauf
Travel—Dan Maschoff, Melissa Parker, Allan Brown, Mike Lynch
Equipment, Engineering, & Construction (EEC)—Luis Gile, Heath Mitchem
Packaging—Barbara Moser, Vladimir Ryabovol
Energy—Cobb Pearson, Gary Landsberg
CATEGORY EXPERTISEANNUAL
PROJECTSSUPPLY MARKET
EXPERTS
IT/Telecom 2,933 ~ 190
Logistics 251 ~ 50
Marketing 1,438 ~ 115
Energy 1,013 ~ 70
Equip., Engrg., & Const. (EEC) 2,705 ~ 85
Basic Materials & Packaging 214 ~ 35
Industrial & MRO 481 ~ 60
Human Resources 1,008 ~65
Contingent Labor 281 ~ 30
Professional Services 947 ~ 100
Facilities 805 ~80
Travel 532 ~ 45
Shared Services - 200+
TOTAL 12,608 ~ 1,120
3 Copyright © 2015 Accenture. All rights reserved.
Executive SummaryMarkets remained extremely volatile in the fourth quarter. While global stock markets recovered from their autumn swoon, oil plummeted nearly 60 percent from mid-2014 highs. With growth forecasts being lowered for most economies outside the U.S., stimulus measures designed to spur growth are keeping interest rates and currencies low (and driving the U.S. Dollar higher). Although lower commodity costs and low interest rates provide some relief for corporate buyers and consumers, managing cost pressures in constrained areas like travel, labor, and logistics is a must.
Notable Macro Trends from the Fourth Quarter:
•Oil, Oil, Oil: Oil prices kept falling in the fourth quarter, down more than 50 percent for the year. With oil prices falling much further, much faster than anyone expected, the net impact is not fully known yet, but organizations are readjusting to new input cost levels while looking for improving consumer and business spending.
•U.S. Dollar Rising: The U.S. Dollar continued to appreciate against major currencies like the Euro and the Japanese Yen. With more monetary stimulus on the horizon from the European Central Bank, this trend is likely to continue, with significant impact on global markets and interest rates.
•Wage Pressure May Rise: Labor markets continue to improve with U.S. unemployment falling to 5.6 percent and Eurozone unemployment now at 11.4 percent. Wage pressure appears to be finally materializing, raising a new concern for corporate managers.
•Capital Investment Solid but Slowing: Energy and telecoms CapEx may slow, but with capacity utilization improving and borrowing costs low, investments should be made to support growth.
Q4 Spend Trends: The Big Five
•Logistics: Mergers & Acquisitions (M&A) Add Another Potential Cost Driver: Over-the-road logistics remains a supply constrained, price-pressured market. Now, with more investor capital driving healthy M&A activity in the sector, market consolidation adds another price risk for shippers to closely monitor.
•IT: Trend Toward Enterprise Agreements May Offer More Risk than Benefit: Interest in enterprise license agreements (ELAs) is on the rise among our clients. However, ELAs tend to favor the seller, and buyers should carefully evaluate the real value of an ELA vs. the risk of supplier lock-in and over-licensing.
•HR: With Health Care Costs in Flux, Pharmacy Benefits May Represent an Opportunity: With the full impact of U.S. health care legislation still to be fully realized, health care costs are in major flux. Pharmacy Benefits Management (PBM) is a highly complex area, but an opportunity to explore for cost savings opportunity.
•Travel: Oil Price Decline Not Showing up in Lower Travel Costs: Jet fuel prices, airlines’ biggest cost driver, are declining, but those costs savings have not translated into lower fares thanks to tight industry capacity. In this environment, buyers should get creative with ancillary fees while looking for chances to target fuel surcharges.
•Packaging: Understand the Impact of Input Costs to Drive Productive Negotiations: The packaging sector is strongly impacted by input costs in the form of oil derivatives, energy costs, and labor. Using detailed cost modeling to understand supplier and industry margins can level the negotiating playing field in light of major market moves like the recent oil price swoon.
4 Copyright © 2015 Accenture. All rights reserved.
Macroeconomic Backdrop
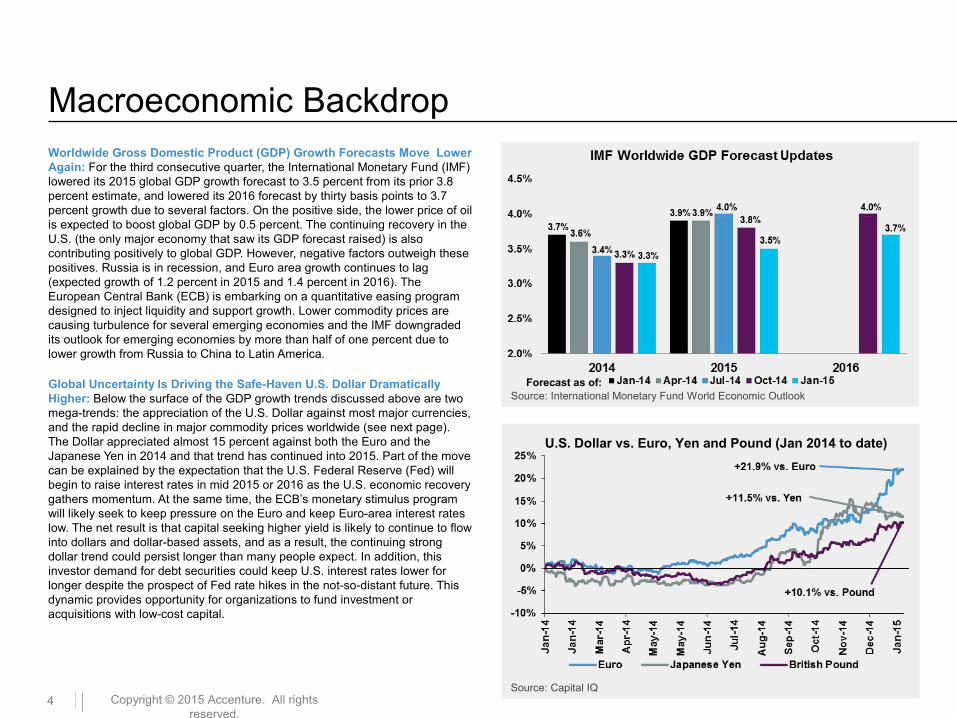
Source: International Monetary Fund World Economic Outlook
Source: Capital IQ
U.S. Dollar vs. Euro, Yen and Pound (Jan 2014 to date)
Worldwide Gross Domestic Product (GDP) Growth Forecasts Move Lower Again: For the third consecutive quarter, the International Monetary Fund (IMF) lowered its 2015 global GDP growth forecast to 3.5 percent from its prior 3.8 percent estimate, and lowered its 2016 forecast by thirty basis points to 3.7 percent growth due to several factors. On the positive side, the lower price of oil is expected to boost global GDP by 0.5 percent. The continuing recovery in the U.S. (the only major economy that saw its GDP forecast raised) is also contributing positively to global GDP. However, negative factors outweigh these positives. Russia is in recession, and Euro area growth continues to lag (expected growth of 1.2 percent in 2015 and 1.4 percent in 2016). The European Central Bank (ECB) is embarking on a quantitative easing program designed to inject liquidity and support growth. Lower commodity prices are causing turbulence for several emerging economies and the IMF downgraded its outlook for emerging economies by more than half of one percent due to lower growth from Russia to China to Latin America.
Global Uncertainty Is Driving the Safe-Haven U.S. Dollar Dramatically Higher: Below the surface of the GDP growth trends discussed above are two mega-trends: the appreciation of the U.S. Dollar against most major currencies, and the rapid decline in major commodity prices worldwide (see next page). The Dollar appreciated almost 15 percent against both the Euro and the Japanese Yen in 2014 and that trend has continued into 2015. Part of the move can be explained by the expectation that the U.S. Federal Reserve (Fed) will begin to raise interest rates in mid 2015 or 2016 as the U.S. economic recovery gathers momentum. At the same time, the ECB’s monetary stimulus program will likely seek to keep pressure on the Euro and keep Euro-area interest rates low. The net result is that capital seeking higher yield is likely to continue to flow into dollars and dollar-based assets, and as a result, the continuing strong dollar trend could persist longer than many people expect. In addition, this investor demand for debt securities could keep U.S. interest rates lower for longer despite the prospect of Fed rate hikes in the not-so-distant future. This dynamic provides opportunity for organizations to fund investment or acquisitions with low-cost capital.
Forecast as of:
5 Copyright © 2015 Accenture. All rights reserved.
Macroeconomic Backdrop
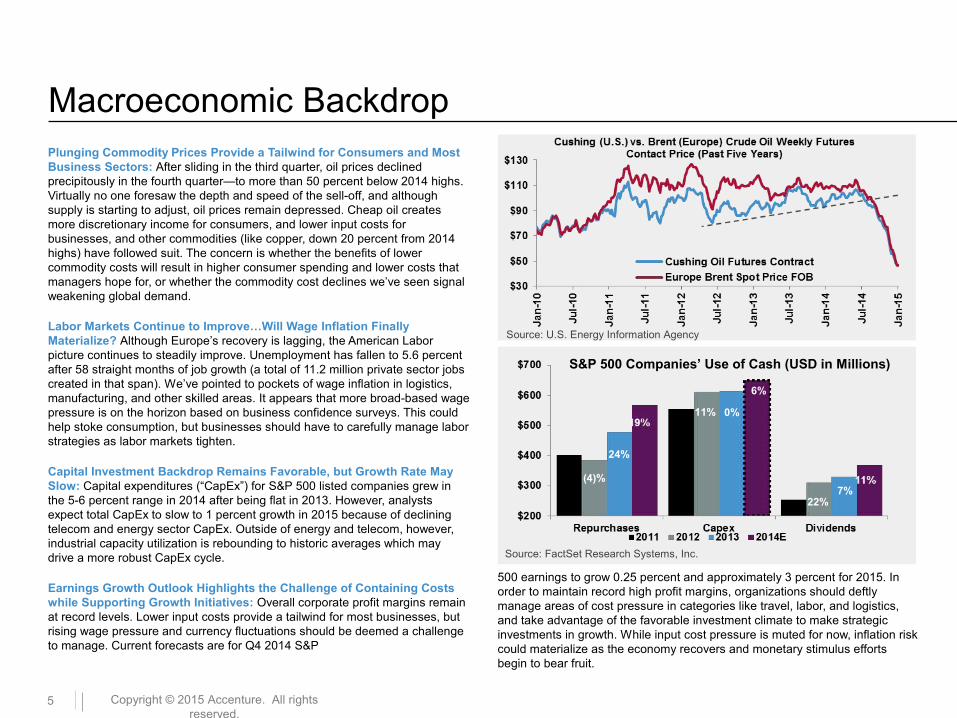
S&P 500 Companies’ Use of Cash (USD in Millions)
(4)%
24%
11% 0%
6%
22%7%
Source: FactSet Research Systems, Inc.
Source: U.S. Energy Information Agency
Plunging Commodity Prices Provide a Tailwind for Consumers and Most Business Sectors: After sliding in the third quarter, oil prices declined precipitously in the fourth quarter—to more than 50 percent below 2014 highs. Virtually no one foresaw the depth and speed of the sell-off, and although supply is starting to adjust, oil prices remain depressed. Cheap oil creates more discretionary income for consumers, and lower input costs for businesses, and other commodities (like copper, down 20 percent from 2014 highs) have followed suit. The concern is whether the benefits of lower commodity costs will result in higher consumer spending and lower costs that managers hope for, or whether the commodity cost declines we’ve seen signal weakening global demand.
Labor Markets Continue to Improve…Will Wage Inflation Finally Materialize? Although Europe’s recovery is lagging, the American Labor picture continues to steadily improve. Unemployment has fallen to 5.6 percent after 58 straight months of job growth (a total of 11.2 million private sector jobs created in that span). We’ve pointed to pockets of wage inflation in logistics, manufacturing, and other skilled areas. It appears that more broad-based wage pressure is on the horizon based on business confidence surveys. This could help stoke consumption, but businesses should have to carefully manage labor strategies as labor markets tighten.
Capital Investment Backdrop Remains Favorable, but Growth Rate May Slow: Capital expenditures (“CapEx”) for S&P 500 listed companies grew in the 5-6 percent range in 2014 after being flat in 2013. However, analysts expect total CapEx to slow to 1 percent growth in 2015 because of declining telecom and energy sector CapEx. Outside of energy and telecom, however, industrial capacity utilization is rebounding to historic averages which may drive a more robust CapEx cycle.
Earnings Growth Outlook Highlights the Challenge of Containing Costs while Supporting Growth Initiatives: Overall corporate profit margins remain at record levels. Lower input costs provide a tailwind for most businesses, but rising wage pressure and currency fluctuations should be deemed a challenge to manage. Current forecasts are for Q4 2014 S&P
500 earnings to grow 0.25 percent and approximately 3 percent for 2015. In order to maintain record high profit margins, organizations should deftly manage areas of cost pressure in categories like travel, labor, and logistics, and take advantage of the favorable investment climate to make strategic investments in growth. While input cost pressure is muted for now, inflation risk could materialize as the economy recovers and monetary stimulus efforts begin to bear fruit.
6 Copyright © 2015 Accenture. All rights reserved.
ENERGY
EQUIPMENT, ENGINEERING, & CONSTRUCTION
TRAVEL
HUMAN RESOURCES & LEGAL
MARKETING & MEDIA
LOGISTICS
INFORMATION TECHNOLOGY
PACKAGING
Top Trends in Logistics
Source: U.S. Energy Information Administration, IndexMundi.com
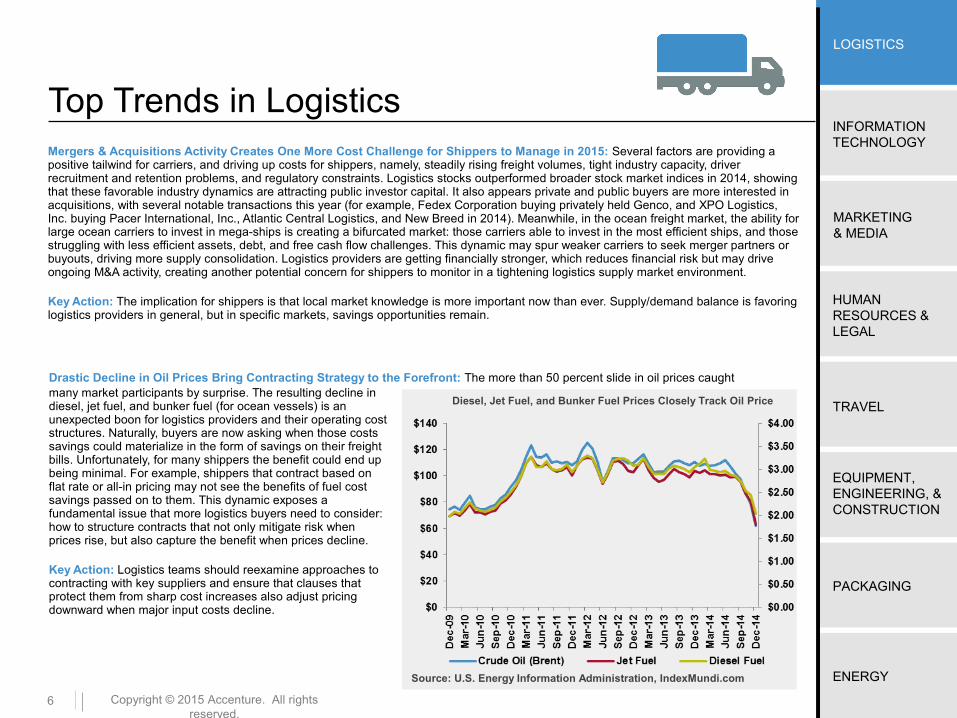
Diesel, Jet Fuel, and Bunker Fuel Prices Closely Track Oil Price
Mergers & Acquisitions Activity Creates One More Cost Challenge for Shippers to Manage in 2015: Several factors are providing a positive tailwind for carriers, and driving up costs for shippers, namely, steadily rising freight volumes, tight industry capacity, driver recruitment and retention problems, and regulatory constraints. Logistics stocks outperformed broader stock market indices in 2014, showing that these favorable industry dynamics are attracting public investor capital. It also appears private and public buyers are more interested in acquisitions, with several notable transactions this year (for example, Fedex Corporation buying privately held Genco, and XPO Logistics, Inc. buying Pacer International, Inc., Atlantic Central Logistics, and New Breed in 2014). Meanwhile, in the ocean freight market, the ability for large ocean carriers to invest in mega-ships is creating a bifurcated market: those carriers able to invest in the most efficient ships, and those struggling with less efficient assets, debt, and free cash flow challenges. This dynamic may spur weaker carriers to seek merger partners or buyouts, driving more supply consolidation. Logistics providers are getting financially stronger, which reduces financial risk but may drive ongoing M&A activity, creating another potential concern for shippers to monitor in a tightening logistics supply market environment.
Key Action: The implication for shippers is that local market knowledge is more important now than ever. Supply/demand balance is favoring logistics providers in general, but in specific markets, savings opportunities remain.
many market participants by surprise. The resulting decline in diesel, jet fuel, and bunker fuel (for ocean vessels) is an unexpected boon for logistics providers and their operating cost structures. Naturally, buyers are now asking when those costs savings could materialize in the form of savings on their freight bills. Unfortunately, for many shippers the benefit could end up being minimal. For example, shippers that contract based on flat rate or all-in pricing may not see the benefits of fuel cost savings passed on to them. This dynamic exposes a fundamental issue that more logistics buyers need to consider: how to structure contracts that not only mitigate risk when prices rise, but also capture the benefit when prices decline.
Key Action: Logistics teams should reexamine approaches to contracting with key suppliers and ensure that clauses that protect them from sharp cost increases also adjust pricing downward when major input costs decline.
Drastic Decline in Oil Prices Bring Contracting Strategy to the Forefront: The more than 50 percent slide in oil prices caught
7
ENERGY
EQUIPMENT, ENGINEERING, & CONSTRUCTION
TRAVEL
HUMAN RESOURCES & LEGAL
MARKETING & MEDIA
LOGISTICS
INFORMATION TECHNOLOGY
PACKAGING
Copyright © 2015 Accenture. All rights reserved.
Top Trends in Information Technology
© Copyright IDC. Source: “Worldwide SaaS Enterprise Applications 2014-2018 Forecast and 2013 Vendor Shares”
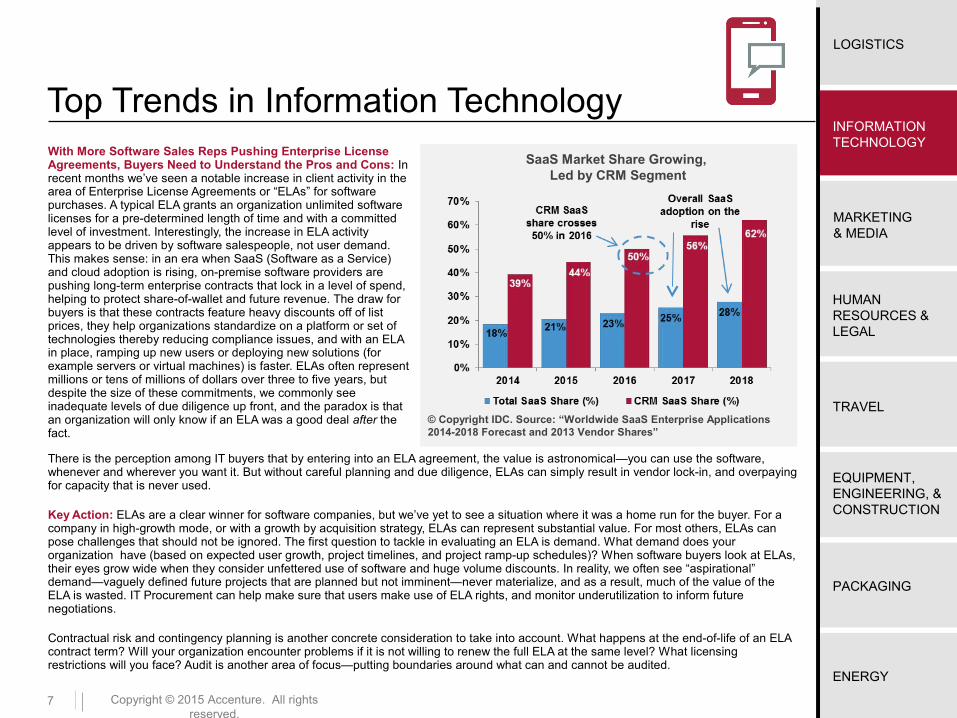
SaaS Market Share Growing, Led by CRM Segment
With More Software Sales Reps Pushing Enterprise License Agreements, Buyers Need to Understand the Pros and Cons: In recent months we’ve seen a notable increase in client activity in the area of Enterprise License Agreements or “ELAs” for software purchases. A typical ELA grants an organization unlimited software licenses for a pre-determined length of time and with a committed level of investment. Interestingly, the increase in ELA activity appears to be driven by software salespeople, not user demand. This makes sense: in an era when SaaS (Software as a Service) and cloud adoption is rising, on-premise software providers are pushing long-term enterprise contracts that lock in a level of spend, helping to protect share-of-wallet and future revenue. The draw for buyers is that these contracts feature heavy discounts off of list prices, they help organizations standardize on a platform or set of technologies thereby reducing compliance issues, and with an ELA in place, ramping up new users or deploying new solutions (for example servers or virtual machines) is faster. ELAs often represent millions or tens of millions of dollars over three to five years, but despite the size of these commitments, we commonly see inadequate levels of due diligence up front, and the paradox is that an organization will only know if an ELA was a good deal after the fact.
There is the perception among IT buyers that by entering into an ELA agreement, the value is astronomical—you can use the software, whenever and wherever you want it. But without careful planning and due diligence, ELAs can simply result in vendor lock-in, and overpaying for capacity that is never used.
Key Action: ELAs are a clear winner for software companies, but we’ve yet to see a situation where it was a home run for the buyer. For a company in high-growth mode, or with a growth by acquisition strategy, ELAs can represent substantial value. For most others, ELAs can pose challenges that should not be ignored. The first question to tackle in evaluating an ELA is demand. What demand does your organization have (based on expected user growth, project timelines, and project ramp-up schedules)? When software buyers look at ELAs, their eyes grow wide when they consider unfettered use of software and huge volume discounts. In reality, we often see “aspirational” demand—vaguely defined future projects that are planned but not imminent—never materialize, and as a result, much of the value of the ELA is wasted. IT Procurement can help make sure that users make use of ELA rights, and monitor underutilization to inform future negotiations.
Contractual risk and contingency planning is another concrete consideration to take into account. What happens at the end-of-life of an ELA contract term? Will your organization encounter problems if it is not willing to renew the full ELA at the same level? What licensing restrictions will you face? Audit is another area of focus—putting boundaries around what can and cannot be audited.
8
ENERGY
EQUIPMENT, ENGINEERING, & CONSTRUCTION
TRAVEL
HUMAN RESOURCES & LEGAL
MARKETING & MEDIA
LOGISTICS
INFORMATION TECHNOLOGY
PACKAGING
Copyright © 2015 Accenture. All rights reserved.
Top Trends in Marketing and Media
Source: eMarketer
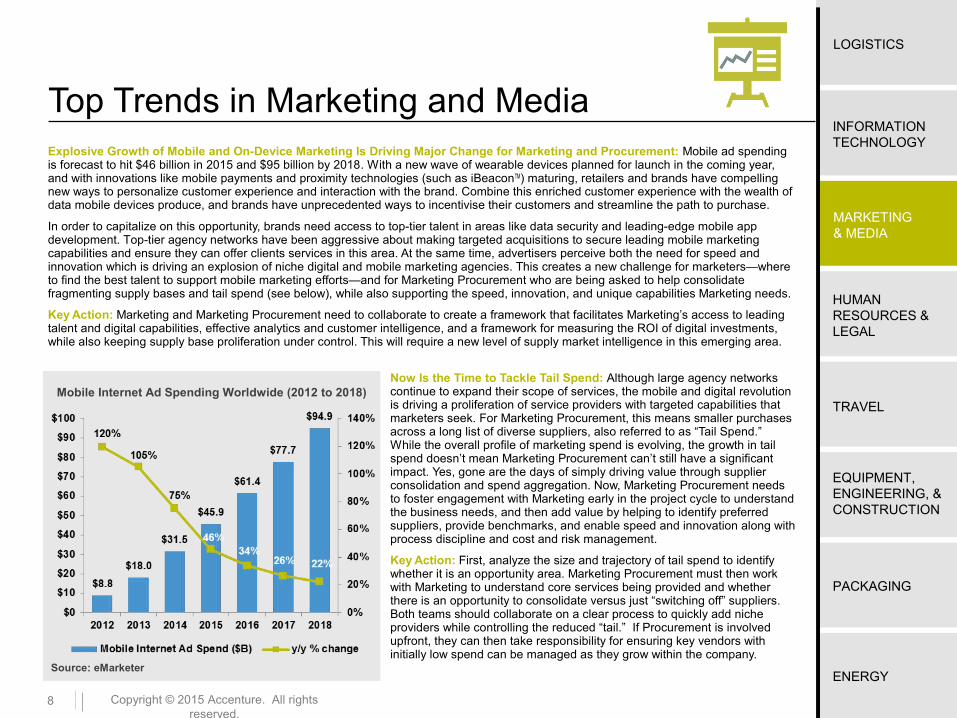
Mobile Internet Ad Spending Worldwide (2012 to 2018)
Explosive Growth of Mobile and On-Device Marketing Is Driving Major Change for Marketing and Procurement: Mobile ad spending is forecast to hit $46 billion in 2015 and $95 billion by 2018. With a new wave of wearable devices planned for launch in the coming year, and with innovations like mobile payments and proximity technologies (such as iBeaconTM) maturing, retailers and brands have compelling new ways to personalize customer experience and interaction with the brand. Combine this enriched customer experience with the wealth of data mobile devices produce, and brands have unprecedented ways to incentivise their customers and streamline the path to purchase.
In order to capitalize on this opportunity, brands need access to top-tier talent in areas like data security and leading-edge mobile app development. Top-tier agency networks have been aggressive about making targeted acquisitions to secure leading mobile marketing capabilities and ensure they can offer clients services in this area. At the same time, advertisers perceive both the need for speed and innovation which is driving an explosion of niche digital and mobile marketing agencies. This creates a new challenge for marketers—where to find the best talent to support mobile marketing efforts—and for Marketing Procurement who are being asked to help consolidate fragmenting supply bases and tail spend (see below), while also supporting the speed, innovation, and unique capabilities Marketing needs.
Key Action: Marketing and Marketing Procurement need to collaborate to create a framework that facilitates Marketing’s access to leading talent and digital capabilities, effective analytics and customer intelligence, and a framework for measuring the ROI of digital investments, while also keeping supply base proliferation under control. This will require a new level of supply market intelligence in this emerging area.
Now Is the Time to Tackle Tail Spend: Although large agency networks continue to expand their scope of services, the mobile and digital revolution is driving a proliferation of service providers with targeted capabilities that marketers seek. For Marketing Procurement, this means smaller purchases across a long list of diverse suppliers, also referred to as “Tail Spend.” While the overall profile of marketing spend is evolving, the growth in tail spend doesn’t mean Marketing Procurement can’t still have a significant impact. Yes, gone are the days of simply driving value through supplier consolidation and spend aggregation. Now, Marketing Procurement needs to foster engagement with Marketing early in the project cycle to understand the business needs, and then add value by helping to identify preferred suppliers, provide benchmarks, and enable speed and innovation along with process discipline and cost and risk management.
Key Action: First, analyze the size and trajectory of tail spend to identify whether it is an opportunity area. Marketing Procurement must then work with Marketing to understand core services being provided and whether there is an opportunity to consolidate versus just “switching off” suppliers. Both teams should collaborate on a clear process to quickly add niche providers while controlling the reduced “tail.” If Procurement is involved upfront, they can then take responsibility for ensuring key vendors with initially low spend can be managed as they grow within the company.
9
ENERGY
EQUIPMENT, ENGINEERING, & CONSTRUCTION
TRAVEL
HUMAN RESOURCES & LEGAL
MARKETING & MEDIA
LOGISTICS
INFORMATION TECHNOLOGY
PACKAGING
Copyright © 2015 Accenture. All rights reserved.
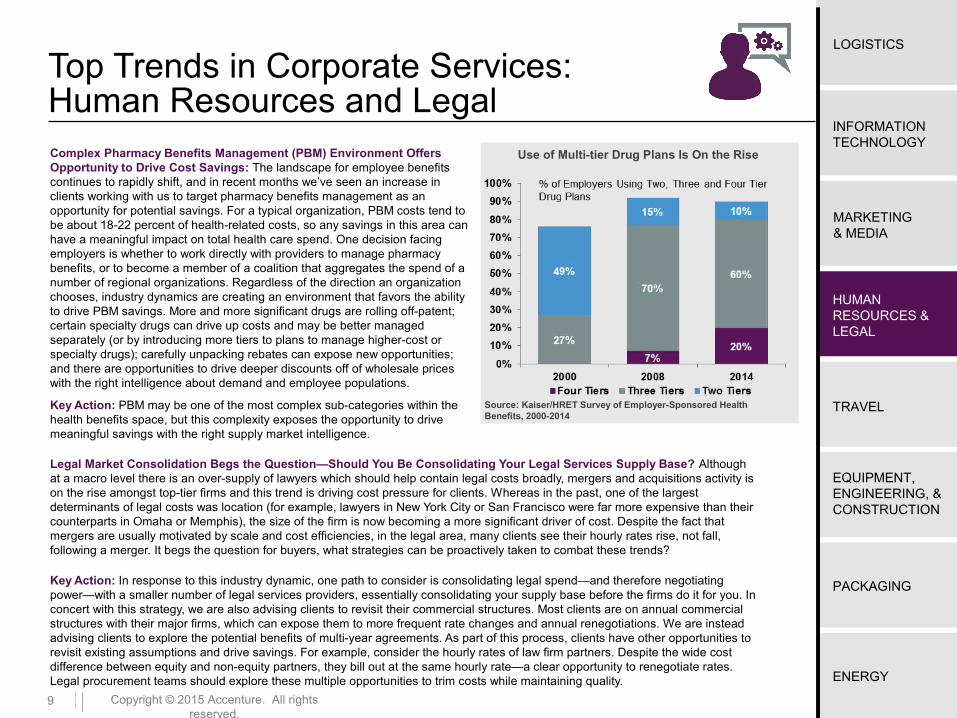
Top Trends in Corporate Services: Human Resources and LegalComplex Pharmacy Benefits Management (PBM) Environment Offers Opportunity to Drive Cost Savings: The landscape for employee benefits continues to rapidly shift, and in recent months we’ve seen an increase in clients working with us to target pharmacy benefits management as an opportunity for potential savings. For a typical organization, PBM costs tend to be about 18-22 percent of health-related costs, so any savings in this area can have a meaningful impact on total health care spend. One decision facing employers is whether to work directly with providers to manage pharmacy benefits, or to become a member of a coalition that aggregates the spend of a number of regional organizations. Regardless of the direction an organization chooses, industry dynamics are creating an environment that favors the ability to drive PBM savings. More and more significant drugs are rolling off-patent; certain specialty drugs can drive up costs and may be better managed separately (or by introducing more tiers to plans to manage higher-cost or specialty drugs); carefully unpacking rebates can expose new opportunities; and there are opportunities to drive deeper discounts off of wholesale prices with the right intelligence about demand and employee populations.
Key Action: PBM may be one of the most complex sub-categories within the health benefits space, but this complexity exposes the opportunity to drive meaningful savings with the right supply market intelligence.
Legal Market Consolidation Begs the Question—Should You Be Consolidating Your Legal Services Supply Base? Although at a macro level there is an over-supply of lawyers which should help contain legal costs broadly, mergers and acquisitions activity is on the rise amongst top-tier firms and this trend is driving cost pressure for clients. Whereas in the past, one of the largest determinants of legal costs was location (for example, lawyers in New York City or San Francisco were far more expensive than their counterparts in Omaha or Memphis), the size of the firm is now becoming a more significant driver of cost. Despite the fact that mergers are usually motivated by scale and cost efficiencies, in the legal area, many clients see their hourly rates rise, not fall, following a merger. It begs the question for buyers, what strategies can be proactively taken to combat these trends?
Key Action: In response to this industry dynamic, one path to consider is consolidating legal spend—and therefore negotiating power—with a smaller number of legal services providers, essentially consolidating your supply base before the firms do it for you. In concert with this strategy, we are also advising clients to revisit their commercial structures. Most clients are on annual commercial structures with their major firms, which can expose them to more frequent rate changes and annual renegotiations. We are instead advising clients to explore the potential benefits of multi-year agreements. As part of this process, clients have other opportunities to revisit existing assumptions and drive savings. For example, consider the hourly rates of law firm partners. Despite the wide cost difference between equity and non-equity partners, they bill out at the same hourly rate—a clear opportunity to renegotiate rates. Legal procurement teams should explore these multiple opportunities to trim costs while maintaining quality.
Use of Multi-tier Drug Plans Is On the Rise
Source: Kaiser/HRET Survey of Employer-Sponsored Health Benefits, 2000-2014
10
ENERGY
EQUIPMENT, ENGINEERING, & CONSTRUCTION
TRAVEL
HUMAN RESOURCES & LEGAL
MARKETING & MEDIA
LOGISTICS
INFORMATION TECHNOLOGY
PACKAGING
Copyright © 2015 Accenture. All rights reserved.
Top Trends in Travel
Source: Accenture
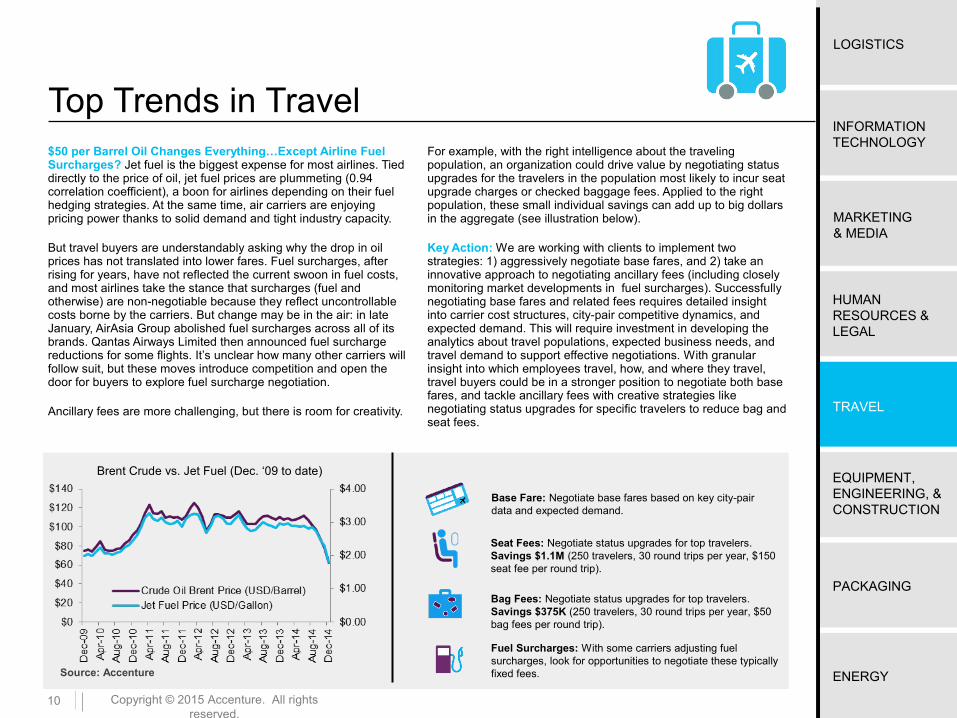
Base Fare: Negotiate base fares based on key city-pair data and expected demand.
Seat Fees: Negotiate status upgrades for top travelers. Savings $1.1M (250 travelers, 30 round trips per year, $150 seat fee per round trip).
Bag Fees: Negotiate status upgrades for top travelers. Savings $375K (250 travelers, 30 round trips per year, $50 bag fees per round trip).
Fuel Surcharges: With some carriers adjusting fuel surcharges, look for opportunities to negotiate these typically fixed fees.
Brent Crude vs. Jet Fuel (Dec. ‘09 to date)
$50 per Barrel Oil Changes Everything…Except Airline Fuel Surcharges? Jet fuel is the biggest expense for most airlines. Tied directly to the price of oil, jet fuel prices are plummeting (0.94 correlation coefficient), a boon for airlines depending on their fuel hedging strategies. At the same time, air carriers are enjoying pricing power thanks to solid demand and tight industry capacity.
But travel buyers are understandably asking why the drop in oil prices has not translated into lower fares. Fuel surcharges, after rising for years, have not reflected the current swoon in fuel costs, and most airlines take the stance that surcharges (fuel and otherwise) are non-negotiable because they reflect uncontrollable costs borne by the carriers. But change may be in the air: in late January, AirAsia Group abolished fuel surcharges across all of its brands. Qantas Airways Limited then announced fuel surcharge reductions for some flights. It’s unclear how many other carriers will follow suit, but these moves introduce competition and open the door for buyers to explore fuel surcharge negotiation.
Ancillary fees are more challenging, but there is room for creativity.
For example, with the right intelligence about the traveling population, an organization could drive value by negotiating status upgrades for the travelers in the population most likely to incur seat upgrade charges or checked baggage fees. Applied to the right population, these small individual savings can add up to big dollars in the aggregate (see illustration below).
Key Action: We are working with clients to implement two strategies: 1) aggressively negotiate base fares, and 2) take an innovative approach to negotiating ancillary fees (including closely monitoring market developments in fuel surcharges). Successfully negotiating base fares and related fees requires detailed insight into carrier cost structures, city-pair competitive dynamics, and expected demand. This will require investment in developing the analytics about travel populations, expected business needs, and travel demand to support effective negotiations. With granular insight into which employees travel, how, and where they travel, travel buyers could be in a stronger position to negotiate both base fares, and tackle ancillary fees with creative strategies like negotiating status upgrades for specific travelers to reduce bag and seat fees.
11
ENERGY
EQUIPMENT, ENGINEERING, & CONSTRUCTION
TRAVEL
HUMAN RESOURCES & LEGAL
MARKETING & MEDIA
LOGISTICS
INFORMATION TECHNOLOGY
PACKAGING
Copyright © 2015 Accenture. All rights reserved.
Top Trends in Equipment, Engineering, and Construction
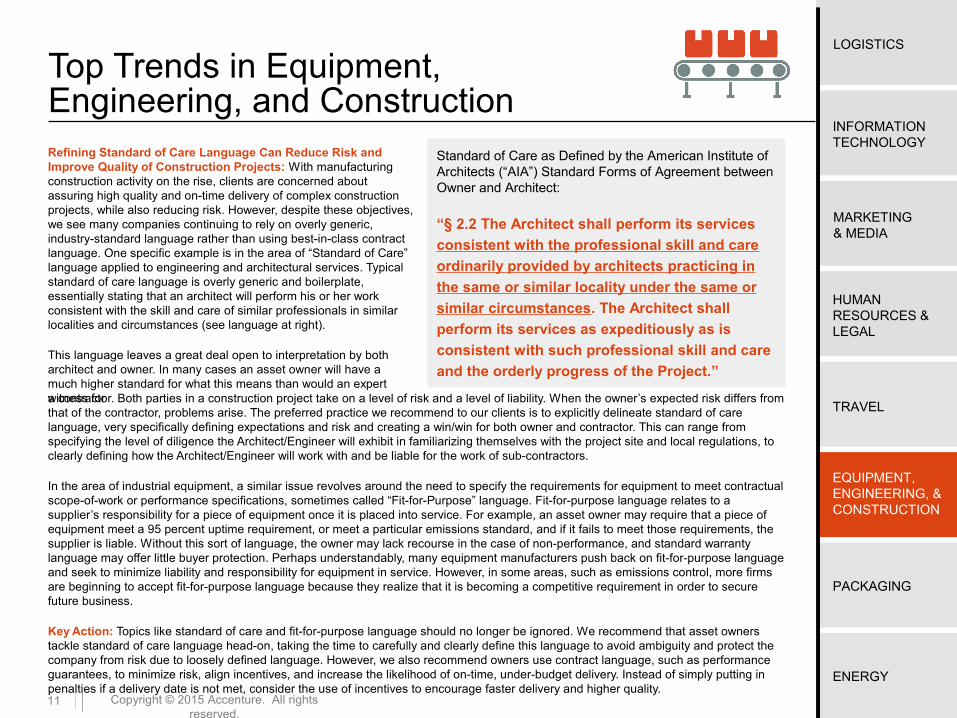
Standard of Care as Defined by the American Institute of Architects (“AIA”) Standard Forms of Agreement between Owner and Architect:
Ҥ 2.2 The Architect shall perform its services
consistent with the professional skill and care
ordinarily provided by architects practicing in
the same or similar locality under the same or
similar circumstances. The Architect shall
perform its services as expeditiously as is
consistent with such professional skill and care
and the orderly progress of the Project.”
Refining Standard of Care Language Can Reduce Risk and Improve Quality of Construction Projects: With manufacturing construction activity on the rise, clients are concerned about assuring high quality and on-time delivery of complex construction projects, while also reducing risk. However, despite these objectives, we see many companies continuing to rely on overly generic, industry-standard language rather than using best-in-class contract language. One specific example is in the area of “Standard of Care” language applied to engineering and architectural services. Typical standard of care language is overly generic and boilerplate, essentially stating that an architect will perform his or her work consistent with the skill and care of similar professionals in similar localities and circumstances (see language at right).
This language leaves a great deal open to interpretation by both architect and owner. In many cases an asset owner will have a much higher standard for what this means than would an expert witness fora contractor. Both parties in a construction project take on a level of risk and a level of liability. When the owner’s expected risk differs from that of the contractor, problems arise. The preferred practice we recommend to our clients is to explicitly delineate standard of care language, very specifically defining expectations and risk and creating a win/win for both owner and contractor. This can range from specifying the level of diligence the Architect/Engineer will exhibit in familiarizing themselves with the project site and local regulations, to clearly defining how the Architect/Engineer will work with and be liable for the work of sub-contractors.
In the area of industrial equipment, a similar issue revolves around the need to specify the requirements for equipment to meet contractual scope-of-work or performance specifications, sometimes called “Fit-for-Purpose” language. Fit-for-purpose language relates to a supplier’s responsibility for a piece of equipment once it is placed into service. For example, an asset owner may require that a piece of equipment meet a 95 percent uptime requirement, or meet a particular emissions standard, and if it fails to meet those requirements, the supplier is liable. Without this sort of language, the owner may lack recourse in the case of non-performance, and standard warranty language may offer little buyer protection. Perhaps understandably, many equipment manufacturers push back on fit-for-purpose language and seek to minimize liability and responsibility for equipment in service. However, in some areas, such as emissions control, more firms are beginning to accept fit-for-purpose language because they realize that it is becoming a competitive requirement in order to secure future business.
Key Action: Topics like standard of care and fit-for-purpose language should no longer be ignored. We recommend that asset owners tackle standard of care language head-on, taking the time to carefully and clearly define this language to avoid ambiguity and protect the company from risk due to loosely defined language. However, we also recommend owners use contract language, such as performance guarantees, to minimize risk, align incentives, and increase the likelihood of on-time, under-budget delivery. Instead of simply putting in penalties if a delivery date is not met, consider the use of incentives to encourage faster delivery and higher quality.
12
ENERGY
EQUIPMENT, ENGINEERING, & CONSTRUCTION
TRAVEL
HUMAN RESOURCES & LEGAL
MARKETING & MEDIA
LOGISTICS
INFORMATION TECHNOLOGY
PACKAGING
Copyright © 2015 Accenture. All rights reserved.
Top Trends in Packaging
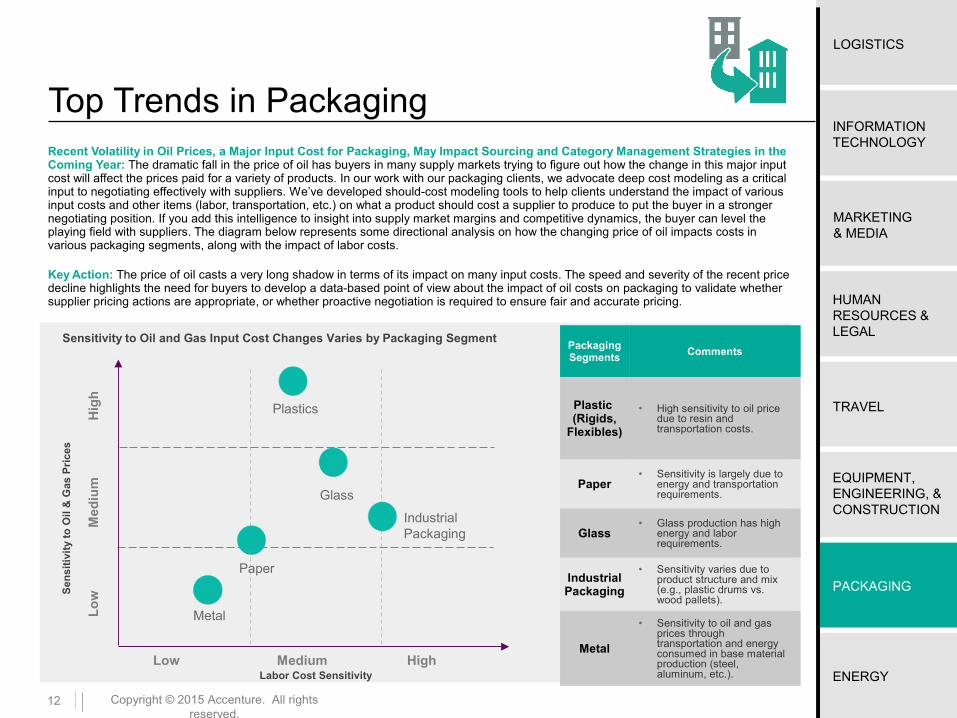
Sensitivity to Oil and Gas Input Cost Changes Varies by Packaging Segment
Sen
sit
ivit
y to
Oil
& G
as P
ric
es
Low HighMedium
Med
ium
Labor Cost Sensitivity
Hig
hL
ow
Paper
Plastics
Industrial Packaging
Metal
Glass
Packaging Segments
Comments
Plastic (Rigids,
Flexibles)
• High sensitivity to oil price due to resin and transportation costs.
Paper• Sensitivity is largely due to
energy and transportation requirements.
Glass• Glass production has high
energy and labor requirements.
Industrial Packaging
• Sensitivity varies due to product structure and mix (e.g., plastic drums vs. wood pallets).
Metal
• Sensitivity to oil and gas prices through transportation and energy consumed in base material production (steel, aluminum, etc.).
Recent Volatility in Oil Prices, a Major Input Cost for Packaging, May Impact Sourcing and Category Management Strategies in the Coming Year: The dramatic fall in the price of oil has buyers in many supply markets trying to figure out how the change in this major input cost will affect the prices paid for a variety of products. In our work with our packaging clients, we advocate deep cost modeling as a critical input to negotiating effectively with suppliers. We’ve developed should-cost modeling tools to help clients understand the impact of various input costs and other items (labor, transportation, etc.) on what a product should cost a supplier to produce to put the buyer in a stronger negotiating position. If you add this intelligence to insight into supply market margins and competitive dynamics, the buyer can level the playing field with suppliers. The diagram below represents some directional analysis on how the changing price of oil impacts costs in various packaging segments, along with the impact of labor costs.
Key Action: The price of oil casts a very long shadow in terms of its impact on many input costs. The speed and severity of the recent price decline highlights the need for buyers to develop a data-based point of view about the impact of oil costs on packaging to validate whether supplier pricing actions are appropriate, or whether proactive negotiation is required to ensure fair and accurate pricing.
13
ENERGY
EQUIPMENT, ENGINEERING, & CONSTRUCTION
TRAVEL
HUMAN RESOURCES & LEGAL
MARKETING & MEDIA
LOGISTICS
INFORMATION TECHNOLOGY
PACKAGING
Copyright © 2015 Accenture. All rights reserved.
Top Trends in Energy
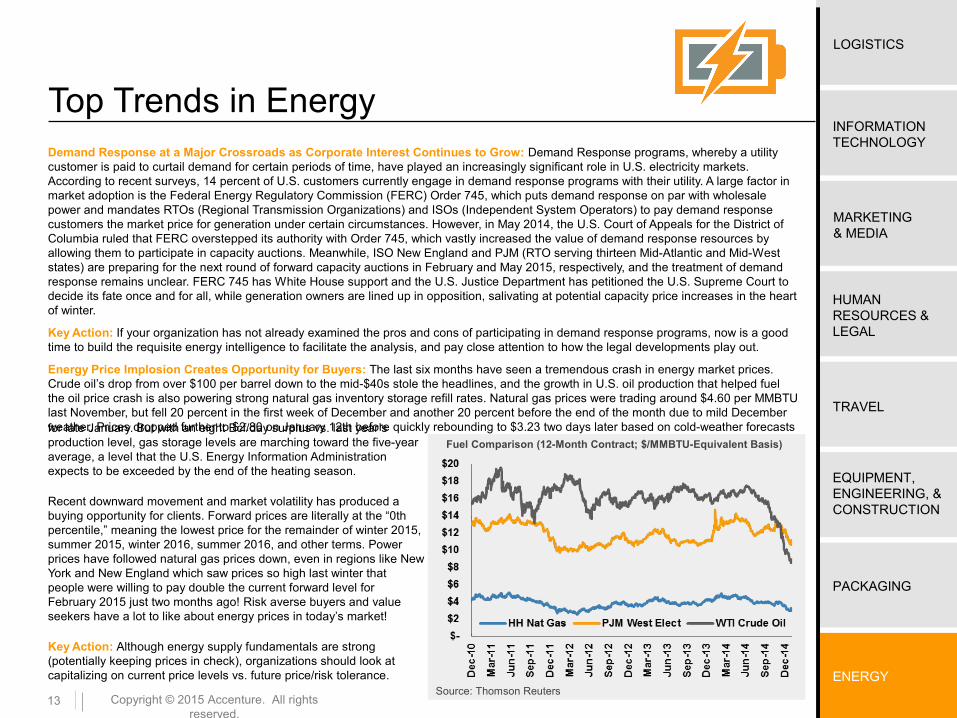
Fuel Comparison (12-Month Contract; $/MMBTU-Equivalent Basis)
Source: Thomson Reuters
Demand Response at a Major Crossroads as Corporate Interest Continues to Grow: Demand Response programs, whereby a utility customer is paid to curtail demand for certain periods of time, have played an increasingly significant role in U.S. electricity markets. According to recent surveys, 14 percent of U.S. customers currently engage in demand response programs with their utility. A large factor in market adoption is the Federal Energy Regulatory Commission (FERC) Order 745, which puts demand response on par with wholesale power and mandates RTOs (Regional Transmission Organizations) and ISOs (Independent System Operators) to pay demand response customers the market price for generation under certain circumstances. However, in May 2014, the U.S. Court of Appeals for the District of Columbia ruled that FERC overstepped its authority with Order 745, which vastly increased the value of demand response resources by allowing them to participate in capacity auctions. Meanwhile, ISO New England and PJM (RTO serving thirteen Mid-Atlantic and Mid-West states) are preparing for the next round of forward capacity auctions in February and May 2015, respectively, and the treatment of demand response remains unclear. FERC 745 has White House support and the U.S. Justice Department has petitioned the U.S. Supreme Court to decide its fate once and for all, while generation owners are lined up in opposition, salivating at potential capacity price increases in the heart of winter.
Key Action: If your organization has not already examined the pros and cons of participating in demand response programs, now is a good time to build the requisite energy intelligence to facilitate the analysis, and pay close attention to how the legal developments play out.
Energy Price Implosion Creates Opportunity for Buyers: The last six months have seen a tremendous crash in energy market prices. Crude oil’s drop from over $100 per barrel down to the mid-$40s stole the headlines, and the growth in U.S. oil production that helped fuel the oil price crash is also powering strong natural gas inventory storage refill rates. Natural gas prices were trading around $4.60 per MMBTU last November, but fell 20 percent in the first week of December and another 20 percent before the end of the month due to mild December weather. Prices dropped further to $2.80 on January 12th before quickly rebounding to $3.23 two days later based on cold-weather forecastsfor late January. But with an eight Bcf/day surplus vs. last year’s production level, gas storage levels are marching toward the five-year average, a level that the U.S. Energy Information Administration expects to be exceeded by the end of the heating season.
Recent downward movement and market volatility has produced a buying opportunity for clients. Forward prices are literally at the “0th percentile,” meaning the lowest price for the remainder of winter 2015, summer 2015, winter 2016, summer 2016, and other terms. Power prices have followed natural gas prices down, even in regions like New York and New England which saw prices so high last winter that people were willing to pay double the current forward level for February 2015 just two months ago! Risk averse buyers and value seekers have a lot to like about energy prices in today’s market!
Key Action: Although energy supply fundamentals are strong (potentially keeping prices in check), organizations should look at capitalizing on current price levels vs. future price/risk tolerance.
14 Copyright © 2015 Accenture. All rights reserved.
Sources and ReferencesEXECUTIVE SUMMARY:
• International Monetary Fund World Economic Update, “Cross Currents,” January 2015. Retrieved from: http://www.imf.org/external/pubs/ft/weo/2015/update/01/
• FactSet Buyback Quarterly: December 16, 2014, Retrieved from: http://www.factset.com/websitefiles/PDFs/buyback
• FactSet Dividend Quarterly: December 18, 2014, Retrieved from: http://www.factset.com/websitefiles/PDFs/dividend
• FactSet Cash & Investment Quarterly: December 23, 2014, Retrieved from: http://www.factset.com/websitefiles/PDFs/cashinvestment
• FactSet Earnings Insight: January 16, 2015, Retrieved from: http://www.factset.com/websitefiles/PDFs/cashinvestment
LOGISTICS:
• U.S. Energy Information Data. Retrieved from: http://www.indexmundi.com/commodities/?commodity=jet-fuel&months=60&commodity=crude-oil-brent
INFORMATION TECHNOLOGY:
• Dover, Christine, © Copyright IDC. Source: “Worldwide SaaS Enterprise Applications 2014-2018 Forecast and 2013 Vendor Shares,” December 18, 2014. Retrieved from: http://www.idc.com/getdoc.jsp?sectionId=252568-S-0004&containerId=252568&elementId=252568-F-0002
MARKETING:
• eMarketer, “Driven by Facebook and Google, Mobile Ad Market Soars 105% ni 2013.” Retrieved from: http://www.emarketer.com/Article/Driven-by-Facebook-Google-Mobile-Ad-Market-Soars-10537-2013/1010690
TRAVEL:
• Huang, Clement, Business Traveller Asia, “No fuel surcharges for AirAsia.” Retrieved from: http://www.businesstraveller.asia/asia-pacific/news/no-fuel-surcharge-for-air-asia
• Huang, Clement, Business Traveller Asia, “Qantas to lower fuel surcharges for fares.” Retrieved from: http://www.businesstraveller.asia/asia-pacific/news/qantas-to-lower-fuel-surcharge-for-fares
ENGINEERING, EQUIPMENT AND CONSTRUCTION:
• The American Institute of Architects Standard form of Agreement Between Owner and Architect. Retrieved from: http://www.aia.org/contractdocs/AIAB099316

15 Copyright © 2015 Accenture. All rights reserved.
About Accenture
Copyright © 2015 Accenture.
All rights reserved.
Accenture, its logo, and High performance. Delivered. are trademarks of Accenture.
This document makes descriptive reference to trademarks that may be owned by others. The use of such trademarks herein is not an assertion of ownership of such trademarks by Accenture and is not intended to represent or imply the existence of an association between Accenture and the lawful owners of such trademarks.
Accenture is a global management consulting, technology services and outsourcing company, with approximately 319,000 people serving clients in more than 120 countries. Combining unparalleled experience, comprehensive capabilities across all industries and business functions, and extensive research on the world’s most successful companies, Accenture collaborates with clients to help them become high-performance businesses and governments. The company generated net revenues of US$30.0 billion for the fiscal year ended Aug. 31, 2014. Its home page is www.accenture.com.