spend trends report - accenture filespend trends report, a combination of the accenture supply watch...
TRANSCRIPT

Spend Trends Report Q2 2014

2 Copyright © 2014 Accenture. All rights reserved.
Insights Born from Experience
We are pleased to bring you the newest edition of the Accenture
Spend Trends Report, a combination of the Accenture Supply Watch
and Procurian Spend Trends Report, which reflects the best thinking,
insights, and intelligence from our global team of more than one
thousand category specialists.
Our team helps more than one hundred clients optimize billions of
dollars of spend across the globe. This means they are in each major
supply market dozens, sometimes hundreds of times a year. The
result: powerful aggregate supply market intelligence and a unique
set of cross-client spending and spend management insights.
With this unique set of intelligence and insight, we have compiled a
summary of the top trends we are observing in each major area of
spend—whether changing market dynamics or new spend
management strategies—and offer new initiatives to consider.
Our core commitment is to deliver actionable insights and market
intelligence to you, our clients. We welcome and encourage your
feedback to help make this report more valuable to you.
Keith Hausmann
Managing Director, Procurement
Accenture Operations
Author:
Mark Hillman—Manager, Market Insights & Analysis—Accenture Operations
Category Specialist Contributors:
Logistics—Ed Sands, Scott Youngs, Matt Harris
IT/Telecom—Ryan Shadle, Gunasheel Krishnamurthy
Marketing—James Keetley, Suzanne Liss, Dave Mula
Media—Perianne Grignon
Corporate Professional Services-Audit & Risk—David White, Daniel Correa
Travel—Dan Maschoff, Allan Brown
Equipment, Engineering, & Construction (EEC)—Rod Freeman
Industrial & Maintenance, Repair & Operations (MRO)—Rick Husovsky, Terry
Briganti, Barbara Moser
Energy—Gary Landsberg, Cobb Pearson, Jille Luijckx, Francisco Iglesias
CATEGORY EXPERTISE ANNUAL
PROJECTS
SUPPLY MARKET
EXPERTS
MRO / Facilities 1,125 ~ 80
Logistics 203 ~ 40
Marketing 1,197 ~ 80
Corp. Services 1,796 ~ 70
IT/Telecom 2,460 ~ 120
Direct Materials 160 ~ 20
Capital (EEC) 1,562 ~ 40
Travel 456 ~ 30
Energy / Sustainability 965 ~ 40
Sourcing & Contract
Management Support -- ~ 520
TOTAL 9,924 ~ 1,040

3 Copyright © 2014 Accenture. All rights reserved.
Executive Summary
Notable Macro Trends from the Second Quarter:
• Labor markets continue to slowly improve. As
unemployment rates fall (U.S. 6.3 percent; Eurozone
11.5 percent), pockets of wage inflation are emerging in
sectors like manufacturing, technology and logistics.
• As corporate transactions activity increases (mergers &
acquisitions [M&A] activity accelerated in Q2, rising 75
percent year-over-year in the first half of 2014),
executives are focusing on risk management while
monitoring regulation that could impact business
strategy (e.g. proposals to limit tax inversion strategies).
• Business capital investment is finally materializing (up
more than 6 percent in 1Q 2014 vs. sub-1.5 percent in
all of 2013). With high corporate cash levels, low
interest rates, and increasing capacity utilization, the
capital investment cycle looks sustainable, potentially
pressuring input costs including construction materials.
• Although energy prices remained volatile, oil and gas
prices pulled back in recent weeks despite rising
geopolitical tension. The recent pull-back provides some
respite for energy users, and the opportunity to
reexamine both demand and supply-side strategies.
Despite geopolitical and weather-related macro shocks in the first half of 2014, forward-looking indicators continue to point
to a slow-but-steady global economic recovery. Global mergers and acquisitions (M&A) activity accelerated in the second
quarter. Business capital spending has also improved in 2014 and near-term indicators including business credit issuance
and forward-looking sentiment indicators all point to improving demand ahead. Concurrently, more commodity and labor
cost pressure is materializing, requiring more local market knowledge and expertise to contain costs associated with
supporting growth objectives.
Q2 Spend Trends: The Big Five
• Logistics: Tightening European Markets Still Offer Savings Opportunity:
European markets face similar issues as the U.S.—aging drivers, onerous
regulation, and rising wages. But the right local market knowledge reveals
opportunities to drive cost savings in Europe’s fragmented logistics markets.
• Risk Management: Securities Actions Keep Enterprise Risk Management on
the CFO Front Burner: More clients are taking a fresh look at evaluating their Total
Cost of Risk, and applying a more rigorous and structured review process to ensure
they are minimizing risk exposure with best-in-class fees and rate structures.
• Travel: Evolving Regulations Serve as Reminder to Reexamine Corporate Card
Agreements: Corporate credit cards represent a low-friction change opportunity
that, if executed effectively, can yield significant savings. Proposed European
Parliament regulations on card fees are a reminder to reexamine card agreements.
• Capital: Growing Construction Demand Puts Pressure on Input Prices:
Increasing investment in manufacturing capacity and recovering public sector
infrastructure funding are driving inflation in building materials like concrete, pushing
buyers to evaluate long and short-term contracting strategies.
• Energy: Demand Management Techniques Grow in Importance: As more
renewable energy sources come online, power producers are responding with more
real-time pricing and demand response programs—creating new opportunities for
buyers to link demand-side intelligence with buy-side procurement to drive savings.

4 Copyright © 2014 Accenture. All rights reserved.
Macroeconomic Backdrop
More Signs of Cost Inflation Emerge Despite Economic Speed Bumps,
but Near-Term Opportunities Exist: As the economic recovery has
progressed and companies have begun to slowly increase investment to
meet demand, signs of inflation are emerging. U.S. unemployment is now
down to 6.1 percent while Eurozone unemployment hovers at 11.6 percent,
and several sectors in the U.S. are seeing labor cost pressure—namely
logistics, tech, manufacturing, and oil & gas related occupations. A July
2014 survey by The National Association of Business Economics (NABE)
found that 43 percent of respondents’ firms had increased wages, up from
35 percent in an April 2014 survey—and for the first time since October
2012, no respondents reported declining wages at their companies.
Europe’s recovery is trailing that of the U.S., but similar inflationary
pressures are present in sectors like logistics. Armed with the right local
market intelligence, however, savings opportunities remain (see page 7).
Energy Prices Continue Long-Term Uptrend, but Short-Term Pull-
Backs Provide Opportunity to Re-Assess Energy Agreements: Energy
prices are another area experiencing inflation. As the charts at right depict,
oil and gas prices have risen steadily over the past several years. That
trend is likely to continue—The International Energy Agency (IEA) forecasts
oil demand will accelerate in 2015 as macroeconomic growth improves.
However, oil and natural gas prices have pulled back in recent weeks,
offering energy users some short-term relief and the opportunity to deploy
layered hedging strategies to match expected demand with price risk
tolerance (see page 14).
Cost pressures are also beginning to emerge in construction materials like
concrete as construction spending continues to rebound and public
infrastructure spending recovers (see page 12). To combat this combination
of increasing labor, energy, and input costs, directing more investment
dollars toward productivity-enhancing capital equipment looks like an
increasingly appealing choice for corporate executives, and there are signs
that capital spending is finally starting to rebound after years of slow growth
(see next page).
Source: US Energy Information Agency
Source: US Energy Information Agency
$50
$60
$70
$80
$90
$100
$110
$120
$130
Ju
l-09
Jan
-10
Ju
l-10
Jan
-11
Ju
l-11
Jan
-12
Ju
l-12
Jan
-13
Ju
l-13
Jan
-14
Ju
l-14
Cushing (U.S.) vs. Brent (Europe) Crude Oil Weekly Futures Contract Price (past five years)
Cushing Oil Futures Contract Europe Brent Spot Price FOB
$0
$1
$2
$3
$4
$5
$6
$7
Ju
l-09
Jan
-10
Ju
l-10
Jan
-11
Ju
l-11
Jan
-12
Ju
l-12
Jan
-13
Ju
l-13
Jan
-14
Ju
l-14
Henry Hub Weekly Natural Gas Price (past five years)
5 Copyright © 2014 Accenture. All rights reserved.
$200
$300
$400
$500
$600
$700
Repurchases Capex Dividends
2011 2012 2013 2014E
Macroeconomic Backdrop
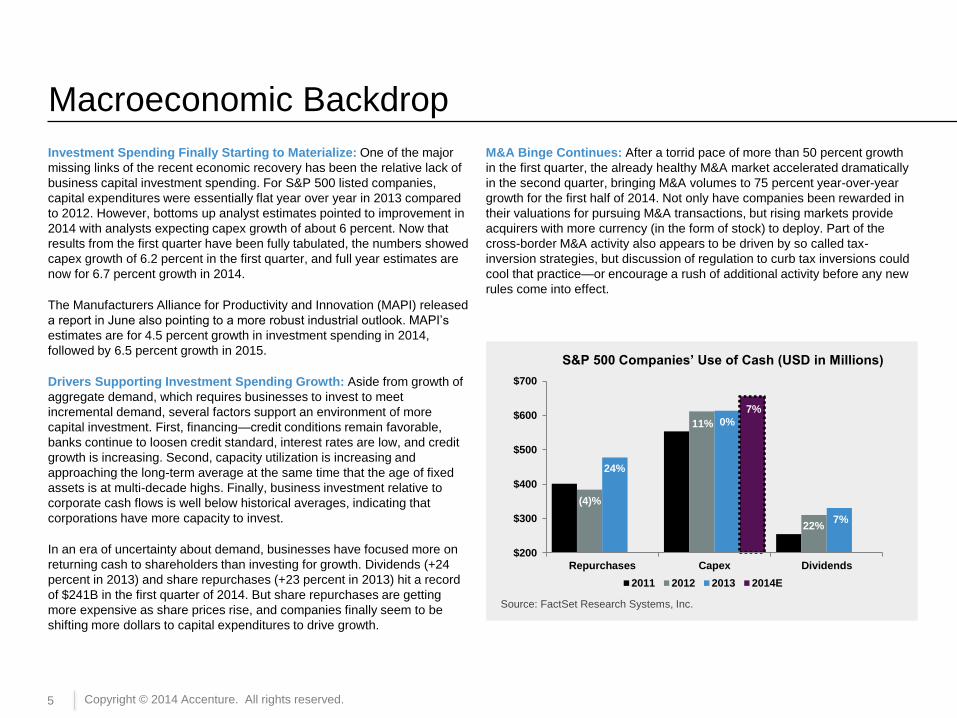
Investment Spending Finally Starting to Materialize: One of the major
missing links of the recent economic recovery has been the relative lack of
business capital investment spending. For S&P 500 listed companies,
capital expenditures were essentially flat year over year in 2013 compared
to 2012. However, bottoms up analyst estimates pointed to improvement in
2014 with analysts expecting capex growth of about 6 percent. Now that
results from the first quarter have been fully tabulated, the numbers showed
capex growth of 6.2 percent in the first quarter, and full year estimates are
now for 6.7 percent growth in 2014.
The Manufacturers Alliance for Productivity and Innovation (MAPI) released
a report in June also pointing to a more robust industrial outlook. MAPI’s
estimates are for 4.5 percent growth in investment spending in 2014,
followed by 6.5 percent growth in 2015.
Drivers Supporting Investment Spending Growth: Aside from growth of
aggregate demand, which requires businesses to invest to meet
incremental demand, several factors support an environment of more
capital investment. First, financing—credit conditions remain favorable,
banks continue to loosen credit standard, interest rates are low, and credit
growth is increasing. Second, capacity utilization is increasing and
approaching the long-term average at the same time that the age of fixed
assets is at multi-decade highs. Finally, business investment relative to
corporate cash flows is well below historical averages, indicating that
corporations have more capacity to invest.
In an era of uncertainty about demand, businesses have focused more on
returning cash to shareholders than investing for growth. Dividends (+24
percent in 2013) and share repurchases (+23 percent in 2013) hit a record
of $241B in the first quarter of 2014. But share repurchases are getting
more expensive as share prices rise, and companies finally seem to be
shifting more dollars to capital expenditures to drive growth.
M&A Binge Continues: After a torrid pace of more than 50 percent growth
in the first quarter, the already healthy M&A market accelerated dramatically
in the second quarter, bringing M&A volumes to 75 percent year-over-year
growth for the first half of 2014. Not only have companies been rewarded in
their valuations for pursuing M&A transactions, but rising markets provide
acquirers with more currency (in the form of stock) to deploy. Part of the
cross-border M&A activity also appears to be driven by so called tax-
inversion strategies, but discussion of regulation to curb tax inversions could
cool that practice—or encourage a rush of additional activity before any new
rules come into effect.
S&P 500 Companies’ Use of Cash (USD in Millions)
(4)%
24%
11% 0%
7%
22% 7%
Source: FactSet Research Systems, Inc.
6 Copyright © 2014 Accenture. All rights reserved.
Macroeconomic Backdrop
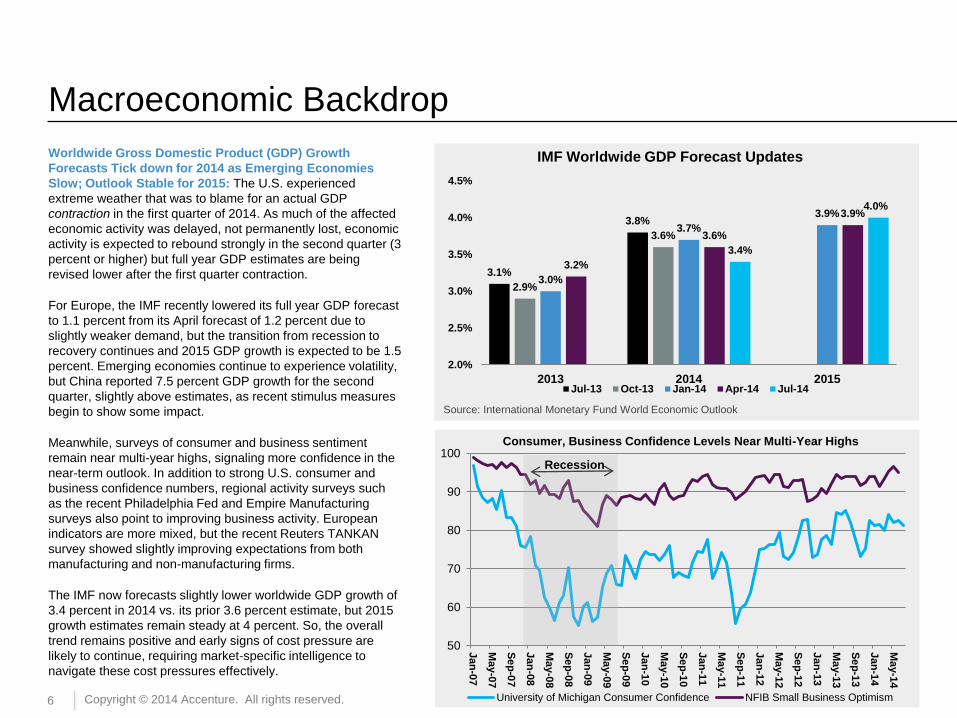
Worldwide Gross Domestic Product (GDP) Growth
Forecasts Tick down for 2014 as Emerging Economies
Slow; Outlook Stable for 2015: The U.S. experienced
extreme weather that was to blame for an actual GDP
contraction in the first quarter of 2014. As much of the affected
economic activity was delayed, not permanently lost, economic
activity is expected to rebound strongly in the second quarter (3
percent or higher) but full year GDP estimates are being
revised lower after the first quarter contraction.
For Europe, the IMF recently lowered its full year GDP forecast
to 1.1 percent from its April forecast of 1.2 percent due to
slightly weaker demand, but the transition from recession to
recovery continues and 2015 GDP growth is expected to be 1.5
percent. Emerging economies continue to experience volatility,
but China reported 7.5 percent GDP growth for the second
quarter, slightly above estimates, as recent stimulus measures
begin to show some impact.
Meanwhile, surveys of consumer and business sentiment
remain near multi-year highs, signaling more confidence in the
near-term outlook. In addition to strong U.S. consumer and
business confidence numbers, regional activity surveys such
as the recent Philadelphia Fed and Empire Manufacturing
surveys also point to improving business activity. European
indicators are more mixed, but the recent Reuters TANKAN
survey showed slightly improving expectations from both
manufacturing and non-manufacturing firms.
The IMF now forecasts slightly lower worldwide GDP growth of
3.4 percent in 2014 vs. its prior 3.6 percent estimate, but 2015
growth estimates remain steady at 4 percent. So, the overall
trend remains positive and early signs of cost pressure are
likely to continue, requiring market-specific intelligence to
navigate these cost pressures effectively.
Source: International Monetary Fund World Economic Outlook
3.1%
3.8%
2.9%
3.6%
3.0%
3.7%
3.9%
3.2%
3.6%
3.9%
3.4%
4.0%
2.0%
2.5%
3.0%
3.5%
4.0%
4.5%
2013 2014 2015
IMF Worldwide GDP Forecast Updates
Jul-13 Oct-13 Jan-14 Apr-14 Jul-14
50
60
70
80
90
100
Jan
-07
Ma
y-0
7
Se
p-0
7
Jan
-08
Ma
y-0
8
Se
p-0
8
Jan
-09
Ma
y-0
9
Se
p-0
9
Jan
-10
Ma
y-1
0
Se
p-1
0
Jan
-11
Ma
y-1
1
Se
p-1
1
Jan
-12
Ma
y-1
2
Se
p-1
2
Jan
-13
Ma
y-1
3
Se
p-1
3
Jan
-14
Ma
y-1
4
Consumer, Business Confidence Levels Near Multi-Year Highs
University of Michigan Consumer Confidence NFIB Small Business Optimism
Recession

7 Copyright © 2014 Accenture. All rights reserved.
ENERGY
EQUIPMENT,
ENGINEERING, &
CONSTRUCTION
CORPORATE
SERVICES—
TRAVEL
CORPORATE
SERVICES—
AUDIT & RISK
MARKETING
& MEDIA
LOGISTICS
INFORMATION
TECHNOLOGY
INDUSTRIAL
& MRO
Top Trends in Logistics
Savings Opportunities Still Abound in Tightening European Over-the-Road Logistics Market: Does this scenario sound familiar?:
An aging driver population, increasing regulatory burdens restricting available supply of drivers and trucks leading to over-the-road
logistics cost pressure. Interestingly, many of the same issues described above, which have come together to put upward pressure on
North American over-the-road logistics costs, are also present in Europe. However, in addition to increasingly tight supply, additional
challenges are present in Europe. Namely, the European market is highly fragmented with more than six hundred thousand road freight
operators, Europe is more regional (country and region-specific carriers and rules), is more local (85 percent of goods shipped move
less that 150km), has more physical barriers (both borders and terrain), and lacks a coordinated pan-European intermodal capability.
The implication for shippers is that it takes a different sourcing approach that relies more upon local/country level market knowledge,
different contracting norms, different fuel programs, etc. to drive savings in a tightening supply environment.
Key Action: Shippers should take a rational inventory of their internal logistics market intelligence to determine if they are prepared for,
or at a disadvantage for, upcoming sourcing initiatives. Although supply-side pressures abound, we have leveraged local market
knowledge to help clients achieve savings in the 10 percent range based on recent sourcing events.
Shippers will soon be adapting to a major new dynamic in the parcel
shipping market. Earlier this year, FedEx Corporation (FedEx)
announced a new Dimensional Pricing model will apply to all shipments
starting January 1st, 2015 (formerly, dimensional pricing was only applied
to packages larger than three cubic feet). United Parcel Service (UPS)
quickly followed suit. Dimensional pricing models calculate shipping cost
based on package volume—the amount of space a package occupies in
relation to its weight. This is a major market event because the new
pricing model will affect roughly 70 percent of packages shipped by
volume today, and shippers could be looking at potential rate increases
in the range of 20 percent above current levels when the dimensional
pricing models are applied to the smaller packages they ship today. This
is before other standard rate increases and assessorial charges.
Key Action: Shippers should be working with their carrier
representatives now to understand how the new dimensional pricing
models will apply to them and what the potential impact on shipping
costs will be. In parallel, shippers should take a fresh look at their overall
delivery networks and perform a bottoms-up analysis of network and
competitive options to optimize total shipping costs.
Revised Pricing Models Take Parcel Shipping Pricing into a Whole New Dimension, Leading to Likely Higher Shipping Costs:
Source: Accenture, FedEx 2014 Rate Guide

8 Copyright © 2014 Accenture. All rights reserved.
ENERGY
EQUIPMENT,
ENGINEERING, &
CONSTRUCTION
CORPORATE
SERVICES—
TRAVEL
CORPORATE
SERVICES—
AUDIT & RISK
MARKETING
& MEDIA
LOGISTICS
INFORMATION
TECHNOLOGY
INDUSTRIAL
& MRO
Top Trends in Information Technology
Getting to Know Legal a Little Too Well? Reexamine Policies to
Get IT Agreements under Control: One challenge of IT
investments is that contracts and agreements related to IT software
and services can be so cumbersome. Is this unique to IT? To answer
that client inquiry, we analyzed our spend and project data. What we
found was illuminating: less than 15 percent of the total spend we
help clients manage is IT/Telecom-related…however, IT/Telecom-
related legal agreements account for 45 percent of the agreements
in our databases. It’s no surprise that legal agreements for IT
products and services—which touch on issues like data ownership,
intellectual property ownership, liability, security, and enterprise
risk—are more complicated than agreements for fasteners and paper
products, but it is surprising that IT agreements outnumber
agreements for the next two largest categories of spend combined
(namely, professional services and marketing). This naturally raises
the question, what are the best practices for managing the complex
legal agreements related to IT products and services?
Key Action: Organizations should examine their IT agreement
landscape and establish sensible policies to help triage legal
requests and balance risk levels with the legal and other resources
required to manage them (i.e., “contracts under $20,000 don’t require legal review,” etc.). This is dependent on the type of IT product and risk
tolerance of the organization, but the goal should be to protect the business while optimizing resources and not inadvertently increasing risk
(i.e. an overly cumbersome process could push IT buyers to avoid procurement/legal altogether).
Start-ups Increasingly Represent a Compelling Way to Access Innovation, but Careful Risk Mitigation Is Required: CIOs and their
teams are often at the bleeding edge of technology, being asked to deliver innovative new solutions and embrace new and emerging
technologies. Sometimes, the sources of best innovation come from early stage tech start-ups. Working with start-ups has its advantages. As
an early customer representing a large proportion of revenue, companies can influence the development roadmap resulting in technology
solutions customized to your requirements. But there are downsides and risks to consider—there is no guarantee the start-up will attract
enough customers (and revenue) to remain a sustainable business. Staff turnover is another concern, and start-ups are takeover fodder for
larger IT providers looking for innovation via mergers and acquisitions. Buyers must be prepared for low probability scenarios like insolvency
and acquisition and protect data and I.P. rights.
Key Action: IT teams engaging with start-ups need to apply an extra layer of scrutiny with a focus on understanding financial stability (long-
term goals and transition plans for data), insurance elements (limitations on access to personally identifiable information [PII]), cyber liability,
tech errors and omissions), and personnel (turnover rates and stability of key personnel).
Source: Accenture
0%
10%
20%
30%
40%
50%
% Contracts under Mgmt
Contracts vs. Spend Under Management by Spend Category

9 Copyright © 2014 Accenture. All rights reserved.
ENERGY
EQUIPMENT,
ENGINEERING, &
CONSTRUCTION
CORPORATE
SERVICES—
TRAVEL
CORPORATE
SERVICES—
AUDIT & RISK
MARKETING
& MEDIA
LOGISTICS
INFORMATION
TECHNOLOGY
INDUSTRIAL
& MRO
Top Trends in Marketing & Media
Although the Relationship between Marketing and Procurement Continues to Improve, There Is More Upside for Marketers to
Capture: The Association of National Advertisers recently released the results of a broad survey on the state of the Marketing/Procurement
relationship. Survey respondents represented the three constituencies with major stakes in this game—Marketing, Procurement, and Agency
executives. Marketing and Procurement have often been at odds with one-another. Marketers want to protect their relationships with key
agency and creative partners and doubt that Procurement understands their needs. Meanwhile, Procurement has tended to view Marketing
(like many other spend categories) as an area to drive cost savings—not what a marketer wants to hear. The new survey shows signs that this
sometimes contentious relationship is improving: 55 percent of marketers and 61 percent of procurement executives say that the
Marketing/Procurement relationship is strong, and more than 60 percent of procurement executives believe the relationship has improved in
the past year. It seems clear that Marketing and Procurement know that they need to work more closely together and bridge their differences to
drive higher ROI and effectiveness of marketing dollars.
Key Action: Despite improving trends, the survey data highlights the need for Marketing and Procurement to come to the table early in the
process to align on marketing strategy and objectives, and how Procurement can deliver value vis-à-vis sourcing and execution strategies. The
onus is on Marketing to engage with Procurement earlier, and for Procurement to build deep relationships with Marketing so that they are
included upstream of activity by investing in compelling market intelligence that can be used to shape marketing activity.
The U.S. Hispanic Demographic Represents a Fast-Growing Target
Market—with Below-Market Pricing—Offering an Opportunity for
Marketers to Exploit: The US Hispanic demographic is one of the faster
growing market segments, measured by population growth and media usage.
Interestingly, however, marketing costs to reach this segment remain below the
General Market (GM). The multi-channel success of the FIFA World CupTM
tournament brought high profile advertisers who were rewarded with strong
ratings results driven in part by strong Hispanic viewership (and innovative
campaigns). The number of high-quality media outlets targeting Hispanic
audiences continues to grow ([.g., Univision Communications Inc., Unimas (a
division of Univision), ESPN Deportes, FOX Broadcasting Company], creating
an opportunity for advertisers to more cost-effectively reach an attractive
demographic, but advertisers must be wary of potential pitfalls.
Key Action: Marketers should examine opportunities to take advantage of the
attractive cost and ROI profile of the U.S. Hispanic vs. GM pricing environment
while it lasts. At the same time, advertisers should leverage market intelligence
and benchmark information to avoid overpaying for media at a time when
media outlets could engage in opportunistic pricing (i.e., the World Cup halo
effect) to close the price gap. The same discipline applies to evaluating
Hispanic-focused agencies: overall costs may be lower, but per-FTE costs may
be less competitive.
Source: US Census

10 Copyright © 2014 Accenture. All rights reserved.
ENERGY
EQUIPMENT,
ENGINEERING, &
CONSTRUCTION
CORPORATE
SERVICES—
TRAVEL
CORPORATE
SERVICES—
AUDIT & RISK
MARKETING
& MEDIA
LOGISTICS
INFORMATION
TECHNOLOGY
INDUSTRIAL
& MRO
Top Trends in Corporate Services: Audit and Corporate Risk
Auditing Your Audit Firm: Earlier this year, the European Union Parliament introduced new proposed regulations for audit firms. The draft
agreement applies to public-interest entities (including stock exchange listed companies, banks, and insurance companies) and places a
time limit on how long a company can keep the same audit firm. Ten years is the new maximum, but that can be extended to twenty years if
the audit is put out for bid and twenty-four years in the case of joint audits involving more than one audit firm. Although these proposed
regulations are at least two years away from becoming reality, they highlight an important underlying issue: most companies keep the same
audit firm indefinitely, and rarely put their audit work out for bid. This can lead to rates for audit services becoming non-competitive over time
when fees are based on prior year fees and benchmarks (provided by the auditor) vs. competitive bidding. As a best practice, firms should
already—at a minimum—be doing what the regulations propose, if not more.
Key Action: Audit relationships are often executive or board-of-director negotiated arrangements and therefore rarely involve Procurement.
Companies should be actively benchmarking rates to ensure that they are competitive, and open work to competition to combat
complacency and ensure competitive pricing (recent market data shows non big-four auditors gaining market share).
Focus on Risk Management Is on the Rise: We have seen a notable increase in client project activity focused in the enterprise risk
management area—specifically in insurable areas like directors and officers (D&O) liability insurance, property and casualty, fiduciary
responsibility, product liability, and other related areas. More
executives are focused on Total Cost of Risk (TCOR), which
provides a measure of the costs associate with risk financing
including the internal and external cost factors (insurance
premiums, administrative costs, broker fees/commissions, and
self-insured [retained] losses). Securities filings against
corporations related to class actions, Mergers & Acquisitions, and
related claims remain a significant risk with maximum dollar loss
exposure over $125B, which keeps risk as a front-of-mind CFO
issue. Although corporate risk is a C-level issue, executing risk
management sourcing strategies is complex and time-
consuming…and potentially very costly without accurate market
intelligence and price benchmark data.
Key Action: Organizations should ensure that they have a current
and accurate view of their TCOR and benchmark whether they are
receiving best-in-class broker fees in fixed fee arrangements and
program pricing. Through structured review and sourcing
processes, we have seen clients drive savings in the 10-20
percent range while freeing up business leaders’ time to focus on
more core operational responsibilities Source: Accenture
Client Project Work Related to Insurance Carriers and
Related Activities Is Rapidly Rising
0
5
10
15
20
25
2012 2013 2014 YTD
+150%
+300%

11 Copyright © 2014 Accenture. All rights reserved.
ENERGY
EQUIPMENT,
ENGINEERING, &
CONSTRUCTION
CORPORATE
SERVICES—
TRAVEL
CORPORATE
SERVICES—
AUDIT & RISK
MARKETING
& MEDIA
LOGISTICS
INFORMATION
TECHNOLOGY
INDUSTRIAL
& MRO
Top Trends in Travel
Corporate Credit Card Programs May Offer a Low Hanging
Savings Opportunity—New Regulations Make It Worth a Look
Now: In recent months, we’ve seen a spike in client activity in credit
card sourcing, and based on the savings opportunity and increasing
competition in the space, now is an excellent time to explore this
area. Most companies make a corporate card decision and stick
with it for years without competitively sourcing the category, and for
that reason alone, current deals may be uncompetitive and re-
sourcing the category can deliver substantial savings. Another
major consideration is current regulatory activity in Europe: The
European Parliament has proposed rules that would cap the
interchange fees charged by credit card networks. However, in its
current form, the rules don’t apply to all cards. Visa® and
MasterCard ®, which operate as four-party card networks, are
subject to the cap, while more traditional corporate cards American
Express ® and Diners Club ® (three-party networks) are not subject
to the caps. This creates an additional competitive dynamic in the
credit card space.
Key Action: Organizations should benchmark credit card pricing
and take advantage of the current environment of uncertainty.
Relative to other options in the travel area, changing card providers
is a relatively low friction change to implement, and across large
dollar volumes, small per-transaction savings can generate millions
in savings opportunity.
What Is the Cost of Employees “Doing Their Own Thing?”
Reexamine Travel Policy Compliance and Potential Risks:
Many employees go outside of corporate-mandated travel booking
systems to try to secure better airfares and hotel rates (often on
their preferred air or hotel loyalty programs). They have good
intentions—they think they are saving money for the firm while
utilizing their preferred brands. But most are unaware of the hidden
costs and potential risk exposure to the firm.
As this practice grows, incremental dollars that shift to online sites
(Expedia ®, priceline.com ®, etc.) can decrease corporate discounts
and rebates or potentially put the firm at risk of missing minimum
volume requirements for corporate deals. The other major risk is
visibility—if a geopolitical event occurs (see figure below depicting
major events in the recent past), corporate travel and HR may lack
visibility to where in the world their employees are, exposing the
firm to duty of care risk or liability.
Key Action: Organizations should examine travel policy and
compliance levels for potential cost and risk exposure. Part of
effectively communicating a strong travel policy is explaining the
benefits of compliance to both the company and the employee.
Some companies go as far as to open corporate booking tools and
discounts to employee use to drive travel dollar spend and
negotiating power with suppliers.
Source: Accenture
Recent Events Highlight Potential
Employer Duty of Care Risk
Severe
Storms
Plane
Crash
Hurricane/
Tsunami Earthquake
Terrorist
Attack

12 Copyright © 2014 Accenture. All rights reserved.
ENERGY
EQUIPMENT,
ENGINEERING, &
CONSTRUCTION
CORPORATE
SERVICES—
TRAVEL
CORPORATE
SERVICES—
AUDIT & RISK
MARKETING
& MEDIA
LOGISTICS
INFORMATION
TECHNOLOGY
INDUSTRIAL
& MRO
Top Trends in Equipment, Engineering, and Construction
Increasing Construction Demand Puts Pressure on Overall
Construction Costs and Requires New Sourcing Focus:
Numerous factors are driving higher demand for key construction
materials like concrete, aggregate, and reinforcing bars (rebar). In
the U.S., the multi-year economic recovery is stoking demand, while
firms are beginning to re-shore manufacturing and build out new
production capacity to take advantage of lower energy costs and
highly-skilled, more competitively priced labor. Another driver of
demand is an expected increase (albeit slow) in public sector
funding for highways and bridges, which consume large quantities
of heavy building materials. Material purchases account for more
than 50 percent of the cost of construction, so inflation is a major
cost concern for manufacturers. Because materials like concrete are
heavy, supply markets are largely local or regional captive markets
due to high logistics costs (high weight, low value per pound).
Prices for cement and aggregate, two major components of
concrete, are rising. Cement prices are expected to increase 9
percent through 2015, which will contribute to rising concrete prices.
Meanwhile, rebar prices have fallen in recent years thanks to the
construction slowdown in China releasing more inventory into the
global market.
Key Action: Strategy will vary by material, but with concrete prices
expected to rise, now is a good time to consider establishing long-
term pricing and supplier relationships. Evaluate opportunities to
utilize pre-cast concrete elements (faster speed of erection, but less
flexible and higher logistics costs) vs. cast-in-place concrete. Cost of
goods sold is a major cost driver, so buyers should focus on
developing strong upstream market intelligence for major cost
drivers (oil, steel, etc.). In evaluating suppliers, keep in mind that
vertical integration can lower total landed costs while reducing risk
(supply reliability and availability).
Capacity utilization
approaching long-term
average of approx. 80
Source: U.S. Federal Reserve
$0
$50
$100
$150
$200
$250
$300
$350Jan
-10
Ap
r-10
Ju
l-10
Oct-
10
Jan
-11
Ap
r-11
Ju
l-11
Oct-
11
Jan
-12
Ap
r-12
Ju
l-12
Oct-
12
Jan
-13
Ap
r-13
Ju
l-13
Oct-
13
Jan
-14
Ap
r-14
Non-residential Construction 2010 to date (USD $B)
Source: U.S. Census Bureau
60
65
70
75
80
85
Jan
-04
Ju
l-04
Jan
-05
Ju
l-05
Jan
-06
Ju
l-06
Jan
-07
Ju
l-07
Jan
-08
Ju
l-08
Jan
-09
Ju
l-09
Jan
-10
Ju
l-10
Jan
-11
Ju
l-11
Jan
-12
Ju
l-12
Jan
-13
Ju
l-13
Jan
-14
Total Industrial Capacity Utilization (2004-Date)
Highest reading
since June 2008

13 Copyright © 2014 Accenture. All rights reserved.
ENERGY
EQUIPMENT,
ENGINEERING, &
CONSTRUCTION
CORPORATE
SERVICES—
TRAVEL
CORPORATE
SERVICES—
AUDIT & RISK
MARKETING
& MEDIA
LOGISTICS
INFORMATION
TECHNOLOGY
INDUSTRIAL
& MRO
Shifting Competitive Dynamics in the Industrial Supplies/Distribution Market Opens New Options and Opportunities for Industrial
Buyers: In the Industrial / Maintenance, Repair, and Operations (MRO) distribution markets, major distributors have offered a one-stop shop
solution in the form of vast catalogs of MRO supplies at competitive prices to complement the one-stop-shop convenience. However, the
market has evolved further, with some of the major distribution players such as Applied Industrial Technologies (AIT) and Motion Industries
expanding into new, adjacent product delivery and value added services areas they had not been in before. For example, rather than just
selling bearings as they had in the past, these major distributors are increasingly offering tools and industrial supplies that accompany the
base products they are selling. The benefit for the distributors is to expand “share of wallet” with customers and offer more competitive
pricing (sometimes at lower margins, but capturing more gross profit dollars by increasing the size of overall customer orders). The benefit for
buyers is the potential for efficiencies due to fewer suppliers and the ability to negotiate better terms on higher volumes. The added benefit is
that new competition is created in some areas where it did not previously exist, as well as increased opportunity for continuous improvement
and supplier-enabled innovation.
Key Action: The key takeaway for customers is to be open-minded about re-opening supplier agreements. You may be pleasantly surprised
that there is new competition in a sub-market that had not been there before. Suppliers with expanded scopes of services may also identify
savings and product improvement opportunities through possible substitute products. It is also worth exploring vending and / or RFID
solutions that can impact demand management and support more efficient materials management methods, improved inventory accuracy,
and working capital efficiency. Customers should be considering all these areas as they re-evaluate supplier contracts and relationships
through a true Total Cost of Ownership approach.
Brand Owners Leverage Supplier Conferences to Access Innovation—but Beware Pitfalls: Companies are increasingly seeking ways
to access innovation, from crowdsourcing to closer partnerships with strategic suppliers. Supplier innovation conferences can help brand
owners gain access to new ideas and innovation that leverages suppliers’ work across multiple brand owners and customer segments.
Improvement ideas can range from ways to utilize new or substitute materials to process efficiencies. However, supplier conferences often
flounder due to lack of executive sponsorship, unclear expectations, and lack of clear process and structure.
Key Action: In areas like packaging, supplier conferences can be a strong source of innovation delivering waste reduction and value
enhancement ideas that can drive savings and improve sales performance. However, to be successful, brand owners need to approach
conferences as an opportunity to collaborate more closely with strategic suppliers and involve executives and cross-functional teams
representing R&D, supply chain, sales, marketing, and quality—not just procurement.
Top Trends in Industrial and Maintenance, Repair, and Operations

14 Copyright © 2014 Accenture. All rights reserved.
ENERGY
EQUIPMENT,
ENGINEERING, &
CONSTRUCTION
CORPORATE
SERVICES—
TRAVEL
CORPORATE
SERVICES—
AUDIT & RISK
MARKETING
& MEDIA
LOGISTICS
INFORMATION
TECHNOLOGY
INDUSTRIAL
& MRO
Top Trends in Energy
Demand Response Strategies Mature and Evolve: We are seeing an increase in the number and variety of demand response and real-time
pricing programs as power generation markets rapidly evolve with increased renewable energy sources and changing power plant fuel
sources. Demand response typically works like this: when the electric system experiences very heavy load, electric system operators ask
demand response customers to reduce electricity usage. Customers receive payments for enrollment and participation in these programs and,
in most cases, receive payments even if they are never called upon to reduce consumption. As more renewable energy sources (solar, wind)
come online, grid power supply becomes more unstable because solar and wind power, unlike traditional gas, coal, or nuclear generation, is
intermittent/does not have a constant base load. This creates a fluctuating electric supply leading to grid instability and the potential for
interesting scenarios. For example, when there is over-supply of power (i.e. when all renewable sources are producing at max capacity),
demand response programs could ask customers to temporarily increase power consumption. Power markets are responding to this changing
supply mix through new time-of-use rates, real-time pricing, and a variety of demand response programs. Clients, meanwhile, are responding
with more sophisticated demand management strategies that can include deployment of demand management control systems, renewables,
and on-site storage/peak limiting hardware.
Key Action: Demand programs usually start with efficiency/reducing usage. This is changing as more users examine sophisticated energy
management systems leveraging smart meters, data connectivity, and analytics. Organizations should look to harness their energy data to
alter usage profiles and quantify financial benefits and revenue opportunities. The ultimate value comes from linking demand-side intelligence
with supply-side energy procurement strategies to maximize financial benefit (savings and potential revenue).
Falling Global Liquefied Natural Gas (LNG) Prices May Affect U.S. LNG Export Growth: Pending U.S. legislation (H.R. 6) would expedite
the review process of 14 LNG export applications totaling 15.64 Bcf/day (additional Canadian projects total 23.78 Bcf/day). Compare this to
Liquefied Natural Gas Prices by Region (June 2011 to Date)
$0
$5
$10
$15
$20
$25Ju
n-1
1
Se
p-1
1
Dec-1
1
Ma
r-12
Ju
n-1
2
Se
p-1
2
Dec-1
2
Ma
r-13
Ju
n-1
3
Se
p-1
3
Dec-1
3
Ma
r-14
Ju
n-1
4
$/m
mB
tu
UK Spain Cove Pt. (US)
Japan Argentina
total current U.S. gas production of 85 Bcf/day and approved
export capacity of 4.46 Bcf/day. Meanwhile, global LNG prices
have fallen sharply in recent months (European and Asian LNG
prices down 40-50 percent in 2014) which could delay U.S. export
ramp-up beyond the currently expected 2015-2018 timeframe.
Exports of U.S. gas to Mexico continue to rise and China’s
appetite for gas is also growing, although its recent thirty-year
purchase agreement with Russia is a major development that will
create an effective floor of around $4/mmBtu for U.S. natural gas.
Long-term energy demand and prices will continue to increase
while short-term volatility will remain high as we move toward a
global natural gas market.
Key Action: The pull-back in LNG prices is a nice respite for
European and Asian users, but buyers globally should be
evaluating layered hedging strategies that align expected demand
with price risk tolerance.
Source: Thomson Reuters

15 Copyright © 2014 Accenture. All rights reserved.
Sources and References
EXECUTIVE SUMMARY:
• Kim, Soyoung and Roumeliotis, Greg, “Global M&A at Seven-year High as
Big Corporate Deals Return,” June 20, 2014. Retrieved from:
http://www.reuters.com/article/2014/06/30/us-deals-m-a-
idUSKBN0F50A920140630
• National Association of Business Economics, NABE Business Conditions
Survey, July 2014. Retrieved from:
http://nabe.com/NABE_Business_Conditions_July_2014_Summary
• International Energy Agency, “IEA Releases Oil Market Report for July,” July
11, 2014. Retrieved from:
http://www.iea.org/newsroomandevents/news/2014/july/iea-releases-oil-
market-report-for-july.html
• FactSet Buyback Quarterly: June 18, 2014, Retrieved from:
http://www.factset.com/websitefiles/PDFs/buyback
• FactSet Dividend Quarterly: June 24, 2014, Retrieved from:
http://www.factset.com/websitefiles/PDFs/dividend
• FactSet Cash & Investment Quarterly: June 24, 2014, Retrieved from:
http://www.factset.com/websitefiles/PDFs/cashinvestment
• Meckstroth, Daniel J., Ph.D., Manufacturers Alliance for Productivity and
Innovation, “U.S. Industrial Outlook: Accelerating Growth Ahead,” June 6,
2014. Retrieved from: https://www.mapi.net/research/publications/us-
industrial-outlook-june-2014
• International Monetary Fund World Economic Update, July 2014:
http://www.imf.org/external/pubs/ft/weo/2014/update/02/
EXECUTIVE SUMMARY (CONTINUED):
• Thomson Reuters Corporation/University of Michigan Surveys of Consumers:
http://www.sca.isr.umich.edu/
• National Federation of Independent Business (NFIB):
http://www.nfib.com/research-foundation/surveys/small-business-economic-
trends
MARKETING:
• Association of National Advertisers, “2014 ANA Procurement/Marketing
Relationship Survey,” June 5, 2014. Retrieved from:
http://www.ana.net/miccontent/show/id/rr-procurement-marketing-relationship-
survey-report
EQUIPMENT, ENGINEERING, & CONSTRUCTION:
• US Department of Commerce, Census Bureau, Total Private Construction
Spending, Nonresidential. Retrieved from:
http://m.research.stlouisfed.org/fred/series.php?sid=PNRESCONS&show=ch
art&
• Board of Governors of the Federal Reserve System, Industrial Production and
Capacity Utilization, Retrieved from:
http://www.federalreserve.gov/RELEASES/G17/Current/default.htm
ENERGY:
• BIA/Kelsey, “BIA/Kelsey Forecasts U.S. Social Ad Revenues to Reach $11B
in 2017,” Retrieved from: http://www.biakelsey.com/Company/Press-
Releases/130410-U.S.-Social-Ad-Revenues-to-Reach-$11B-in-2017.as

16 Copyright © 2014 Accenture. All rights reserved.
About Accenture
Accenture is a global management consulting, technology
services and outsourcing company, with approximately
293,000 people serving clients in more than 120 countries.
Combining unparalleled experience, comprehensive
capabilities across all industries and business functions,
and extensive research on the world’s most successful
companies, Accenture collaborates with clients to help them
become high-performance businesses and governments.
The company generated net revenues of US$28.6 billion for
the fiscal year ended Aug. 31, 2013. Its home page is
www.accenture.com.
Copyright © 2014 Accenture.
All rights reserved.
Accenture, its logo, and High performance. Delivered. are trademarks
of Accenture.
This document makes descriptive reference to trademarks that may be
owned by others. The use of such trademarks herein is not an
assertion of ownership of such trademarks by Accenture and is not
intended to represent or imply the existence of an association between
Accenture and the lawful owners of such trademarks.