a3 business forum aia, mcma, ria - vision online · pdf filea3 business forum . aia, mcma, ria...
TRANSCRIPT

Dr. Alan Beaulieu President
A Curve in the Road
A3 Business Forum AIA, MCMA, RIA
ITR Economics provides the best economic intelligence to reduce risk and drive practical and profitable business decisions.
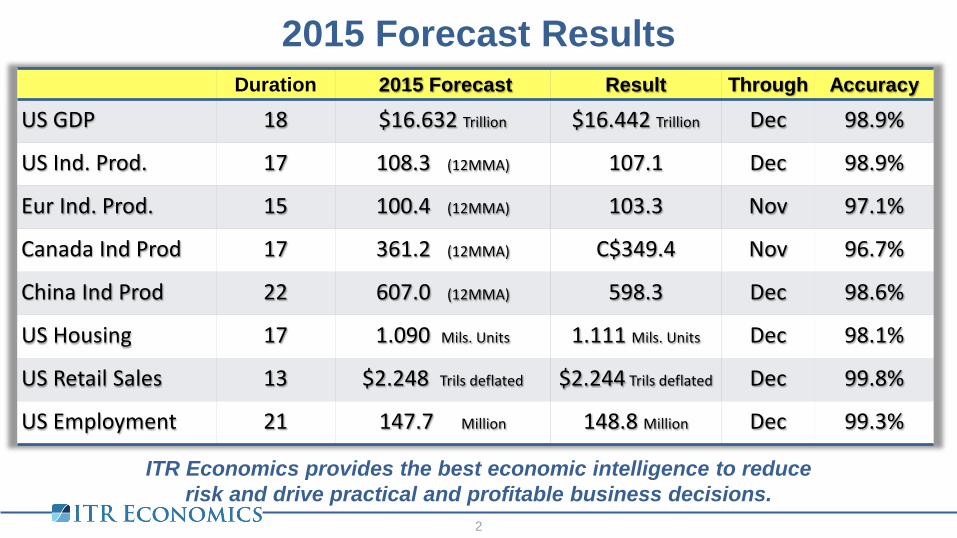
Duration 2015 Forecast Result Through Accuracy
US GDP 18 $16.632 Trillion $16.442 Trillion Dec 98.9%
US Ind. Prod. 17 108.3 (12MMA) 107.1 Dec 98.9%
Eur Ind. Prod. 15 100.4 (12MMA) 103.3 Nov 97.1%
Canada Ind Prod 17 361.2 (12MMA) C$349.4 Nov 96.7%
China Ind Prod 22 607.0 (12MMA) 598.3 Dec 98.6%
US Housing 17 1.090 Mils. Units 1.111 Mils. Units Dec 98.1%
US Retail Sales 13 $2.248 Trils deflated $2.244 Trils deflated Dec 99.8%
US Employment 21 147.7 Million 148.8 Million Dec 99.3%
2015 Forecast Results 2
2
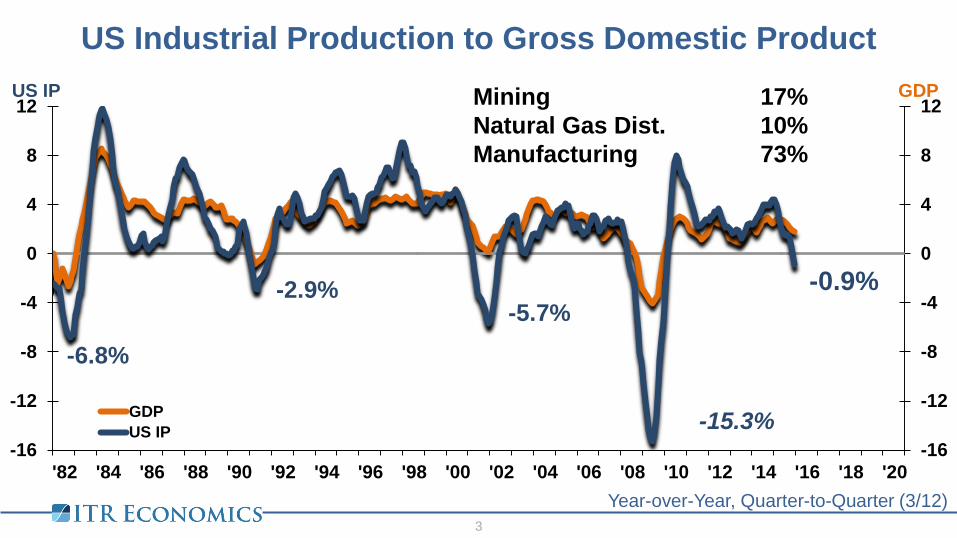
US Industrial Production to Gross Domestic Product
-6.8%
-2.9% -5.7%
-15.3%
-0.9%
-16
-12
-8
-4
0
4
8
12
-16
-12
-8
-4
0
4
8
12
'82 '84 '86 '88 '90 '92 '94 '96 '98 '00 '02 '04 '06 '08 '10 '12 '14 '16 '18 '20
GDP US IP
GDPUS IP
Year-over-Year, Quarter-to-Quarter (3/12) 3
Mining 17% Natural Gas Dist. 10% Manufacturing 73%
12-Month Moving Average 12/12 Rate-of-Change Year-over-Year Growth Rate
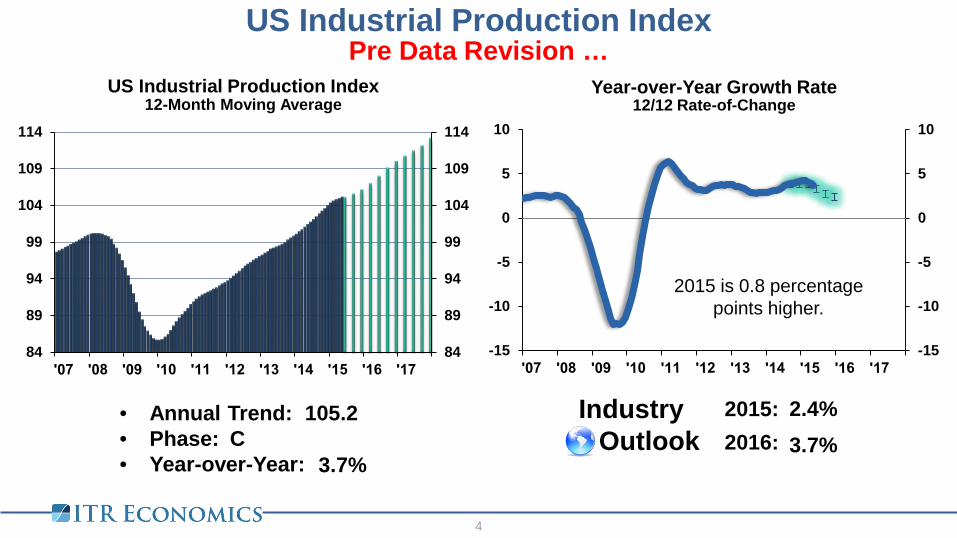
• Annual Trend: • Phase: • Year-over-Year:
Industry Outlook
2015: 2016: 2017:
US Industrial Production Index
4
US Industrial Production Index
105.2 C
3.7%
2.4% 3.7%
Pre Data Revision …
84
89
94
99
104
109
114
84
89
94
99
104
109
114
-15
-10
-5
0
5
10
-15
-10
-5
0
5
10
2015 is 0.8 percentage points higher.

12-Month Moving Average 12/12 Rate-of-Change Year-over-Year Growth Rate
• Annual Trend: • Phase: • Year-over-Year:
Industry Outlook
2016: 2017:
US Industrial Production Index
5
84
89
94
99
104
109
114
119
84
89
94
99
104
109
114
119
-15
-10
-5
0
5
10
-15
-10
-5
0
5
10
US Industrial Production Index
107.1 C
1.3%
0.2% 2.7%
12-Month Moving Average 12/12 Rate-of-Change Year-over-Year Growth Rate
• Annual Trend: • Phase: • Year-over-Year:
Industry Outlook
2016: 2017:
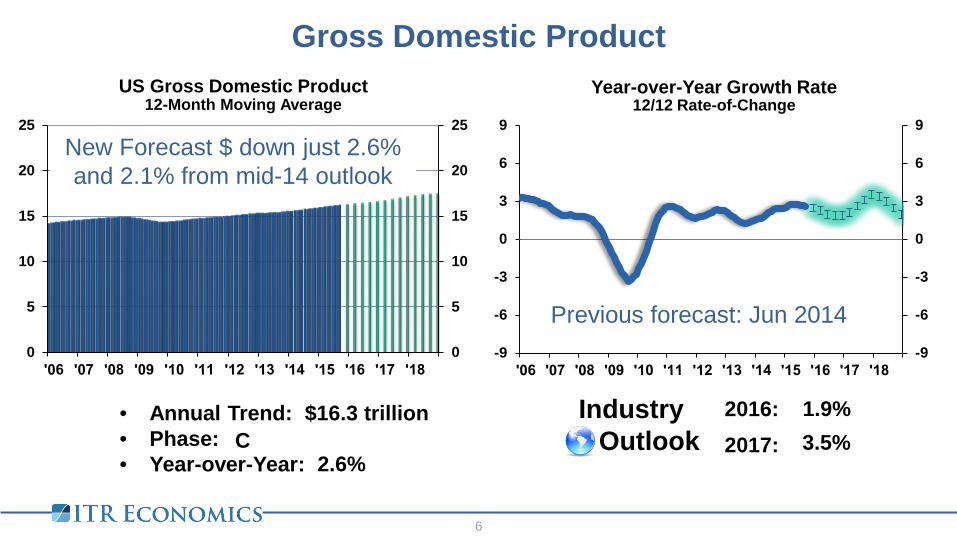
Gross Domestic Product
6
0
5
10
15
20
25
0
5
10
15
20
25
-9
-6
-3
0
3
6
9
-9
-6
-3
0
3
6
9
US Gross Domestic Product
$16.3 trillion C
2.6%
1.9% 3.5%
Previous forecast: Jun 2014
New Forecast $ down just 2.6% and 2.1% from mid-14 outlook
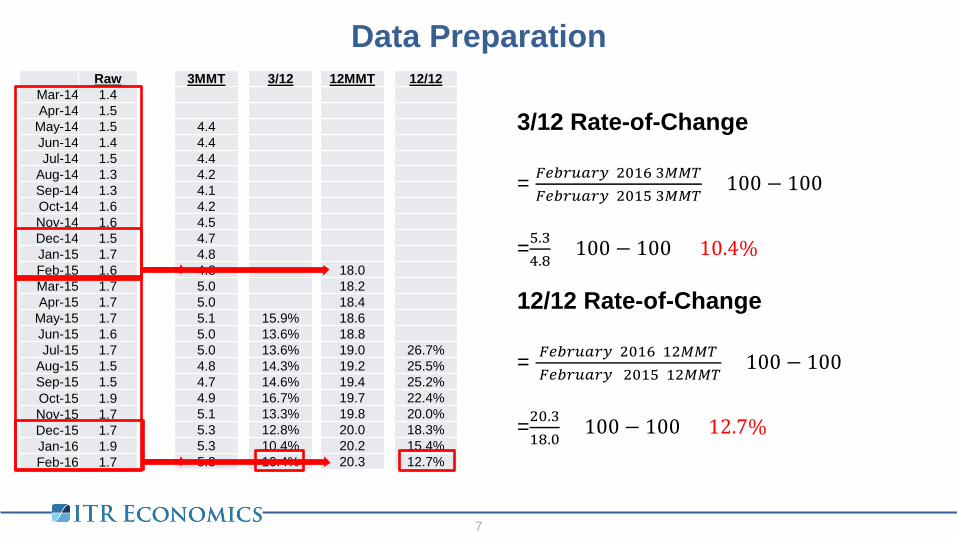
Raw Mar-14 1.4 Apr-14 1.5
May-14 1.5 Jun-14 1.4 Jul-14 1.5
Aug-14 1.3 Sep-14 1.3 Oct-14 1.6 Nov-14 1.6 Dec-14 1.5 Jan-15 1.7 Feb-15 1.6 Mar-15 1.7 Apr-15 1.7
May-15 1.7 Jun-15 1.6 Jul-15 1.7
Aug-15 1.5 Sep-15 1.5 Oct-15 1.9 Nov-15 1.7 Dec-15 1.7 Jan-16 1.9 Feb-16 1.7
3/12 Rate-of-Change = 𝐹𝐹𝐹𝐹𝐹𝐹𝐹𝐹 2016 3𝑀𝑀𝑀𝐹𝐹𝐹𝐹𝐹𝐹𝐹𝐹 2015 3𝑀𝑀𝑀
× 100 − 100 =5.34.8
× 100 − 100 = 10.4%
3MMT
4.4 4.4 4.4 4.2 4.1 4.2 4.5 4.7 4.8 4.8 5.0 5.0 5.1 5.0 5.0 4.8 4.7 4.9 5.1 5.3 5.3 5.3
12MMT
18.0 18.2 18.4 18.6 18.8 19.0 19.2 19.4 19.7 19.8 20.0 20.2 20.3
12/12
26.7% 25.5% 25.2% 22.4% 20.0% 18.3% 15.4% 12.7%
12/12 Rate-of-Change = 𝐹𝐹𝐹𝐹𝐹𝐹𝐹𝐹 2016 12𝑀𝑀𝑀
𝐹𝐹𝐹𝐹𝐹𝐹𝐹𝐹 2015 12𝑀𝑀𝑀× 100 − 100
=20.318.0
× 100 − 100 = 12.7%
3/12
15.9% 13.6% 13.6% 14.3% 14.6% 16.7% 13.3% 12.8% 10.4% 10.4%
Data Preparation
7
-21
-14
-7
0
7
14
21
-45
-30
-15
0
15
30
45
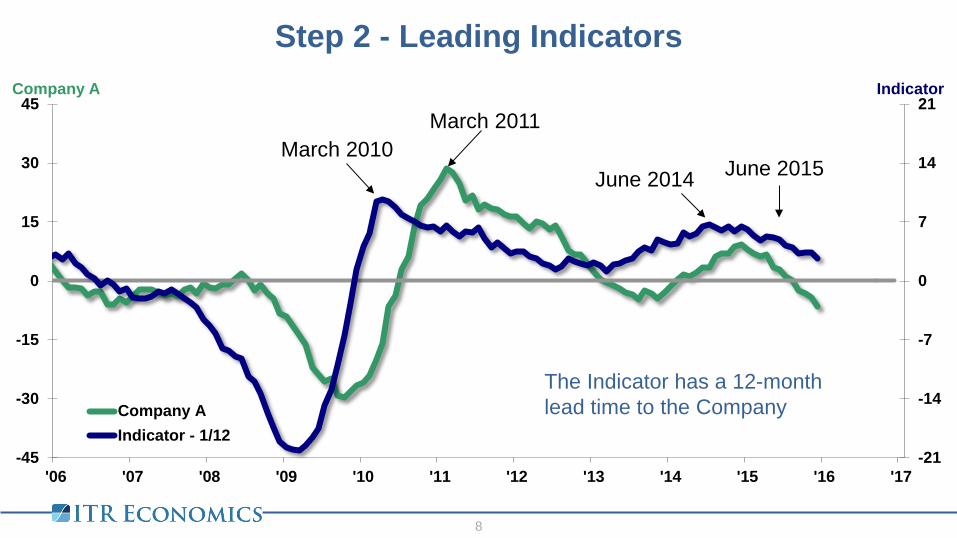
'06 '07 '08 '09 '10 '11 '12 '13 '14 '15 '16 '17
Indicator Company A
Company AIndicator - 1/12
Step 2 - Leading Indicators
8
8
March 2010 March 2011
The Indicator has a 12-month lead time to the Company
June 2014 June 2015
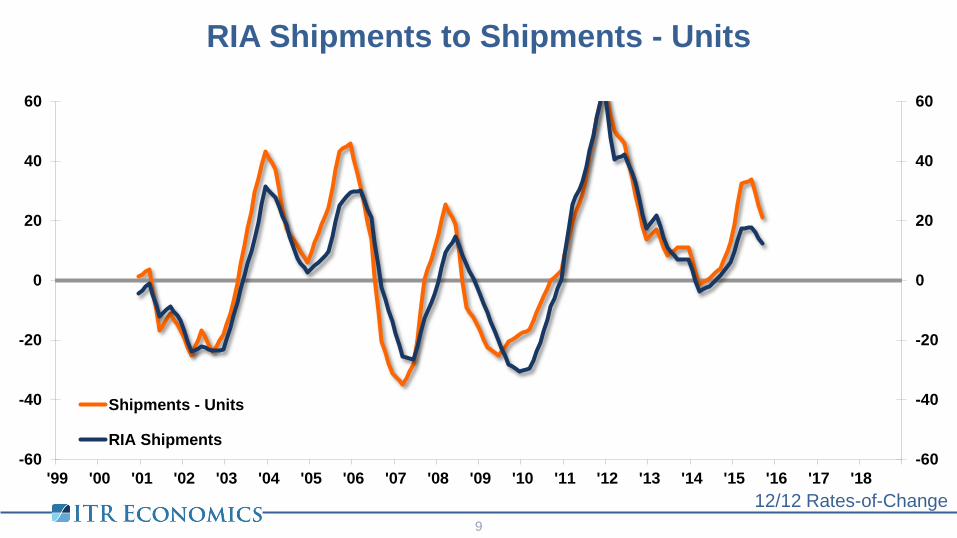
RIA Shipments to Shipments - Units
12/12 Rates-of-Change 9
-60
-40
-20
0
20
40
60
-60
-40
-20
0
20
40
60
'99 '00 '01 '02 '03 '04 '05 '06 '07 '08 '09 '10 '11 '12 '13 '14 '15 '16 '17 '18
Shipments - Units
RIA Shipments
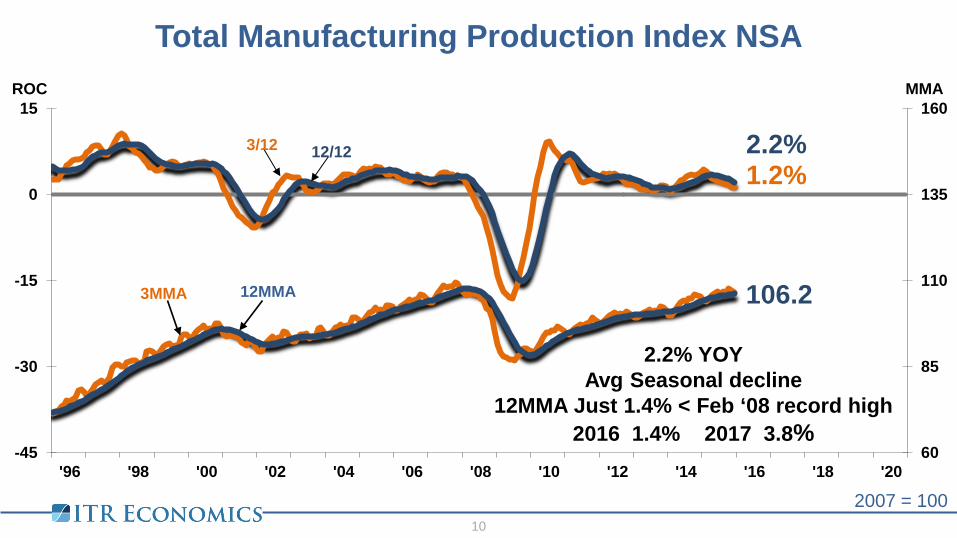
Total Manufacturing Production Index NSA
10
2007 = 100
1.2% 2.2%
106.2
60
85
110
135
160
-45
-30
-15
0
15
'96 '98 '00 '02 '04 '06 '08 '10 '12 '14 '16 '18 '20
MMA ROC
12/12 3/12
3MMA 12MMA
2.2% YOY Avg Seasonal decline
12MMA Just 1.4% < Feb ‘08 record high 2016 1.4% 2017 3.8%
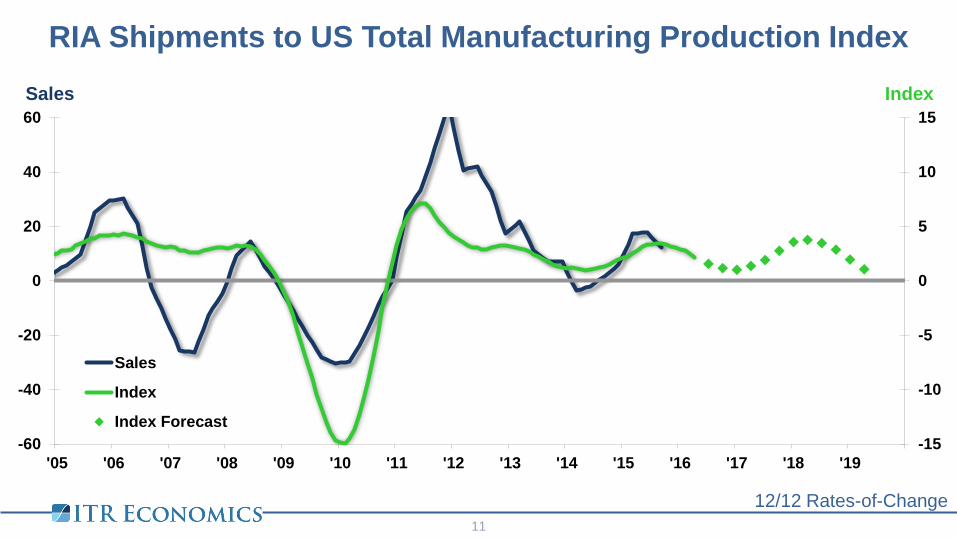
RIA Shipments to US Total Manufacturing Production Index
12/12 Rates-of-Change 11
-15
-10
-5
0
5
10
15
-60
-40
-20
0
20
40
60
'05 '06 '07 '08 '09 '10 '11 '12 '13 '14 '15 '16 '17 '18 '19
Sales
Index
Index Forecast
Index
Sales
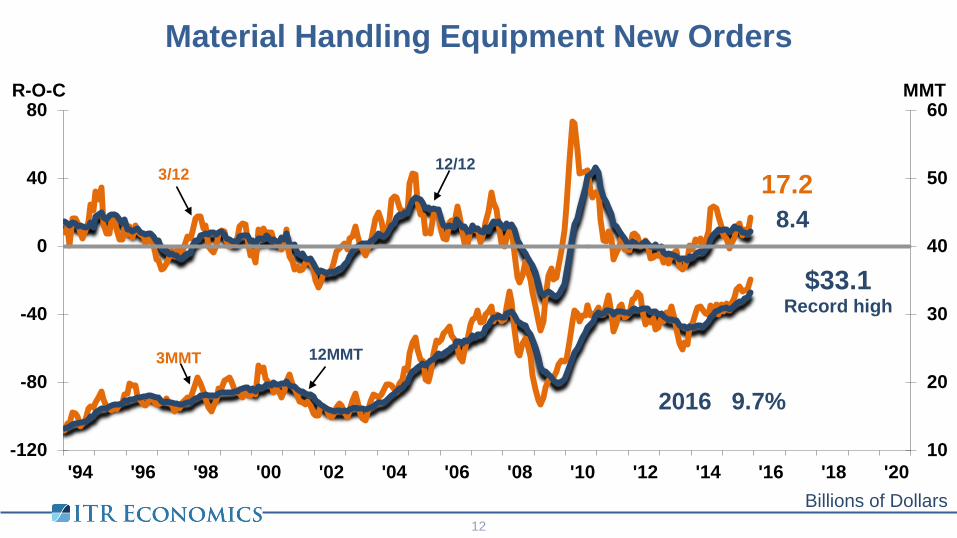
Material Handling Equipment New Orders
12
17.2 8.4
$33.1 Record high
10
20
30
40
50
60
-120
-80
-40
0
40
80
'94 '96 '98 '00 '02 '04 '06 '08 '10 '12 '14 '16 '18 '20
MMT R-O-C
3/12 12/12
3MMT 12MMT
Billions of Dollars
2016 9.7%
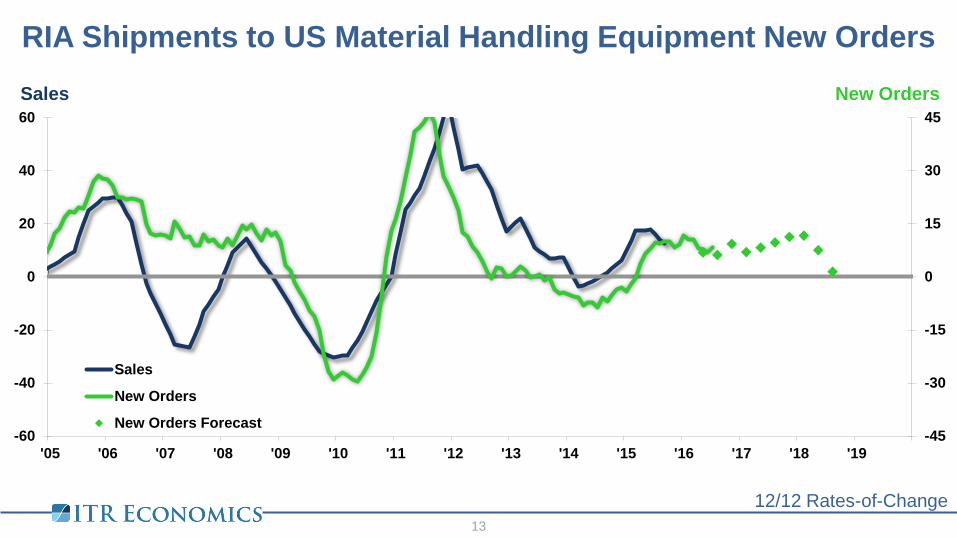
RIA Shipments to US Material Handling Equipment New Orders
12/12 Rates-of-Change 13
-45
-30
-15
0
15
30
45
-60
-40
-20
0
20
40
60
'05 '06 '07 '08 '09 '10 '11 '12 '13 '14 '15 '16 '17 '18 '19
Sales
New Orders
New Orders Forecast
New Orders
Sales
1.3% 2.9%
-60
-45
-30
-15
0
15
30
45
-16
-12
-8
-4
0
4
8
12
1975 1980 1985 1990 1995 2000 2005 2010 2015 2020
Production US IP
US IPProduction
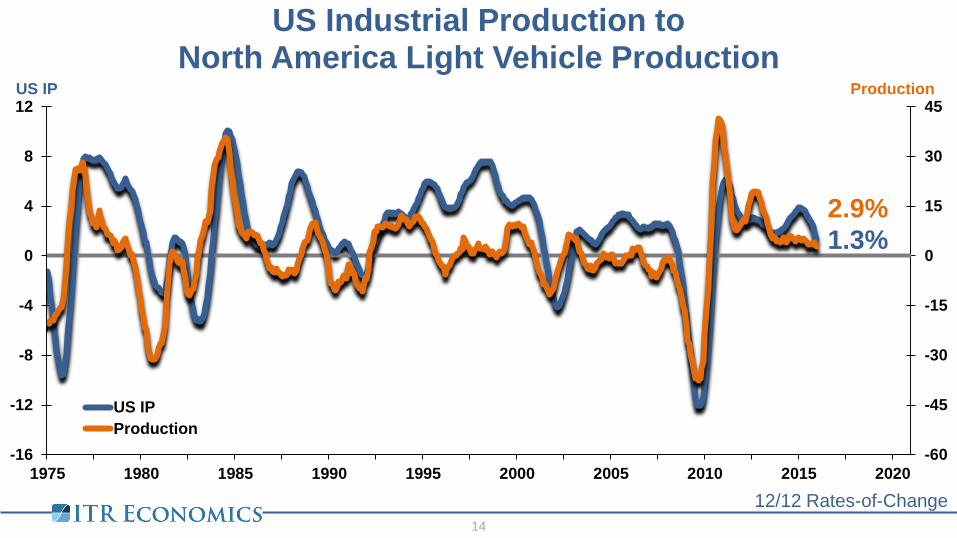
US Industrial Production to North America Light Vehicle Production
12/12 Rates-of-Change 14
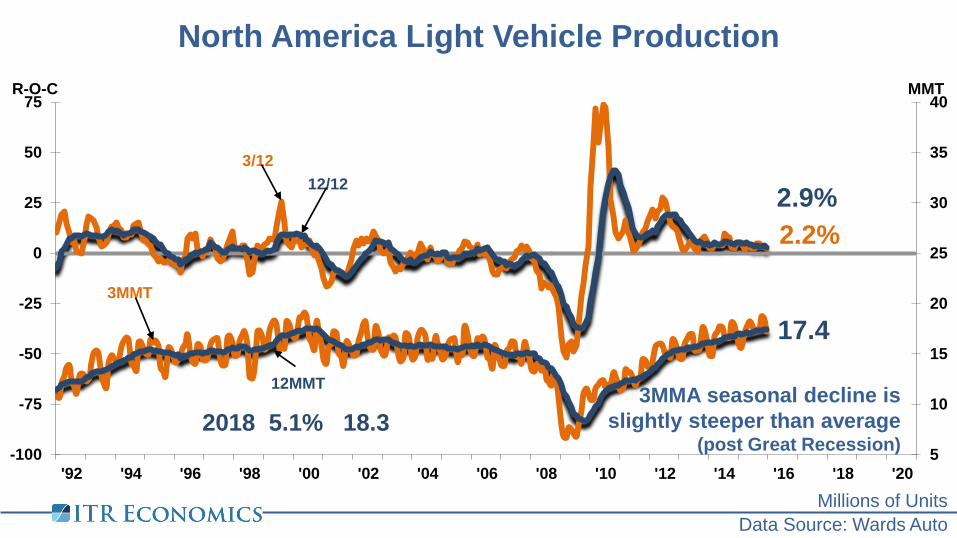
North America Light Vehicle Production
2.2% 2.9%
17.4
5
10
15
20
25
30
35
40
-100
-75
-50
-25
0
25
50
75
'92 '94 '96 '98 '00 '02 '04 '06 '08 '10 '12 '14 '16 '18 '20
MMT R-O-C
3/12 12/12
3MMT
12MMT
2018 5.1% 18.3
Data Source: Wards Auto Millions of Units
15
3MMA seasonal decline is slightly steeper than average
(post Great Recession)
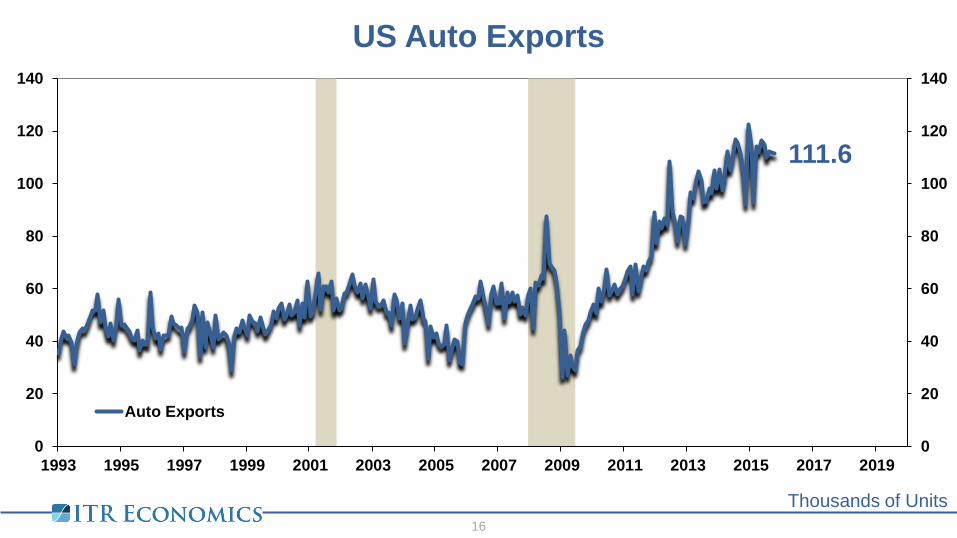
US Auto Exports
Thousands of Units 16
111.6
0
20
40
60
80
100
120
140
0
20
40
60
80
100
120
140
1993 1995 1997 1999 2001 2003 2005 2007 2009 2011 2013 2015 2017 2019
Auto Exports
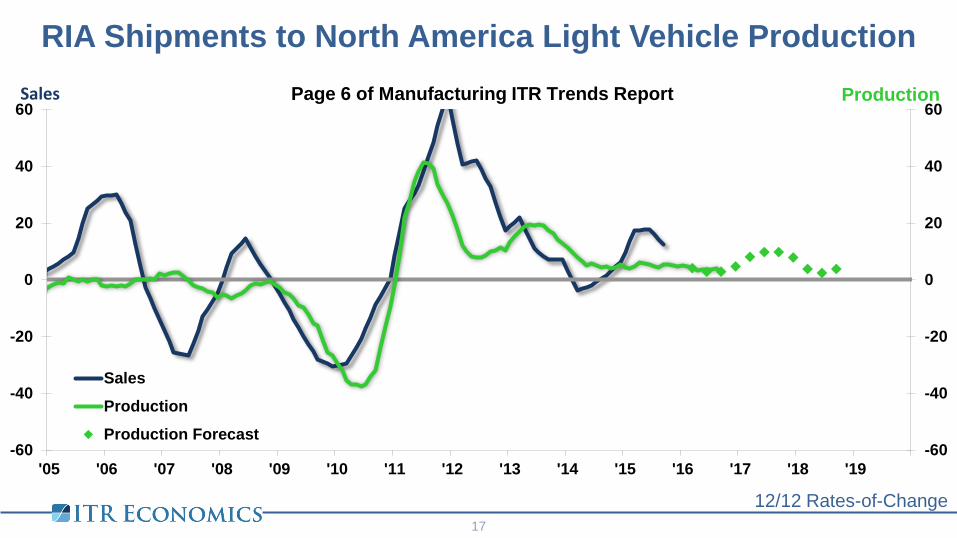
RIA Shipments to North America Light Vehicle Production
12/12 Rates-of-Change 17
-60
-40
-20
0
20
40
60
-60
-40
-20
0
20
40
60
'05 '06 '07 '08 '09 '10 '11 '12 '13 '14 '15 '16 '17 '18 '19
Sales
Production
Production Forecast
Production Page 6 of Manufacturing ITR Trends Report Sales
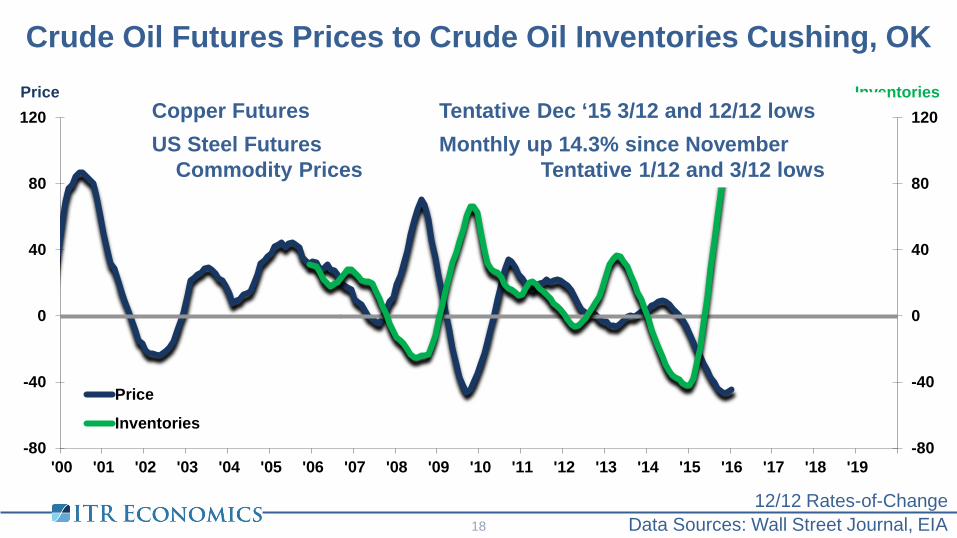
Crude Oil Futures Prices to Crude Oil Inventories Cushing, OK
-80
-40
0
40
80
120
-80
-40
0
40
80
120
'00 '01 '02 '03 '04 '05 '06 '07 '08 '09 '10 '11 '12 '13 '14 '15 '16 '17 '18 '19
Price
Inventories
Inventories
Price
Data Sources: Wall Street Journal, EIA 12/12 Rates-of-Change
18
Copper Futures Tentative Dec ‘15 3/12 and 12/12 lows US Steel Futures Monthly up 14.3% since November Commodity Prices Tentative 1/12 and 3/12 lows
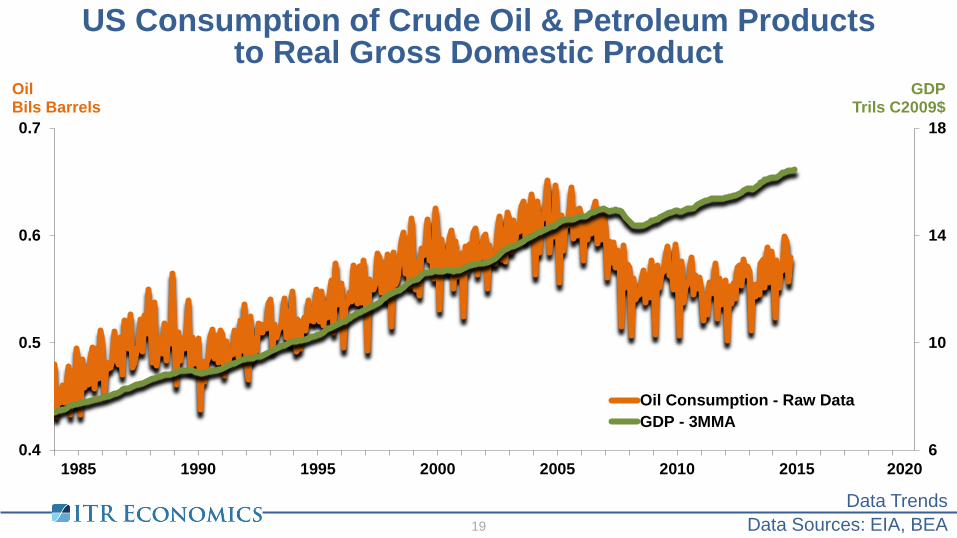
US Consumption of Crude Oil & Petroleum Products to Real Gross Domestic Product
19
Data Trends Data Sources: EIA, BEA
6
10
14
18
0.4
0.5
0.6
0.7
1985 1990 1995 2000 2005 2010 2015 2020
GDP Trils C2009$
Oil Bils Barrels
Oil Consumption - Raw DataGDP - 3MMA
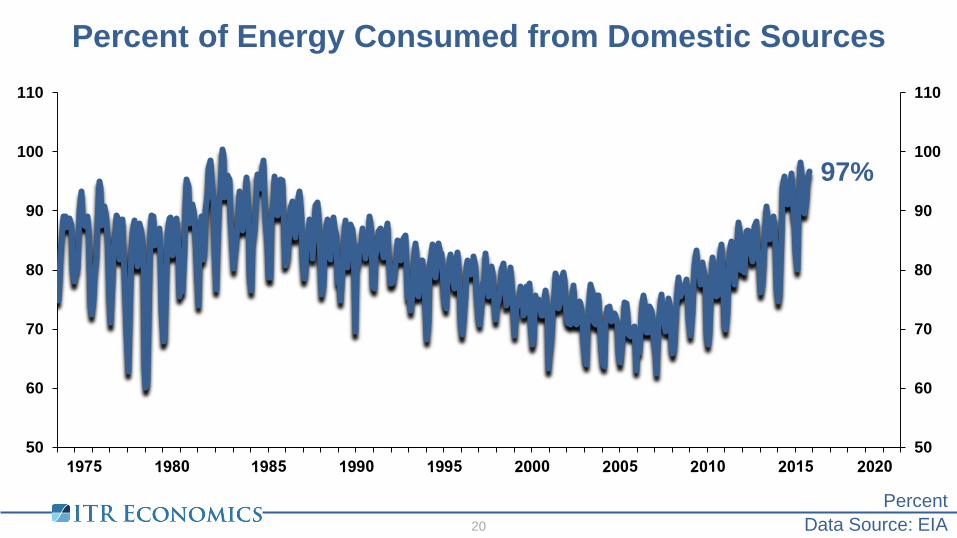
Percent of Energy Consumed from Domestic Sources
20 Data Source: EIA Percent
97%
50
60
70
80
90
100
110
50
60
70
80
90
100
110

Ongoing Concerns
21
China: Debt, Devaluation, Doubtful growth
Fear of instability from low oil prices
Non-defense capital goods new orders
South America
US Debt
World Demographics
China Industrial Production Index
2000 = 100 22
5.9% 6.2%
598.3
75
275
475
675
875
1075
1275
-30
-20
-10
0
10
20
30
'98 '00 '02 '04 '06 '08 '10 '12 '14 '16 '18 '20
MMA R-O-C
3/12 12/12
3MMA
12MMA
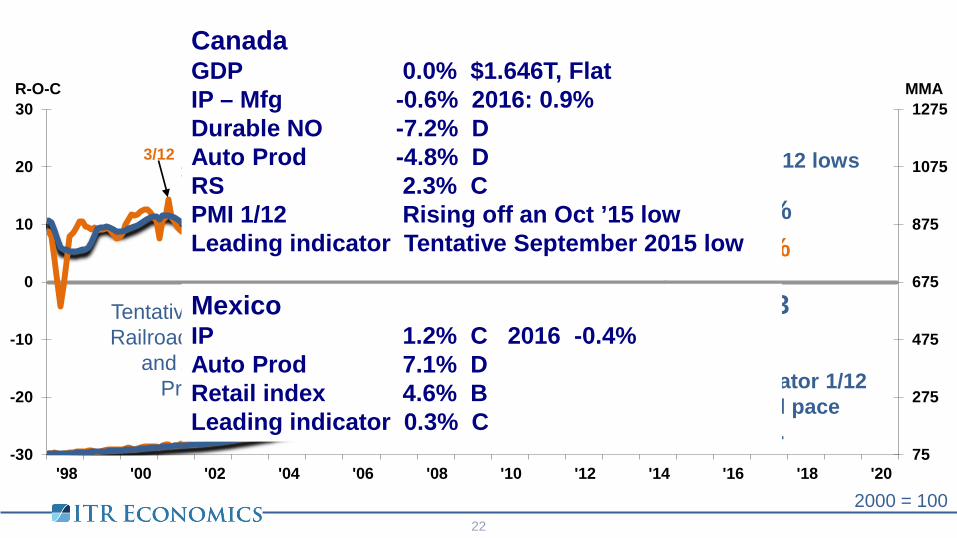
China leading indicator 1/12 is rising at a normal pace off a June 2015 low.
Tentative 1/12 and 3/12 lows
Tentative 12/12 rise in Railroad Freight Index
and Automobile Production.
Canada GDP 0.0% $1.646T, Flat IP – Mfg -0.6% 2016: 0.9% Durable NO -7.2% D Auto Prod -4.8% D RS 2.3% C PMI 1/12 Rising off an Oct ’15 low Leading indicator Tentative September 2015 low
Mexico IP 1.2% C 2016 -0.4% Auto Prod 7.1% D Retail index 4.6% B Leading indicator 0.3% C
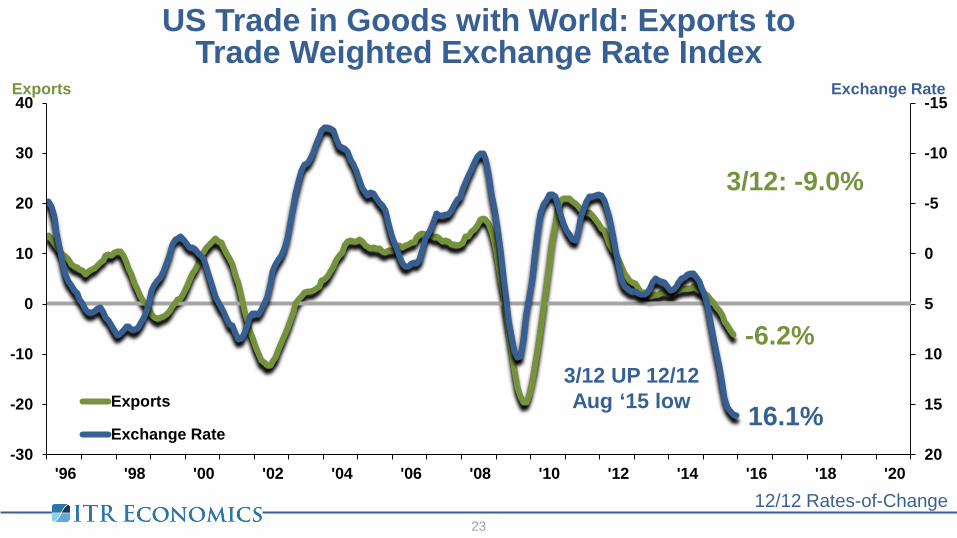
-6.2%
16.1%
-15
-10
-5
0
5
10
15
20-30
-20
-10
0
10
20
30
40
'96 '98 '00 '02 '04 '06 '08 '10 '12 '14 '16 '18 '20
Exchange Rate Exports
Exports
Exchange Rate
US Trade in Goods with World: Exports to Trade Weighted Exchange Rate Index
12/12 Rates-of-Change
3/12: -9.0%
23
3/12 UP 12/12 Aug ‘15 low
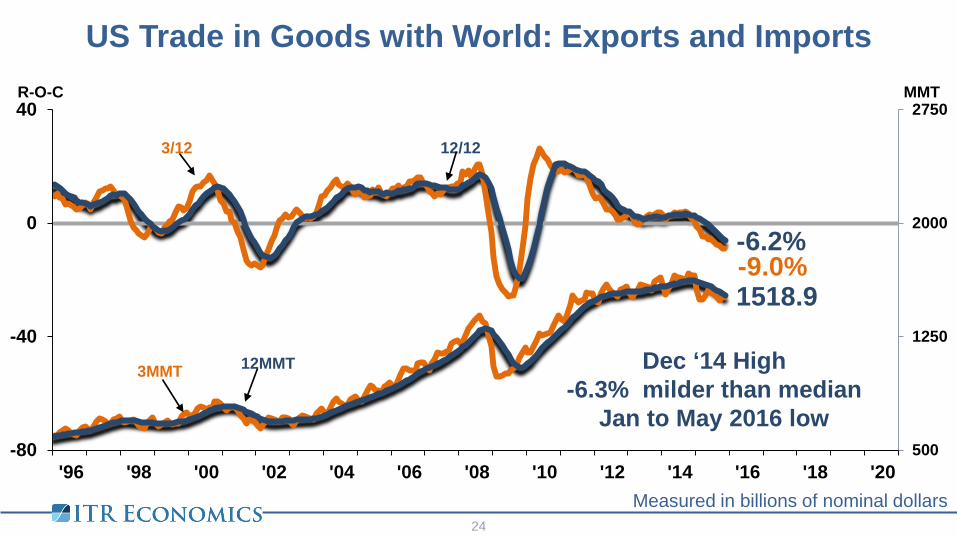
US Trade in Goods with World: Exports and Imports
Measured in billions of nominal dollars 24
-9.0% -6.2%
1518.9
500
1250
2000
2750
-80
-40
0
40
'96 '98 '00 '02 '04 '06 '08 '10 '12 '14 '16 '18 '20
MMT R-O-C
3/12 12/12
3MMT 12MMT Dec ‘14 High -6.3% milder than median
Jan to May 2016 low
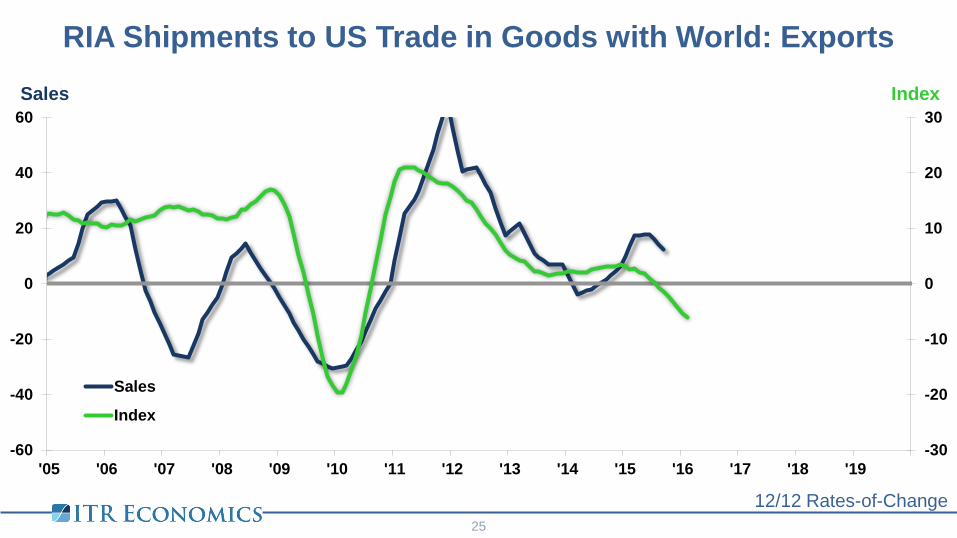
RIA Shipments to US Trade in Goods with World: Exports
12/12 Rates-of-Change 25
-30
-20
-10
0
10
20
30
-60
-40
-20
0
20
40
60
'05 '06 '07 '08 '09 '10 '11 '12 '13 '14 '15 '16 '17 '18 '19
Sales
Index
Index
Sales
0.7% 1.3%
-15
-10
-5
0
5
10
15
-45
-30
-15
0
15
30
45
'92 '94 '96 '98 '00 '02 '04 '06 '08 '10 '12 '14 '16 '18 '20
US IP Profits
ProfitsUS IP
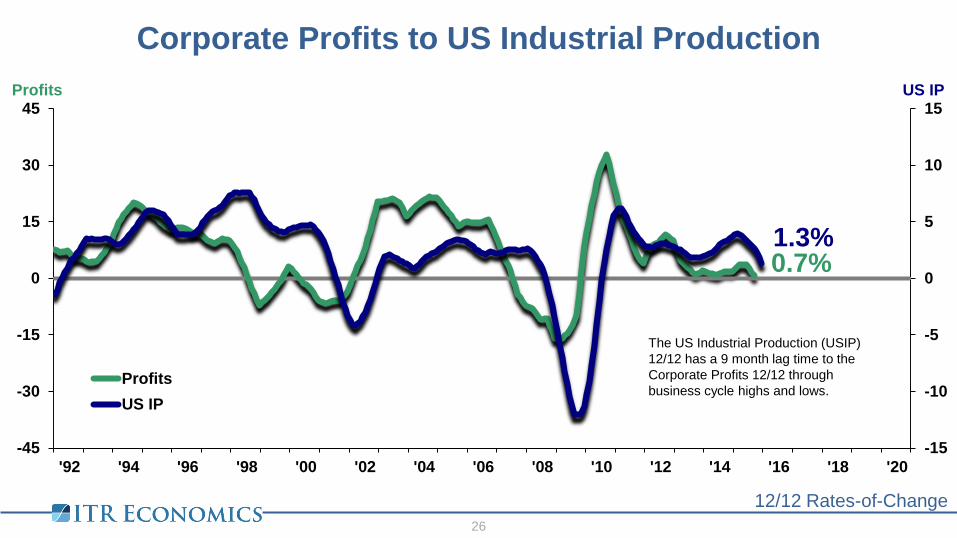
Corporate Profits to US Industrial Production
12/12 Rates-of-Change 26
The US Industrial Production (USIP) 12/12 has a 9 month lag time to the Corporate Profits 12/12 through business cycle highs and lows.
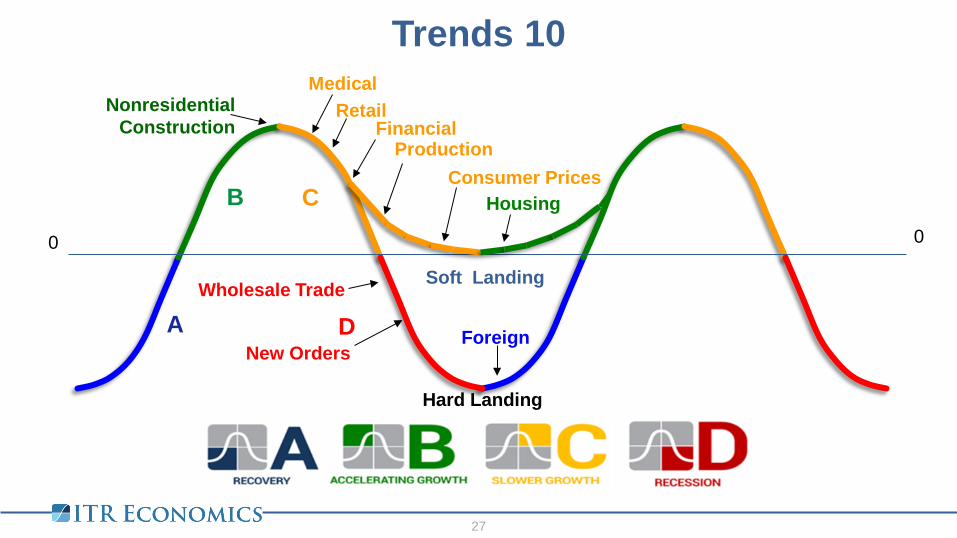
Consumer Prices
0 0
Soft Landing
A
B C
D
Trends 10
27
Housing
Production
Medical
New Orders
Financial Retail
Wholesale Trade
Foreign
Nonresidential Construction
Hard Landing
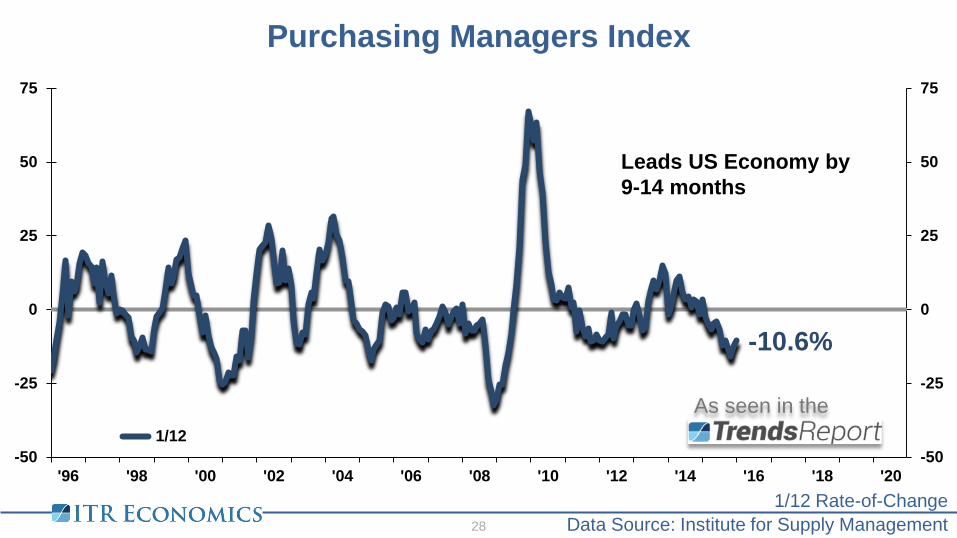
-10.6%
-50
-25
0
25
50
75
-50
-25
0
25
50
75
'96 '98 '00 '02 '04 '06 '08 '10 '12 '14 '16 '18 '20
1/12
As seen in the
Leads US Economy by 9-14 months
Purchasing Managers Index
Data Source: Institute for Supply Management 1/12 Rate-of-Change
28
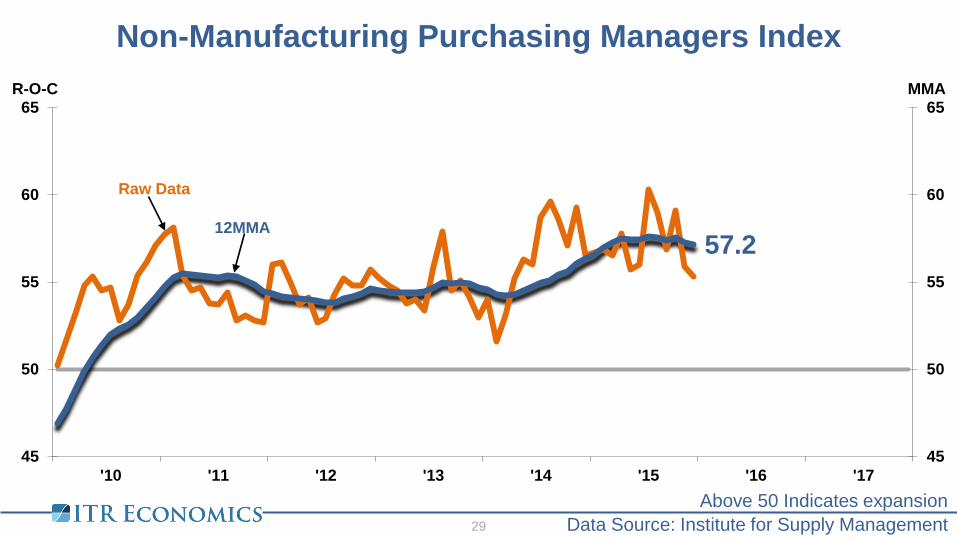
Non-Manufacturing Purchasing Managers Index
29
Above 50 Indicates expansion Data Source: Institute for Supply Management
57.2
45
50
55
60
65
45
50
55
60
65
'10 '11 '12 '13 '14 '15 '16 '17
MMA R-O-C
Raw Data
12MMA
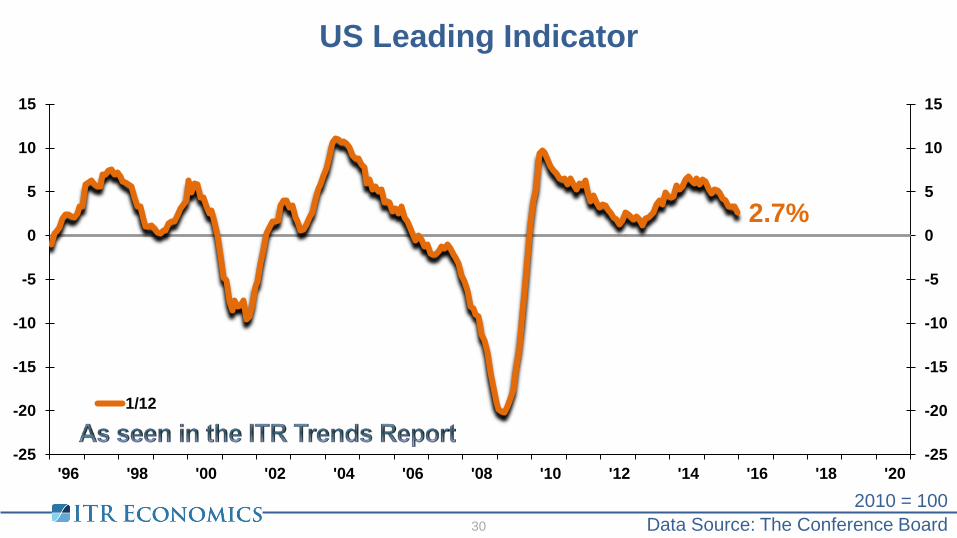
US Leading Indicator
2.7%
-25
-20
-15
-10
-5
0
5
10
15
-25
-20
-15
-10
-5
0
5
10
15
'96 '98 '00 '02 '04 '06 '08 '10 '12 '14 '16 '18 '20
1/12
Data Source: The Conference Board 2010 = 100
30
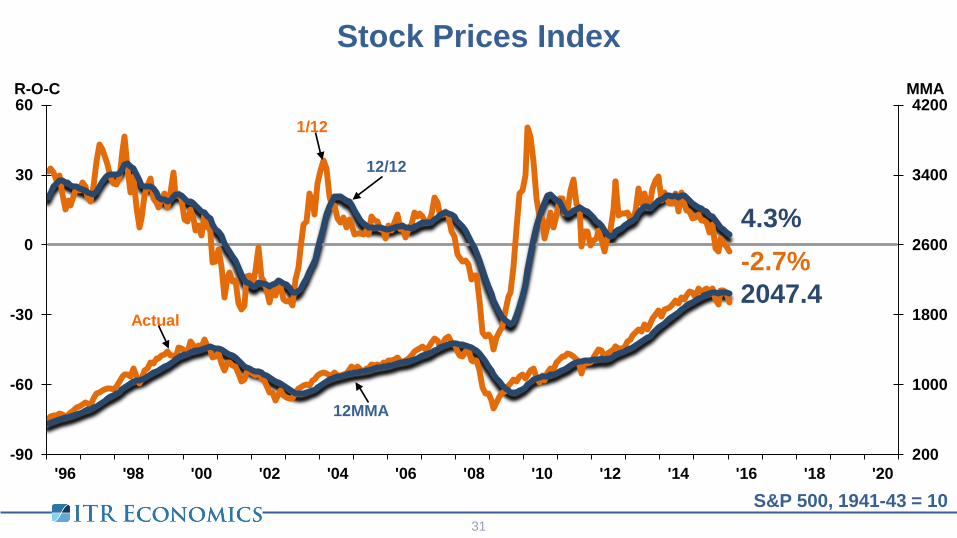
Stock Prices Index
S&P 500, 1941-43 = 10 31
31
-2.7% 4.3%
2047.4
200
1000
1800
2600
3400
4200
-90
-60
-30
0
30
60
'96 '98 '00 '02 '04 '06 '08 '10 '12 '14 '16 '18 '20
MMA R-O-C
1/12
12/12
Actual
12MMA
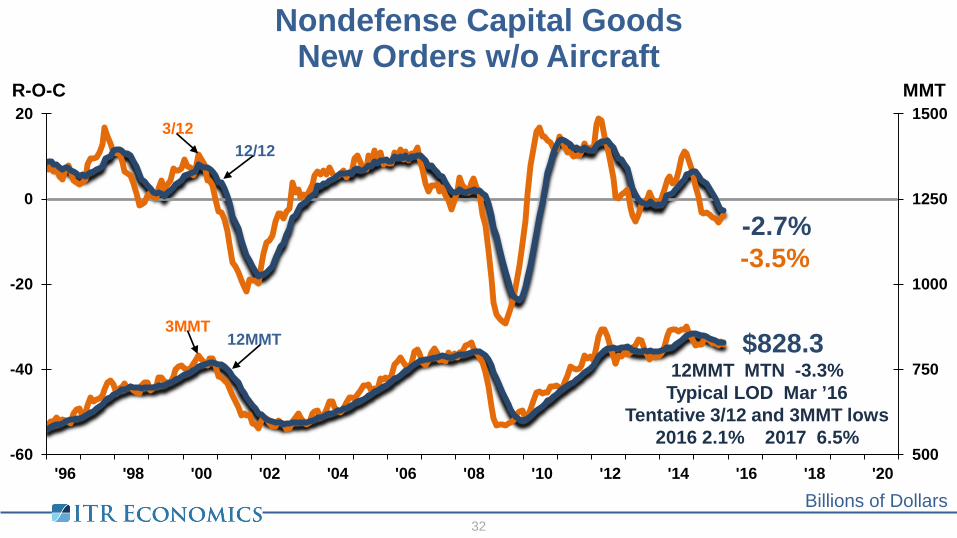
Nondefense Capital Goods New Orders w/o Aircraft
Billions of Dollars 32
-3.5% -2.7%
$828.3
500
750
1000
1250
1500
-60
-40
-20
0
20
'96 '98 '00 '02 '04 '06 '08 '10 '12 '14 '16 '18 '20
MMT R-O-C
3/12 12/12
3MMT 12MMT
12MMT MTN -3.3% Typical LOD Mar ’16
Tentative 3/12 and 3MMT lows 2016 2.1% 2017 6.5%
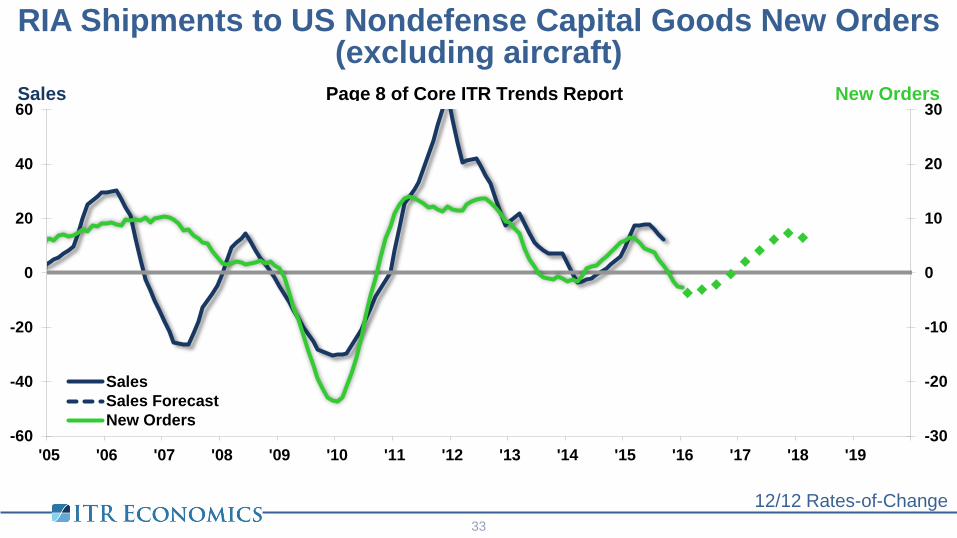
RIA Shipments to US Nondefense Capital Goods New Orders (excluding aircraft)
12/12 Rates-of-Change 33
-30
-20
-10
0
10
20
30
-60
-40
-20
0
20
40
60
'05 '06 '07 '08 '09 '10 '11 '12 '13 '14 '15 '16 '17 '18 '19
SalesSales ForecastNew Orders
New Orders Page 8 of Core ITR Trends Report Sales
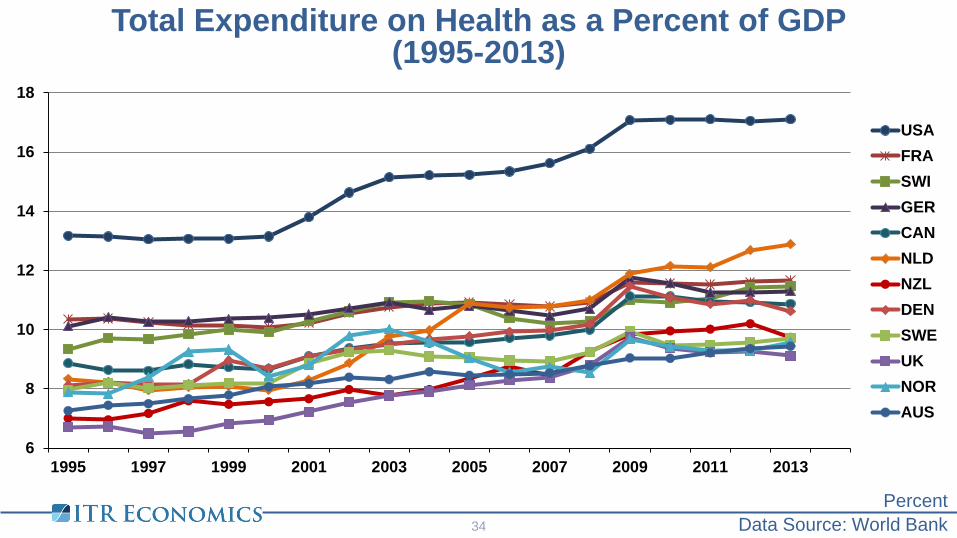
Total Expenditure on Health as a Percent of GDP (1995-2013)
Data Source: World Bank Percent
34
6
8
10
12
14
16
18
1995 1997 1999 2001 2003 2005 2007 2009 2011 2013
USAFRASWIGERCANNLDNZLDENSWEUKNORAUS
0
20
40
60
80
100
120
140
0
20
40
60
80
100
120
140
1920 1930 1940 1950 1960 1970 1980 1990 2000 2010 2020
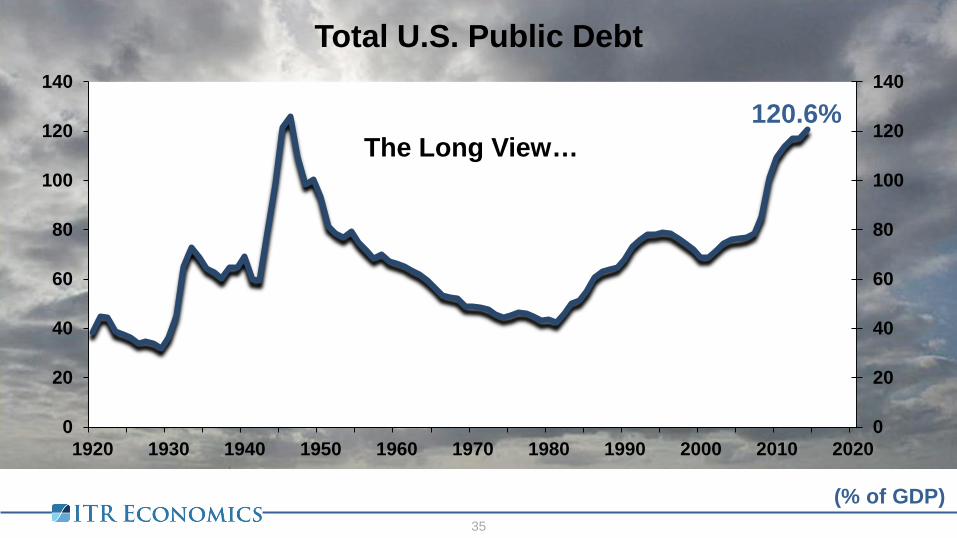
120.6%
Total U.S. Public Debt
35
(% of GDP)
The Long View…

The next Great Depression is coming.
Are you ready?
Order your copy today from Barnes & Noble.
Available in e-book and print format.
36
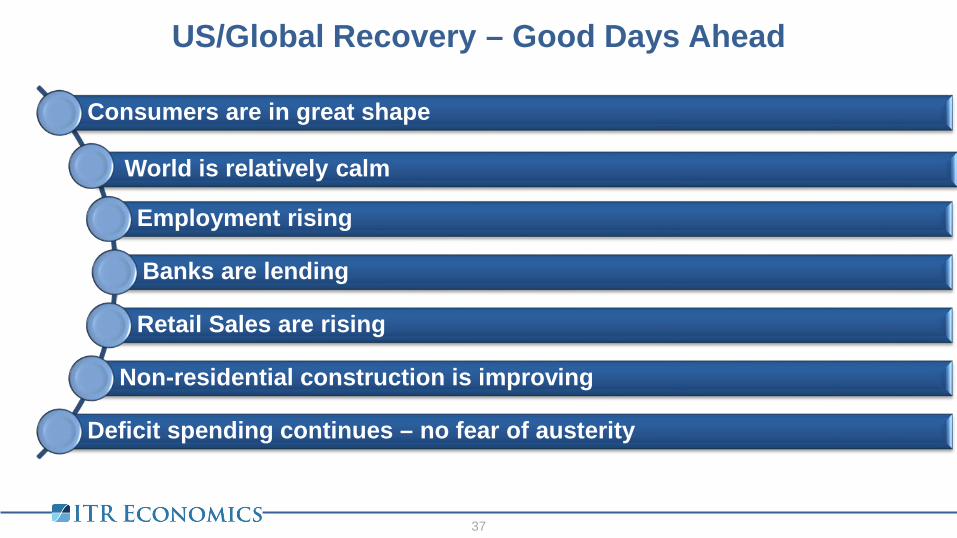
US/Global Recovery – Good Days Ahead
37
Consumers are in great shape
World is relatively calm
Employment rising
Banks are lending
Retail Sales are rising
Non-residential construction is improving
Deficit spending continues – no fear of austerity
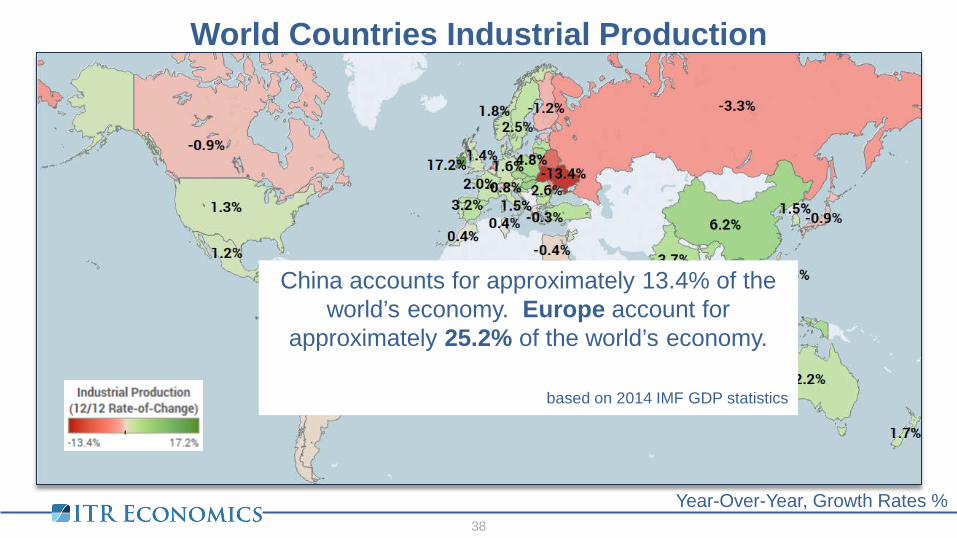
World Countries Industrial Production
Year-Over-Year, Growth Rates % 38
China accounts for approximately 13.4% of the world’s economy. Europe account for
approximately 25.2% of the world’s economy.
based on 2014 IMF GDP statistics
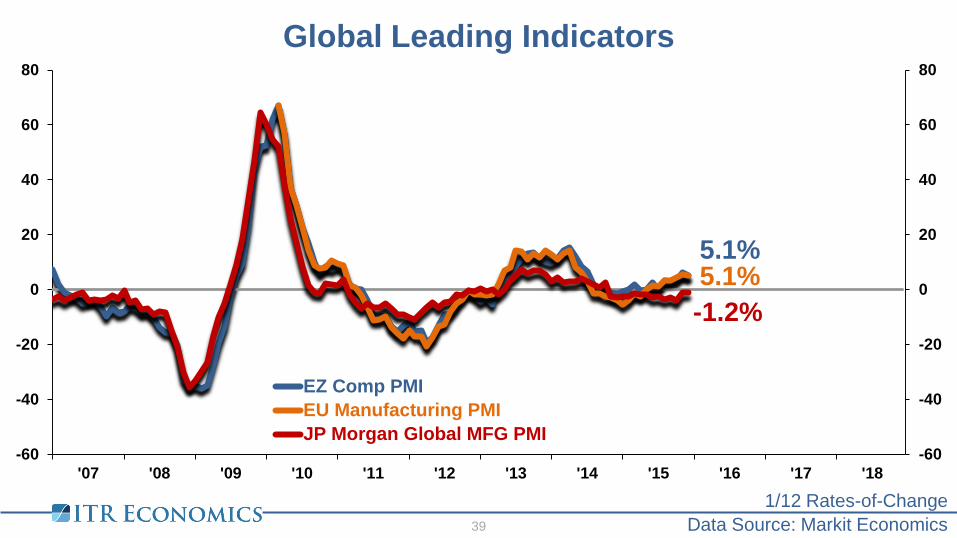
Global Leading Indicators
Data Source: Markit Economics 1/12 Rates-of-Change
39
-1.2% 5.1% 5.1%
-60
-40
-20
0
20
40
60
80
-60
-40
-20
0
20
40
60
80
'07 '08 '09 '10 '11 '12 '13 '14 '15 '16 '17 '18
EZ Comp PMIEU Manufacturing PMIJP Morgan Global MFG PMI
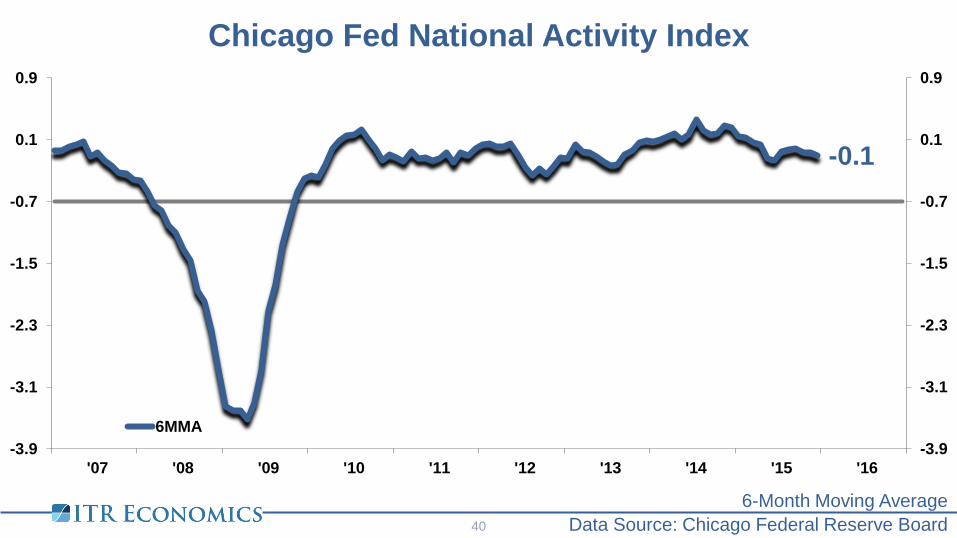
Chicago Fed National Activity Index
Data Source: Chicago Federal Reserve Board
6-Month Moving Average 40
40
-0.1
-3.9
-3.1
-2.3
-1.5
-0.7
0.1
0.9
-3.9
-3.1
-2.3
-1.5
-0.7
0.1
0.9
'07 '08 '09 '10 '11 '12 '13 '14 '15 '16
6MMA
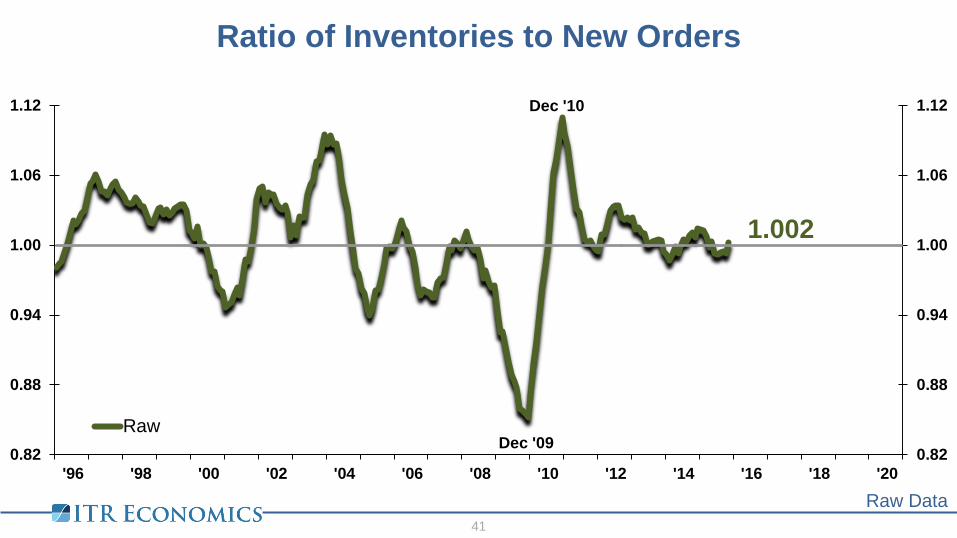
Ratio of Inventories to New Orders
Raw Data 41
1.002
0.82
0.88
0.94
1.00
1.06
1.12
0.82
0.88
0.94
1.00
1.06
1.12
'96 '98 '00 '02 '04 '06 '08 '10 '12 '14 '16 '18 '20
Raw
Dec '10
Dec '09
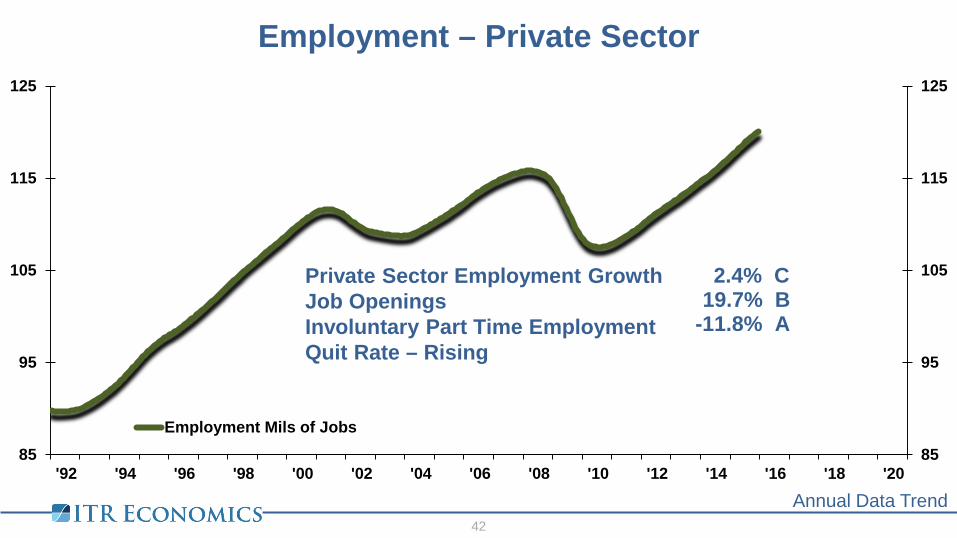
Employment – Private Sector
Annual Data Trend 42
85
95
105
115
125
85
95
105
115
125
'92 '94 '96 '98 '00 '02 '04 '06 '08 '10 '12 '14 '16 '18 '20
Employment Mils of Jobs
Private Sector Employment Growth Job Openings Involuntary Part Time Employment Quit Rate – Rising
19.7% B 2.4% C
-11.8% A
1.0
1.5
2.0
2.5
3.0
3.5
4.0
4.5
5.0
5.5
6.0
6.5
7.0
1.0
1.5
2.0
2.5
3.0
3.5
4.0
4.5
5.0
5.5
6.0
6.5
7.0
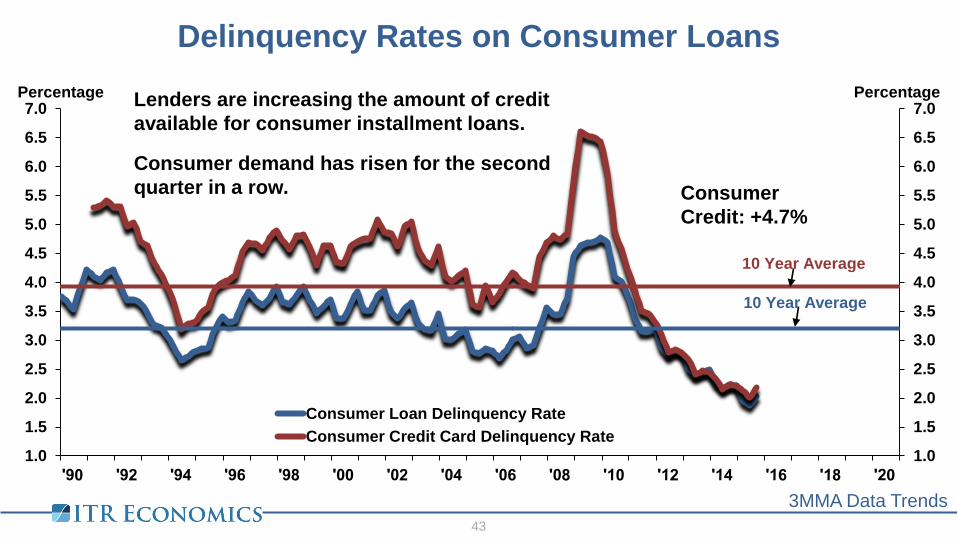
Consumer Loan Delinquency RateConsumer Credit Card Delinquency Rate
Percentage Percentage
10 Year Average
10 Year Average
Delinquency Rates on Consumer Loans
3MMA Data Trends 43
Lenders are increasing the amount of credit available for consumer installment loans.
Consumer demand has risen for the second quarter in a row. Consumer
Credit: +4.7%
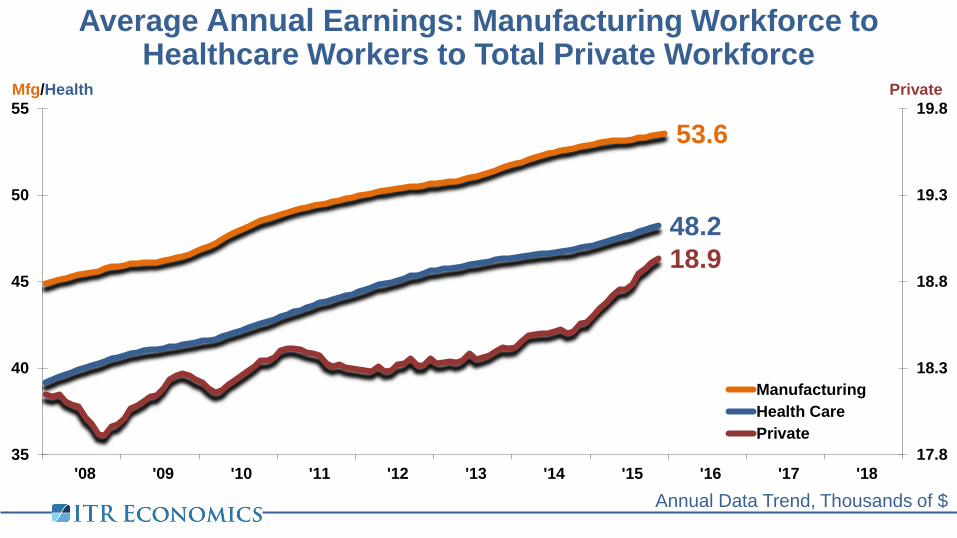
Average Annual Earnings: Manufacturing Workforce to Healthcare Workers to Total Private Workforce
Annual Data Trend, Thousands of $
53.6
48.2 18.9
17.8
18.3
18.8
19.3
19.8
35
40
45
50
55
'08 '09 '10 '11 '12 '13 '14 '15 '16 '17 '18
Private Mfg/Health
ManufacturingHealth CarePrivate
Data Sources: Federal Reserve Bank of St. Louis, U.S. Bureau of Labor Statistics
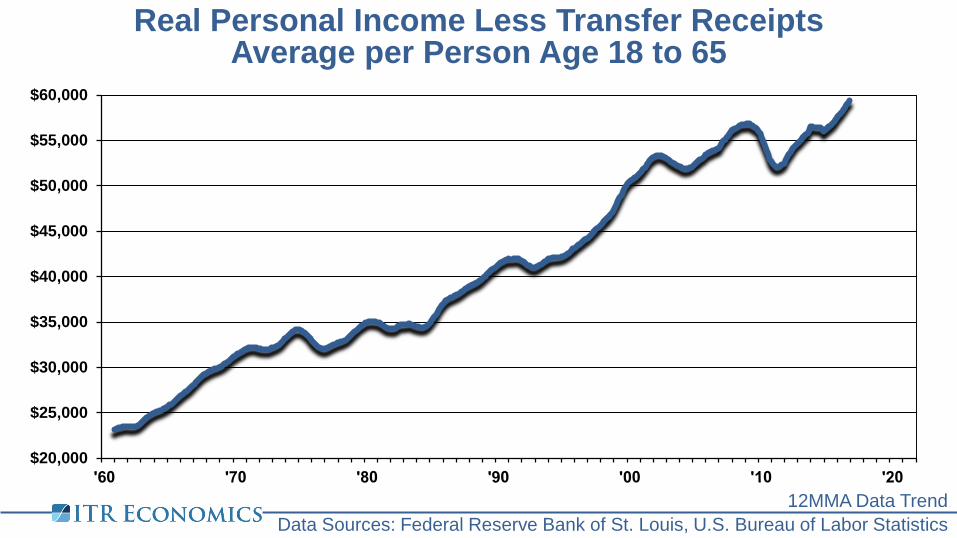
Real Personal Income Less Transfer Receipts Average per Person Age 18 to 65
12MMA Data Trend
$20,000
$25,000
$30,000
$35,000
$40,000
$45,000
$50,000
$55,000
$60,000
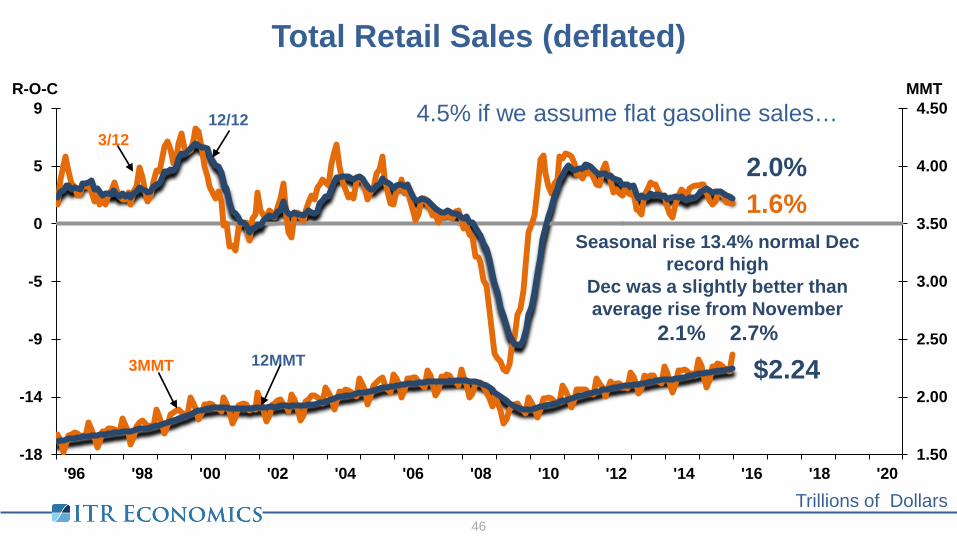
Total Retail Sales (deflated)
46
Trillions of Dollars
1.6% 2.0%
$2.24
1.50
2.00
2.50
3.00
3.50
4.00
4.50
-18
-14
-9
-5
0
5
9
'96 '98 '00 '02 '04 '06 '08 '10 '12 '14 '16 '18 '20
MMT R-O-C
3/12 12/12
3MMT 12MMT
Seasonal rise 13.4% normal Dec record high
Dec was a slightly better than average rise from November
2.1% 2.7%
4.5% if we assume flat gasoline sales…
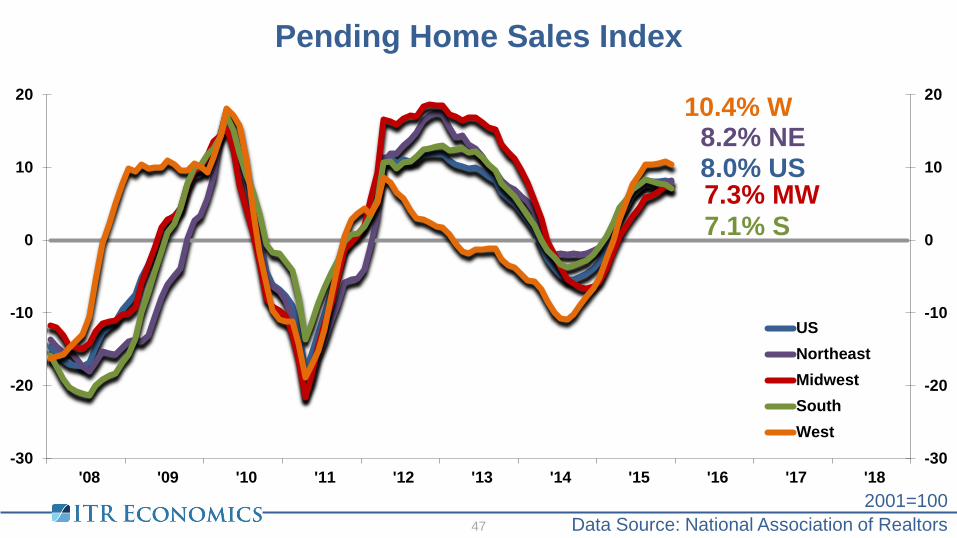
Pending Home Sales Index
Data Source: National Association of Realtors
2001=100 47
8.0% US 8.2% NE
7.1% S
10.4% W
7.3% MW
-30
-20
-10
0
10
20
-30
-20
-10
0
10
20
'08 '09 '10 '11 '12 '13 '14 '15 '16 '17 '18
USNortheastMidwestSouthWest
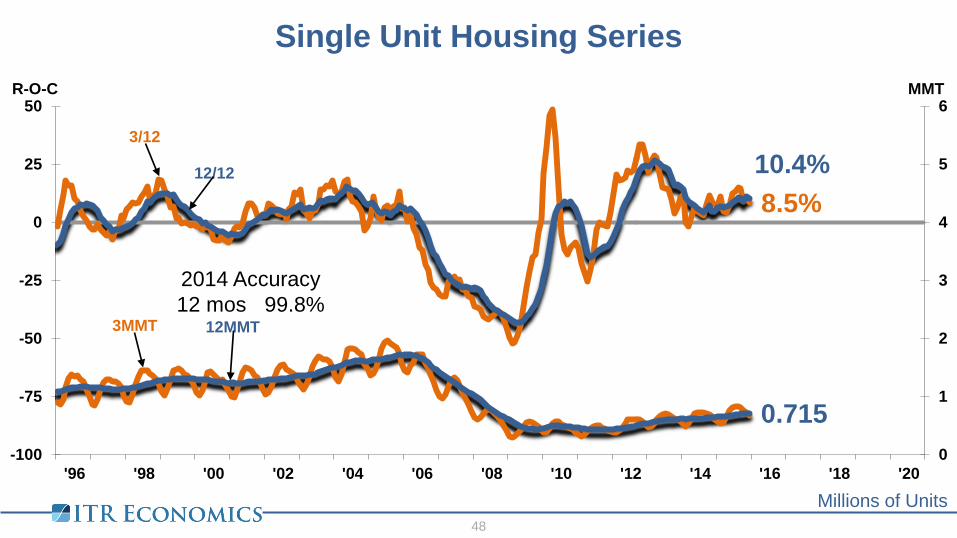
Single Unit Housing Series
Millions of Units 48
8.5% 10.4%
0.715 0
1
2
3
4
5
6
-100
-75
-50
-25
0
25
50
'96 '98 '00 '02 '04 '06 '08 '10 '12 '14 '16 '18 '20
MMT R-O-C
3/12
12/12
3MMT 12MMT
2014 Accuracy 12 mos 99.8%

49 49
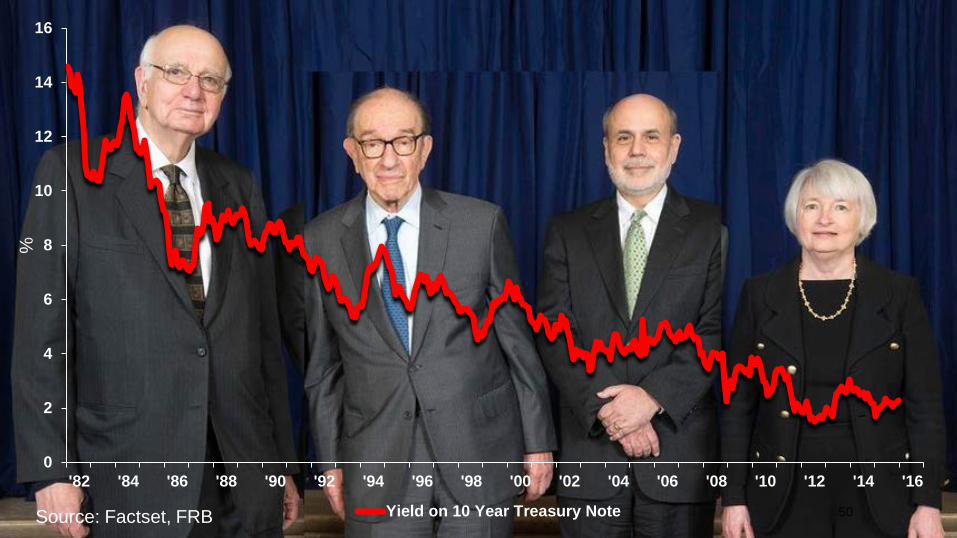
50 Source: Factset, FRB 50
0
2
4
6
8
10
12
14
16
'82 '84 '86 '88 '90 '92 '94 '96 '98 '00 '02 '04 '06 '08 '10 '12 '14 '16
Yield on 10 Year Treasury Note
%
-1
0
1
2
3
4
5
6
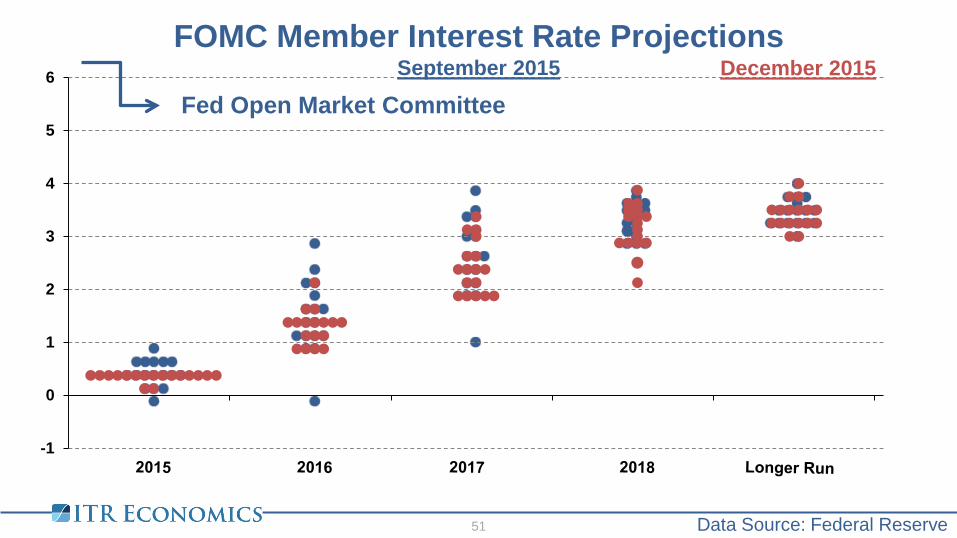
FOMC Member Interest Rate Projections
Data Source: Federal Reserve
51
Fed Open Market Committee December 2015 September 2015
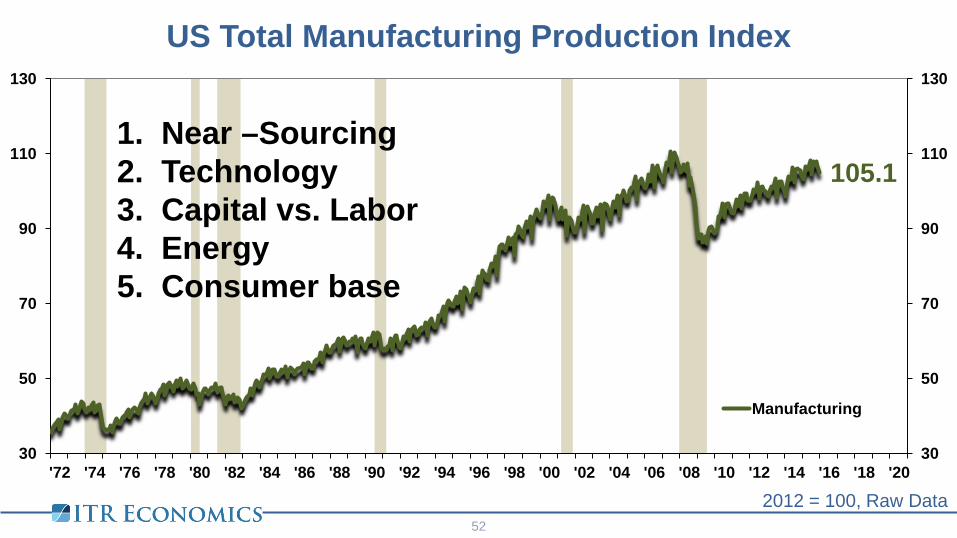
105.1
30
50
70
90
110
130
30
50
70
90
110
130
'72 '74 '76 '78 '80 '82 '84 '86 '88 '90 '92 '94 '96 '98 '00 '02 '04 '06 '08 '10 '12 '14 '16 '18 '20
Manufacturing
US Total Manufacturing Production Index
2012 = 100, Raw Data 52
1. Near –Sourcing 2. Technology 3. Capital vs. Labor 4. Energy 5. Consumer base
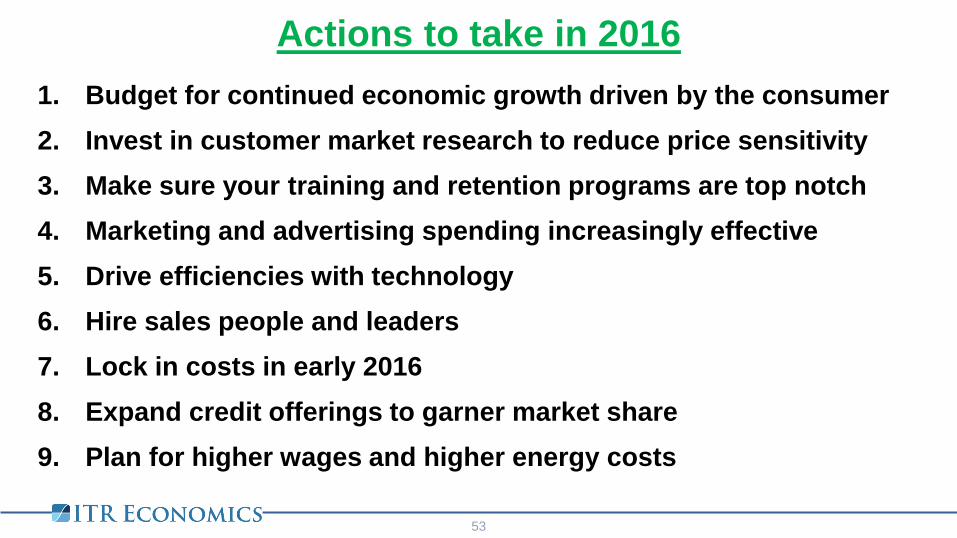
Actions to take in 2016
53
1. Budget for continued economic growth driven by the consumer
2. Invest in customer market research to reduce price sensitivity
3. Make sure your training and retention programs are top notch
4. Marketing and advertising spending increasingly effective
5. Drive efficiencies with technology
6. Hire sales people and leaders
7. Lock in costs in early 2016
8. Expand credit offerings to garner market share
9. Plan for higher wages and higher energy costs

Join our email list!
54
Want to hear more updates like you heard today?