a very-low-protein diet ameliorates advanced diabetic … · 2017-08-24 · * daisuke koya...
TRANSCRIPT
ARTICLE
A very-low-protein diet ameliorates advanced diabeticnephropathy through autophagy induction by suppressionof the mTORC1 pathway in Wistar fatty rats, an animal modelof type 2 diabetes and obesity
Munehiro Kitada1,2 & Yoshio Ogura2 & Taeko Suzuki2 & Shi Sen1,2& Seon Myeong Lee1,2 &
Keizo Kanasaki1,2 & Shinji Kume3 & Daisuke Koya1,2
Received: 26 January 2016 /Accepted: 22 February 2016 /Published online: 28 March 2016# Springer-Verlag Berlin Heidelberg 2016
AbstractAims/hypothesis The efficacy of a low-protein diet (LPD) ondiabetic nephropathy is controversial. We aimed to investigatethe renoprotective effects of an LPD and the underlying mo-lecular mechanism in a rat model of type 2 diabetes andobesity.Methods Diabetic male Wistar fatty (fa/fa) rats (WFRs) weretreated with a standard diet (23.84% protein) or an LPD(5.77% protein) for 20 weeks from 24 weeks of age. We in-vestigated the effect of the LPD on renal function, fibrosis,tubular cell damage, inflammation, mitochondrial morpholo-gy of proximal tubular cells (PTCs), apoptosis, autophagy andactivation of mammalian target of rapamycin complex 1(mTORC1).Results Kidney weight, albuminuria, excretion of urinaryliver-type fatty acid binding protein, levels of plasma cystatinC and changes in renal histology, including fibrosis, tubular
cell damage and inflammation, were aggravated in WFRscompared with non-diabetic Wistar lean rats (WLRs).Fragmented and swelling mitochondria accumulated inPTCs and apoptosis were enhanced in the kidney of WFRs.Immunohistochemical staining of p62 and p-S6 ribosomalprotein (p-S6RP) in the tubular lesions of WFRs was in-creased compared with WLRs. The LPD intervention clearlyameliorated damage as shown by the assessment of renal func-tion and histology, particularly tubulointerstitial damage indiabetic kidneys. Additionally, the 5.77% LPD, but not the11.46% LPD, significantly suppressed p-S6RP levels and in-creased microtubule-associated protein light chain 3-II levelsin the renal cortex. The LPD intervention partially decreasedHbA1c levels in WFRs, and no differences in mean BP wereobserved among any of the groups.Conclusions/interpretation Avery-low-protein diet improvedadvanced diabetic renal injuries, including tubulointerstitialdamage, by restoring autophagy through the suppression ofthe mTORC1 pathway.
Keywords Autophagy . Diabetic nephropathy . Low-proteindiet .Mammalian target of rapamycin complex 1 .Wistar fattyrat
AbbreviationsFGF21 Fibroblast growth factor 21GFP Green fluorescent proteinHFD High-fat dietIPGTT Intraperitoneal glucose tolerance testIPITT Intraperitoneal insulin tolerance testKIM-1 Kidney injury molecule-1L-FABP Liver-type fatty acid binding proteinLC3 Microtubule-associated protein light chain 3
Electronic supplementary material The online version of this article(doi:10.1007/s00125-016-3925-4) contains peer-reviewed but uneditedsupplementary material, which is available to authorised users.
* Munehiro [email protected]
* Daisuke [email protected]
1 Division of Anticipatory Molecular Food Science and Technology,Medical Research Institute, Kanazawa Medical University,Uchinada, Ishikawa, Japan
2 Department of Diabetology and Endocrinology, Kanazawa MedicalUniversity, Uchinada, Ishikawa, Japan 920-0293
3 Department of Medicine, Shiga University of Medical Science,Ōtsu, Shiga, Japan
Diabetologia (2016) 59:1307–1317DOI 10.1007/s00125-016-3925-4

LPD Low-protein dietMCP-1 Monocyte chemotactic protein 1MT Masson’s trichromemTORC1 Mammalian target of rapamycin complex 1PAS Periodic acid–SchiffPTCs Proximal tubular cellsS6RP S6 ribosomal proteinSTD Standard dietTLR2 Toll-like receptor 2VLPD Very-low-protein dietWFRs Wistar fatty ratsWLRs Wistar lean rats
Introduction
Diabetic nephropathy develops in 40% of patients with diabe-tes and remains the leading cause of end-stage kidney diseaseworldwide [1]. Multifactorial management, including diettherapy and glycaemic, BP and lipid control, is recommendedfor diabetic nephropathy. Regarding diet therapy, the efficacyof a low-protein diet (LPD) for advanced diabetic nephropathyremains controversial [2]. Previous clinical studies have notconsistently shown beneficial effects of an LPD for the pres-ervation of renal function in diabetic nephropathy [3–8].However, other studies have shown that an LPD has beneficialeffects in slowing the progressive decline in renal function [9,10]. Nezu et al showed that an LPD for diabetic nephropathyimproves the estimated glomerular filtration rate when pa-tients adhere to a protein-restricted diet [11]. However, LPDadherence is often poor [3, 11], which has contributed to thecontroversial results of previous clinical studies. In addition,the amount of protein restriction would be expected to beimportant for renoprotection. Ideura et al reported that avery-low-protein diet (VLPD) consisting of less than0.5 g kg−1 day−1 in the absence of malnutrition significantlysuppressed renal dysfunction in patients with chronic glomer-ular nephritis who had serum creatinine levels of more than530.6 μmol/l [12]. Thus, an LPD, particularly a VLPD with-out malnutrition, should have beneficial effects on advanceddiabetic nephropathy as well as on chronic glomerular nephri-tis. Furthermore, regarding the mechanisms underlying therenoprotective effects of an LPD, data from previous animalexperiments have shown that the main effects of an LPDmight be to prevent the onset of diabetic nephropathy by im-proving abnormal metabolic factors and haemodynamicsthrough multiple mechanisms, including improvements inglomerular hypertension, capillary resistance and hypertrophy[13–17]. The degree of tubulointerstitial damage rather thanglomerular damage is predictively related to renal functiondecline [18–20]. However, the detailed molecular mecha-nisms underlying the effect of an LPD on renal tubular cellsremain unclear. Furthermore, it has never been reported
whether interventional treatment with an LPD improves ad-vanced diabetic nephropathy.
Autophagy is a lysosomal degradation pathway thatremoves protein aggregates and damaged or excess organellessuch as mitochondria, thereby contributing to the maintenanceof intracellular homeostasis under various stress conditions[21]. Impairment of autophagy is observed in renal cells, in-cluding tubular cells, and is implicated in the pathogenesis ofkidney diseases, including diabetic nephropathy. Therefore,improvement of autophagy should be the therapeutic targetfor diabetic nephropathy. Nutrient-sensing pathways that de-pend on extracellular nutrient conditions are recognised asfactors that regulate autophagy [22, 23]. The mammalian tar-get of rapamycin complex 1 (mTORC1) pathway is activatedby a state of overnutrition, resulting in the suppression ofautophagy. Previous reports have shown that mTORC1 activ-ity is increased in renal cells, including tubular cells, in thediabetic state [24–26]. Because amino acids are recognised asmTORC1 activators [27], an LPD, which involves amino acidrestriction, should suppress the mTORC1 pathway. Therefore,we hypothesised that an LPD might activate autophagy byinhibiting the mTORC1 pathway in renal cells, particularlytubular cells, thereby leading to renoprotection during diabeticnephropathy. To examine this hypothesis, we characterised theeffects of an interventional VLPD on advanced diabetic ne-phropathy inWistar fatty (fa/fa) rats (WFRs), an animal modelof type 2 diabetes and obesity.
Methods
Materials For details regarding materials, please refer to theelectronic supplementary material (ESM) Methods.
Experimental animals Male and female Wistar lean (fa/+)rats (WLRs) were provided by the Takeda PharmaceuticalCompany Biological Institute (Osaka, Japan) [28] and main-tained at Kanazawa Medical University. Male diabetic WFRsand age-matched non-diabetic WLRs were used. At 24 weeksof age, the rats were divided into four groups: (1) WLRs fed astandard diet (STD); (2) WLRs fed an LPD; (3) WFRs fed anSTD; and (4) WFRs fed an LPD. The STD comprised 23.84%protein, 16.80% fat, 59.36% carbohydrates and 14.85 kJ/genergy. The LPD comprised 5.77% protein, 16.48% fat,77.75% carbohydrates and 14.81 kJ/g energy. The dietary in-tervention was performed for 20 weeks. We also used chowcomprising 11.46% protein, 16.58% fat, 71.97% carbohy-drates and 14.81 kJ/g energy for some experiments, and someWFRs were fed 30% calorie-restricted chow during the exper-imental period.
The Research Center for Animal Life Science of KanazawaMedical University approved all experiments, and all
1308 Diabetologia (2016) 59:1307–1317
experiments were performed in accordance with relevantguidelines and regulation (for further details, see ESMMethods.).
Biochemical measurements HbA1c levels were measuredusing a DCA 2000 Analyzer (Siemens Medical SolutionsDiagnostics, Tokyo, Japan) at the end of the experiment. Anintraperitoneal glucose tolerance test (IPGTT) and an intraperi-toneal insulin tolerance test (IPITT) were performed at 20 weeksof intervention, as previously described [29]. Urinary albuminand liver-type fatty acid binding protein (L-FABP), plasmacystatin C, insulin and fibroblast growth factor 21 (FGF21)levels were measured using ELISA kits (see ESM Methods).
Morphological analysis and immunohistochemistry,western blot analysis and real-time PCR The kidneysections were stained with Masson’s trichrome (MT)/periodicacid–Schiff (PAS) reagent, and immunohistochemical stainingwas performed using antibodies against CD68 (1:50), kidneyinjury molecule-1 (KIM-1) (1:100), p62 (1:100) and p-S6 ribo-somal protein (S6RP) (1:100), as previously described [28, 30,31]. (For further details of morphological and immunohisto-chemical analysis, see ESM Methods.) Western blotting wasperformed using antibodies to cleaved caspase-3 (1:1000), β-actin (1:1000), p-S6RP (1:1000), S6RP (1:1000), p-Akt(1:1000), Akt (1:1000) and microtubule-associated proteinlight chain 3 (LC3)-I/II (1:1000). The isolation of total RNAfrom the renal cortex, cDNA synthesis and quantitative real-time PCR were performed, as previously described [28].TaqMan probes for type III collagen, CD68, IL-6, TNF-α,monocyte chemotactic protein 1 (MCP-1) and toll-like receptor2 (TLR2) were purchased from Thermo Fisher Scientific(Waltham, MA, USA). The analytical data were adjusted tothe levels of 18S mRNA expression as an internal control.
Transmission electron microscopy Mitochondrial morphol-ogy and fragmented mitochondria in the proximal tubularcells (PTCs) were observed using transmission electron mi-croscopy, as previously described [28, 32]. (For further detailsregarding electron microscopic mitochondrial morphology,see ESM Methods.)
Monitoring autophagosomes in renal proximal tubularcells using LC3–green fluorescent protein transgenic miceMale LC3-green fluorescent protein (GFP) mice (C57BL/6background) were obtained from Riken BioResource Center(Ibaraki, Japan). Twelve-week-old mice were fed an STD or ahigh-fat diet (HFD) for 4 weeks; a subset of HFD-fed micewere then switched to an LPD for 2 days. After 48 h of star-vation, we determined the autophagy in PTCs, as previouslydescribed [33].
Statistical analysis Data are expressed as means ± SD.ANOVA followed by Tukey’s multiple comparison test wasused to determine the significance of pairwise differences amongthree or more groups, and Student’s t test was used for unpairedcomparisons. A p value of <0.05 was considered significant.
Results
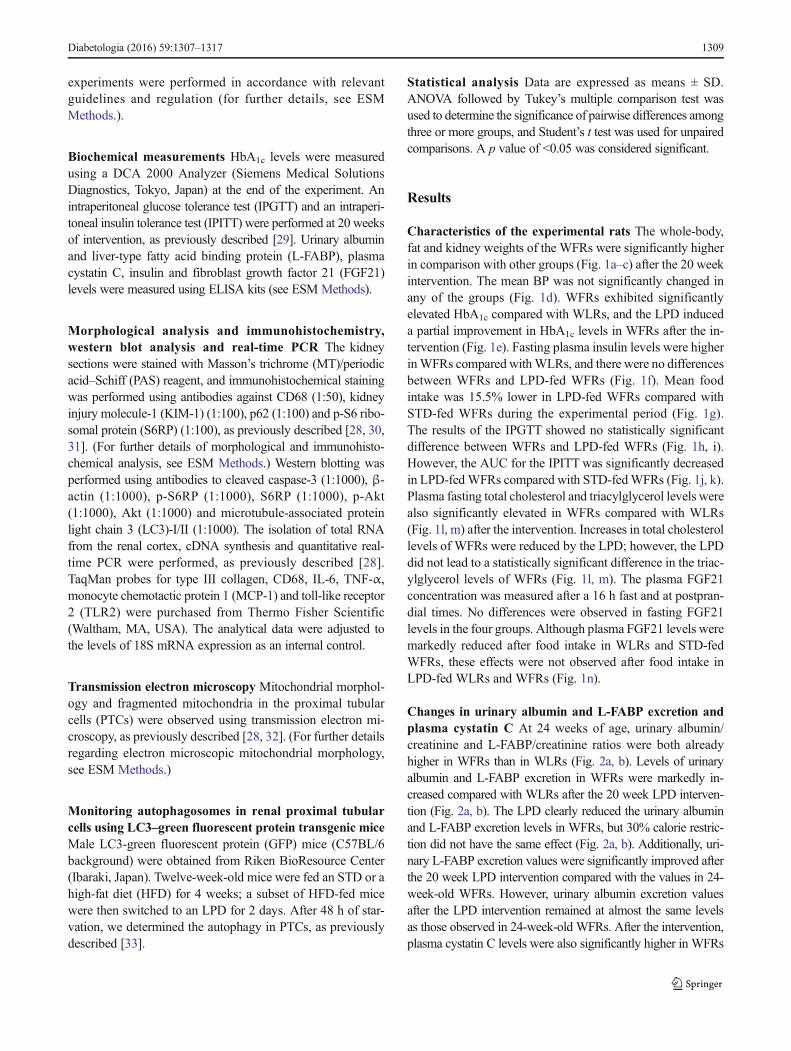
Characteristics of the experimental rats The whole-body,fat and kidney weights of the WFRs were significantly higherin comparison with other groups (Fig. 1a–c) after the 20 weekintervention. The mean BP was not significantly changed inany of the groups (Fig. 1d). WFRs exhibited significantlyelevated HbA1c compared with WLRs, and the LPD induceda partial improvement in HbA1c levels in WFRs after the in-tervention (Fig. 1e). Fasting plasma insulin levels were higherinWFRs compared withWLRs, and there were no differencesbetween WFRs and LPD-fed WFRs (Fig. 1f). Mean foodintake was 15.5% lower in LPD-fed WFRs compared withSTD-fed WFRs during the experimental period (Fig. 1g).The results of the IPGTT showed no statistically significantdifference between WFRs and LPD-fed WFRs (Fig. 1h, i).However, the AUC for the IPITT was significantly decreasedin LPD-fedWFRs compared with STD-fedWFRs (Fig. 1j, k).Plasma fasting total cholesterol and triacylglycerol levels werealso significantly elevated in WFRs compared with WLRs(Fig. 1l, m) after the intervention. Increases in total cholesterollevels of WFRs were reduced by the LPD; however, the LPDdid not lead to a statistically significant difference in the triac-ylglycerol levels of WFRs (Fig. 1l, m). The plasma FGF21concentration was measured after a 16 h fast and at postpran-dial times. No differences were observed in fasting FGF21levels in the four groups. Although plasma FGF21 levels weremarkedly reduced after food intake in WLRs and STD-fedWFRs, these effects were not observed after food intake inLPD-fed WLRs and WFRs (Fig. 1n).
Changes in urinary albumin and L-FABP excretion andplasma cystatin C At 24 weeks of age, urinary albumin/creatinine and L-FABP/creatinine ratios were both alreadyhigher in WFRs than in WLRs (Fig. 2a, b). Levels of urinaryalbumin and L-FABP excretion in WFRs were markedly in-creased compared with WLRs after the 20 week LPD interven-tion (Fig. 2a, b). The LPD clearly reduced the urinary albuminand L-FABP excretion levels in WFRs, but 30% calorie restric-tion did not have the same effect (Fig. 2a, b). Additionally, uri-nary L-FABP excretion values were significantly improved afterthe 20 week LPD intervention compared with the values in 24-week-old WFRs. However, urinary albumin excretion valuesafter the LPD intervention remained at almost the same levelsas those observed in 24-week-old WFRs. After the intervention,plasma cystatin C levels were also significantly higher in WFRs
Diabetologia (2016) 59:1307–1317 1309
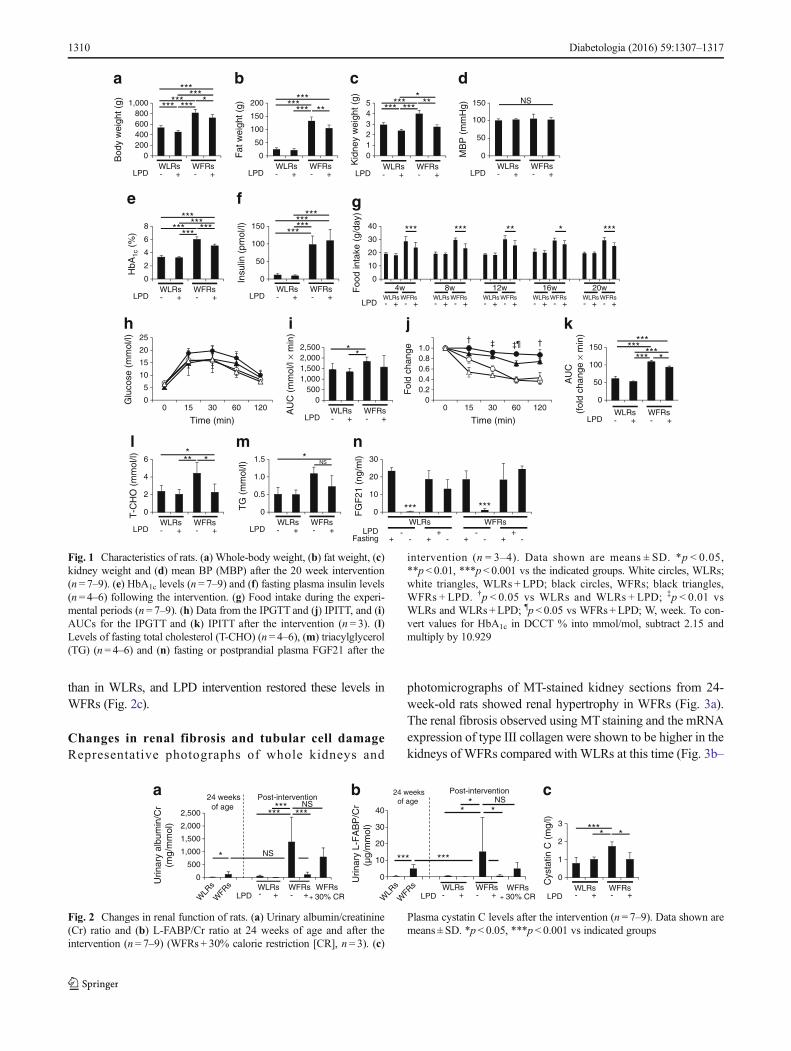
than in WLRs, and LPD intervention restored these levels inWFRs (Fig. 2c).
Changes in renal fibrosis and tubular cell damageRepresentative photographs of whole kidneys and
photomicrographs of MT-stained kidney sections from 24-week-old rats showed renal hypertrophy in WFRs (Fig. 3a).The renal fibrosis observed using MTstaining and the mRNAexpression of type III collagen were shown to be higher in thekidneys of WFRs compared with WLRs at this time (Fig. 3b–
e
LPD
****** ***
*** ***
f***
g
ca db***
LPD
*********
*** *
0
1,000800600400200
Bod
y w
eigh
t (g)
LPD
********* **200
150
100
50
0Fat
wei
ght (
g)
LPD
*******
*** **
10
2345
Kid
ney
wei
ght (
g) NS
LPD
0
50
100
150
MB
P (
mm
Hg)
0
2
4
6
8
HbA
1c (
%)
LPD
******
***
0
50
100
150
Insu
lin (
pmol
/l) ***
4w 8w 12w 16w 20w- -+ +WLRs WFRs
- -+ +WLRs WFRs
- -+ +WLRs WFRs
- -+ +WLRs WFRs
- -+ +WLRs WFRs
- -+ +WLRs WFRs
WLRs WFRs WLRs WFRs WLRs WFRs WLRs WFRs WLRs WFRsLPD - + - + - + - + - + - + - + - + - + - +
*** ** ****
0
10
20
30
40
Foo
d in
take
(g/
day)
5
0
15
10
25
20
Time (min)
Glu
cose
(m
mol
/l)
ih
LPD
* *2,5002,0001,5001,000
5000
AU
C (
mm
ol/l
× m
in)
kj
LPD
0 15 30 60 120- -+ +WLRs WFRs
- -+ +WLRs WFRs
******
*******
0
50
100
150
AU
C(f
old
chan
ge ×
min
)
0 15 30 60 120
Time (min)
0
1.00.80.60.40.2F
old
chan
ge
¶† ‡ ‡ †
l nm*** *
LPD
6
4
2
0T-C
HO
(m
mol
/l)
*** ***WLRs WFRs
LPD - + - +Fasting -+ -+ -+ -+
0
10
20
30
FG
F21
(ng
/ml)* NS
0
0.5
1.5
1.0
TG
(m
mol
/l)
LPD- -+ +WLRs WFRs
- -+ +WLRs WFRs
Fig. 1 Characteristics of rats. (a) Whole-body weight, (b) fat weight, (c)kidney weight and (d) mean BP (MBP) after the 20 week intervention(n = 7–9). (e) HbA1c levels (n = 7–9) and (f) fasting plasma insulin levels(n = 4–6) following the intervention. (g) Food intake during the experi-mental periods (n= 7–9). (h) Data from the IPGTT and (j) IPITT, and (i)AUCs for the IPGTT and (k) IPITT after the intervention (n = 3). (l)Levels of fasting total cholesterol (T-CHO) (n = 4–6), (m) triacylglycerol(TG) (n= 4–6) and (n) fasting or postprandial plasma FGF21 after the
intervention (n = 3–4). Data shown are means ± SD. *p < 0.05,**p< 0.01, ***p< 0.001 vs the indicated groups. White circles, WLRs;white triangles, WLRs + LPD; black circles, WFRs; black triangles,WFRs + LPD. †p < 0.05 vs WLRs and WLRs + LPD; ‡p < 0.01 vsWLRs and WLRs+LPD; ¶p < 0.05 vs WFRs +LPD; W, week. To con-vert values for HbA1c in DCCT % into mmol/mol, subtract 2.15 andmultiply by 10.929
a c24 weeks
of age Post-intervention
NS
NS
******
***
*
WLRs WFRs- +LPDW
LRs
WFRs
2,500
2,000
1,500
1,000
500
0Urin
ary
albu
min
/Cr
(mg/
mm
ol)
LPD- +WFRs
+ 30% CRWLRs WFRs- -+ +
* ****
0
1
2
3
Cys
tatin
C (
mg/
l)
b
WLRs WFRsLPD - -+ +
WFRs+ 30% CR
0
10
20
30
40
Urin
ary
L-F
AB
P/C
r(µ
g/m
mol
)
24 weeksof age
Post-interventionNS
**
*
*** ***
WLR
sW
FRs
Fig. 2 Changes in renal function of rats. (a) Urinary albumin/creatinine(Cr) ratio and (b) L-FABP/Cr ratio at 24 weeks of age and after theintervention (n= 7–9) (WFRs + 30% calorie restriction [CR], n= 3). (c)
Plasma cystatin C levels after the intervention (n= 7–9). Data shown aremeans ± SD. *p < 0.05, ***p< 0.001 vs indicated groups
1310 Diabetologia (2016) 59:1307–1317
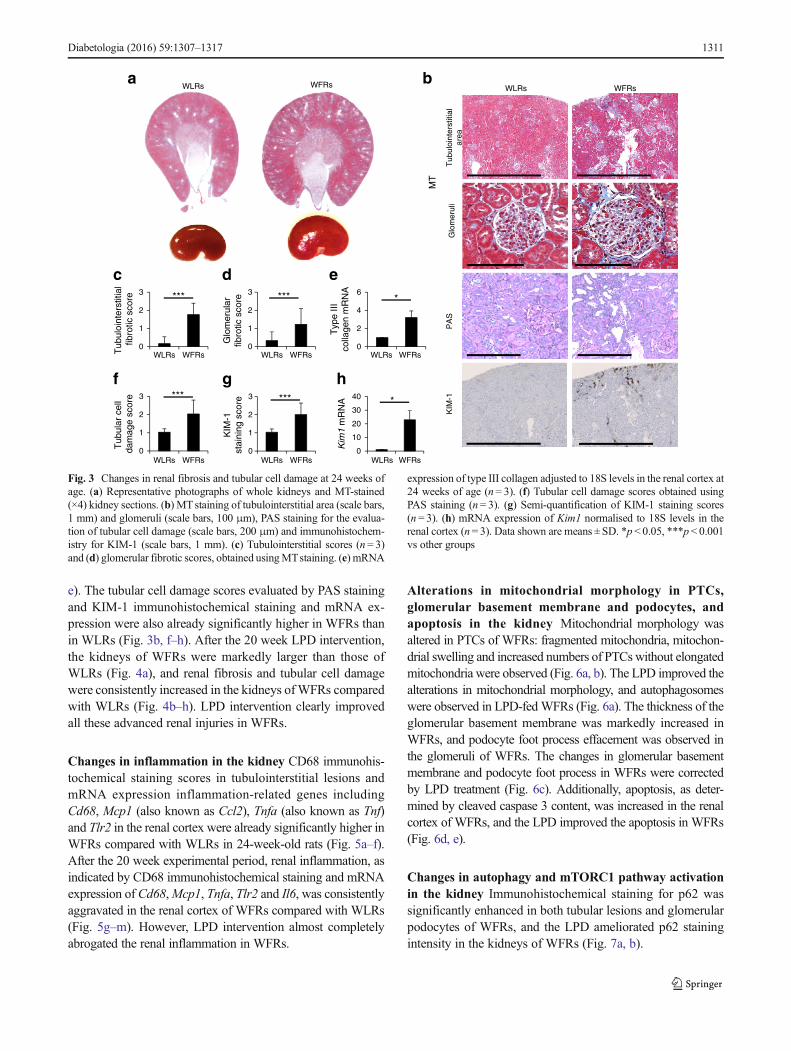
e). The tubular cell damage scores evaluated by PAS stainingand KIM-1 immunohistochemical staining and mRNA ex-pression were also already significantly higher in WFRs thanin WLRs (Fig. 3b, f–h). After the 20 week LPD intervention,the kidneys of WFRs were markedly larger than those ofWLRs (Fig. 4a), and renal fibrosis and tubular cell damagewere consistently increased in the kidneys ofWFRs comparedwith WLRs (Fig. 4b–h). LPD intervention clearly improvedall these advanced renal injuries in WFRs.
Changes in inflammation in the kidney CD68 immunohis-tochemical staining scores in tubulointerstitial lesions andmRNA expression inflammation-related genes includingCd68, Mcp1 (also known as Ccl2), Tnfa (also known as Tnf)and Tlr2 in the renal cortex were already significantly higher inWFRs compared with WLRs in 24-week-old rats (Fig. 5a–f).After the 20 week experimental period, renal inflammation, asindicated by CD68 immunohistochemical staining and mRNAexpression of Cd68,Mcp1, Tnfa, Tlr2 and Il6, was consistentlyaggravated in the renal cortex of WFRs compared with WLRs(Fig. 5g–m). However, LPD intervention almost completelyabrogated the renal inflammation in WFRs.
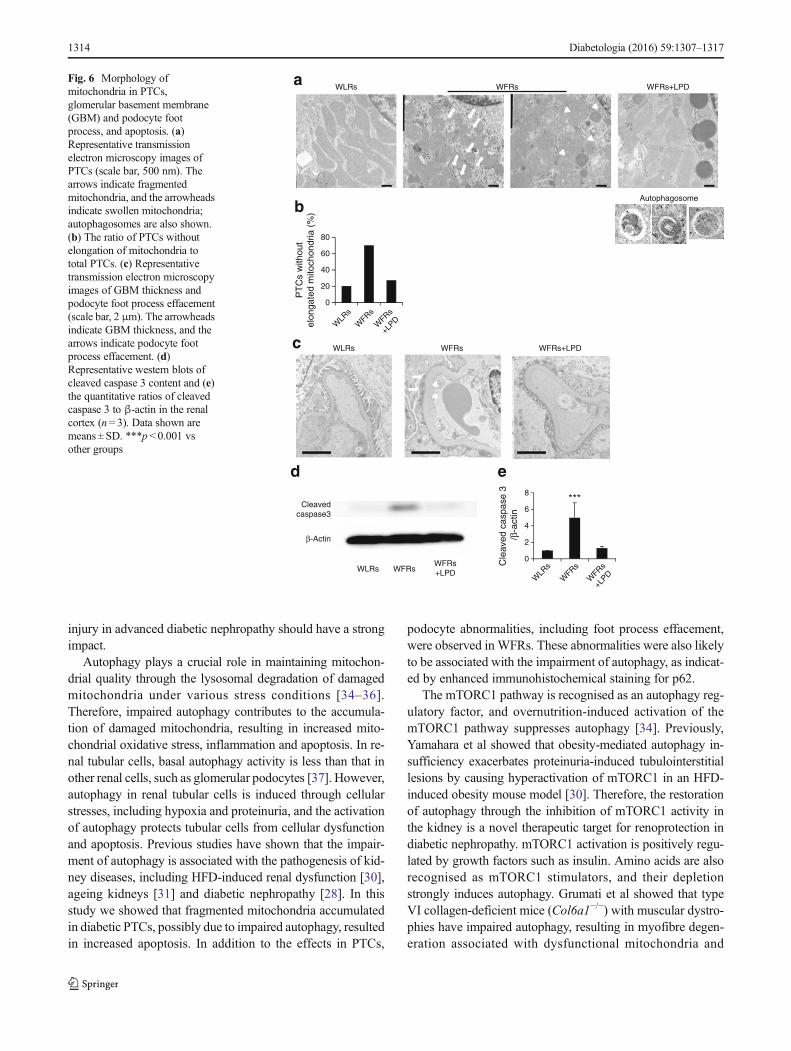
Alterations in mitochondrial morphology in PTCs,glomerular basement membrane and podocytes, andapoptosis in the kidney Mitochondrial morphology wasaltered in PTCs of WFRs: fragmented mitochondria, mitochon-drial swelling and increased numbers of PTCs without elongatedmitochondria were observed (Fig. 6a, b). The LPD improved thealterations in mitochondrial morphology, and autophagosomeswere observed in LPD-fedWFRs (Fig. 6a). The thickness of theglomerular basement membrane was markedly increased inWFRs, and podocyte foot process effacement was observed inthe glomeruli of WFRs. The changes in glomerular basementmembrane and podocyte foot process in WFRs were correctedby LPD treatment (Fig. 6c). Additionally, apoptosis, as deter-mined by cleaved caspase 3 content, was increased in the renalcortex of WFRs, and the LPD improved the apoptosis in WFRs(Fig. 6d, e).
Changes in autophagy and mTORC1 pathway activationin the kidney Immunohistochemical staining for p62 wassignificantly enhanced in both tubular lesions and glomerularpodocytes of WFRs, and the LPD ameliorated p62 stainingintensity in the kidneys of WFRs (Fig. 7a, b).
WLRs WFRsa
Tub
uloi
nter
stiti
al
area
G
lom
erul
i
WLRs WFRs
MT
KIM
-1P
AS
b
c d
***
e
f g h
***
0
1
2
3
Tub
uloi
nter
stiti
al
fibro
tic s
core
WLRs WFRs WLRs WFRs WLRs WFRs
WLRs WFRs WLRs WFRs WLRs WFRs
***
0
1
2
3
Glo
mer
ular
fib
rotic
sco
re
*
0
2
4
6
Typ
e III
colla
gen
mR
NA
0
1
2
3
Tub
ular
cel
l da
mag
e sc
ore ***
0
1
2
3
KIM
-1
stai
ning
sco
re
*
0
10
20
30
40
Kim
1 m
RN
A
Fig. 3 Changes in renal fibrosis and tubular cell damage at 24 weeks ofage. (a) Representative photographs of whole kidneys and MT-stained(×4) kidney sections. (b) MTstaining of tubulointerstitial area (scale bars,1 mm) and glomeruli (scale bars, 100 μm), PAS staining for the evalua-tion of tubular cell damage (scale bars, 200 μm) and immunohistochem-istry for KIM-1 (scale bars, 1 mm). (c) Tubulointerstitial scores (n= 3)and (d) glomerular fibrotic scores, obtained usingMTstaining. (e) mRNA
expression of type III collagen adjusted to 18S levels in the renal cortex at24 weeks of age (n= 3). (f) Tubular cell damage scores obtained usingPAS staining (n= 3). (g) Semi-quantification of KIM-1 staining scores(n = 3). (h) mRNA expression of Kim1 normalised to 18S levels in therenal cortex (n= 3). Data shown are means ± SD. *p < 0.05, ***p< 0.001vs other groups
Diabetologia (2016) 59:1307–1317 1311
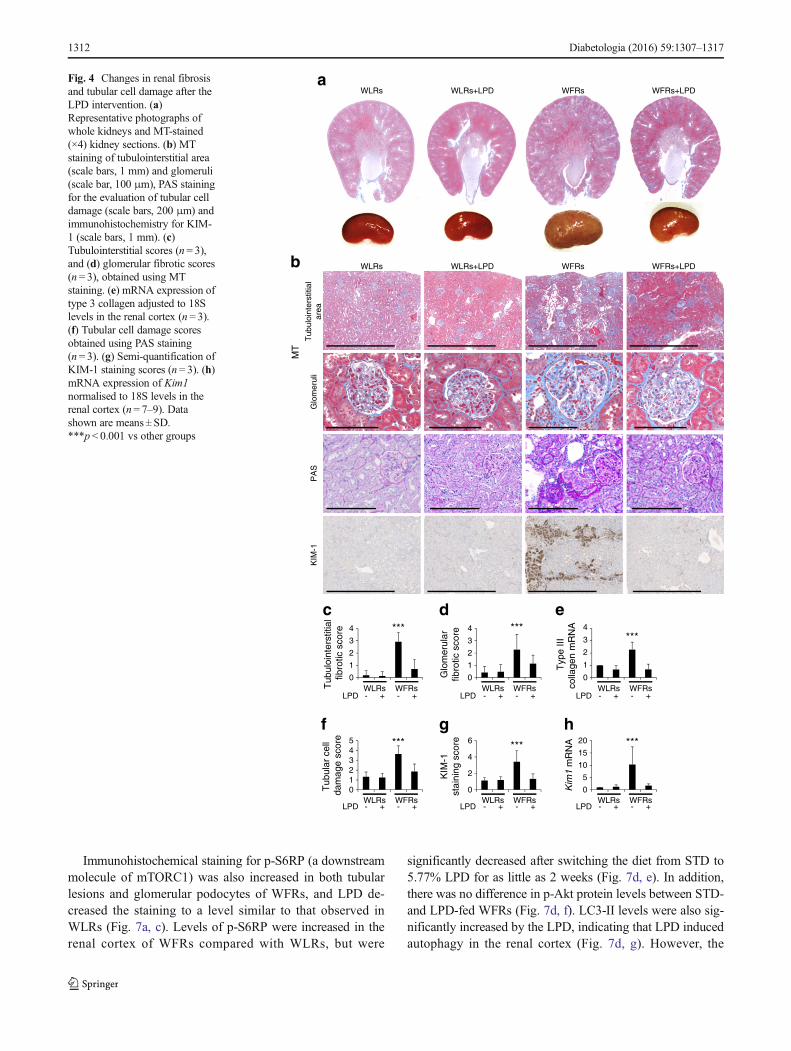
Immunohistochemical staining for p-S6RP (a downstreammolecule of mTORC1) was also increased in both tubularlesions and glomerular podocytes of WFRs, and LPD de-creased the staining to a level similar to that observed inWLRs (Fig. 7a, c). Levels of p-S6RP were increased in therenal cortex of WFRs compared with WLRs, but were
significantly decreased after switching the diet from STD to5.77% LPD for as little as 2 weeks (Fig. 7d, e). In addition,there was no difference in p-Akt protein levels between STD-and LPD-fed WFRs (Fig. 7d, f). LC3-II levels were also sig-nificantly increased by the LPD, indicating that LPD inducedautophagy in the renal cortex (Fig. 7d, g). However, the
WFRsWLRs WLRs+LPD WFRs+LPD
WFRsWLRs WLRs+LPD WFRs+LPD
a
Tub
uloi
nter
stiti
al
area
G
lom
erul
i
MT
KIM
-1P
AS
b
edc
hgf
LPD - -+ +
- -+ +
- -+ +
- -+ +
- -+ +
- -+ +
WLRs WFRs WLRs WFRs WLRs WFRs
WLRs WFRs WLRs WFRs WLRs WFRs
***4
3
1
0
2
Tub
uloi
nter
stiti
al
fibro
tic s
core
LPD
***4
3
1
0
2
Glo
mer
ular
fib
rotic
sco
re
LPD
***4
3
1
0
2
Typ
e III
co
llage
n m
RN
A
LPD
***43
10
2
5
Tub
ular
cel
l da
mag
e sc
ore
LPD
***6
4
0
2KIM
-1
stai
ning
sco
re
LPD
***20
15
5
0
10
Kim
1 m
RN
A
Fig. 4 Changes in renal fibrosisand tubular cell damage after theLPD intervention. (a)Representative photographs ofwhole kidneys and MT-stained(×4) kidney sections. (b) MTstaining of tubulointerstitial area(scale bars, 1 mm) and glomeruli(scale bar, 100 μm), PAS stainingfor the evaluation of tubular celldamage (scale bars, 200 μm) andimmunohistochemistry for KIM-1 (scale bars, 1 mm). (c)Tubulointerstitial scores (n= 3),and (d) glomerular fibrotic scores(n = 3), obtained using MTstaining. (e) mRNA expression oftype 3 collagen adjusted to 18Slevels in the renal cortex (n= 3).(f) Tubular cell damage scoresobtained using PAS staining(n = 3). (g) Semi-quantification ofKIM-1 staining scores (n= 3). (h)mRNA expression of Kim1normalised to 18S levels in therenal cortex (n= 7–9). Datashown are means ± SD.***p< 0.001 vs other groups
1312 Diabetologia (2016) 59:1307–1317

11.46% LPD did not induce suppression of p-S6RP or in-crease in LC3-II levels in the kidneys (Fig. 7h–j).
In addition, mice fed an HFD for 4 weeks showed adecrease in 48 h starvation-induced autophagy in PTCscompared with mice fed an STD. However, in these mice,switching from HFD to LPD for 2 days restored thestarvation-induced autophagy in PTCs. Thus, the LPD inducedautophagy in the PTCs of LC3–GFP transgenic mice (Fig. 7k).
Discussion
In this study we demonstrated that dietary intervention with anLPD dramatically improved advanced diabetes-induced renalinjuries by restoring autophagy through the suppression ofmTORC1.
LPD intervention clearly suppressed the increase in urinaryalbumin and L-FABP excretion and decline in renal functionin WFRs. Furthermore, LPD intervention led to improvementin all indicators of renal injury during the progression of dia-betic nephropathy, particularly in tubulointerstitial lesions. Inaddition, we evaluated the effect of 30% calorie restriction inWFRs to estimate the effect of decreased food intake on dia-betic nephropathy, because the mean food intake in LPD-fed
WFRs was 15.5% less than that of STD-fed WFRs during theexperimental period. Both urinary albumin and L-FABP ex-cretion in calorie-restricted WFRs were partially reduced, butno statistically significant difference was observed comparedwith STD-fed WFRs. HbA1c levels in 30% calorie-restrictedWFRs were 5.4±0.26% (35.52±2.89 mmol/mol), a level thatwas significantly lower than those of STD-fed WFRs and notsignificantly different from LPD-fed WFRs. Increased levelsof urinary albumin and L-FABP excretion were almostcompletely prevented in LPD-fed WFRs, whereas HbA1c
levels in both calorie-restricted WFRs and LPD-fed WFRswere only moderately reduced. Furthermore, urinary L-FABP excretion in WFRs, which was already elevated at24 weeks of age, significantly improved after LPD interven-tion, and LPD intervention inhibited the progression to higherlevels of albuminuria in WFRs after 20 weeks of intervention.Thus, although dietary therapy for diabetes basically involvescalorie restriction, LPD intervention might provide a greaterrenoprotective effect, particularly tubulointerstitial protection,in advanced diabetic nephropathy, compared with calorie re-striction, and this effect might be independent of glucoselevels. Because tubulointerstitial injury is important in theprogression of kidney diseases, including diabetic nephropa-thy, our data showing that LPD improved tubulointerstitial
WLRs WFRs
CD
68
b c
e f
a***
0
1
3
2
CD
68st
aini
ng s
core *
0
1
3
2
Cd6
8 m
RN
A
d*
0
1
3
2
Mcp
1 m
RN
A *4
01
32
Tnf
a m
RN
A *4
01
32
Tlr2
mR
NA
WLRs WFRs
WLRs+LPD WFRs+LPD
ihg
j k
l m
LPD
***43
10
2
5
CD
68st
aini
ng s
core
LPD
***4
3
1
0
2
Cd6
8 m
RN
A
LPD
***15
10
5
0Mcp
1 m
RN
A
LPD
***4
3
1
0
2
Tnf
a m
RN
A
LPD
***3
1
0
2
Il6 m
RN
ALPD
- -+ + - -+ +
- -+ + - -+ +
- -+ + - -+ +
WLRs WFRs WLRs WFRs
WLRs WFRs WLRs WFRs WLRs WFRs
WLRs WFRs WLRs WFRs
WLRs WFRs WLRs WFRs
WLRs WFRs WLRs WFRs
***4
3
1
0
2
Tlr2
mR
NA
Fig. 5 Changes in renalinflammation. Representativephotographs of CD68immunohistochemistry (scale bar,1 mm) at (a) 24 weeks of age and(g) after the intervention. (b)Semi-quantification of CD68staining scores at 24 weeks of age(n = 3) and (h) after theintervention (n= 3). (c) mRNAexpression ofCd68, (d)Mcp1, (e)Tnfa and (f) Tlr2, normalised to18S mRNA expression, in therenal cortex at 24 weeks of age(n = 3). (i) mRNA expression ofCd68, (j) Mcp1, (k) Tnfa, (l) Il6and (m) Tlr2, normalised to 18SmRNA expression, in the renalcortex after the intervention(n = 7–9). Data shown are means± SD. *p< 0.05, ***p< 0.001 vsother groups
Diabetologia (2016) 59:1307–1317 1313
injury in advanced diabetic nephropathy should have a strongimpact.
Autophagy plays a crucial role in maintaining mitochon-drial quality through the lysosomal degradation of damagedmitochondria under various stress conditions [34–36].Therefore, impaired autophagy contributes to the accumula-tion of damaged mitochondria, resulting in increased mito-chondrial oxidative stress, inflammation and apoptosis. In re-nal tubular cells, basal autophagy activity is less than that inother renal cells, such as glomerular podocytes [37]. However,autophagy in renal tubular cells is induced through cellularstresses, including hypoxia and proteinuria, and the activationof autophagy protects tubular cells from cellular dysfunctionand apoptosis. Previous studies have shown that the impair-ment of autophagy is associated with the pathogenesis of kid-ney diseases, including HFD-induced renal dysfunction [30],ageing kidneys [31] and diabetic nephropathy [28]. In thisstudy we showed that fragmented mitochondria accumulatedin diabetic PTCs, possibly due to impaired autophagy, resultedin increased apoptosis. In addition to the effects in PTCs,
podocyte abnormalities, including foot process effacement,were observed in WFRs. These abnormalities were also likelyto be associated with the impairment of autophagy, as indicat-ed by enhanced immunohistochemical staining for p62.
The mTORC1 pathway is recognised as an autophagy reg-ulatory factor, and overnutrition-induced activation of themTORC1 pathway suppresses autophagy [34]. Previously,Yamahara et al showed that obesity-mediated autophagy in-sufficiency exacerbates proteinuria-induced tubulointerstitiallesions by causing hyperactivation of mTORC1 in an HFD-induced obesity mouse model [30]. Therefore, the restorationof autophagy through the inhibition of mTORC1 activity inthe kidney is a novel therapeutic target for renoprotection indiabetic nephropathy. mTORC1 activation is positively regu-lated by growth factors such as insulin. Amino acids are alsorecognised as mTORC1 stimulators, and their depletionstrongly induces autophagy. Grumati et al showed that typeVI collagen-deficient mice (Col6a1−/−) with muscular dystro-phies have impaired autophagy, resulting in myofibre degen-eration associated with dysfunctional mitochondria and
a
Autophagosome
80
60
40
20
0
WLR
s
WFRs
WFRs
+LPD
WLR
s
WFRs
WFRs
+LPD
PT
Cs
with
out
elon
gate
d m
itoch
ondr
ia (
%)b
c
WFRs+LPDWFRsWLRs
WLRs WFRs WFRs+LPD
Cleavedcaspase3
β-Actin
WLRs WFRsWFRs+LPD
***
0
6
4
2
8C
leav
ed c
aspa
se 3
/β
-act
in
ed
Fig. 6 Morphology ofmitochondria in PTCs,glomerular basement membrane(GBM) and podocyte footprocess, and apoptosis. (a)Representative transmissionelectron microscopy images ofPTCs (scale bar, 500 nm). Thearrows indicate fragmentedmitochondria, and the arrowheadsindicate swollen mitochondria;autophagosomes are also shown.(b) The ratio of PTCs withoutelongation of mitochondria tototal PTCs. (c) Representativetransmission electron microscopyimages of GBM thickness andpodocyte foot process effacement(scale bar, 2 μm). The arrowheadsindicate GBM thickness, and thearrows indicate podocyte footprocess effacement. (d)Representative western blots ofcleaved caspase 3 content and (e)the quantitative ratios of cleavedcaspase 3 to β-actin in the renalcortex (n= 3). Data shown aremeans ± SD. ***p < 0.001 vsother groups
1314 Diabetologia (2016) 59:1307–1317

WLRs WFRsWLRs+LPD WFRs+LPD
Tub
uloi
nter
stiti
al
area
Tub
uloi
nter
stiti
al
area
Glo
mer
uli
Glo
mer
uli
p62
a
p-S
6RP
LPD - -+ +
***4
3
1
0
2
p-S
6RP
st
aini
ng s
core
WLRs WFRsLPD - -+ +
WLRs WFRs
***4
3
1
0
2
p62
stai
ning
sco
re
b c
β-Actin
p-S6RP
S6RP
p-Akt
Akt
WLRs WFRsLPD - -+ +
LC3I
II
LPD - -+ +WLRs WFRs
LPD - -+ +WLRs WFRs
****** *** ***3
1
0
2
p-S
6RP
/S6R
P
*** ***8
6
4
2
0
p-A
kt fo
ld c
hang
e to
WLR
s (L
PD
-)
LPD - -+ +WLRs WFRs
**** * ***
1
0
2
LC3-
II fo
ld c
hang
e to
WLR
s (L
PD
-)
fed
g
(1) Standard Diet+48 h starvation
(2) HFD+48 h starvation
(3) HFD→LPD+48 h starvation
p-S6RP
S6RP
LC3I
II
LPDLPD
*** ***
0
4
3
1
2
p-S
6RP
/S6R
P
NS
LPDWLRs WFRs- -+ +
- -+ +WLRs WFRs
- -+ +WLRs WFRs
0.5
0
1
LC3-
II fo
ld c
hang
e to
WLR
s (L
PD
-)
h ji
k
Fig. 7 Changes in autophagy andmTORC1 pathway in the kidney.(a) Representative photographs ofimmunohistochemistry for p62and p-S6RP in tubular lesions(scale bar, 200 μm) and glomeruli(scale bar, 100 μm) (n = 3). (b)Semi-quantification of p62 and(c) p-S6RP staining scores intubulointerstitial lesions (n = 3).(d) Representative western blotsof p-S6RP, S6RP,p-Akt, Akt, LC3-I/II and β-actinin the renal cortex after switchingfrom an STD to the 5.77% LPDfor 2 weeks. (e) Quantitativeratios of p-S6RP to S6RP, (f) foldchange of p-Akt and (g) LC3-II tothose of STD-fed WLRs (n= 3).(h) Representative western blotsof p-S6RP, S6RP and LC3-I/II inthe renal cortex after switchingfrom an STD to the 11.46% LPDfor 2 weeks. (i) Quantitative ratiosof p-S6RP to S6RP and (j) levelsof LC3-II (n= 3). Data shown aremeans ± SD. *p < 0.05,***p< 0.001 vs the indicatedgroups (e, g) or vs theWLRs (f, i).(k) LPD induces autophagy inPTCs of HFD-induced obesemice. Representative images ofPTCs in the kidneys of LC3–GFPtransgenic mice after 48 hstarvation following: (1) an STDfor 4 weeks; (2) an HFD for4 weeks; (3) a 5.77% LPD for2 days after HFD for 4 weeks.The arrows indicate the LC3–GFP-positive puncta
Diabetologia (2016) 59:1307–1317 1315
spontaneous apoptosis [38]. An LPD (5%) restored myofibresurvival and ameliorated the dystrophic phenotype inCol6a1−/− mice by inducing autophagy, which removed thestructurally abnormal mitochondria in a manner similar to thatof rapamycin, an mTOR inhibitor. Similarly, we showed that a5.77% LPD decreased abnormal mitochondria in diabeticPTCs by restoring autophagy through the suppression of themTORC1 pathway, which led to improvement in the featuresof diabetic nephropathy. In addition to renal tubular cells,increased immunohistochemical staining for p62 and p-S6RP in glomerular podocytes was observed. Previous studieshave shown that the activation of mTORC1 in glomerularpodocytes plays a crucial role in the pathogenesis of diabeticnephropathy [25, 26]. However, it remains unclear whethermTORC1 activation in podocytes contributes to the suppres-sion of autophagy in diabetes. We propose that reduced albu-minuria in WFRs reflects LPD-induced restoration of autoph-agy induced by the suppression of the mTORC1 pathway inpodocytes. Furthermore, the 5.77% LPD suppressed themTORC1 pathway and induced autophagy independently ofAkt activation in WFRs. However, the 11.46% LPD did notsuppress p-S6RP levels and induce autophagy in the renalcortex. These data indicate that a VLPD (a 5.77% VLPD,but not an 11.46% LPD) is needed to suppress the mTORC1pathway and induce autophagy in the kidney.
An LPDmay affect metabolism, on the basis that it representsa high-carbohydrate diet compared with an STD. However, re-cent studies in mice have shown that ad libitum high-carbohydrate LPDs improve glucose and lipid metabolism andlongevity [39]. In the present study, body weight, fat weight,HbA1c and total cholesterol levels were reduced in LPD-fedWFRs compared with STD-fed WFRs. Additionally, the in-creased levels of FGF21 may be related to LPD-induced meta-bolic improvement. Laeger et al demonstrated that serum levelsof FGF21 specifically increased on exposure to an LPD, regard-less of overall calorie intake, in both rodents and humans [40].FGF21 exerts beneficial effects on energy metabolism, such asincreasing glucose uptake into adipose tissue and lowering bodyweight through increased energy expenditure [41]. Although nodifferences in fasting FGF21 levels were observed among thefour groups, the non-fasting FGF21 levels in both WLRs andLPD-fedWFRswere not reduced; however, theywere decreasedin WLRs and STD-fed WFRs. Thus, we propose that both foodintake reduction and continuous high levels of FGF21 might beassociated with lowering blood glucose levels and body and fatweight in WFRs.
In conclusion, this study clearly indicates that VLPD is abeneficial diet therapy for the improvement of advanced dia-betic nephropathy by restoring autophagy through the sup-pression of the mTORC1 pathway in an animal model of type2 diabetes and obesity. Some patients with advanced diabeticnephropathy rapidly progress to end-stage kidney disease, de-spite having received adequate multifactorial treatment.
Therefore, a VLPD without malnutrition should be furtherconsidered as a clinically relevant means of suppressing thedecline in renal function during advanced diabetic nephropa-thy. However, there may be some issues associated with long-term use of a VLPD in patients, including sarcopenia, frailtyor protein-energy wasting, as well as issues associated withadherence to a VLPD. It is also still unknown which aminoacids should be restricted for the greatest renoprotection.Therefore, further studies are needed to resolve these pointsand to develop more useful dietary protocols or replacementsfor VLPD for advanced stages of diabetic nephropathy.
Acknowledgements We thank A. Takeda-Watanabe, T. Nagai, K. Nittaand Y. Kuroshima (Department of Diabetology and Endocrinology,Kanazawa Medical University, Uchinada, Japan) for their excellent assis-tance.
Funding This work was financially supported through a Grant-in-Aidfor Scientific Research (C) (24591218), a Grant for Promoted Researchfrom Kanazawa Medical University (S2012-4), the Suzuken MemorialFoundation and the Novartis Aging and Geriatric Research Foundation toMK; and by a Grant-in-Aid for Scientific Research (B) (25282028), aGrant-in-Aid for Challenging Exploratory Research (25670414) and aGrant for Collaborative Research from Kanazawa Medical University(C2014-4) to DK. The study was partially supported by a Grant forPromoted Research from Kanazawa Medical University (S2013-13)awarded to KK; and by a Grant for Collaborative Research fromAstellas Pharma Inc.
Duality of interest Boehringer Ingelheim, Mitsubishi Tanabe Pharma,Kyowa Hakko Kirin, Taisho Toyama Pharmaceutical Co. and OnoPharmaceutical Co. contributed to establishing the Division ofAnticipatory Molecular Food Science and Technology. The authors de-clare that there is no duality of interest associated with this manuscript.
Contribution statement MK, KK, SK and DK conceived and de-signed the experiments. MK, YO, TS, SS and SML contributed to theacquisition of data. MK, YO and TS analysed and interpreted the data.MK, SK, KK and DK contributed to drafting the article. All authors haverevised the manuscript critically for important intellectual content andapproved the final version to be published. MK, TS and DK are respon-sible for the integrity of the work as a whole.
References
1. Packham DK, Alves TP, Dwyer JP et al (2012) Relative incidenceof ESRD versus cardiovascular mortality in proteinuric type 2 dia-betes and nephropathy: results from the DIAMETRIC (DiabetesMellitus Treatment for Renal Insufficiency Consortium) database.Am J Kidney Dis 59:75–83
2. Kitada M, Kanasaki K, Koya D (2014) Clinical therapeutic strate-gies for early stage of diabetic kidney disease. World J Diabetes 5:342–356
3. Koya D, Haneda M, Inomata S et al (2009) Long-term effect ofmodification of dietary protein intake on the progression of diabeticnephropathy: a randomised controlled trial. Diabetologia 52:2037–2045
1316 Diabetologia (2016) 59:1307–1317

4. Johnson DW (2006) Dietary protein restriction as a treatment forslowing chronic kidney disease progression: the case against.Nephrology 11:58–62
5. Robertson L, Waugh N, Robertson A (2007) Protein restriction fordiabetic renal disease. Cochrane Database Syst Rev 4, CD002181
6. Klahr S, Levey AS, Beck GJ et al (1994) The effects of dietaryprotein restriction and blood-pressure control on the progressionof chronic renal disease. Modification of Diet in Renal DiseaseStudy Group. N Engl J Med 330:877–884
7. Levey AS, Greene T, Beck GJ et al (1999) Dietary protein restric-tion and the progression of chronic renal disease: what have all ofthe results of the MDRD study shown? Modification of Diet inRenal Disease Study Group. J Am Soc Nephrol 10:2426–2439
8. Levey AS, Greene T, Sarnak MJ et al (2006) Effect of dietaryprotein restriction on the progression of kidney disease: long-termfollow-up of the Modification of Diet in Renal Disease (MDRD)Study. Am J Kidney Dis 48:879–888
9. Hansen HP, Tauber-Lassen E, Jensen BR, Parving HH (2002)Effect of dietary protein restriction on prognosis in patients withdiabetic nephropathy. Kidney Int 62:220–228
10. Pedrini MT, Levey AS, Lau J, Chalmers TC, Wang PH (1996) Theeffect of dietary protein restriction on the progression of diabeticand nondiabetic renal diseases: a meta-analysis. Ann Intern Med124:627–632
11. Nezu U, Kamiyama H, Kondo Y, Sakuma M, Morimoto T, Ueda S(2013) Effect of low-protein diet on kidney function in diabeticnephropathy: meta-analysis of randomised controlled trials. BMJOpen 3
12. Ideura T, Shimazui M, Morita H, Yoshimura A (2007) Protein in-take of more than 0.5 g/kg BW/day is not effective in suppressingthe progression of chronic renal failure. Contrib Nephrol 155:40–49
13. Seney FD Jr, Persson EG, Wright FS (1987) Modification oftubuloglomerular feedback signal by dietary protein. Am JPhysiol 252:F83–F90
14. Sallstrom J, Carlstrom M, Olerud J et al (2010) High-protein-induced glomerular hyperfiltration is independent of thetubuloglomerular feedback mechanism and nitric oxide synthases.Am J Physiol Regul Integr Comp Physiol 299:R1263–R1268
15. Tolins JP, Shultz PJ, Westberg G, Raij L (1995) Renal hemodynam-ic effects of dietary protein in the rat: role of nitric oxide. J Lab ClinMed 125:228–236
16. Wen SF, Huang TP, Moorthy AV (1985) Effects of low-protein dieton experimental diabetic nephropathy in the rat. J Lab Clin Med106:589–597
17. Dunger A, Berg S, Kloting I, Schmidt S (1997) Functional alter-ations in the rat kidney induced either by diabetes or high proteindiet. Exp Clin Endocrinol Diabetes 105(Suppl 2):48–50
18. Risdon RA, Sloper JC, De Wardener HE (1968) Relationship be-tween renal function and histological changes found in renal-biopsyspecimens from patients with persistent glomerular nephritis.Lancet 2:363–366
19. Gilbert RE, Cooper ME (1999) The tubulointerstitium in progres-sive diabetic kidney disease: more than an aftermath of glomerularinjury? Kidney Int 56:1627–1637
20. Tang SC, Lai KN (2012) The pathogenic role of the renal proximaltubular cell in diabetic nephropathy. Nephrol Dial Transplant 27:3049–3056
21. Choi AM, Ryter SW, Levine B (2013) Autophagy in human healthand disease. N Engl J Med 368:651–662
22. Kume S, Koya D, Uzu T, Maegawa H (2014) Role of nutrient-sensing signals in the pathogenesis of diabetic nephropathy.BioMed Res Int 2014:315494
23. Koya D, Kitada M, Kume S, Kanasaki K (2014) Interventionsagainst nutrient-sensing pathways represent an emerging new ther-apeutic approach for diabetic nephropathy. Clin Exp Nephrol 18:210–213
24. Sakaguchi M, IsonoM, Isshiki K, Sugimoto T, Koya D, KashiwagiA (2006) Inhibition of mTOR signaling with rapamycin attenuatesrenal hypertrophy in the early diabetic mice. Biochem Biophys ResCommun 340:296–301
25. Inoki K, Mori H, Wang J et al (2011) mTORC1 activation inpodocytes is a critical step in the development of diabetic nephrop-athy in mice. J Clin Invest 121:2181–2196
26. Godel M, Hartleben B, Herbach N et al (2011) Role of mTOR inpodocyte function and diabetic nephropathy in humans and mice. JClin Invest 121:2197–2209
27. Bar-Peled L, Sabatini DM (2014) Regulation of mTORC1 by ami-no acids. Trends Cell Biol 24:400–406
28. Kitada M, Takeda A, Nagai T, Ito H, Kanasaki K, Koya D (2011)Dietary restriction ameliorates diabetic nephropathy through anti-inflammatory effects and regulation of the autophagy via restorationof Sirt1 in diabetic Wistar fatty (fa/fa) rats: a model of type 2 dia-betes. Exp Diabetes Res 2011:908185
29. Kume S, Uzu T, Araki S et al (2007) Role of altered renal lipidmetabolism in the development of renal injury induced by a high-fatdiet. J Am Soc Nephrol 18:2715–2723
30. Yamahara K, Kume S, Koya D et al (2013) Obesity-mediated au-tophagy insufficiency exacerbates proteinuria-inducedtubulointerstitial lesions. J Am Soc Nephrol 24:1769–1781
31. Kume S, Uzu T, Horiike K et al (2010) Calorie restriction enhancescell adaptation to hypoxia through Sirt1-dependent mitochondrialautophagy in mouse aged kidney. J Clin Invest 120:1043–1055
32. Brooks C,Wei Q, Cho SG, Dong Z (2009) Regulation of mitochon-drial dynamics in acute kidney injury in cell culture and rodentmodels. J Clin Invest 119:1275–1285
33. Xu L, Kanasaki M, He J et al (2013) Ketogenic essential aminoacids replacement diet ameliorated hepatosteatosis with alteringautophagy-associated molecules. Biochim Biophys Acta 1832:1605–1612
34. Kroemer G, Marino G, Levine B (2010) Autophagy and the inte-grated stress response. Mol Cell 40:280–293
35. Archer SL (2013) Mitochondrial dynamics—mitochondrial fissionand fusion in human diseases. N Engl J Med 369:2236–2251
36. Higgins GC, Coughlan MT (2014) Mitochondrial dysfunction andmitophagy: the beginning and end to diabetic nephropathy? Br JPharmacol 171:1917–1942
37. Hartleben B, Godel M, Meyer-Schwesinger C et al (2010)Autophagy influences glomerular disease susceptibility and main-tains podocyte homeostasis in aging mice. J Clin Invest 120:1084–1096
38. Grumati P, Coletto L, Sabatelli P et al (2010) Autophagy is defec-tive in collagen VI muscular dystrophies, and its reactivation res-cues myofiber degeneration. Nat Med 16:1313–1320
39. Solon-Biet SM, McMahon AC, Ballard JWet al (2014) The ratio ofmacronutrients, not caloric intake, dictates cardiometabolic health,aging, and longevity in ad libitum-fed mice. Cell Metab 19:418–430
40. Laeger T, Henagan TM, Albarado DC et al (2014) FGF21 is anendocrine signal of protein restriction. J Clin Invest 124:3913–3922
41. KharitonenkovA, Shiyanova TL, Koester A et al (2005) FGF-21 asa novel metabolic regulator. J Clin Invest 115:1627–1635
Diabetologia (2016) 59:1307–1317 1317