a thesis submitted to the university of stirling by gideon ... (1988... · a thesis submitted to...
TRANSCRIPT

The effect of secondarily enriched rotifers on growth and
survival of marine fish larvae
A Thesis submitted to the University of Stirling
for a degree of Doctor of Philosophy
by
Gideon Minkoff
Scottish Marine Biological Association,Dunsta ffnage Marine Research Laboratory,P.O. Box 3,Oban,Argyll,Scotland. October 1987

:1.
Contents
Page
ACKNOWLEDGEMENTS
iv
ABSTRACT
V
INTRODUCTION
1
MATERIALS
A. Herring, Clupea harengus L. 10
B. Plaice, Pleuronectes platessa L. 10
C. Turbot, Scophthalmus maximus L. 11
METHODS
9
A. Rotifer mass culture
12
1. Rotifer strain
12
2. Production requirements and feeding
12
2a. Feeding rations
13
2b. Automatic feeders
18
3. Mass culture unit
18
3a. General conditions and equipment
18
3b. Building up the population
19
3c. Management during harvesting
22
3d. Production figures
24
4. Enrichment of rotifers
25
B. Algae mass culture
25
C. Larval rearing unit 27

ii
D. Nutritional experiments
29
1. General procedure
29
2. Sampling procedures
31
2a. Larvae
31
2b. Gut contents
31
2c. Rotifer residue
31
2d. Mortalities
32
3. Experimental conditions
32
3a. Herring
32
3b. Plaice
33
3c. Turbot
34
E. Morphometric estimates
35
1. Development
35
2. Lengths
35
3. Weights
36
F. Shrinkage
36
C. Ingestion rates
43
H. Rotifer biochemical analysis
42
1. Preparing samples for proximate and amino
acid analysis
42
2. Dry weight determination
43
3. Calorific values
44
4. Proximate analysis
44
5. Amino acids 45
6. Fatty acids 45

iii
RESULTS
47
A. Nutritional experiments
47
1. Herring
47
la. 1985
47
lb. 1986
50
2. Plaice
66
3. Turbot
73
B. Ingestion rates
87
1. Herring
87
2. Turbot
93
C. Rotifer biochemical composition
100
DISCUSSION
108
A. The diets. 108
B. The effects of the diets on growth of the larvae. 114
C. The effects of the diets on pigmentation in plaice. 123
D. Relations of growth to survival. 125
E. Ingestion rates and conversion efficiencies. 128
CONCLUSIONS
144
REFERENCES
146
APPENDIX vii, viii

iv
Acknowledgements
My sincere thanks to Professor John Blaxter, who has supervised and
guided me through these past three years. I am also indebted to my
supervisor in Stirling, Dr Lindsay Ross, for assistance in matters
both academic and administrative.
This project would have been impossible but for the generosity
of the Rothschild Foundation, B'nai B'rith, the British Council, the
Anglo Jewish Association and an ORS award. Many thanks also to
Dr Esther Lubzens and Professor Collette Zeruyah of the Israeli
Oceanographic and Limnological Research for their help.
Special thanks to Martin Scott for his much appreciated
support and advice, not to mention all the lifts to and from the
laboratory. Also to John Dye for his helpful, practical information
and for bailing me out with rotifers. John Joyce and Brian were
always at hand for constructing and maintaining the systems, and to
all those people who during the past three years have fed rotifers or
larvae or exchanged ideas: David, Lee, Nick, Yin, Carlos, Bob and
Jenny. Thanks to Dr Alastair Bullock for advice, to Margaret for
her excellent typing, to Johnny for the atmosphere, to Sharon who
at the final stages gave me leave of my household duties, to Saul
and Jordan who kept me amused, and the winds of Loch Etive which
helped me relax.
And, finally, to everybody at the Scottish Marine Biological
Association, Oban, who contributed in their way to my work.

V
ABSTRACT
Nutritional aspects of three species of marine fish larvae,
herring Clupea harengus L., plaice Pleuronectes platessa L. and
turbot, Scophthalmus maximus L. were examined. Larvae were fed
three different diets all of which were derived from rotifers
Brachionus plicatilis (O.F. Mtlller). These rotifers had been mass-
cultivated on baker's yeast and then enriched with baker's yeast, or
with one of two unicellular algae, Isochrysis galbana Park or
Nannochloropsis (Nannochloris) oculata (Droop) Hibberd.
The biochemical changes that these enrichments conferred on
the rotifer were examined. There was little difference in
proximate and amino acid compositions. Dry weights, and calorific
contents of the rotifers fluctuated according to the type,
temperature and duration of enrichment, with the yeast enriched
rotifers tending to weigh less (200-320 ng) than their algal
counterparts (250-370 ng). Major differences were found in the
total fatty acid profiles of the rotifers. Yeast-enriched rotifers
had no 18:3n-3 or 20:5n-3 and only trace amounts of 22:6n-3 fatty
acids. The Nanrinochioropsis-enriched rotifers had substantial
amounts of n-3 fatty acids though only of 20:5n-3 (11-14%), while
rotifers enriched with Isochrysis had only trace amounts of 20:5n-3
(2-4%).
All three species of fish responded similarly to the yeast-
enriched rotifer diet. Their growth, in terms of length and weight,
was minimal and they never developed any fin ray elements. Both
flatfishes developed a looped gut in the short growth duration on
this diet and some turbot (20%) inflated their swimbladder. This
retardation of growth was attributed to the lack of long chain highly
unsaturated n-3 fatty acids (n-3 HUFA) in the diet.

vi
During one month feeding trials it was shown that herring and
plaice were able to exploit both algal-enriched rotifer diets equally
well. Turbot, on the other hand grew better, over 14 days, on
rotifers enriched with lsochrysis compared with Nannochioropsis.
The reaction of the different species was linked to the fatty acid
profiles of the diet. Hence, turbot require a dietary input of
22:6n-3 while herring and plaice thrived equally well on diets
containing only 20:n-3.
Juvenile plaice consistently exhibited improved pigmentation
when Isochrysis compared to Nannochloropsis were used as the
rotifer enrichment. The effect was attributed to specific nutrients
particular to algal chloroplasts, which need to be present in the diet
of the larvae up to metamorphosis.
Assessment of daily rations, employing the rotifer enriched
with Isochrysis diet only, showed herring to reduce their food intake
from 46 to 19% body dry weight/d between days 10-21 post hatch
while turbot consumed between 34-169% body dry weight/d with no
apparent age related effects. The gross growth efficiencies (Ki,
Brett & Groves, 1979) for both species were seemingly unaffected
by age related processes and fluctuated between 15-50% in turbot
and 20-61% in herring according to fluctuations in daily food intake.
Ingestion is further described for both species with a linear model
that related food intake to larval weight. The weight-specific
ingestion was found to be a constant 13% and 43% of body dry
weight in herring and turbot respectively. The weight-specific
ingestion and specific growth rate estimates were combined with
other data available from the literature, revealing that larvae tend
to consume food (in dry weight) at a level equivalent to
approximately twice their daily dry weight increase.

1
INTRODUCTION
One of the main obstacles facing the current expansion of
marine fish farming, excluding salmonids, is the availability of
weaned juveniles for stocking the ongrowing facilities. European
hatchery production during 1985 has been estimated at 6.5 million
juveniles of sea-bass (Dicentrarchus labrax), gilt head bream (Sparus
aurata), and turbot (Scophthalmus maximus) according to 3. Olsen,
(1986) and by 1995 the Norwegians alone predict an annual
production of 120,000 tons of marine fish (Oiestad, 1987), a probable
requirement of 80-100 million juveniles. In Japan the current
annual production stands at 300 million juveniles (Kanazawa, 1985).
The provision of these large numbers of juveniles is beset by
problems of mortalities in the larval phase and the need to provide
most species with vast quantities of very small food items at their
early feeding stages. Mortalities could also be reduced by enhancing
egg quality through brood stock nutrition (Watanabe, 1985),
providing an optimal physico-chemical environment for the larvae,
and determining their dietary requirements. It is this last issue
that the present study addresses.
Most marine fish larvae are planktivorous and, in the wild,
feed on small crustaceans or other zooplankters. Unless exogenous
feeding is initiated at, or closely following, yolk absorption, their
condition rapidly declines so that they reach what has been termed
the point-of-no-return (PNR, or irreversible starvation). At this
point the larvae are still alive but too weak to feed if food becomes
available (Blaxter & Hempel, 1963). First feeding success has an
immediate impact on the potential number of larvae surviving to

2
metamorphosis in the hatchery and depends on the species, size and
density of prey they are offered (reviewed by Hunter, 1980).
Zoopianktonic prey are usually offered to artificially reared
larvae at densities of 5-10 individuals/mi, which is a daily
requirement for 5-10 million zooplankters/1 m 3 larval tank. Such
quantities make feeding on sea-caught zoopiankton,in most casesa
practical impossibility. As mass cultivation of naturally
encountered prey such as copepods has had only limited success
(Kahan et a!., 1982; Kuhimann et a!., 1981), aquaculturists have
resorted to the use of readily available food organisms. There are
two main species currently employed, the first is a rotifer
Brachionus plicatilis (O.F. Miller) commonly offered to first-feeding
larvae over the first 7-10 days of exogenous feeding, followed by
nauplii of the brine shrimp Artemia sauna. A few species, such as
herring Clupea harengus, plaice Pleuronectes platessa, and sole
Solea solea, have large enough mouths to take brine shrimp without
the initial rotifer phase.
Rotifer mass culture was initiated in Japan in the early sixties
(Ito, 1960), introduced to the West by Theilacker & McMaster (1971),
and has since undergone considerable technological refinements.
Rotifers are raised on a variety of microalgae or yeast, at densities
of 200-600 individuals/mi with daily yields of 10-40% of the standing
stock (Lubzens, 1987). B. plicatilis is found in a range of
genetically determined sizes from which the aquaculturist can
choose a prey size to suit the requirements of the species of fish
being reared (Fukusho & Okauchi, 1982; Snell & Carrillo, 1984).
Artemia nauplii are readily obtained from hatching of commercial
dried cysts which in 1975 were estimated to be used by 99% of
mariculturists (Sorgeioos & Persoone, 1975).

3
Larval culture techniques could be greatly improved by
introducing inert larval diets, thereby eliminating the need for mass
cultivation of live food. Finely ground microparticles and
microcapsulated diets have already been tried with some success on
larvae of plaice (Adron et al., 1974), sole (Appelbaum, 1985),
Atlantic silverside Menidia menidia (Beck & Bengston, 1979) and sea
bass (Barnabe, 1976), although growth and survival were inferior to
those obtained when using live feed.
Formulated diets can also be employed when investigating
specific dietary requirements in fish larvae, as mentioned by
Kanazawa (1985) for the phospholipid requirements of red sea bream
Pagrus major, and ayu Plecoglossus altivelis. Although the
composition and size of inert diets can be predetermined their use
has mostly been unsuccessful (Hofer, 1985). This is probably due to
a combination of factors: rapid sedimentation, leaching, a limited
capacity to stimulate larval feeding and the digestive potential of
larvae. It is this last factor which seems to be the most
troublesome. Marine fish larvae at first-feeding possess a digestive
tract divided into fore, mid and hind-gut regions separated by
sphincters, an arrangement which remains basically unchanged up to
metamorphosis when the functional stomach (involving acid
secretion) and pyloric caeca start to develop (Tanaka, 1973; Govoni
et al., 1986). Although a variety of active digestive enzymes and a
functional pancreas and liver have been observed in first-feeding
larvae (Tanaka, 1973; Govoni, 1980; Govoni et al., 1986; O'Connell,
1981; Cousin et at., 1987), in some instances their activity levels
have been reported either to increase (Kawai & Ikeda, 1973b) or
fluctuate (Hjelmeland et al., 1983) throughout larval life. For
example in lipid digestion only esterase activity has been observed

4
in first-feeding pike Esox lucius (Szlaminska, 1980) and turbot,
whilst lipase activity has only been reported in turbot at a stage
near metamorphosis (Cousin et al., 1987). The mechanism of
protein digestion in larvae is markedly different from that observed
in adult forms. In larvae it is intracellular following pinocytosis of
the macromolecules in the hind-gut (Watanabe, 1981, 1982a, 1984a),
while normal extracellular peptic digestion is initiated after
functional stomach formation at metamorphosis. Such factors
might also explain the increasing success reported for weaning
larvae on to inert diets as they near metamorphosis (Bromley &
Howell, 1983; Bromley & Sykes, 1985).
The second major problem in deploying inert diets is the lack
of information on dietary requirements of larvae. At present these
can only be inferred from studies on adults or larger freshwater
forms, such as carp, salmonids, or coregonids. Moreover the
specific requirements for minerals, vitamins or amino acids could
change throughout ontogeny (Cowey, 1979; Dabrowski, 1986).
Many of the problems of inert diets do not exist with live
feeds; in fact living prey may contain enzymes which complement
and enhance the digestive processes of the predator (Lauff and
Hofer, 1984). On the other hand an ability to manipulate the
biochemical composition of live prey, which is a prerequisite in
nutritional experiments, is limited in comparison with what can be
done to inert diets. Nevertheless, it is still possible to alter some
of the biochemical components of live food, and rotifers in
particular, as has been shown in the past (Scott & Middleton, 1979;
Watanabe et al., 1983a), and in the present study.
The dietary value' of rotifers, as reflected in larval survival
and growth, is known to depend on the food used for cultivation or

5
enrichment immediately prior to feeding to the larvae. Raising
rotifers on baker's yeast, a practice initiated in Japan in the early
seventies, produces consistently poor growth and high mortality
rates in larvae. On the other hand using algae in conjunction with
yeast or as an enrichment eliminates this problem (Watanabe et al.,
1983b). Not all algae, however, confer good growth results on
marine fish larvae and it has been found that in beneficial algae
such as Chiorella sp. (Watanabe et al., 1983b), Tetraselmis
tetrathele (Fukusho et al., 1984) and Isochrysis galbana (Scott &
Baynes, 1979) it is the highly unsaturated fatty acids (HUFA) 20:5n-
3 and 22:6n-3 which determine their value.
The highly unsaturated fatty acids required by teleosts differ
from those of terrestrial animals in having their first double bond at
the n-3 compared with the n-6 position. Since these fatty acids are
incorporated into the phospholipid fraction of bio-membranes, the
above difference is assumed to stem from the need in aquatic
poikilotherms for fatty acids with lower melting points.
Consequently, these bio-membranes will retain their physiological
activity at lower temperatures (Castell, 1979; Cowey and Sargent,
1979).
HUFA are most abundant in the structural phospholipid
fractions of tissues and in juvenile red sea bream radioactive
20:5n-3 was shown to be incorporated into physiologically active
tissues such as the gills, alimentary canal, swimbladder, gall-
bladder, liver, pyloric caecae, skin and muscle (Kanazawa et al.,
1983). Unsaturated fatty acids are important for the stabilization
of lipid-protein complexes that are formed from fatty
acidsfollowing their absorption across the intestinal mucosa. In
their absence the transport of lipids from their absorption site into

6
the body will be impaired (Castell, 1979). Although there are
suggestions that dieteary HUFA deficiencies cause the deterioration
of the alimentary canal and associated organs in larval turbot
(Cousin et al., 1986), such cause-effect relations have so far not
been systematically studied in marine fish larvae. On the other
hand it has been demonstrated that juvenile turbot (4.9 g) could not
grow on diets deficient in HUFA, and developed a pathological
condition culminating in the degeneration of their gill epithelium
(Bell et al., 1985). In salmonids a variety of pathological conditions,
such as fatty livers, increased water content and reduced feeding
efficiency have been associated with a deficiency of dietary
linolenic acid (18:3n-3) (Castell et a!., 1986).EFA deficiencies are
therefore likely to impair lipid transport and cause structural,
energetic and enzymological imbalances that will undoubtedly
suppress the ontogeny of the rapidly developing larvae.
Ripe roes of marine fishes are rich in HUFA. Atlantic
silverside (Menidia menidia) have 40% HUFA of the n-3 isomers in
their eggs (Schauer & Simpson, 1979). In herring, it has been shown
that 47% of fatty acids of the phospholipids, and 31% of the fatty
acids of neutral lipids, are polyunsaturates, mainly (97%) of the n-3
isomers (Tocher & Sargent, 1984). In turbot eggs n-3 HUFA have
been estimated from 26% (Witt et a!., 1984) to 38% (Scott &
Middleton, 1979) of total fatty acids. HUFA are mostly retained
throughout embryogenesis so that newly hatched larvae have HUFA
levels very similar to those of the eggs, i.e. 22-32% in turbot (Scott
& Middleton, 1979) and 49%, and 27% of phospho- and neutral lipids
respectively in herring (Tocher et a!., 1985a,b). This selectivity in
retention of HUFA, mainly 22:6n-3, has been demonstrated to
continue for at least the first 14 days after hatching of herring

7
larvae (Tocher at al., 1985a). A similar process seems to be taking
place in turbot larvae as attested by the slow decline of 22:6n-3
during 20 days of rearing on a diet deficient in this fatty acid (Scott
& Middleton, 1979). Selective retention of HUFA might also take
place in developing rainbow trout, Salmo gairdneri, (Hayes at al.,
1972) and Atlantic silverside (Schauer & Simpson, 1979).Dietary requirements for essential fatty acids in fish usually
range between 0.5-1% of dry diet (Kanazawa, 1985), and in fresh
water forms, eels and salmonids consist mainly of linolenic acid
(18:3n-3). Trout can readily bio-convert 18:3n-3 to
eicosapentaenoic (20:5n-3) and decosahexaenojc (22:6n-3) acids.
True marine forms, such as turbot and red sea bream, however, have
very poor abilities for such bio-conversion and therefore require
20:5n-3 and 22:6n-3 in their diet (Owen et al., 1975; Yamada et al.,
1960; CasIell, 1979).Essential fatty acid requirements of turbot larvae have
received considerable attention due to the commercial importance
of this species. One of the major breakthroughs in rearing of turbot
larvae and to the general understanding of dietary EFA
requirements of marine fish larvae was made by Scott & Middleton
(1979). These authors fed the larvae on rotifars enriched with a
variety of unicellular algae and showed that stunted growth and high
mortalities occurred when Dunalliela tertiolecta was used as an
enrichment. If, however, Paviova lutheri, Isochrysis galbana or
Phaeodactylum tricornutum were used, larvae grew and developed
well. The differences were attributed to the high levels of 20:5n-3
and 22:6n-3 in the latter algae, acids which are present only in trace
quantities in the former. These results explained an earlier
observation by Howell (1979), who showed a better growth of the
larvae in the presence of I. 9albana compared with ID. tertiolecta.

B
conclusionWitt et al. (1984) arrived at a similar4after comparing growth of the
larvae on either the rotifer-Artemia system with the rotifers
enriched with Nannochioris sp. or on different copepod stages of
Eurytemora affinis. Larvae grew better on the copepod diet due to
the earlier initiation of feeding and the significant quantites of
22:6n-3 present (5-11% of total FA). An analysis of the fatty acids
in the rotjfers and Artemia revealed them to be devoid of 22:6n-3
though they did have appreciable quantities of 20:5n-3. HUFA can
be synthesized to a limited extent by the rotifer (Lubzens et al.,
1985) but at a low level which necessitates their introduction into
the rotifer using the algae. HUFA can also be incorporated directly
into the rotifers by soaking them in emulsified marine lipids such as
cuttlefish liver oil, before offering them to the larvae (Watanabe et
al., 1983a). Direct enrichment of rotifers by algal substitutes has
also been explored by Gatesoupe & Luquet (1981) and Teshima et al.
(1981).
A further factor which is associated with the success of
rearing marine fish larvae is the presence of microalgae in the
rearing tanks. This method commonly referred to as the "green
water" technique has been reported to be used in the rearing of a
considerable number of fish such as: flounders, Limada feruginea
(Smigielski, 1979) and Platichthys stellatus (Policansky & Sieswerda,
1979), turbot (Howell, 1979), mullets, Mugil curema (Houde et al.,
1975) and M. cephalus (Nash et al., 1974), sea-bream Archosargus
rhomboidalis (Stepiens, 1976) and the anchovy Engraulis mordax
(Hunter, 1976; Moffat, 1981). The method is routinely employed in
Japanese fish hatcheries where Chlorella sp. is the main algae in
use.

9
The green water effect is known to operate via the
enhancement of the rotifers, or other zooplankters, nutritional
quality whilst residing in the larval tanks (Scott & Baynes, 1979).
Large algae might also be utilized directly by some larvae, as in the
case of Engraulis mordax, actively feeding on Gymnodinium
splendens (Scura & Jerde, 1977). Smaller (< 10 m) forms such as
Chiorella can passively enter the gut (Howell, 1979; Moffat, 1981)
either during feeding on zooplankton, or drinking (Mangor-Jensen
and Adolf, 1987), and once inside could (depending on digestibility)
contribute to the nutrition. Through their metabolic activities
algae might also recycle nitrogenous waste and raise dissolved
oxygen levels in the rearing tanks.
The present experiments were aimed at deepening our
knowledge of larval nutrition, using techniques of enriching the live
food. For control purposes rotifers raised on baker's yeast were fed
directly to larvae of herring (Clupea harengus L.), plaice
(Pleuronectes platessa L.) and turbot (Scophthalmus maximus L.).
The same rotifers were also tried out after a short enrichment with
either Isochrysis galbana, commonly regarded as a beneficial algae
in mariculture systems for both molluscs (Epifano, 1979) and fish
larvae (Scott & Baynes, 1979), or Nannochloropsis oculata, an as yet
unexplored alga. The three diets were then compared at the
biochemical level. The comparative aspect of this study could
therefore provide some insight as to the diversity of dietary
requirements among marine fish larvae. Furthermore, comparing
the diets on the biochemical level should enable the singling out of
possible dietary components required by larvae, these could then be
tested using direct rotifer-enrichment techniques. Finally, it was
hoped that in conjunction with measurements of daily food intake,
10
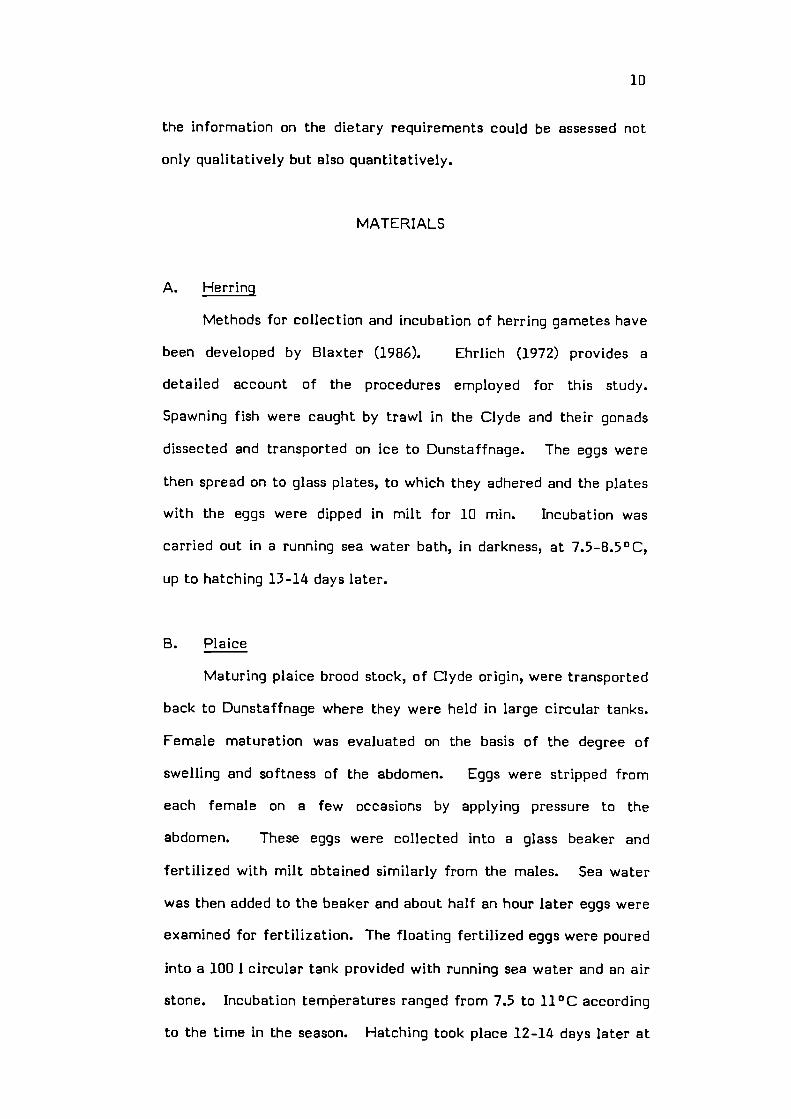
the information on the dietary requirements could be assessed not
only qualitatively but also quantitatively.
MATERIALS
A. Herring
Methods for collection and incubation of herring gametes have
been developed by Blaxter (1986). Ehrlich (1972) provides a
detailed account of the procedures employed for this study.
Spawning fish were caught by trawl in the Clyde and their gonads
dissected and transported on ice to Dunstaffnage. The eggs were
then spread on to glass plates, to which they adhered and the plates
with the eggs were dipped in milt for 10 mm. Incubation was
carried out in a running sea water bath, in darkness, at 7.5-8.5°C,
up to hatching 13-14 days later.
B. Plaice
Maturing plaice brood stock, of Clyde origin, were transported
back to Dunstaffnage where they were held in large circular tanks.
Female maturation was evaluated on the basis of the degree of
swelling and softness of the abdomen. Eggs were stripped from
each female on a few occasions by applying pressure to the
abdomen. These eggs were collected into a glass beaker and
fertilized with milt obtained similarly from the males. Sea water
was then added to the beaker and about half an hour later eggs were
examined for fertilization. The floating fertilized eggs were poured
into a 100 1 circular tank provided with running sea water and an air
stone. Incubation temperatures ranged from 7.5 to 11°C according
to the time in the season. Hatching took place 12-14 days later at

11
which time aeration and water exchange rates were slowed to a
minimum.
C. Turbot
Larvae on their day of hatching were purchased from the
Golden Sea Produce hatchery at Hunterston. They were
transported to Dunstaffnage by road (2-3 h) in 3-51 of sea water in
a plastic lined, insulated and sealed box. On arrival at the
laboratory they were transferred immediately to the experimental
tanks.

12
METHODS
A. Rotifer mass culture
1. Rotifer strain
The two strains of Brachionus plicatilis (O.F. Muller) which
were tested for suitability of cultivation originated from the
laboratory's collection (by courtesy of Mr J.M. Scott) and from
the SFIA research unit, Ardtoe (by courtesy of Mr 3. Dye).
The former strain was used when evaluating the optimal dry
yeast ration for cultivating the rotifer while the latter was
employed in the mass cultures. Both strains are of L-type
with a typical lorica length of 226 t 14 lIm t S.D. During the
1987 season a smaller S-type rotifer lorica length
(187 t 9.5 im) invaded the cultures and was used for both the
ingestion rates experiments and the proximate analysis of
Isochrysis-enriched rotifers. The above classification of L
and S types are according to Fukusho and Okauchi (1983).
2. Production requirements and feeding
The maximal rotifer requirement in a larval feeding
experiment was calculated at 6 x io6 individuals/day based on
a daily stocking level of 5 rotifers/mi in 12 x 100 1 rearing
units.
For reasons explained in the introduction it was essential
that the rotifers be cultivated on baker's yeast,
Saccharomyces cerevisiae alone. Mass culture techniques
using this feed are well established (Hirata, 1980), and utilize
fresh baker's yeast at a daily ration of 1 quO 6 rotifers. The

13
absence of a regular supply of fresh yeast made it necessary to
resort to a dried commercial form produced by the Distillers
Company, Yeast Ltd., Scotland, which was available locally.
In this form the yeast requires activation before being fed to
the rotifers by adding sugar to the weighed ration of yeast at
approximately 1:10 sugar:yeast, mixing in a small volume of
lukewarm tap water and allowing to stand in a warm location
for 15-30 mm or until a thick layer of froth is formed.
2a. Feeding rations
Evaluating the optimal feed ration was done in a two- stage
experiment.
Method
In the first, four food rations were tried: 2.5, 1.0, 0.7 and
0.5 g dry yeast/iD 6 rotifers/d, henceforth called the 2.5, 1.0,
0.7 and 0.5 rations. In the second, food rations of 0.5 and
0.3 g dried yeast were tried and compared with growth on 1.0
and 0.5 g fresh yeast/iD 6 rotifers/d.
Experiments were carried out in 1 1 Ehrlenmeyer flasks
with 500 ml sea water (Sal 32 ppt) filtered through a
Whatmans CF/C filter paper. A single population of rotifers
was divided equally among the flasks (2 per treatment) at an
initial density of 52 individuals/mI for the first and
100 individuals/mi for the second experiments. Incubation
took place in a constant temperature room (25°C) at constant
illumination with continuous aeration. Population growth was
recorded daily by withdrawing 3 x 1 ml samples from each
flask into a pipette and counting the number of females and
eggs under a dissecting microscope. Cultures were rinsed once

14
throughout each experiment (day 4) by collecting the rotifers
on a 60 p.m sieve and resuspending in fresh pre-heated sea
water. Experiments were terminated after nine days.
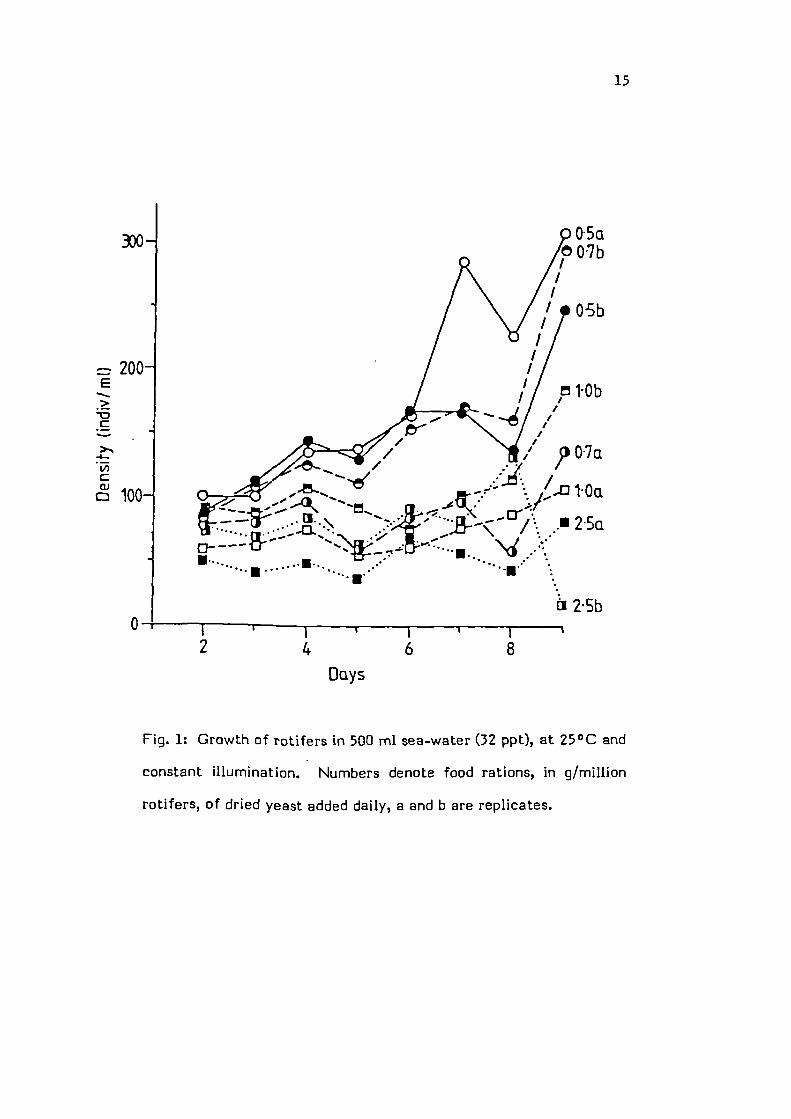
Results
Growth as observed in the various treatments had an
oscillating component (Figs 1, 2). The only ration to cause an
actual decline in the population was the 2.5 g yeast/d. Growth
at all other food rations was analyzed using the exponential
growth model
N = N0 e't
where: Nt = number of individuals at time t, N their initial
number and r = the population's intrinsic growth rate. Pooling
the data for each treatment, from both experiments (Fig. 3)
showed the 0.3, 0.5 and 0.7 rations to produce r values of
0.148, 0.145 and 0.145/d respectively. However, the 0.3 g
ration was inferior to the other two as the population reaches
an asymptote with the former at approximately 140
individuals/mi whereas it continues to increase up to 300
individuals/mi on the latter rations. An analysis of covariance
comparing the intrinsic growth rates showed the 0.5 and 0.7
rations to be identical and to differ significantly from the
r = 0.07 produced by the 1.0 ration (F = 4.08, d.f =2; 45).
Growth rates on dry and wet yeast were identical for the
0.5 dry and 1.0 fresh rations, r values being O.14/d. A cell
count using a haemocytometer showed that suspending the
above rations of yeast in equal volumes of water resulted in
equal cell concentrations, e.g. 1 g of wet yeast equalled
1.612 x io 13 cells/mi.
15
05 a07b
05b
02
E>
>.'
LI)
c
0)
330
IIII'/ pl.Ob
I,I,",/ 70.7a
-- ..--, -.-.-. /100 - -.--- .n-_..
S - - -. -' '_x
-•.-- a--c /\ .'25a
- •- -7 -..._....U••...
ii 25b
4 6
8Days
Fig. 1: Growth of rotifers in 503 ml sea-water (32 ppt), at 25°C and
constant illumination. Numbers denote food rations, in g/million
rotifers, of dried yeast added daily, a and b are replicates.

16
30
200E>0C
>.'-4-
v,CaJ
10c1 wet
/)1
/• 05a
/........ ... .
t0b wet
...
... 0b wet
— . ..
... 05b
•----2
g:
...
0—I I I2 4 6
8
Days
Fig. 2: Growth of rotifers in 500 ml sea-water (32 ppt), at 25°C and
constant illumination. Numbers denote food rations, in g/million
rotifers, of wet (wet) or dry yeast added daily, a and b are
replicates.

161412
-ailOdLII,,
0
C)xz
17
0507
03
10
20 2 4 6 8 10
Days
Fig. 3: Daily increase in numbers of rotifers from the experiment
on effects of dry yeast rations on population growth depicted in
Fig. 1 and Fig. 2. Duplicates were combined to form each of the
regression lines.
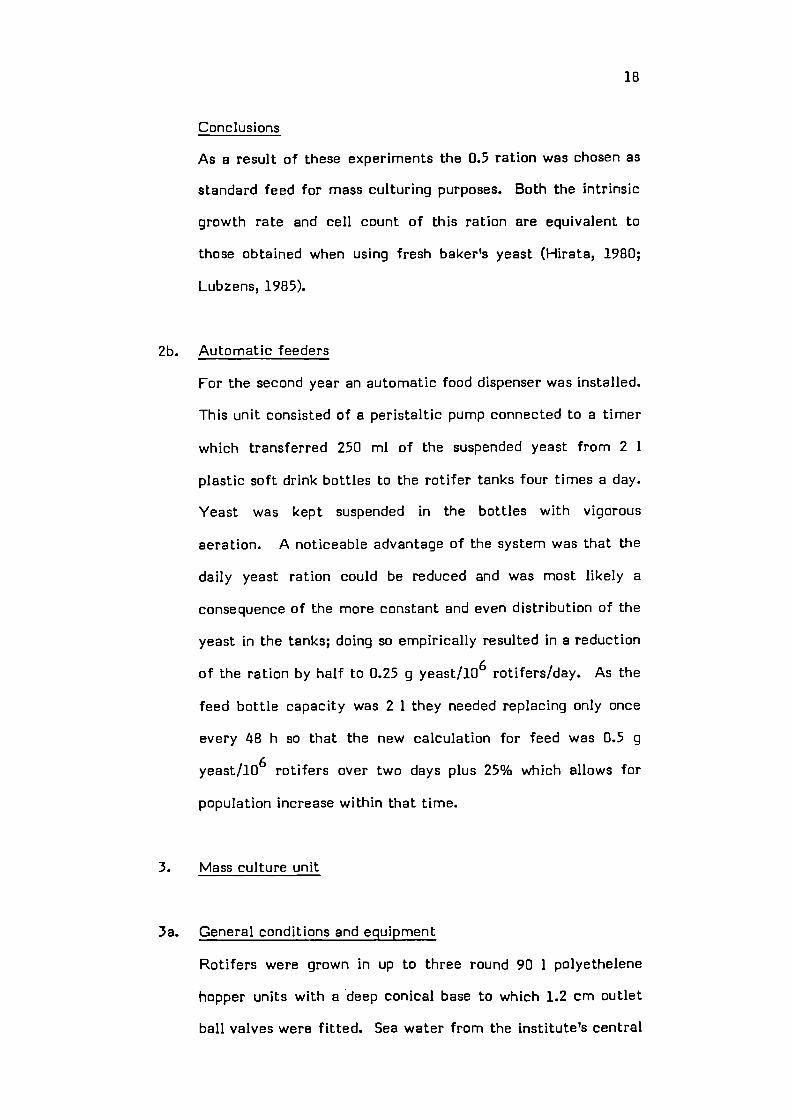
18
Conclusions
As a result of these experiments the 0.5 ration was chosen as
standard feed for mass culturing purposes. Both the intrinsic
growth rate and cell count of this ration are equivalent to
those obtained when using fresh baker's yeast (Hirata, 1980;
Lubzens, 1985).
2b. Automatic feeders
For the second year an automatic food dispenser was installed.
This unit consisted of a peristaltic pump connected to a timer
which transferred 250 ml of the suspended yeast from 2 1
plastic soft drink bottles to the rotifer tanks four times a day.
Yeast was kept suspended in the bottles with vigorous
aeration. A noticeable advantage of the system was that the
daily yeast ration could be reduced and was most likely a
consequence of the more constant and even distribution of the
yeast in the tanks; doing so empirically resulted in a reduction
of the ration by half to 0.25 g yeast/iD 6 rotifers/day. As the
feed bottle capacity was 2 1 they needed replacing only once
every 48 h so that the new calculation for feed was 0.5 g
yeast/iD 6 rotifers over two days plus 25% which allows for
population increase within that time.
3. Mass culture unit
3a. General conditions and equipment
Rotifers were grown in up to three round 90 1 polyethelene
hopper units with a 'deep conical base to which 1.2 cm outlet
ball valves were fitted. Sea water from the institute's central

19
water supply was filtered on line by consecutive cartridge
filters, the first an IMI polypropylene filter and the second a
Millipore type CP15. This should have eliminated all particles
down to 0.22 ELm. Flagellates and other protozoa developed
quite regularly, however, in cultures maintained for over seven
days in the same medium. Water temperature was kept
between 23-25°C using 300 W aquarium type heaters.
Vigorous aeration was provided from a single centrally
positioned air stone.
3b. Building up the population
Culture units were inoculated with rotifers grown in a variety
of receptacles such as Ehrlenmeyer flasks or 10 1 buckets, at
an initial density of at least 100 individuals/ml. Initial culture
volumes were usually low (r 30 1) and built up in accordance
with the rise of the rotifer populations. An example for this
is drawn from the build-up of cultures prior to the 1986
herring season (Fig. 4a, 4b). Initially two hoppers (1 and 2)
were each stocked with 4-5 x io 6 rotifers in 30 1. After three
days rotifer density reached 230-250 individuals/ml and the
culture volume was increased to 50 1. The final volume of 80 1
in hopper 1 was reached on day 9. Subsequently the volume
was held constant while the rotifer density increased to 600
individuals/mi on day 22 when the culture was first harvested
for feeding to fish larvae. Growth in hopper 2 did not proceed
so smoothly and after a premature increase of volume to 90 1
on day 7, it was reduced to 50 1 on day 9 and finally stabilized
at 80 1 on day 12. Hopper 3 was introduced at 50 1 on day 14

290a)E70
ALGAE
10
C°40
E0
c 20
10-i ALGAE
a.
'SF,q4tj--
20
b.
5
10 15 20
Days
Fig. 4: The build-up of rotifer stocks in three 901 hopper units, at
20-25°C feeding on dry baker's yeast rations of 0.5 g yeast/million
rotifers/day. Fig. 4a shows the population growth. Arrows denote
addition of algae to the culture. Fig. 4b shows the increase of
culture volume in two of the units. Arrows denote rinsing and
resuspension of the entire population in fresh sea-water.
0 Hopper 1,– D Hopper 2,— ---Hopper 3.

200
150
100
80
60I',
0
• 40
20
10
)
21
0 5 10 15 20
Days
Fig. 5: The cumulative increase of the entire (hoppers 1, 2 and 3)
rotifer population depicted in Fig. 4.

22
and increased to 80 1 on day 17. The development of the total
population (Fig. 5) was exponential and a in transformation
showed the relation of numbers and time to be linear
(r = 0.96), the intrinsic growth rate g = 0.11 being close to that
found in the feeding experiments (Section 2a). Doubling time
for the entire population was 6.3 days.
3c. Management during harvesting
The cultivation method can be considered as "semi-continuous"
with harvests regulated by demand as well as by the growth of
the rotifer population. Each culture was transferred regularly
(5-7 days) to fresh pre-heated sea water by filtering through a
200 I.lm sieve into a double bag of 60 lIm plankton netting.
During such filtration special care was taken to keep the
rotifers wet by keeping the filters suspended in water.
Management of mass cultures with regular harvests is
illustrated in Figs. 6, 7. Data were taken from cultures used
during two experiments on turbot larvae, in February 1986,
which required 4.5 x io6 rotifers daily. Surplus rotifers
produced during this time were either discarded or transferred
to a third back-up hopper. An attempt was made to stabilize
the population in each hopper at 250 individuals/mi, and
whenever possible to stagger the harvests between the two
hoppers. Following each harvest hoppers were topped up with
an equal volume of fresh sea water.
The first experimental harvests were on day 8 from
hopper 2 and on day 31 from both hoppers for the 1st and 2nd
experiments respectively. A relative state of equilibrium was
achieved in hopper 2 up to day 28. Hopper 1 underwent a slow

Fig. 6: Management of rotifer mass culture hopper 1, during
regular harvests (denoted by the broken lines). For
growth conditions see Fig. 3. Arrows denote
complete change of growth medium. Black circles
show restocking using surplus rotifers from the hopper
depicted in Fig. 7.
Fig. 7: Same as Fig. 6, but for mass culture unit 2.

-400
'/Z50
40
E30
a)I.--I--0 I
23
- 2nd TUJT EXPER1EWT —j
1?
01"F__1StTtPBOT EXPERItNT
10 15 20 25 30 35 40
45
Day
1— 2nd TURBOT EXPERIPIEKT—13
I— 1st TURT EXPERItNT —i 9
10
5
10
15 20 25 30 35 4.0 45
Days

24
decline from day 12 and was restarted with rotifers from
hopper 2 on days 19, 20. It is noticeable that the populations
of both hoppers underwent a rapid increase from day 20-22
until day 31 where the high densities (600-700 individuals/mi)
necessitated a heavy cropping, following this the population
gradually diminished. One factor which could have had a
significant impact on this decline was the lack of algal
supplements in the diets for a period exceeding 60 days. Algal
supplements should be administered every 40-60 days to
replenish nutrients such as vitamin E and B 12 (Scott, 1981)
which are essential for rotifer growth.
3d. Production figures
The average standing stock during this 42 day period was
22.8 x io6 and 28.2 x io6 rotifers/d in hoppers 1 and 2
respectively. Average volume was 80 I/hopper, the respective
population densities ( ± S.D.) were 308 t 187 and 259 144
m1 from which a total of 102.6 and 101.7 million rotifers
were cropped at 14 harvests/hopper. The total number of
rotifers raised in this period was 2.1 x 10 rotifers which
yielded 204.3 x io6 rotifers, i.e. a 10% yield.
In terms of feed 535 g of dried yeast were used and were
converted to 61.29 g dry weight of rotifers (1 rotifer = 0.3 jig).
61.3The conversion efficiency was therefore = 0.114 or 11.4%.
The production values obtained from this system compare well
with those published in the literature (reviewed by Lubzens,
1987).

25
4. Enriching rotifers
Before feeding to larvae the required quantity of rotifers
harvested from the mass culture was divided into three lots
and resuspended at densities of 500-850 individuals/mI in fresh
sea water containing algae or yeast at cell to rotifer rations of
6 x 1O 3 for Isochrysis, 3.5 x 10⁶ for Nannochloropsis and for
yeast 0.5 g/lo 6rotifers. Enrichment containers were
immersed for 16-18 h in 20 ± 1°C constant temperature baths
and vigorously aerated. Debris was separated from the
enriched rotifers prior to feeding to larvae by sieving through
a 200 .tm filter.
B. Algal mass culture
Two algal species, Isochrysis galbana (SMBA Cat. No. 58,
CCAP 927/lA) and Nannochioropsis oculata (SMBA Cat. No.
66, CCAP 849/lA) were used in the experiments.
The algal culture unit was designed to provide a
minimum of 10 1 of algae/day, 5 1 from each algal species.
Within the system algae were grown under sterile or semi-
sterile conditions in either glass carboys for the former or
polypropylene bags for the latter. The facilities included a
vertical bank of 125 W, white, fluorescent lights attached to
the back of a bench and shelf unit. Air was passed through a
grade 12-03 Whatman's Gamma 10 filter unit before being
introduced into culture vessels. Temperature was ambient
(usually 13-15°C during the larval season) and mass culture

26
units were immersed in water baths (' 13°C) if air
temperature rose above 20° C.
The growth medium used was the "MA" salt solution
(devised by Dr M.R. Droop) and consisted of 100 g KNO 3, 10 g
K2HPO4, 20 g EDTA, 2.5 g FeSO 4 7H2 0, 0.25 g Mn504 4H20,
50 .tg Vitamin B12 and 6.0 mg Thiamine, in 1 1 H 20 from
which 1 ml was added to each 1 1 sea water growth medium
prior to autoclaving (15 mm at 7.7 kg/cm2).
Mature seed cultures (100 ml) were used to inoculate
1.5 1 culture flasks which in turn were used to start 20 1 mass
cultures in pyrex carboys. Once cell density reached a value
of approximately 8 x io6 cells/mi for Isochrysis and 25 x io6
cells/mi for Nannochioropsis the cultures were harvested on a
regular basis.
The exponential growth coefficient Cr) for Isochrysis was
on average 0.225 t 0.045/d ranging from 0.175 to 0.26/d.
Doubling time was 3.1 days, and average cell density was 8.5 x
io6 cells/mi. This enabled 5 1 to be harvested daily out of one
of three cultures running simultaneously. After harvesting,
carboys were refilled with fresh, autoclaved medium. No
major problems were experienced in keeping such cultures
running for over 60 days.
The exponential growth coefficient of Nannochioropsis
was on average 0.265 t 0.082/d ranging from 0.13 to 0.34/d.
Doubling time was 2.6 days and average cell density 25 x io6
cells/mi, though this could reach 70 x 10 cells/mI depending
on harvesting regime.
Five litres Nannochloropsis from the sterile carboy
culture were used to inoculate a bag culture (23 cm "Layflat"

27
tubing) of approximately 25 1 once every five days. The
medium in the bag was only filtered (Millipore 0.22 aim)
before addition of salts and starter culture. Cell density in
these cultures reached an average of 70 x io6 cells/ml. This
higher cell density is probably due to the larger surface to
volume ratio. Bags were harvested at the rate of 5 1/day from
day 5. After 10 days the bag-cultures had always become
contaminated, causing their rapid collapse.
C. Larval rearing unit
The unit was set up in a constant temperature room equipped
with both heating and cooling facilities. Sea water from the
main supply was filtered on line to the header tanks. The
filter employed aquaria wool rolled into a tight cartridge with
nylon mesh and eliminated all zooplankton from entering the
system.
In the 1986-7 experiments water flowed through three
40 1 header tanks connected by 2.5 cm diameter pipes in which
N2 degasing (Ehrlich, 1972) took place by vigorous aeration.
Each tank was fitted with a 500 W immersion heater joined
through a relay to a contact thermometer enabling
temperatures to be controlled above ambient. From the third
header tank water flowed by gravity through 2.5 cm diameter
pipes (ABS) towards the rearing tanks. Twelve 100 1 black
polypropylene (cold water cistern) tanks set on three benches
were used for rearing larvae. Water entered these tanks at
the surface, and parallel to it, through two glass (5 mm
diameter) tubes set on either side (Fig. 8) causing water to

28
OUTLET
FILTER
WATER INLET
WATER I
AIR STONE
Fig. 8. Diagram of a 100 1 fish larval rearing tank.

29
circulate around the tank. Inflows were controlled at the
connection to the main pipes by 6 mm diameter stopcocks.
Daily adjustments were made manually and exchange rates
ranged from two to three tank volumes a day. Outflows at the
water surface were protected by a plastic cylinder with a 200
l.Lm screen stretched over the bottom and the three vertical
windows cut into its sides thereby enabling drainage of water
from both surface and subsurface layers.
Mixing was achieved by gentle aeration with air-stones
or diffusers set on the tank bottom and close to the tank wall
opposite the outflows, aeration being provided centrally from
a Compton 2D351VM pump.
Illumination was provided by either three twin
fluorescent tubes set in the ceiling of the room or by
supplementing other fluorescent tubes at a height above the
tanks adjusted so as to provide the required light intensities.
Photoperiod was controlled either manually or by a time clock.
In the 1985 experiment each row of four tanks was
connected to one 40 1 header tank which had no temperature
controlling facilities. Aeration was not provided to larval
units and instead of the twin surface water inlets there was
only one inlet at the base of each tank.
D. Nutritional experiments
1. General procedures
Larvae were counted from their hatching facilities into
rearing tanks using either a wide bore (> 5 mm) pipette, with
the opening smoothed by heating in a flame, or a beaker.

Treatment Rotifers
Number/d
I. galbana
5 io5
N. oculata
5 x 10
Yeast
5
30
Stocking proceeded sequentially in lots of 100-200 larvae until
all tanks received their final complement of larvae.
Feeding was initiated once observations showed larvae to
have open mouths. The larvae were offered rotifers which
had been pre-fed with yeast or yeast plus algae (see section
A.4) and these algae, though not the yeast, were also added
daily to each 100 1 rearing tank in the quantities shown below:
Algae Ration
Cells/d* Algae/rotifer
8 x 1.6 x 10 cells/rotifer
4.5 x 10¹⁰ 9 x cells/rotifer
*One litre of culture added daily. Numbers given are averages.
Routine tank maintenance, which preceeded feeding,
included the siphoning of debris from the bottom, the
skimming of surfaces, rinsing outlet filters and adjustment of
water inflows. Tank and room temperatures were recorded
daily.
Experiments were terminated by individually collecting
and preserving 100 larvae from each tank following which the
water was slowly siphoned out. The siphon inlet was
protected by a 200 im net so that all larvae were retained in
the tanks. Once the water level was low enough, larvae were
scooped out and counted for final survival estimates.

31
2. Sampling procedures
2a. Larvae: Thirty larvae were sampled from each tank on three
to four occasions throughout each experiment. Larvae were
removed individually by pipette (5 mm diameter) in the late
afternoon to ensure that all specimens had food in their guts.
They were anaesthetized in benzocaine (1:2000) and
immediately transferred to 4% formalin in half strength sea
water (Blaxter, 1971).
2b. Gut contents: To check whether the type of rotifer
enrichment affected the larval feeding response, gut contents
were examined. For this purpose two to three larvae were
removed from each treatment tank, briefly anaesthetized in
benzocaine and immediately transferred through a clean sea
water rinse onto individual microscope slides. The rapidity of
the process ensured that peristaltic gut evacuation was
minimal. Once on the slide they were measured and staged
(see Section E.1) following which a cover slip was placed over
them. This pressure caused the gut to rupture and the number
of rotifers in it was estimated by counting the chitinous
trophic region of the rotifers (mastax). This was repeated for
at least ten larvae per tank.
2c. Rotifer residue: On a few occasions 100 ml water samples
were taken from the water column of each tank before daily
cleaning. Rotifers from these samples were concentrated on a
60 jim filter, resuspended in a small volume of sea water and

32
counted under a dissecting microscope following the addition
of a few drops of formalin.
2d. Mortalities: Dead larvae were removed and counted each
morning except for turbot whose small initial size only allowed
counting from seven days post-hatch.
3. perimental conditions
3a. Herring: Two experiments were done, one in 1985 and one in
1986. In 1985 each of the three treatments was allocated to
one row of four 100 1 tanks with 1,000 larvae/tank. A further
tank was run as an Artemia control although its initial larval
density was not known. Larvae were transferred to the tanks
on days 2 and 3 post-hatching. Food was first introduced on
day 5. Water was continuously circulated (2-3 change/day) at
ambient temperatures which ranged from 9.5°C-11.4°C.
illumination was 200-300 lux at the water surface with a
photoperiod L:D of 16:8. Rotifer residue in tanks was
sampled when possible on a daily basis. Larvae samples were
taken on days 4, 9, 12 and at termination on day 15. Gut
contents were analyzed on day 11.
In 1986 the same numbers of larvae and replicates were
employed but the replicate tanks were not distributed
throughout the room in blocks but in such a way that would
spread the possibility of a statistical bias caused by their
location in the room, evenly across the treatments. Transfer
to rearing tanks took place on days 2, 3, 4 post-hatch, food
was first introduced on day 4 and first-feeding larvae observed

33
on day 6. Temperatures were increased from ambient on day 4
to a controlled 11 ± 1°C by day 5. The photoperiod was L:D
24:0 up to day 11 when it was changed to 19:5. Rotifer
residue was sampled seven times on days 15 to 18 and 22 to 24.
Larvae were sampled on day 4 (from stock tanks) 12, 19 and at
termination on day 28. Gut contents were analyzed on days
16, 17 and 22. Due to a shortage of I. galbana all algal
supplements to the rearing tanks (but not the rotifer
enrichment) were stopped on day 11.
3b. Plaice
For the first experiment (1985) three black round
polycarbonate 30 1 tanks were set up in the institute's main
aquarium. There were no replicates with 700 larvae per
treatment and feeding levels and algal supplements were
adjusted proportionally to tank volume. Larvae were
transferred to rearing tanks on day 3 post-hatch. Food was
first introduced on day 4 post-hatch. Temperatures were
ambient and rose (subject to fluctuations) from an initial
9.8°C to 12.5°C at termination. Light intensity was 200-300
lux at the water surface and the photoperiod was L:D 16:8.
Samples of larvae were taken on days 8, 16, 23, 29 and at
termination on day 31. Some of the larvae from both algal
treatments were reared on to metamorphosis in their
respective tanks on a diet of Artemia nauplil only. After
metamorphosis their pigment pattern was recorded to evaluate
if the initial diet influenced this pattern.
In 1986 there was again a scarcity of gametes and the
experiment was confined to three tanks with one tank of 350

34
larvae per treatment. However these experiments were
carried out in 100 1 tanks in the larval rearing unit. Transfer
to rearing tanks took place on day 4 post-hatch when first food
was also introduced. Temperature was controlled at 12 ± 1°C,
light intensity was 200-300 lux and the photoperiod was L:D
18:6. Larvae were sampled on days 4, 10, 18 and 25, rotifer
residue on days 17 and 21 and gut analysis on days 5, 7. At
termination algal treatments were grown on to metamorphosis
using Artemia nauplii only for determination of pigmentation
pattern.
3c. Turbot
Two experiments were carried out, the first in February and
the second in March, 1986. The first one did not produce any
results but following it the rearing conditions were corrected
so as to cater for the specific needs of these larvae.
The second experiment was carried out in nine 100 1
tanks which were divided randomly among the three
treatments. Larvae were stocked at a density of 1,250 larvae
per experimental tank on the first day post-hatch. Food was
first introduced on the evening of day 3 and first-feeding
observed on the following day. Temperatures were controlled
at 18 t 1°C. Illumination was 1,500-3,000 lux at the water
surface and the photoperiod was L:D 24:0. Rotifer residue in
tanks was sampled on days 5, 6, 7 and 14. Samples of 30
larvae were taken on days 3 (a grouped sample from all tanks),
5, 8, 12 and at termination on day 14 when 150 larvae were
collected from each tank. Gut contents analysis were
performed on day 4 and 5 (1st and 2nd days of feeding) and a
A

35
check for swimbladder inflation was done on 25 larvae from
each tank on day 12.
E. Morphometric estimates
Prior to analysis larvae were kept for over three months in
formalin allowing for maximal shrinkage to take place.
Twenty to 24 individuals from each sample were rinsed three
times in distilled water and then placed individually in
3 mm-deep wells in perspex multiwell trays. Preliminary
trials showed that after oven-drying the formalin-fixed larvae
could be picked off perspex using fine forceps which
facilitated their removal for weighing. Numbering the wells
made it easy to follow each larvae individually through the
analysis.
1. Development: This was evaluated according to the staging
systems of Doyle (1977) for herring, Ryland (1966) for plaice
and Al-Fvlaghazachi and Gibson (1984) for turbot. As herring
larval development proceeded slowly relative to the
experimental period, a further characteristic, that of fin ray
development, was also recorded.
2. Lengths: TL, tip of snout to tip of tail, and SL, tip of snout to
end of notochord, were measured with the ocular micrometer
of a Wild M5 dissecting microscope.

36
3. Weights: Dry weights in .tg were recorded in a desiccated
weighing chamber of a Perkin-Elmer ZH Autobalance. A
preliminary investigation showed that a drying time of 24 h at
70°C and an equilibrium period of 60 a for cooled samples on
the balance gave constant results. Dried samples were either
weighed immediately or stored for later weighing in a
desiccator.
F. Shrinkage
Formalin fixation results in reduction of larval lengths
(Blaxter, 1971; Hay, 1981) and weights (Hay, 1984). The
extent of this depends on salinity, formalin concentration,
initial body size and the duration of fixation.
For calculating fresh lengths and weights of larvae in the
current experiments it was necessary to evaluate shrinkage
with respect to both duration of fixation and initial size of the
diverse larvae used.
Samples of larvae were collected for shrinkage analysis
using the same procedures employed when collecting larvae
for growth analysis. One group of larvae (usually 10-20
specimens) was always measured immediately after
anaesthetizing in benzocaine, for length (TL,mm) and dry
weight. Fresh larvae tended to adhere to the perspex surface
commonly employed when drying formalin fixed larvae (see
section E) and were therefore dried on a glass slide from which
they were transferred to a pre-weighed aluminium foil boat
for weighing. Larvae were routinely preserved in 4% formalin,
half strength sea water and stored at room temperature, in
darkness.

37
Herring were tested for effects of both duration and
initial size (TL) on shrinkage. In 1985, a group of 50 13-day
old larvae were taken from a general stock tank, and after
recording fresh lengths they were divided among three sample
vials to be re-measured after being preserved in formalin for
10, 64 and 104 days. The greatest reduction in length (11%
shrinkage) occurred within the first 10 days after which only
minimal (a further 2-3%) changes took place (see Table 1).
Following this it was decided to use a three-month period as
the minimal preservation time.
The effect of larval age on length (TL) and dry weight
loss after formalin fixation was determined on two duplicate
samples (n = 20) of 10- and 21-day old herring from the 1986
experiment. One sample was measured when fresh and the
other following 240-250 days in formalin. It was found (see
Table 1) that during this preservation period larvae of either
age group lost about 33% of their dry weight. This may be
compared with Hay (1984) who found 25% for newly hatched
larvae. The initial fresh length of the larvae seemed to affect
their length following preservation, with larger larvae tending
to shrink less than the smaller ones. For lengths (TL) the
percent shrinkage found in both the 1985 and 1986 experiments
were combined and regressed on the preserved length (in
microscope units). The shrinkage factor K=21.29 - TL x 0.956,
(TL = microscope units) was thus employed for converting
preserved to fresh larval lengths.
Plaice were analyzed for shrinkage on duplicate samples
of n = 24, 12- and 32-day old larvae from the 1986 experiment.
One sample from each age group was measured fresh and the

.1-.)Cl)
.a) —
Cl)Dl Cl)
C0
a)Cl)>
.C._DlO
t
F-CO +1
EC-4
(I,a)cia)0.
U,
6-.COa)
a)
CO
COa)Cl,
-C0'Ca)
Cl)
9-
Co
C
Co
E0
4-
C
a)>
a)Cl)
a)
0a)CO
>C-.CO
9-0
-cDl
a)
>'C-.
CCO
-
-JH
-CDl
Ca)
4-0ClCi,
0
Ca)0C-a)
a)
.0
CD
F-
38
Cl)
Cl
0C-.
• I.0)JCi
-' C C
COO CCD
>'z
CCCJ _&_) .&-
D0Da)a) a)C.CC000C..C.. C-.CCCa)Oia)Ci) C.') U)C..C-. C.a)a)a)
4-9-4-
.I.) J)
000
CCC
000
CCC
D00
a)a) ü)
a)a)a)4-4-4--
a)O)a)CD CD CD
>>>C--CO CO CD
.1I ..3 .I)
000
I—F-F-
u-IN'\.- %_-
rLr
r c.j -' C'4
C\ O C'J C4 N V\C.1 LI .D '0 N
u-ID Ll. L Ll. Lt\ D- '0 D u. . Ll U IJ O\
- c'.J - - - - -
D U
D Il-INI
+1 +1 +1 +1
r-cr L1 N
- NI N
0 N NI O' '0LI\ L1 LI - NI \0 IJ •-
+1 +1 +1 +1 +' +1 +1 +1 +1 +1
D \0 \0 \0 N
N- - - - -
- NI.- '- s__Dl Dl 0' Dl .. _
C C C .E . 0 0 0 0- t .. . - .0 .0
0 C.)
C.. 6-. C- C-. 6-. C.. 6-. C- CO COa) a) a) a) a) - -IIIIIF-F-HHQ.O.
Ll Lñ '0 \O \0 \0 \O '0 \0 '0
0' 0' 0' 0 0\ 0' 0' 0' 0' 0' 0'
- - - - p-I - u--I - u—I

39
other following 90-110 days in formalin. The shrinkage in
percent length (TL) was not found to vary between the two age
groups (Table 1) and a 7% correction factor was used for all
fresh length calculations. Weight loss was higher for younger
than older larvae. However, an average 25% was used as the
correction factor irrespective of larval age.
Turbot were analyzed using four duplicate samples of 15
larvae; one duplicate was from a stock tank of 6 day old
larvae, the others were from either the yeast, the Isochrysis or
the Nannochioropsis treatments on day 13. Regressing
percent shrinkage as determined after 155 days in formalin on
preserved length gave the correction factor K = 16.4 - 1.39 TL
(r = -0.99; TL = microscope units) which was used for
calculating fresh lengths. The sample of larvae feeding on
yeast-rotifers was not included in the above regression, these
larvae exhibited a higher level of shrinkage compared with the
larvae receiving an algal supplement in their diet and the
shrinkage factor of 10.2% was used in this treatment for
calculating fresh weights. This probably resulted from the
poor condition of these larvae and parallels the higher
shrinkage levels reported for starved larvae (Hay, 1984).
Weight loss in turbot was only recorded for the first sample.
However, as the length loss in turbot was of the same order as
that found in plaice, and as there seemed to be some similarity
in the weight loss factors it was decided to use the 25% weight
loss factor for calculating fresh weights in turbot. This is also
justifiable when one takes into consideration the
morphological similarities between the larvae of these two
species.

40
C. Ingestion rates
Daily ingestion (24 h) for turbot and herring were estimated
using the following procedure: Duplicate 100 1 stock tanks of
larvae were grown from first-feeding on rotifers enriched with
Isochrysis using the standard procedures (Sections D.3a for
herring and D.3c for turbot). From each tank larvae were
removed using a wide bore pipette into duplicate two litre
pyrex beakers on days (post-hatch) 10, 13, 18, 21 for herring
and 3, 5, 8, 10, 17 for turbot. Transfers were initiated 1-2 h
after the stock tanks were supplemented with the daily ration
of rotifers. The number of larvae in the beakers was set at
levels approximating the survivals recorded in the nutrition
experiments (algal treatments only) which were 30, 30, 20, 20
and 10 individuals for the corresponding days in turbot and 20,
20, 12 and 10 for herring. Each beaker received r 10,000
rotifers enriched with Isochrysis and 20 ml of the algae. Two
control beakers were stocked with rotifers and algae only. All
the beakers were floated in a single 100 1 tank kept at the
appropriate rearing conditions. After 24 h (at constant
illumination) fish were pipetted out, the number of actively
feeding, moribund and dead larvae recorded and excess water
returned to the beaker. The contents of the beakers were
then sieved through a 60 pm mesh, the retained rotifers
resuspended in 50 ml sea water and their number estimated by
counting five one-mi subsampies.
Larval fresh lengths (TL) fresh dry weights (p.g) and
development stage were estimated from nine larvae taken
from each stock tank on each experimental day. Only on one
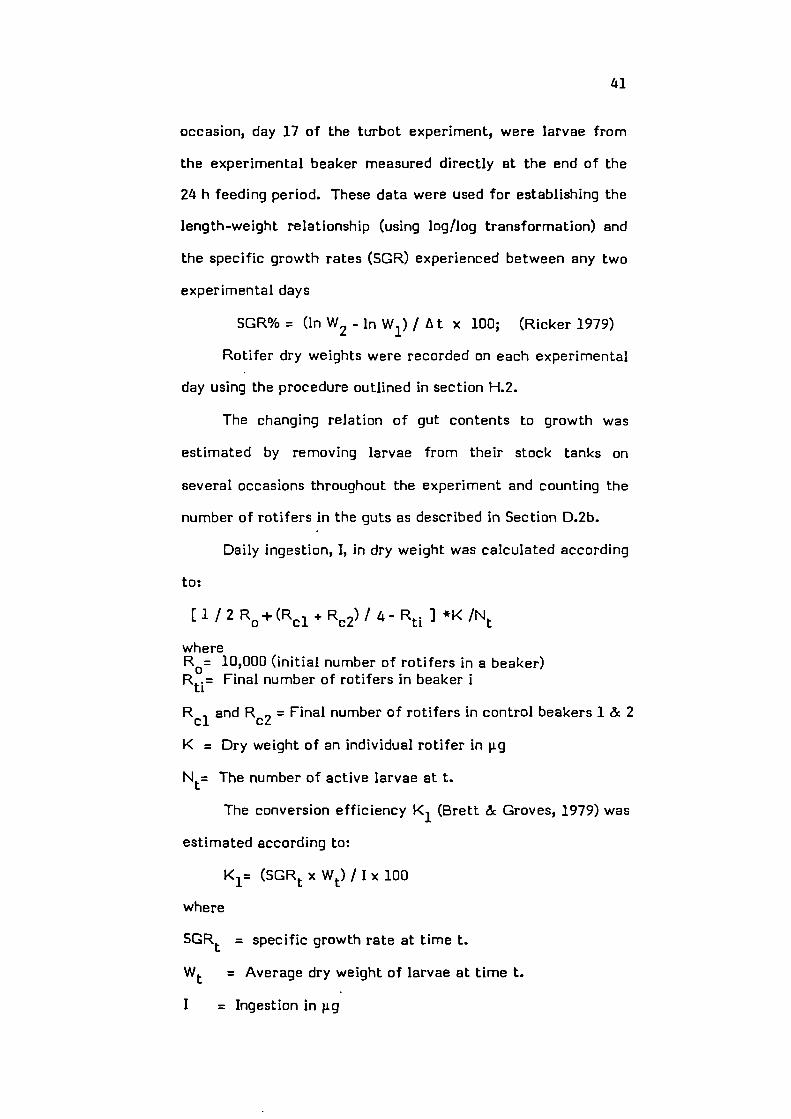
41
occasion, day 17 of the turbot experiment, were larvae from
the experimental beaker measured directly at the end of the
24 h feeding period. These data were used for establishing the
length-weight relationship (using log/log transformation) and
the specific growth rates (5CR) experienced between any two
experimental days
SGR% = (in W 2 - in W1) I t x 100; (Ricker 1979)
Rotifer dry weights were recorded on each experimental
day using the procedure outlined in section H.2.
The changing relation of gut contents to growth was
estimated by removing larvae from their stock tanks on
several occasions throughout the experiment and counting the
number of rotifers in the guts as described in Section D.2b.
Daily ingestion, I, in dry weight was calculated according
to:
[1 / 2 R +(Rci + Rc2)/ ] *K /N
whereR0= 10,000 (initial number of rotifers in a beaker)Rt1= Final number of rotifers in beaker i
R and R = Final number of rotifers in control beakers 1 & 2ci c2
K = Dry weight of an individual rotifer in p.g
Nt= The number of active larvae at t.
The conversion efficiency K 1 (Brett & Groves, 1979) was
estimated according to:
K1= (SGRt x W) I I x 100
where
SGRt = specific growth rate at time t.
W = Average dry weight of larvae at time t.
I = Ingestion in ig

42
H. Rotifer biochemical analysis
Samples of rotifers used for analyzing the biochemical
composition of larval diets were not collected at the time of
larval rearing trials, but at a later date when, apart from the
presence of larvae, the experimental conditions were
simulated.
1. Preparing samples for proximate and amino acid analysis
The three main treatments, i.e, rotifers enriched on yeast or
one of the two alga, were carried out at enrichment/rotifer
ratios proportional to those used in the experiment. Samples
were not prepared simultaneously, the yeast and
Nannochioropsis being prepared within a week of each other
and Isochrysis at a much later date. For all the enrichments
freshly harvested algae during the logarithmic growth phase
were used. The procedure started with harvesting the rotifers
(approximately 6 x 10 6/treatment) from the mass culture,
rinsing in clean sea water and resuspending in 30 1 at 20°C
with the appropriate enrichment. After about 18 h the
rotifers were harvested, rinsed, resuspended in 900 ml sea
water and divided into three lots. Two of these underwent a
further 24 h enrichment in 30 1 at either 10°C (an
approximation of experimental temperatures for plaice and
herring) or 20°C (for turbot), further algae being added only
to the rotifer cultures which had previously been enriched with
algae. Yeast was not added at this phase to the non-enriched
rotifer culture. The third lot was resuspended in a 2 1 beaker
allowing for settlement of debris; from this a small volume

43
was set aside in an ice bath for dry weight and calorific
estimations for which they were prepared within 1 h. The rest
were decanted onto a 60 pm filter, rinsed with sea water
followed by distilled water and flushed with a small volume of
distilled water into a sample vial. Vials were stored at -20°C
for up to four days following which they were freeze-dried.
The other two batches which underwent the 24 h larval tank
simulation were collected and prepared in the same manner.
Freeze-dried samples were stored at -20° C up to analysis.
2. Dry weight determination
The density of rotifers in the sub-sample set aside for dry
weight determination was readjusted to 200-300
individuals/ml. Five 1 ml aliquots were counted for females
and eggs over a grid under a dissecting microscope after being
killed with a few drops of 4% formalin. The quantity of
rotifers in one dry weight measurement was taken as the
nearest whole number of ml to give about 1,000 rotifers.
Preparations and weighing were similar to those
described in Strickland and Parsons (1968) for zooplankton.
CF/A filters were cut into 14 mm diameter discs rinsed in
distilled water, oven-dried for 1 h on large CF/A discs at
70° C, numbered with waterproof ink and weighed (t 1 pg) in a
Perkin-Elmer Autobalance. They were then set in the holder
of a filtering apparatus (provided by Mr 3.M. Scott) made from
an inverted 5 ml syringe set in the bung of a Buchner suction
flask. The sample was introduced, suction applied and the
rotifers rinsed twice under suction with distilled water on the
filter. Special care was made to rinse salts from the margins

44
of the filter from salts. The filters were then oven-dried for
1 h on a non-stick surface (large CF/A filters) at 70° C, cooled
in a desiccator and weighed. An average of seven
measurements and three blanks (sea water only with distilled
water rinse) were made per treatment.
Dry weights were adjusted for the presence of eggs using
the observed egg/female ratios in a sample and the dry weight
ratios female:egg 4:1 as estimated for rotifers by Dumont
(1977) and Leimenth (1980).
3. Calorific values
The same size samples of rotifers used for dry weights were
filtered onto CF/A discs (14 mm) which previously had been
subjected to h at 500°C in a muffle furnace. After 24 h
drying in a desiccator they were either measured directly on a
microcalorometer (Scott and Marlow, 1982) or stored in the
desiccator wrapped in aluminium foil for up to 1 month prior
to calorific determination. Calorific values were averaged
from three to five such discs with two to three readings per
disc. The results were corrected for the egg/female ratio of a
given sample as in the dry weight estimates as well as for the
ash content using the 7.8% ash/dry weight determined by
Theilacker and Kimball (1984).
4. Proximate analysis
Carbon and Nitrogen were determined using a Perkin Elmer
model 240 Carbon:Hydrogen:Nitrogen analyzer (operated as

45
per manufacturer's instructions). Two mg samples in
triplicates were analyzed on platinum boats with boats only
used for blank determination. Calibration was done with
acetalamyde as standard. Nitrogen was converted to total
protein by multiplying by a factor of 6.25.
Crude lipid was measured using the Korn & Macedo (1973)
method. Five 50 mg samples were averaged for each
determination. Samples were homogenized, weighed on plastic
weighing trays, mixed with a liberal amount of sodium
sulphate (anhydrous) and poured into a Pasteur pipette with a
glass fibre plug at its tapering end. Pre-weighed aluminium
trays were placed beneath the pipettes and the lipid extracted
by rinsing 2-3 times with freon (trichlorofluoromethane) in a
ventilated chamber. One reagent blank was done for each
three samples. After all the freon had evaporated the
aluminium trays were re-weighed and their increase in weight
was calculated as percent crude lipid in the original sample.
5. Amino Acids
Analysis was done on an amino acid analyzer LKB Biochrom,
Model 4151 by Mr A. Porter of Stirling University's Institute of
Aquaculture.
6. Fatty Acids
Samples from all three treatments were prepared from one
batch of rotifers though not from the same batches used for

46
proximate analysis. The minimal dry weight required for one
analysis was 20 mg which at an average rotifer weight of
300 ng comprises 60,000 individuals. To provide a safety
margin 1 x 1O 5 rotifers were used per sample.
Rotifers harvested from the mass culture were rinsed
and resuspended in a clean volume of sea water to be divided
equally among the three main treatments. The first
enrichment at 20°C lasted for 19 h, following which the
rotifers from each treatment were filtered through 200 jim
mesh, collected on a 60 jim mesh, rinsed thoroughly with
fresh filtered sea water, resuspended and divided into three
groups. One group was filtered and rinsed twice on 60 jim
mesh and then washed into glass sample vials with a small
volume of CF/C filtered sea water. An equivalent volume of
analytical grade chloroform (CHCI3) was added to this, air was
replaced with N2 , the vials were then stopped with teflon and
placed in -20°C. The other two groups underwent a further
24 h period under simulated larval tank conditions and were
then collected and stored as described above. Two control
samples were prepared, one of 1O 5 rotifers from the mass
culture and one of filtered sea water only.
Following preparation of all these samples they were
removed from the freezer and transferred to Stirling
University's marine biochemistry laboratory where they were
stored at -B0°C for one month prior to extraction.
Extraction and fatty acid analysis was done by
Mr Paul Hodgeson using the procedures outlined in Appendix I.

47
RESULTS
A. Nutritional experiments
1. Herring
la. 1985
Throughout this experiment no major mortality was observed.
Survival (Table 2) was high (80-100%) in those tanks in which
the final number of larvae was counted, with no significant
effects of the type of rotifer enrichment as ascertained by an
analysis of variance (ANOVA, F = 0.95, d.f. = 2; 6).
Effects of diets on growth rates in TL (mm/d) were
tested by linear regressions (Table 3). Growth rates ranged
from 0.3 mm/d in the Artemia treatment to an average
0.4 mm/cl for rotifer treatments. Between the rotifer
treatments growth rates were not significantly different
(ANOVA, F = 0.2, d.f. = 2; 9). However, pooling the
regressions for the rotifer treatments showed that larvae fed
this diet grew significantly faster than when fed Artemia
(analysis of covariance, ANCOVA, F = 11.15, d.f. = 1; 906).
The same trend was observed when comparing growth in
terms of the logarithm of the daily weight increase (Table 4).
The pooled slope obtained for the rotifer treatments, which
were not statistically different (ANOVA, F = 0.31, d.f. = 2; 9),
differed significantly from that obtained for the Artemia
treatment (ANCOVA, F = 5.5, d.f. = 1; 906).
At termination (day 15) larvae in all treatments had
reached development stage 2a (Table 5) in which dorsal fin
elements begin forming. In a number of larvae the posterior

48
Table 2: Percent survival of herring fed rotifers enriched witheither Isochrysis, Nannochioropsis or baker's yeast, during the 1985experiment. A correction was made for larvae removed as samplesby subtracting the total number sampled from the initial numberstocked.
Isochrysi S
Nannochloropsis
Yeast
1 90.5
78.2
97.62 89.8
94.3
86.63 89.6
91.0
1004 n.c.* n.c. n.c.
Average 89.9
87.8
94.9
*nc = not counted.
Table 3. Relationship between TL(mm) and age (t, days post-hatch) of herring during the 1985 experiment on rotifers enrichedwith either Nannochloropsis (Nanno), Isochrysis (Iso), baker's yeastor newly hatched Artemia nauplii.
Treatment
Iso 1234
Nanno 1234
Yeast 1234
Artemia
Regression
TL=.37t+11.0TL=.42t+10.4TL=.41t+10.4TL=.41t+11.8
TL=.36t+11.0TL=.56t+10.0TL=.38t+10.BTL=.41t+10.6
TL=.42t+10.4TL.40t+10.3TL=.36t+10.8TL=.38t+10.7
TL=.30t+11.1
Parameters
n Sb* r
71 .030 .8271 .022 .9271 .026 .8971 .024 .90
71 .029 .8271 .019 .9571 .022 .9071 .020 .92
71 .019 .9471 .032 .8371 .030 .8271 .026 .87
71 .026 .81
*Sb = standard error of the regression coefficient.

Iso 1234
1234
Nanno
2a2a2a2a
2a2a2a2a
2a2a2a2a
2a
1.81.42
.981.07
1.71.041.1
.97
.882.043.03
.94
1.17
8.79.79.7
10.25
8.89.49.95
10.0
9.48.58.459.4
7.7
Yeast 1234
Artemia
49
Table 4. Relationship between dry weight (pg) and age (t, dayspost-hatch) of herring larvae during the 1985 experiment. Forabbreviations see Table 3.
Treatment Regression Parameters
*n Sb r
Iso 1 log W=.OlBt+2.24 71 .003 .57
2 log W=.020t+2.22 71 .002 .72
3 log W=.021t+2.21 71 .003 .71
4 log W=.019t+2.24 71 .002 .71
Nanno 1 log W=.016t+2.24 71 .003 .61
2 log W=.022t+2.21 71 .002 .82
3 log W=.021t+2.21 71 .002 .83
4 log W=.021t+2.21 71 .001 .85
Yeast 1 log W=.022t+2.21 71 .002 .84
2 log W=.019t+2.21 71 .003 .55
3 log W=.018t+2.03 71 .002 .85
4 log W=.016t+2.22 71 .002 .64
Artemia log W=.013t+2.19 71 .002 .52
*Sb = Standard error of the regression coefficient.
Table 5. Development expressed in stages (Doyle, 1977) and thenumber of dorsal fin elements in 14 day old herring larvae, 1985.See Table 3 for abbreviations.
Treatment
Development
Dorsal fin elementsstage
Average s.d.

50
margin of the dorsal fin was observed to be separating from
the primordial fin-fold at early stage 2b. However, this
separation was never complete so that no larvae could be
classified as stage 2b proper. The number of dorsal fin
elements (Table 5) averaged 9.5, 9.5 and 8.9 rays for
Isochrysis, Nannochloropsis and yeast treatments respectively.
These values were not significantly different (ANOVA,
F = 1.54, d.f. = 2; 9) and were higher than the 7.7 elements
observed on average in those larvae grown on Artemia.
lb. 1986
Average survival levels in this experiment, at the end of
28 days of rearing (Table 6) were 50 t 13%, 38.7 18.2% and
16.2 t 4.4% (average ± S.D.) for Nannochloropj, Isochrysis
and yeast treatments respectively. An ANOVA, performed on
the number of larvae surviving in the individual replicates
presented in Table 6, showed that both algae enriched rotifers
conferred higher larval survival levels than yeast-rotifers (F =
6.8, d.f. = 2; 9). Between algal treatments, however, there
were no significant differences (F = 1.01, d.f. = 1; 6).
In all rearing units the mortality patterns recorded
(Fig. 9) showed a gradual slope up to day 14 followed by a
major mortality event which was terminated by day 19. From
day 20 onwards very little mortality was recorded. There was
no variation in t50 (the days to 50% of the survival levels
recorded on day 28) and the average t50 value for all
treatments was calculated as 16.2 t 0.7 (d t S.D.).
Larvae grew from an initial 9.8 t 0.4 (mm t S.D.), TL, to
average lengths of 15.4 ± 0.7 mm, 15.4 t 0.3 mm and

I-C)
.4-,
0)
.4-'
a)-c
CC)
Co
C)'4-
•4
0
0C)4-
a)
Co>C-
(0
—J
.4-'CoCOC)>,
CO
C-0)
CO
(0
CO
0C-
0
-c
C.)
0
C
CCt,
z.4-'CC)
EC-0)a.xa)
0''-4
C)-c.4-,
0C
C--
-c
a)
Co>C--Co
•Co
C-a)C) >.,
Co'4- C-DC)
— Co
CO
- 0CC-Coo.CC
oc'-C
(.J
COl
.j.>'Co
-D
Cli
.4-'
C4-
C-
0).4-'
C)
ECoC-Co
Ii
c4
>s
cli
-D
CoC
L
-c
C-)
0Co4-
'0
p-I
+1
'-I
+1
0\
.4-3-c --
Cli>
>
Lfl
0
U-,
.4-3
Dl
0)
>sC-.
51
Lt\C'.J,-4 Nr-ru
r•+1+1+1+1 +1+1+1+1
IJi 0' if'i
i p'\ 41C1
r\r\LrLr\ •
p-I - _-4 p-I -4 -+1+1+1+1 +1+1+1+1c.'J IJ \O r-r-. r----Lf\ IJ IJ Lf\ C.J IJ-- p-C -C .-I r4 N
ccc'cua
-4.-4C'J
C'J N . .-1 \ N-rijco
v\Lr
D p--C .-I - 1+1+1+1+1 +1+1+1+1
Lnc.4occ'D 0' \ C'.1 . . . . .-I NJp-I - - F F IJ N NJ NJ
D-4
x
.4-,
C
0U-)
*

rr
LflcJ
LI-4-d
-4-I,,0a-'I,
Lfl >
D
4-I
CC)
E
a)
xa)
'C
a'
a)
.4-3
C
-cCi
4-3
a)
.4-Ia)C
a:,c44-)0)
a)-c.13
C
a)a)>
a)
DlC
a)-c
a'4-
0)a)>
Ci
a)>>
C.),
a'
Dl
L
a)'
-cCiaC,,
4-.
0
-C.4-3
-oa)
-C
Ci
C-
Ca)a,
0)U-.4-,aC-
Ca
DlC
0a)a)
'4-0)a)>C-Co
—J
a,a)
4-3
a)C.,
a-a)C-
'4.-aa,a)DlCoI-.C)>It
C)C-a)a,4-3C0
E0C-I.-
a).4-,1-)
E0a)C-It
Ca)Cl,
4-3
E
C)C.,Ca)
-o•44.-C0Ci
IJa'a)-c4-3
.4-,
C
a)C,,a)C-C-a)C-
C-Co
4-Ia,CDa)>,a,
C)-'CD
-a
a)a)
aI-C
C.)0CCCaz
0
DlC
C-C-CD
I-a)>aa.4-3a)
0.4-)Ca)E
4-3
CD
C)C-.
.4-3
a,'
a)'
-c
Ci
aC',
-4
C)
4-3
52
I I ' I ' 1 I I
C)C) C)C) aD
(%) ]DA1AJfls

53
13.5 ± 0.1 mm on Isochrysis, Nannochioropsis and yeast
treatments respectively. An ANOVA performed on the values
for the individual replicates presented in Table 6 showed the
yeast treatment to differ significantly from algal treatments
(F = 24.12, d.f. = 2; 9).
Growth rates (mm/d) of larvae fed with algae enriched
rotifers were linear throughout the experiment (Table 7,
Fig. 10). Larvae fed yeast-enriched rotifers grew at the same
rates as the algal treatments up to day 12 following which
their growth rates declined. Within the Nannochioropsis
treatment there were no significant differences in the rate of
growth (ANCOVA, F = 2.0, d.f. = 3, 376), though significant
differences were recorded within the Isochrysis treatment
(ANCOVA, F = 8.6, d.f. = 3; 376). Comparing the two algal
treatments revealed that both the fastest and slowest growing
larval populations had been reared on Isochrysis enriched
rotifers, tanks 1 and 3 respectively (Table 7). Between the
other two Isochrysis replicates and the four Nannochioropsis
replicates there were, however, no significant differences
(ANCOVA, F = 2.0; d.f. = 5, 564).
Larvae exhibited a loss in weight following yolk
absorption, but had more or less recovered from this loss by
day 12 post-hatch (Fig. 11). At termination (Table 6) larvae
grown on algal enrichments had significantly higher average
weights of 399 ±83 and 399 t 44 (rig ± S.D.) for Isochrysis and
Nannochioropsis enrichments respectively, compared with
215 10 i' for the yeast treatment (ANOVA, F = 15.07,
d.f. = 2; 9). Growth rates for algal treatments between days
12 and 28 were exponential while those for yeast were linear.

Fig. 10. The relationship of length (TL, mm) and time (d) of herring
in the 1986 experiment. Points are averages of 4 replicates with
n=24 samples in each. Bars are 95% confidence limits. Full circle
represents initial length for the population. Larvae feeding on
rotifers enriched with:
0 lsochrysis
- Nannochioropsis
----- baker's yeast
Fig. 11. The relationship of dry weight (rig) and time (d) of herring
larvae in the 1986 experiment. Symbols and treatments as in
Fig. 10.

4Qi
3O
0)
>
20
10
8
)
54
1E
14
—12EE-JI-
10
70 5 10 15 20 25
Days post - hatch
5 10 15 20 25
Days post - hatch

55
Table 7. The relationship between TL(mm), and age Ct, days post-hatch) of herring during the 1986 experiment. Larvae fed rotifersenriched with either Isochrysis (Iso), Nannochioropsis (Nanno) orbaker's yeast.
Treatment Regression Parameters
*n Sb r
Iso 1 TL=0.27t+8.8 96 .011 .93- 2 TL=0.25t+8.8 96 .011 .93
3 TL=0.21t+9.2 96 .009 .92
4 TL=O.22t+9.1 96 .009 .94
Nanno 1 TL=O.24t+9.1 96 .009 .94
2 TL=0.25t+8.9 96 .01 .93
3 TL=0.23t+9.1 96 .01 .93
4 TL=O.22t+9.1 96 .009 .93Pooled TLO.23t+9.0 384 .005 .93
Yeast 1 TL=O.15t+9.4 96 .009 .88
2 TL=0.14t+9.5 96 .008 .88
3 TL=0.16t+9.4 96 .007 .91
4 TL=0.16t+9.4 96 .008 .90Pooled TL=0.15t+9.4 384 .004 .89
*Sb = Standard error of the regression coefficient.

56
Yet again, the differences in growth rates (igId) within the
Isochrysis treatment were significant (ANCOVA, F = 3.8;
d.f. = 3; 280) while within the Nannochioropsis treatment there
were no significant differences (ANCOVA, F = 1.7; d.f. = 3;
280). Comparing all the algal-enriched treatments showed
the Isochrysis enriched rotifers to produce both the fastest and
slowest growing larval populations, while between the other
two Isochrysis populations (tanks 2 and 4) and all the
Nannochioropsis replicates there were no significant
differences (ANCOVA, F = 2.0; d.f. = 5; 360).
Specific growth rates (SGR in %/d) (Table 6) were
significantly higher in the algal than the yeast treatments
(ANOVA, F =25.1, d.f. = 2; 9) averaging 4.03 and 4.11%/d for
Isochrysis and Nannochioropsis respectively and 1.5%/d for
yeast.
In all treatments there was an initial drop in condition
factor (CF) during the final stages of yolk absorption and
transfer to exogenous feeding (days 4-12, Fig. 12). From day
12 onwards the condition factor slowly improved, though by
the end of the experiment yeast treatments had significantly
lower CFs than those calculated for algal treatments (ANOVA,
F = 17.3, d.f. = 2; 9).
There was a significant correlation in all treatments for
the regression of log weight (jig) on log TL (mm) and the
equations for the pooled regressions were:
log W = 3.92 log TL - 2.07 (r = 0.98) for Nannochloropsis,
log W = 4.007 log TL - 2.18 (r = 0.98) for Isochrysis,
and log W = 3.68 log TL - 1.83 (r = 0.93) for yeast.
Algal treatments differed significantly with respect to
their slopes from the yeast treatment (ANCOVA, F = 6.2,
d.f. = 2; 858).

57
Table 8. The relationship between dry weight (.ig) and age (t, daypost-hatch) of herring larvae (1986). Larvae fed rotifers enrichedwith either lsochrysis (Iso), Nannochioropsis (Nanno) or baker'syeast.
Treatment Regression Parameters
*n Sb r
Iso 1 log W=.031t+1.83 72 .003 .79- 2 log W=.029t+1.80 72 .002 .82
3 log W=.021t+1.92 72 .002 .72
4 log W=.025t+1.79 72 .002 .80
Nanno 1 log W=.026t+1.88 72 .002 .84
2 log W=.028t+1.83 72 .002 .82
3 log W=.026t+1.85 72 .002 .81
4 log W=.024t+1.85 72 .002 .83Pooled log W=.028t+1.B4 288 .001 .80
Yeast 1 W=6.12t+45.2 72
0.26 .68W=4.3t+73.4 72
0.25 .56
3 W=5.6t+58.5 72
0.21 .71
4 W=6.45t+53.1 72
0.26 .70Pooled W=5.6t+58.3 288
0.04 .70
*Sb = Standard error of the regression coefficient.

011
0-4-Uci
I:::
&0710
- r-1
--- -.-
15 20 25 30
Days post-hatch
58
Fig. 12. The relationship between the condition factor (ig/mm3)
and time (d) for herring larvae in the 1986 experiment from day 12
post-hatch. Symbols and treatments as in Fig. 10.
59
Larvae grown on rotifers enriched with algae reached a
higher degree of development by the end of the experiment
(Table 9). At this time very few of the larvae fed on yeast
rotifers had developed any dorsal fin elements and at most
4-5 rudimentary elements could be found in these larvae. On
the other hand a large number of larvae receiving the algal
supplemented diets had fully formed dorsal fins which had
separated completely from the primordial fin-fold (Stage 2c).
Comparison of the average number of fin elements observed
on day 28 in the dorsal, anal and caudal fins of larvae (Table 9)
did not reveal any significant statistical differences between
the algal treatments, F values ranging between 0.8-0.9 for any
of the above parameters (d.f. = 95; 95).
All replicates were further analyzed for effects of
growth rates on survival at termination. Survival levels were
found to be higher in tanks with higher specific growth rates
(SCR). The relation between survival and 5CR on day 28
(Fig. 13) was best described by the equation:
V = 11.8X - 3.15 Cr = 0.85, p < 0.001)
where V is the percent survival and X the SCR (%/d) during
this period.
Density of rotifers, in the larval rearing units, was
dependent on the level at which they were stocked daily, the
rates at which they reproduced, and the rates at which they
were consumed by the larvae and washed out of the tanks due
to the continuous sea water exchange. Monitoring the rotifer
population was therefore important for ensuring that the

1 2b 2b-2c
2 2b 2b-2c
3 2b 2a-2c
4 2b 2a-2b
2b 2a-2c
1 2c
2b-2c
2 2b
2b-2c
3 2b
2b-2c
4 2b
2 a -2c
2b
2a-2c
60
Table 9. Development stage (according to Doyle, 1977), and the number ofelements present in the fins of herring larvae from the 1986 experiment.
Treatment Development Fin rays (a y. t s.d.; % Positive*)
Stage Range Dorsal Anal Caudal
Iso
pooled
Nanno
pooled
11.4 ± 2.4;10011.5 ± 1.7;100
9.2 t 2.0;1008.9 ± 2.5;100
10.3 ± 2.6
11.8 ± 1.8;10011.1 ± 2.3;10010.3 t 2.7; 9610.5 t 2.1;10010.9 t 2.3
5.4 ± 3•4;79
4.2 t 3.5;712.0 ± 3.1;371.3 ± 2.2;293.2 ± 3.6
4.9 ± 3•4;794.0 t 3.4;662.7 t 2.7;583.2 t 2.9;583,7 ± 3.1
8.0 ± 6.3;666.3 t 5.7;623.0 5.5;332.0 ± 3.5;294•7 t 5.6
7.5 t 5.5;755.8 t 5.6;624.1 t 4.5;504.4 t 5.1;505.4 ± 5.3
*% Positive = The percent of larvae from a sample of n=24 having at least
1 element of the relevant category.

d>>
61
1 2 3 4 5 6SGR (%Id)
Fig. 13: The relation of survival on day 28 of the 1986 experiment
to the specific growth rates of herring larvae fed rotifers enriched
with: Isochrysis, * Nannochioropsis,
4 baker's yeast. y=1.18x-3.15,, r=O.85; p < 0.001.

62
larvae had consistently been offered equal quantities of food
in all the rearing units. Throughout the experiment no major
increases in the rotifer population were observed in any of the
larval rearing units. In most cases (90% of readings) the
residual rotifer population, before daily feeding, was less than
0.5 individuals/mI (Fig. 14), which is less than 10% of the
numbers stocked 24 h previously. No obvious pattern evolved
between different treatments or in any particular tank and it
can therefore be safely assumed that larvae fed mostly on
fresh food daily.
The numbers of rotifers found in the guts of the larvae,
on three separate occasions, are shown in Table 10. In these
samples there was no apparent increase in gut contents with
respect to larval age or length in any one of the treatments.
An analysis of the gut contents was performed by dividing the
number of rotifers by the cube of the respective length for
each sampled larvae and multiplying by for convenience of
calculation:
CCI = (n/TL3)
CCI. = Gut Contents Index
n = Number of rotifers
TL = Total length
These indexes were pooled for all observations in each
treatment and compared by an ANOVA, showing no
significance differences between the three treatments
(F = 1.5, d.f. = 2; 82). It can therefore be assumed that

63
a.
b.
C.
08
$
06
04
8?02
00G
4$
08
06
E
V.)
-4-0
08
06
04-
.A.').VL
Q) e
I I I10 15 20 25 30
Do.y
Fig. 14. Densities of rotifers in herring rearing tanks 24 h after
stocking (1986 experiment). Tanks receiving rotifers enriched with:
a, baker's yeast, b, Nannochioropsis, c, Isochrysis. The different
shadings of each symbol denote individual replicates.
U
0
0

161722
161722
161722
41012
41516
31612
13.1+1.313.4+9.614.3+0.1
13.8=0.813.1+1.514.1+1.4
12.6+0.512.6+0.613.6+0.1
Nanno
Iso
Yeast
29.75+15.821.9 + 9.624.0 + 8.5
36.7+16.820.1+11.423.2+11.4
23.6+13.015.2+ 5.117.8+ 7.1
64
Table 10. The number of rotifers in guts of herring larvae (1986).See Table 7 for abbreviations.
Enrichment Day TL Rotifers N*
mm+s.d. n+s.d.
*N = The number of larvae sampled.

COC
L
Cl)
Cl,
0
0
-C
C)
0
C
CCu
z
65
F''U\0C'-4
•0CCO
>'
0.1)
C
-D
0Ci
C
Cl,
CO 4-'
C/)
4-)CQ)C
E<0-II0)>
0tJ
***
CU
4-)
C
0).1)0)
ECOCu
Cl,'
E:1-CC.)0C/,I-
.1.ICl)
CO
a)
>'
Cl,
0)
.CO
oCl,
CC
o
I-
0E
C.)
0
C
C
Cu 0.)
z
ECu
;1 .-cC)
Cu-
0\
U)
Cu.0)
CU-
- 0)
I-.0
0-J
0
1
—I
'-4
.1)CU
Cl)>'CU
-D
0.4-
C
0
•0
CCO
0)
Cu
>
Cu
CIf'
-C43
>'
, .o
:
-oE 0.)
- C)— 0
.1-I
)< Cl)
0)- -'
C CC CUN\ .1-I
c —.
0 -
CCU
oE
10-'.0
- .-
c or r\oII+1+1 +1+1
%D. '-ID cc; dN \D r\ •-' S-
COCOcc..i
r% r.0.0.
C'4C'4 I I
+1+1 +1+1 I!'.C'J 0' C N r' NC\ r4\Lt\ '-
.0.0 U.NLr\
o o '- c' ,
+1+1 +1-f-I (0.0 . .-:1- c'4 F C' C•4 u
C'.0.0Lr\
Ll
L/
+1+1 +1+1
o roCDr OD
Nb b .0.0
DJ_ ,-I
r F' F' F' F' F' F'(0.0 CU.0 (0.0
.-__ .- %__ '- '- - S.- %
F'
*.13
F' .1I
E 0)
0.
1*>.. -
>+1
E > 0F'
0°

66
the type of enrichment had no significant effect on the
quantities of rotifers consumed by the larvae.
2. Plaice
Actively feeding plaice larvae were observed on day 4 post-
hatch of the 1985 experiment and on day 5 of the 1986
experiment, henceforth referred to as exp. 1 and exp. 2
respectively. The average number of rotifers (t S.D.) in larval
guts on day 6 of exp. 2 were 16.2 ± 6.5, 13.8 ± 9.1 and 18 ± 6.5
for yeast, Nannochioropsis and Isochrysis treatments
respectively, these values not differing significantly (ANOVA,
F = 0.08, d.f. = 2; 9). On the following day larvae of the
Isochrysis treatment had significantly lower gut contents
(15.8 ± 6.8) compared with Nannochloropsis (26 ± 9.5) and yeast
(21.8 t 5.7) (ANOVA, F = 2.3, d.f. = 2; 12).
Throughout exp. 2 no major mortalities were recorded in
the algal treatments and such mortality as did occur took
place between days 14 and 22. Within each experiment the
final survival levels were highest for those larvae receiving an
algal supplement in their diet (Table 11) with Nannochioropsis
and Isochrysis treatments having similar values. Survival was
higher in exp. 2 (81-84%) compared with exp. 1 (31-42%),
which is probably due to the larger rearing tanks and lower
stocking densities of exp. 2.
Effects of the different treatments on growth in length,
weight and development are shown in Table 11. Those larvae
receiving a diet not enriched with algae were significantly
shorter and weighed significantly less at termination compared
with those on algal diets. Between the two algal treatments,

67
within each of the experiments, there were no significant
differences in final length, weight and development
parameters. However in exp. 2 these values were higher
compared with exp. 1. The final average developmental stage
in exp. 2 for algal treatments was 3b' (notochord is upturned
but not yet at the full 900). The range of stages was 3a-4a,
i.e. from initiation of notochord flexing to initiation of eye
migration (metamorphosis) stage. In exp. 1 larvae were
slightly less developed with the average stage being 3b
(notochord is upturned at just over 45°) and the range was
reduced so that some larvae were at the pre-notochord flexure
stage (2b).
Rates of growth in length (TL, mm) and log-transformed
weights for algal treatments (Figs 15a,b, 16a,b) were initially
slow (up to day 9 in exp. 1 and day 14 in exp. 2) and
accelerated thereafter. Linear regressions fitted to these
curves (Tables 12, 13) had higher regression coefficients in
exp. 2. However, there were no statistical differences
between algal treatments within any one of the experiments.
Yeast treatments, in both experiments, also underwent a
duration of weight loss and minimal length increase followed
by a minor recovery.
Using Ryland's (1966) staging system it was found that in
both experiments there were no obvious differences in average
levels of development for larvae feeding on either the
Isochrysis- or the Nannochloropsis-enriched rotifer diets on
any of the sampling days. Rates of development were
estimated by transforming Ryland's staging system to a
numerical one as follows: stage la-i, ib-2, lb'-3, ic-4, lc'-5,

10
EE.8
—J
7
6
EE
—JI-
68
In
10 20 30 10 20Days post - hatch Days post- hatch
Fig. 15. The relationship between TL (mm) and age (d) of plaicelarvae during: a 1985, b 1986. Points represent average of n=24larvae, bars are 95% confidence limits. One replicate per treatmentfor larvae fed rotifers enriched with:- --0-- Isochrysis, —ó- Nannochioropsis, El•-• baker's
yeast.
700-
600- 600-
500- i500-. /X
400- a. 400-A I'
3QQ ,300 b./1'
-4-. > /1200- 200
/I . II1?
4/...............
, .. .. 100- /
90- ' •r' 1 9080 - ••-.. ........ If 80-70 -•
10 20 30 10 20
30
Days post-hatch Days post-hatch
Fig. 16. The relationship between dry weight (jig) and age (d) ofplaice larvae a 1985, b 1986. For details see Fig. 15.
30

69
Table 12. Relationships between length (TL,mm) and time Ct, dayspost-hatch) for plaice larvae. Regression coefficients for eachexperiment compared by an analysis of covariance (ANCOVA). SeeTable 11 for abbreviations.
Treatment
Iso ab
Nanno ab
Regression
TL=0.074t+6.74TL=0.122t+6.36
TL=0.068t+6.7TL=0.13t+6.36
Parameters
*n Sb r
120 0.005 0.896 0.009 0.82
120 0.005 0.896 0.008 0.85
ANCOVAa
F = 0.5 d.f. = 1;238b
F = 0.2 d.f. = 1;188
a : Exp. 1. 1985b : Exp. 2. 1986
*Sb, Standard error of the regression coefficient.
Table 13. Relationships between dry weight (.ig) and time (t, dayspost-hatch) for plaice larvae. Regression coefficients for eachexperiment compared by an analysis of covariance (ANCOVA). SeeTable 11 for abbreviations.
Treatment
Regression Parameters
*n Sb r
Iso ab
Nanno ab
ANCOVAab
log W=0.024t+1.89log W=0.033t+1.79
log W=O.025t+1.86log W=0.033t+1.82
F = 0.53 , d.f. = 1;238F = 0.0003 d.f. = 1;188
120
0.005
0.8196
0.002
0.82
120
0.005
0.8396
0.002
0.85
a: Exp. 1. 1985b: ExD. 2. 1986
*Sb, Standard error of the regression coefficient.

70
ld-6, 2a-7, 2a'-8, 2b-9, 2b'-lO, 3a-11, 3a'-12, 3b-13, 3b'-14,
3c-15, 4a-16, 4b-17, 4b'-lB and 5-19. Regressing development
on age (Fig. 17a,b) showed that larvae receiving the algal-
enriched diets developed faster during exp. 2 than exp. 1, the
rates of development being 0.55 and 0.34 stages/d
respectively.
Condition factors (CF) (Fig. 18a,b) tended to increase
throughout the experiments in algal treatments as well as in
the yeast treatments of exp. 1. However, during exp. 2 the CF
for the yeast treatment remained unchanged throughout the
experiment.
In both experiments there was a good correlation
between log dry weight (.tg) and log length (TL, mm) (Table
14). The Nannochioropsis treatment of exp. 1 had a higher
regression coefficient compared with Isochrysis (ANCOVA, F =
4.11, d.f. = 1; 238). However during the second year this
observation did not repeat itself.
Colour patterns of juvenile fish were recorded after a
further 20 and 24 days of rearing on Artemia nauplii from the
termination of rotifer feeding in exp. 1 and exp. 2
respectively. Pigmentation was classified as "normal" (as in
wild fish), "mottled" which is a grouping for all partially
pigmented fish, and "albino". In both experiments Isochrysis
treatments had more normally pigmented fish than
Nannochloropsis treatments (Table 15) but in exp. 1, 100% of
Isochrysis larvae had some form of pigmentation compared
with only 86% in exp. 2. This situation is reversed for
Nannochloropsis treatments which had a higher proportion of
pigmented fish (49.5%) in exp. 2 compared with only 8% in
exp. 1.

'a0)
.2 3a
.4-c2b
12a
1b0)
Diclb
h4ct
3bUD. •C
Dib.
71
10 20 30
10 20
30
Days post-hatch
Days post-hatch
Fig. 17. Relationships between development and age (cJ) of plaicelarvae, a 1985, b 1986 employing the staging system of Ryland(1966). Symbols as in Fig. 15.
0
0
a. b.
06
04
02
02
10 20 30
10 20
30Days post-hatch
Days post - hatch
Fig. 18. Relationships between the condition factors (jig/mm 3) andage (d) of plaice larvae, a 1985, b 1986 during their development.See Fig. 15 for details.

Treatment Regression Parameters
*n Sb r
120 0.17
0.9596 0.18
0.96
120 0.22
0.9396 0.14
0.96
72
Table 14. Relationships between dry weight (.tg) and length (TL,mm) forplaice larvae. Regression coefficients for each experiment compared byan analysis of covariance (ANCOVA). See Table 11 for abbreviations.
Iso ab
Nanno ab
ANCOVAab
log W=5.58logTL-2.72log W=5.25logTL-2.49
log W=6.l2logTL-3.2log W=5.O8logTL-2.33
F= 4.11 d.f. = 1;238F = 0.6 d.f. = 1;188
a: Exp. 1. 1985b: Exp. 2. 1986
*Sb, Standard error of the regression coefficient.
Table 15. Effects of the rotifer enrichment, either Isochrysis (iso)or Nannochioropsis (Nanno) on the pigmentation of plaice aftermetamorphosis.
Treatment Pigmentation (%) n
Normal Mottled Albino
Iso a
76
24
0
25
b
35
51
14
86
Nanno a
4
4
92
25
b
16
33.5
50.5
101
a: Exp. 1. 1985b: Exp. 2. 1986

73
3. Turbot
Turbot larvae were observed to orient themselves horizontally
in the tanks from the third day post-hatch and feeding
behaviour was observed on day 4. On this day the number of
larvae with rotifers in their guts (from ten sampled larvae)
was seven for Isochrysis treatments and ten in both other
treatments. The average number of rotifers found in the
larval guts increased considerably between days 4 and 5
(Table 16). However, there were no statistical differences in
this parameter on any one day between the treatments as
ascertained by an ANOVA.
Survival levels on day 14 were lowest for yeast
treatments 12.3 t 3.8% (mean t S.D.), highest for
Nannochloropsis 43.9 t 9% and intermediate for Isochrysis
25.6 2.3% (for values of individual replicates see Table 17).
Up to day 7 no appreciable numbers of dead larvae were seen
on the bottom of the tanks. On the other hand, during days 4
and 5 large numbers of larvae were found floating dead on the
water surface. This phenomenon disappeared completely
after day 6 from those tanks to which algae-enriched rotifers
and suspended algae had been added but continued for a
further two days in tanks to which only yeast enriched rotifers
had been added. The total number of floating dead larvae was
highest for yeast, lowest for Isochrysis and intermediate for
Nannochioropsis treatments, being 222, 25 and 137
respectively.
Daily mortalities, as determined by siphoning dead
larvae from day 8 onwards, see Fig. 19, showed a linear
relation between the percent of surviving larvae in each

74
Table 16. Estimates for first feeding success, gut contents (number ofrotifers in the larvae gut) for turbot larvae feeding on rotifers enrichedwith Isochrysis (Iso) Nannochioropsis (Nanno) or baker's yeast. Ten larvaewere sampled for each estimate. a, b, c -replicates.
Percent
Gut
CutFeeding
Contents
Contents
Feed
Day 4
Day 4
Day 5
Iso abc
Nanno abc
Yeast abC
N.r.* - Not recorded.
70N.r.*N.r.
100N.r.N.r.
100N.r.N.r.
17.6 ± 9N.r.N.r.
15.5 ± 7N.r.N.r.
11.8 t 7N.r.N.r.
n.r.35.8 ± 10.529.1 t 6.8
N.r.36.2 t 11.833.1 t 13.1
N.r.44.8 t 12.421.0 •t 11.4
Table 17. Final survival on day 15*, and the daily mortality rates ofturbot larvae fed rotifers enriched with either Isochrysis (Iso),Nannochioropsis (Nanno) or baker's yeast.
Treatment Survival Mortality
% (%/d)
Iso a
24.0
1.02
b
28.3
2.94
C
24.5
1.64
Nanno a
50.5
3.09
b
33.5
1.99
c
46.6
2.95
Yeast a
11.5
6.8
b
16.5
6.4
c
9.0
7.0
*A correction was made for larvae removed as samples by subtracting thetotal number sampled from the initial number stocked.

ci>>C-
20
10
50
A
N.aN.b
N.c
I.bLa,
I.c
Y.a
YbYc
75
70
60-1 o
7 8 9 10 11 12 13 14 15
Days post-hatch
Fig. 19. The relationship between survival (%) and time (d) for
turbot larvae, as recorded between days 8-15 post-hatch. Larvae
were fed rotifers enriched with either lsochrysis (1), Nannochloropsis
(N) or baker's yeast CV). Replicates a, b, c.

000+1+1+1
WNN
-c'JLr'
N\OD—C--
+1+1+1Lroo
Cl)
(00)>,
Cl)
C-
0)
co
00
+1N
-S0
+1
I—..--
NIc'.1C'.1+1+1+1NuO
N'.DLrC'JC'4Nj
0
+1LI'SN
-I-)-C-20
' 5-
-5---'-3-c
0)
>5
76
x
000
I CO0 (0
0 a)0>,
Cl)
0
a)(0 -
Co
.. '-
-Jo-C-
o -
+1 C
-z4-I°
o'>'>,
. 0
00)
.a)
Co _C
O a)
--C
CC-.C
0)0)
C-Cl)(0-a)O)
.4-
4-I
CO
>C- -D(00)
— 4-4-Ia)0(0.0
C
.I.J_j
C-.0
coC.)'-COa) 4-
4-I
Ea'(0'-
01-C
04-J
C- JI
0(0C0
- C0)
ColI
0 N coa
ir.-ioo
I I +i+i+u. II
C d iNN o\LrC)
C)\\O\O V\\ ('JC
zi I
("Icoj
dod
-C + 1 + 1 + I
C.)0(I, NNW
>'Co
CO.4-3
C
C-0)
4.)0)
E(0I-(V11
C)0-
-5-I-I
--5
C
5-
0U,*

77
replicate and their age post-hatch. Correlation coefficients
Cr) of these regressions were in the range of 0.96-0.99.
Mortality rates, as percent larvae dying daily, (Table 17) were
higher for Nannochloropsis (2.67 ± 0.6%/d) than Isochrysis
(1.86 ± 1%/d) although these differences were not statistically
distinct (t-test). As sampling for daily mortalities in yeast
treatments was not possible these were assumed to be linear
throughout the experiment and the average calculated rate
was found to be 6.7 ± 0.3%/d.
During the experiment larvae grew from 3.72 ± 0.08
(mm ± S.D.) to average total lengths of 7.08, 6.39, 4.78 in
Isochrysis, Nannochioropsis and yeast treatments respectively
(For values of individual replicates see Table 18). An ANOVA
showed differences between treatments to be highly
significant (F = 95, d.f. = 2; 6). At the same time larval
weights increased from an average of 33.75 t 1 (ig S.D.) to
620, 394 and 67 in Isochrysis, Nannochioropsis and yeast
treatments respectively. These differences were significant,
(ANOVA, F = 95, d.f. = 2; 6).
Rates of growth for both lengths and log-transformed
weights were linear for algal treatments throughout the
experiment (Figs 20a,b,c, 21a,b,c; Tables 19, 20). However,
those larvae fed on yeast-enriched rotifers grew only up to
day 8, after which no further increase in either length or
weight was recorded. Growth rates of Isochrysis treatments
were significantly higher for both lengths and log-transformed
weights when compared to Nannochioropsis treatments using
an ANCOVA (for TL/d F = 95, cLf. = 1; 596 and for log W/d
F = 42.3, d.f. = 1; 596). Similarly, specific growth rates
(Table 18) (SGR in ig/d) throughout the experiment

0.960.960.940.96
0.950.970.970.96
100100100300
100100100300
Regression
TL=0.31t+2.87TL=0. 30t+2. 87TL=0.29t+2.99TL=0.29t+2.91
TL= 0.22 t+3. 25TL=0.26t+3.03TL=0.22t+3.24TL=0.23t+3.17
Parameters
ri Sb*_ r
.0024
.0081
.0097
.0052
.0065
.0063
.0058
.004
Treatment
Iso abC
Pooled
Nanno abc
Pooled
0.970.960.940.96
0.950.970.960.95
.003
.003
.004
.002
.003
.002
.002
.002
100100100300
100100100300
Iso abC
Pooled
Nanno abC
Pooled
log W=0.12t+1.18log W=0.11t+1.19log W=0.11t+1.2log W=0.11t+1.18
log W=0.096t+1.27log W=0.11t+1.23log W=0.085t+1.3log W=0.095t+1.26
78
Table 19. Relationships of TL (mm) and age (t, days) for turbot larvaeduring the first 14 days post-hatch. See Table 17 for abbreviations.
*Sb, Standard error of the regression coefficient.
Table 20. Relationships between log-transformed dry weight (rig) and age(t, days) of turbot larvae during the first 14 days post-hatch. See Table 17for abbreviations.
Treatment
Regression Parameters
*n Sb r
*Sb, Standard error of the regression coefficient.

Fig. 20. Relationships of length (TL, mm) and age (days post-hatch)
of turbot larvae feeding on rotifers enriched with either: a,
Isochrysis (ISO), b, Nannochioropsis (NANNO) or c, baker's yeast
(YEAST). Replicates in each treatment are presented by a
different symbol. 95% confidence limits not shown as they are
smaller than the symbols.

9
7
EE-JI.-
3
1
79
5 10 15Days post-hatch
9
7
b. NANNO
c. YEAST5
E•g3
F-
1
E
-JF-
3
1
5 10 15Buys post-hatch
5 10 15Days post- hatch

Fig. 21. The relationship between dry weight of turbot larvae (p.g)
and time (d). Larvae feeding on rotifers enriched with either: a,
Isochrysis (ISO), b, Nannochioropsis (NANNO) or c, baker's yeast
(YEAST). Replicates in each treatment are presented by a
different symbol. Lines where shown denote 95% confidence limits.

800700600
400
300
- 2000'
0
100
50
80
600
500
400
300
100
50
100
0I
500'a)
>,C-
20
5 10
15
Days post-hatch
20155 10
Days post-hatch
C. YEAST
/
20
Days post- hatch

81
were significantly higher for Isochrysis compared to
Nannochioropsis treatments (t-test, a = 0.05) being 0.26 (iig/d)
in the former and 0.22 in the latter.
Larval dry weights were related to lengths using log/log
transformations (Table 21). A comparison of the regression
coefficients between the two algal treatments showed a
significant difference (ANCOVA, F = 5.37, d.f. = 1; 596).
Condition factors (CF) tended to increase linearly in
algal treatments from day 5 post-hatch, whilst in yeast
treatments there were no significant changes in CF throughout
the experiment (Fig. 22a,b,c). Average CF at termination
was significantly higher for Isochrysis (1.64 ig/mm3)
compared to Nannochloropsis (1.43 ig/mm3).
The distribution of development stages on day 14 of 100
larvae from each of the algal treatment tanks is shown in
Fig. 23. Analysis of these distributions showed that in all
replicates of the Isochrysis treatments the average larva was
undergoing notochord flexure and development of marginal fin
rays, stages 4a-4b. However, in Nannochloropsis treatments
in only one replicate was the average development stage
within the notochord flexure phase (stage 4a) whilst in the
other two most larvae were still at the stage of hypural
element formation (3b). Another interesting feature of these
distributions is that in the more developed of the Isochrysis
replicates the distribution was skewed towards the higher
development stages.
Difficulties were experienced in visually relating stages
of early larval development to the criteria defined by
Al-Maghazachi and Gibson (1984). This was mainly due to the

82
Table 21. Regressions of log dry weight (.tg) on log length (TL,mm) ofturbot larvae during the first 14 days post-hatch. See Table 17 forabbreviations.
Treatment
Regression Parameters
*n Sb r
Iso a log W=4.79logTL-1.23
100 .055 0.99
b log W=4.55logTL-1.14
100 .073 0.99C log W=4.63Io9TL-1.19
100 .076 0.99
Pooled
log W=4.76logTL-1.18
300 .038 1.0
Nanno a log W=4.9llogTL-1.35 100 .11
0.98
b log W=4.77logTL-1.25 100 .077
0.99
c log W=4.4OlogTL-1.05 100 .087
0.98Pooled log W=4.69logTL-1.21 300 .055
0.98
*Sb Standard error of the regression coefficient.

Fig. 22. Changes in condition factors (.tg/mm3) with time (d) of
turbot larvae feeding on rotifers enriched with: a, Isochrysis (ISO),
b, Nannochioropsis (NANNO) or c, baker's yeast (YEAST).
Replicates in each treatment are presented by a different symbol.
Lines where shown denote 95% confidence limits.

1 E
1 •
I.-0
4-. 4-U F4ciu1C.28-4--
-Dc0L)0.4
02
83
18
1 6
140 1 ..4-U)ci
U-
b. NANNO
/7 -.
. -'
5 10
15
5 10
15
12L.0
-4-LIci
LL
.2 064-
C0
c. YEAST
5 10
Days post- hatch
15

84
>ca)
Sc
40
30
20
30
20
10
02c 3a 3b 4ci 4b 4c 2c 3a 3b 4u 4b 4c 2c 3a 3b 4a 4b 4c
DeveLopment (stage)
Fig. 23. Distribution of developmental stages (according to
Al-Maghazachi & Gibson, 1984) of turbot larvae on day 14 post-
hatch. One-hundred fish sampled from three replicates. Larvae
fed on either Nannochioropsis (NANNO) or Isochrysis (ISO).

85
fact that these authors emphasize in their definitions the
appearance of spines on the head region, which are most
difficult to distinguish with conventional optics in the smaller
specimen. In the present work stages 2a, 2b and 2c of
Al-Maghazachi and Gibson were redefined as follows:
Stage 2ab - comprises all individuals whose mid-gut was
bent ventrally but torsion was not yet complete.
Stage 2bc - mid-gut torsion complete but hypural
element not yet present.
Stage 2c - hypural element present but fin rays not
apparent.
Development rates were estimated by transforming the
combined staging system to a numerical one as follows:
Stage id-i, 2ab-2, 2bc-3, 2c-4, 3a-5, 3b-6, 4a-7, 4b-8,
4c-9. Figs 24a,b,c present the average development level of
larvae from the different treatment on the various sampling
days. Larvae fed yeast-enriched rotifers attained
development stage 2bc by day 8 and did not show any
development thereafter.
On the other hand larvae feeding on rotifers enriched
with algae developed continuously, and at a constant rate
throughout the experiment. There were no significant
differences in the rate of development between the two algal
treatments, which was 0.56 stages/day (ANCOVA, F = 0.05,
d.f. = 1; 594).
Using the numerical conversion system it was also
possible to regress log-transformed weights on development
stage, which showed that for any given stage the average larva
from the Isochrysis treatment had the same weight as

Fig. 24. The relation between development of turbot larvae using
the staging system of Al-Maghazachi & Gibson (1984) and time (d).
Larvae fed rotifers enriched with: a, Isochrysis (ISO), b,
Nannochloropsis (NANNO) or c, baker's yeast (YEAST). Replicates
in each treatment are presented by a different symbol. Lines where
shown denote 95% confidence limits.

4c
4b
:; 4a
LI)
4-
4Did
lb
a.ISO
Jy
86
5 10 15
Days post-hatch
42c
2bc
2ab0-0-s0)
0)
4c
4b
U
3b
- 3a,
2c
c 2bc0U>cii
Did
1 b
c. YEAST
b. NANNO
-Ill III I I I I I 1
5 10 15
Days post-hatch
5 10
15
Days post-hatch

87
Nannochioropsis larvae (ANCOVA, F = 0.51, d.f. = 1; 594). The
pooled regression for all algal treatments was:
log W = 0.19 st + 1.38 (W, rig; st, stage), r = 0.97; p < 0.001
Development of a functional swimbladder (filled with
gas) was compared between treatments on day 12 post-hatch
(Table 16) showing 20-30% inflation in yeast, compared with
60-80% in algal, treatments.
Results were also analyzed for effects of growth rates
(in terms of both SGR and mm/d) on the mortality rates
(% dying/d) showing (Table 17, Fig. 25) that mortality
decreased linearly with increasing growth rates (F test,
p < 0.001).
B. Ingestion Rates
1. Herring
Growth of herring larvae in duplicate 100 1 tanks up to day 21
post-hatch is summarized in Table 22. Growth rates in total
length (mm/d) were higher in duplicate b (0.41 mm/d)
compared with duplicate a (0.31 mm/d). This was true also
for log-transformed weights. The relation of log dry weight to
log length (TL) (pooled regression for tanks a and b) was:
log W = 3.26 log TL - 1.25 (r = 0.97, p < 0.001)

88
Table 22. Regre sion length (TL,mm), and dry weight (W,pg) on time fortwo tank populatic ns of herring larvae. Larvae were fed rotifers enrichedwith Isochrysis and used for ingestion and conversion efficiencyexperiment.
Duplicate
Regression
Parameters
r p
a TL=0.31t+8.72 0.83 < 0.001log W=0.033t+1.91 0.79 < 0.001
TL=0.41t+7.81
0.9 < 0.001log W =0.0 37t+ 1.92
0.77 < 0.001

-1
-2
ci
-6
-7
89
Growth rate (mm Id)
0-05 01 015 02 0-25 0-3 035
//
10 20 30
SGR(%/d)
Fig. 25. The relation of mortality rates and specific growth
rate for turbot larvae.
For growth in mm/d —0----
y=21.6x-8.O1 (r=0.96; p < 0.001)
For growth in %/d (of dry weight)-----
y=0.245x-8.2 (r=0.97; p < 0.001).

90
Gut contents analysis (Fig. 26) showed that the number and
weight of rotifers found in the larval guts increased rapidly
between days 7-10, from an average of 32 to 95
rotifers/larvae. After day 12 these numbers fell to around 55
rotifers/larvae by day 18. Using estimates of larval dry
weights obtained by converting their measured lengths (TL)
with the log/log transformation and the average dry weight of
a 'rotifer used in these experiments, 0.17 .Lg, it was possible to
estimate gut contents as the percent of larval dry weight.
This ration tended to increase from about 3% on day 7 to 8%
on day 12 and decrease thereafter to 2.2% on the final
sampling day (21) (Fig. 27).
Larvae did not seem to suffer from any adverse effects
due to transfer from the 100 1 holding tanks to the 2 1
experimental beakers. At the end of each 24 hr feeding trial
all of the larvae in the beakers were alive and active. Food
consumption was very high during the first two feeding trials
(days 10 and 13 post-hatch) with an average 90% of the initial
number of rotifers consumed in all beakers over the 24 h
period. However, for the last two trials (days 18 and 21 post-
hatch) this value fell down to 57%.
The quantities of food, both in numbers and in weight of
rotifers, consumed daily by herring larvae, tended to increase
between days 10 and 21 post-hatch (Table 23), while the daily
rations (food consumed daily as percent of body weight)
declined from a maximal 46%/d on day 10 to a minimal
18.8%/d on day 21 (Table 23), with an average value over the
whole experiment of 30.6 t 7,7 (% t S.D.)/d. IngestIon
(I = ig/d) was ilinearly related to larval dry weight
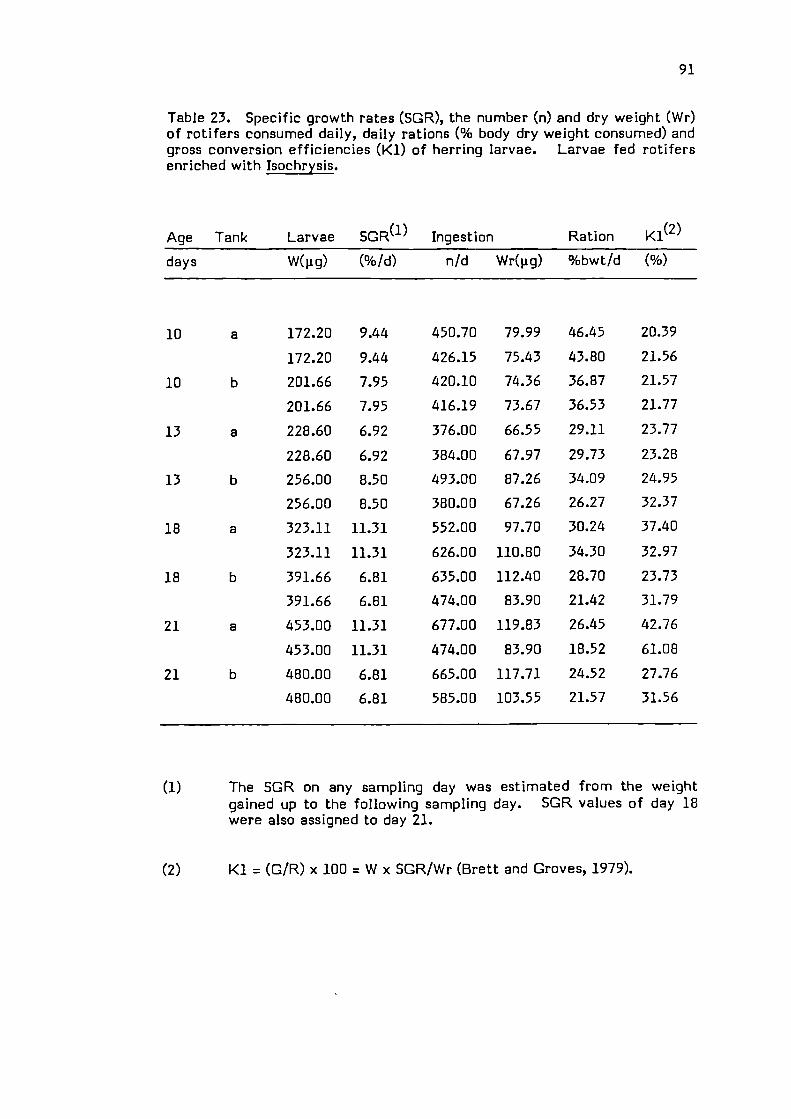
91
Table 23. Specific growth rates (SGR), the number (n) and dry weight (Wr)of rotifers consumed daily, daily rations (% body dry weight consumed) andgross conversion efficiencies (K1) of herring larvae. Larvae fed rotifersenriched with Tsochrysis.
Age Tank
Larvae SGR1
Ingestion
Ration K1(2)
days
W(j.ig) (%Id)
nfd Wr(tg)
%bwt/d
(%)
10 a
10 b
13 a
13 b
18 a
18 b
21 a
21 b
172.20 9.44
172.20 9.44
201.66 7.95
201.66 7.95
228.60 6.92
228.60 6.92
256.00 8.50
256.00 8.50
323.11 11.31
323.11 11.31
391.66 6.81
391.66 6.81
453.00 11.31
453.00 11.31
480.00 6.81
480.00 6.81
450.70 79.99
426.15 75.43
420.10 74.36
416.19 73.67
376.00 66.55
384.00 67.97
493.00 87.26
380.00 67.26
552.00 97.70
626.00 110.80
635.00 112.40
474.00 83.90
677.00 119.83
474.00 83.90
665.00 117.71
585.00 103.55
46.45
43.80
36.87
36.53
29.11
29.73
34.09
26.27
30.24
34.30
28.70
21.42
26.45
18.52
24.52
21.57
20.39
21.56
21.57
21.77
23.77
23.28
24.95
32.37
37.40
32.97
23.73
31.79
42.76
61.08
27.76
31.56
(1) The SCR on any sampling day was estimated from the weightgained up to the following sampling day. 5CR values of day 18were also assigned to day 21.
(2) K1 = (GIR) x 100 = W x SGR/Wr (Brett and Groves, 1979).

25
20
r cnID
.4-
a)-3-
4,'lu 0
LI
4.-
5
4-
V)C-
4-
4-0C--
4-ca)4-
0LI4-
92
5 10 15 20 25
Days post-hatch
Fig. 26. The relationship between the gut contents in numbers of
rotifers/gut and their dry weight/gut (1 rotifer = 0.17 rig) to time (d)
of developing herring larvae.

93
(W = rig) (Fig. 28) and the linear relation between these two
parameters was:
I = 0.13W + 49.67 (r = 0.79 p < 0.001)
From the equation it transpires that for a given larval weight,
specific ingestion was 0.13/d. Furthermore, the regression
constant has a progressively larger influence on the daily
ration as larval weight decreases, which is the reason for the
decline noted in the daily ration between day 10 and day 20.
The efficiency of conversion of the daily ingested food,
K1 (Table 23) ranged from 20-61% with an average value of
29.1 t 10.9 (% ± S.D.) and tended to increase from 21% at day
10 post-hatch to 41% on day 21. Again this increase in K1
was due to the relatively larger ingestion constant (49.67) for
younger, compared with older, larvae.
2. Turbot
Growth regressions for turbot larvae in the 100 1 rearing tanks
throughout the feeding experiments are summarized in
Table 24. Growth rates in length (TL) and log dry weights (gig)
were higher in duplicate a than b. The relation of log weight
to log length (pooled values for both tanks) was:
log W = 4.26 * log TL - 0.88 (r = 0.99, p < 0.001)
Gut contents analysis showed an exponential increase in the
number (N) of rotifers found in larval guts in relation to larval
length (TL). This was best described by the equation:

94
Table 24. Regressions for daily growth in length (TL,mm), and dryweight (W,1.ig) of turbot larvae in duplicate tanks. Larvae were fedrotifers enriched with Isochrysis and used for ingestion and conversionefficiency experiments.
Duplicate
a
a
b
b
Regression
TL = 0.28t + 2.9
log W = 0.005t + 1.38
TL = 0.24t + 3.02
log W = O.78t + 1.39
Parameters
r p
0.95 < 0.001
0.93 < 0.001
0.94 < 0.001
0.93 < 0.001

104--C
U,4-cw 4-4-
0U
-4-
=2
I I\/ I I '¼/
I
I'c
95
5 10 15 20Days post - hatch
Fig. 27. The relationship of gut contents as percent dry weight and age
(d) of developing herring larvae.
QD
C04-'-I,a)C
30100 200 300 400
Dry weight(jig)
Fig. 28. Relation of ingestion to dry weight of herring larvae fed rotifers.
Estimates for 24 h feeding. y=0.13x+49.67 (r=0.79, p < 0.001)
Replicate a 0
Replicate b , 0

3
5
5
5
5
8
8
8
8
10
10
10
10
17
17
17
17
a
a
a
b
b
a
a
b
b
a
a
b
b
a
a
b
b
43.71
43.86
41.07
76.77
81.83
90.44
58.86
87.83
136.00
116.57
81.83
76.63
158.72
169.17
52.89
34.42
58.67
90.85
15.32
47.25
50.46
23.73
22.26
26.78
41.15
20.76
13.41
101.01 44.50 31.12
150.69 66.39 21.37
206.65 108.20 13.15
98.54 51.59 29.39
212.15 35.45 39.07
215.90 35.23 40.28
327.53 63.35 22.45
416.50 75.44 20.10
96
Table 25. Specific growth rates (SGR), the number (n) and dry weight (Wr) ofrotifers consumed daily, daily rations (% body dry weight consumed) and grossconversion efficiencies (Ki) of turbot larvae. Larvae fed rotifers enrichedwith Isochrysis.
Age Tank Larvae SCR 1Ingestion Ration K12
days W(ig) (%/d) n/d Wr(ig) %bwt/d (%)
37.50
53.60
53.60
48.37
48.37
171.00
171.00
149.70
149.70
227.00
227.00
191.00
191.00
598.48
612
517.01
552.09
17.86
38.67
38.67
37.66
37.66
14.16
14.16
12.18
12.18
13.85
14.19
14.23
15.16
13.85
14.19
14.23
15.16
257.14
258.02
241.62
451.59
481.35
532.00
346.25
516.67
800.00
594.15
886.44
1215.61
579.65
1247.92
1270.00
1926.67
2450.00
(1) The 5CR on any sampling day was estimated from the weight gained up tothe following sampling day. SCR values of day 10 were also assigned today 17.
(2) K1=(G/R) x 100 = Wx SCR/Wr (Brett and Groves, 1979).
(3) Direct measurements on larvae from the experimental beakers after the24 h feeding period.

97
log N = 4.32 log TL - 1.07 (r = 0.93, p < 0.001)
By converting larval lengths to dry weights using the log/log
transformation, and rotifer numbers to dry weights using
1 rotifer = 0.17 i' as found experimentally, it was possible to
describe the increase in dry weight of gut contents (CC, i'g) as
a linear function of larval dry weight (W):
CC = 0.13W - 2.28 (r = 0.93, p < 0.001)
The relation of gut contents in dry weight to larval dry weight
is presented in Fig. 29.
Throughout the feeding trials an average of 50 15
(% t S.D.) of larvae stocked into the 2 1 beakers survived and
were active at the end of each 24 h feeding period (range
(10-75%). The average number of rotifers consumed in the
beakers was 50.5 23 (% 1 S.D.) with a range of 4-82%.
Estimates of ingestion for the individual trials are
summarized in Table 25. The quantities of food consumed
daily by the larvae increased from 257 rotifers (43 g) to a
maximal 2450 rotifers (416 i.'g) between days 3 and 17 post-
hatch respectively. The daily ration estimates food consumed daily
as percent of body weight tended to decline between the
initial and final sampling days, averaging 77.9 40 (% t
S.D.)/d. Ingestion (I = tg/d) was lilnearly related to larval
weight (W = tg) (Fig. 30) and the relation between these two
parameters was:
I = 0.43W + 38.45 (r = 0.83; p < 0.001)

1
Li)
U-e-
0U
98
I 'V\ ,
100 200 300 400 500 600 700 BJ0
Dry weight (j.ig)
Fig. 29. Gut contents of turbot larvae in dry weight of rotifers
relative to larval dry weight. Broken lines denote 95% confidence
limits.

4
C
B
1
99
100 200 300 400 500 600
Dry weight (jjg)
Fig. 30. Ingestion estimates, in dry weights, for turbot larvae
feeding on rotifers.
For replicate A, y=0.63x+34.1, (r=0.95; p < 0.001) •
For replicate B, y=0.31x+30.7, (r=0.96; p < 0.001) $
C, pooled regression y=0.43x+38.45 (r=083; p < .001)

'Do
From the equation it may be shown that for a given larval
weight specific ingestion was 0.43/d. As in the case of the
herring larvae the regression constant had a greater effect on
daily ration estimates for younger (lighter) compared with
older (heavier) larvae.
Conversion efficiencies (K 1) (Table 25) were not found to
fluctuate much throughout the experiment and were in the
range of 15-50%, with an average (± S.D.) of 28.5 ± 11.9%.
Larvae from duplicate a exhibited higher K, values than those
of duplicate b. This resulted from their higher daily growth
rates and was particularly apparent for the very small larvae
(r 50 ig) and on the last experimental day when larvae from
this duplicate weighed about 600 1g.
C. Rotifer biochemical composition
Dry weight values of rotifers corrected for female/egg ratios
are presented in Table 26, column 3. Values for rotifers
enriched with Nannochloropsis can be directly related to those
of rotifers fed yeast as the samples were derived from the
same initial population (see methods, H.1). The weight of
Nannochloropsis-enriched rotifers, after the initial 24 h
enrichment, was similar to that of yeast fed rotifers, 319 ng
compared with 315 ng respectively. However, a further 24 h
enrichment at 20°C in Nannochloropsis had a marked effect
on the rotifer's dry weight which, after correction for the
egg/female ratio, showed a 16% increase compared with its
initial value. On the other hand, yeast-enriched rotifers,
which were deprived of food lost about 27% of their dry

101
Table 26. Dry weights and calorific values of rotifers grown onbaker's yeast and then enriched (a) for 24 h at 20°C with eitherIsochrysis (iso) or Nannochioropsis (Nanno). Values are also shownfollowing a second 24 h enrichment period at either (b) 20°C orCc) 10°C. (d) and (e) are yeast grown rotifers after 24 h starvationat 20°C or 10°C respectively.
Enrichment
Treatment W cal/g cal/individualng
Nanno
Iso
Yeast
a 319 7301b 371 7539c 361 6197
a 270 4534b 332 5151c 315 6524
a 316 6617d 204 6936e 230 7347
.0023
.0028
.0022
.0012
.0017
.0021
.0021
.0014
.0017
All values corrected for the presence of eggs.
Calorific values corrected for ash content estimated as 7.8°c(Theilacker & Kimball, 1984).
102
weight after the 8econd 24 h enrichment period at 20°C.
Isochrysis-enriched rotifers also exhibited a marked increase
in their dry weight during the second enrichment period at
20°C, their average weight increasing from 269 ng to 332 ng
respectively.
Weight increase of algal-enriched rotifers at 10°C were
not as high as that of rotifers at 20°C. Conversely, weight
loss of yeast-enriched rotifers at 10°C was not as pronounced
as at 20°C.
Ash and egg-free calorific values per g rotifer are
presented in column 4 of Table 26 and the calorific values for
individual rotifers in column 5. Isochrysis rotifers which were
prepared at a date later than Nannochioropsis and yeast
treatments had values somewhat lower than the other two
treatments. The average value per g rotifers for unstarved
treatments was 6460 t 1025 cal/g and (1.95 0.5) x 10
cal/individual. There were no obvious changes in rotifer
calorific values in relation to the type of enrichment or its
duration.
Total carbon and percent protein were not markedly
affected by either the type of enrichment or the enriching
temperature and duration (Table 27). Average carbon content
+ + +was 41.5 - 1.95 and protein was 53.2 - 2.3 (% - S.D.). Average
+ 0+total lipid for all samples was 10 - 2.1 (Ia - S.D.). Percent
total lipid showed a slight tendency to increase in algal
enrichments after the second 24 h enrichment period, in
particular at 10°C, where lipid values increased from around
9% to 13% of the rotifer's dry weight. Carbohydrate was
calculated as the difference from 100% of the sum of lipid

abC
Nanno
abc
Iso
ade
Yeast
103
Table 27. Proximate composition (% of dry weight) of rotifersgrown on baker's yeast and then enriched (a) for 24 h at 20°C witheither Isochrysis (Iso) or Nannochloropsis (Nanno). Values are alsoshown following a second 24 h enrichment period at either (b) 20°Cor (c) 10°C. (d) and (e) are yeast grown rotifers after 24 hstarvation at 20°C or 10°C respectively.
Enrichment
Treatment Carbon Protein Lipid
Carbohydrate
% %
%
41.5 52.3
42.8 52.6
43.7 50.0
42.5 54.344.8 52.1
42.03 49.7
41.5 54.1
38.0 53.1
41.0 57.2
8.710.0513.5
9.610.5212.39
9.316.39.01
31.229.628.7
28.329.630.1
28.832.826.0
All values corrected for the presence of eggs.
Carbohydrates evaluated by subtraction from 100% using an ashcontent estimate of 7.8% (Theilacker & Kimball, 1984).

104
protein and ash, using an ash content estimate of 7.8%
(Theilacker and Kimball, 1984). The average carbohydrate
content of the rotifers was estimated at 29.6 ± 1.9%).
The absolute carbon, protein and lipid values per
individual rotifer (Table 28) tended to increase with prolonged
enrichments in the algal treatments, or decrease with
starvation in yeast treatments, in accordance with the changes
in rotifer dry weight. As an example, following a second 24 h
period at 20° C, lipids increased from 26 to 36 ng/rotifer in the
Isochrysis enrichments and decreased from 31 to 21 ng/rotifer
in the starved rotifers.
There were no apparent differences in the amino acid
composition of rotifers from the three treatments (Table 29).
Fatty acid profiles for the different treatments are
summarized in Table 30. Rotifers grown on yeast were
characterized by a high percentage of saturated and
monoethylenic fatty acids of 16, 18 and 20 carbons. Only
2-5% of unsaturation was polyethylenic and in two of the
replicates trace amounts of 22 : 6n-3 were found. In contrast,
rotifers enriched with algae had high levels of polyethylenic
acids (20-30%) as well as higher levels of saturated acids
(37-51%). Of the polyethylenic acids 7-15% were of the n-3
series. Nannochloropsis-enriched rotifers were rich in 16 : 1
monoethylenic acids and Isochrysis-enriched rotifers in 18 : 1
and 24 : 1 acids. Of the polyunsaturated acids, Isochrysis
rotifers were high in 18 : 2, 18 : 3 and 18 : 4 acids as well as
containing 2-4% of 22 : 6n-3, while Nannochloropsis rotifers
had small amounts f 18 : 2, no 22 : 6n-3 high amounts of
20 : 4 n-6 and very high amounts of 20 : 5n-3 (11-13%) acids.

Aspartic acidThre on meSerineGlutamic acidProlineClycineAlanineValineMethionineIsoleucineLeucineTryosinePhenylalan meHistidineLysineAryinine
11.244.585.36
13.585.834.215.246.122.254.608.264.376.491.957.947.97
11.284.465.26
13.195.064.155.176.312.585.038.214.946.631.928.137.66
11.464.635.43
13.955.324.134.975.922.234.788.394.536.842.128.476.83
105
Table 28. Proximate composition (absolute values in ng) of rotifersgrown on baker's yeast and then enriched (a) for 24 h at 20°C witheither isochrysis (Iso) or Nannochioropsis (Nanno). Values are alsoshown following a second 24 h enrichment period at either (b) 20°Cor (c) 10°C. Cd) and (e) are yeast grown rotifers after 24 hstarvation at 20°C or 10°C respectively.
Enrichment
Treatment Carbon Protein Lipid
fly ng ng
Nanno
Iso
Yeast
a 136.92 172.62b 167.7 206.04c 162.49 186.00
a 116.02 148.18b 155.9 181.27c 137.03 162.45
a 139.82 182.18d 78.66 109.96e 99.1 138.38
28.7439.4050.22
26.2136.6140.52
31.3713.0421.80
All values corrected for the presence of eggs.
Table 29. Amino acid composition of rotifers (in g/lOOg crudeprotein) following a 24 h enrichment at 20°C with Isochrysis (Iso),Nannochloropsis (Nanno) or baker's yeast.
Amino Acid
Nanno
iso
Yeast

106
Table 30. Fatty acid profiles of rotifers grown on baker's yeast and thenenriched with either Isochrysis, Nannochioropsis or baker's yeast at 20°C for24 h.
Yeast
Nannochloropsis
Isochrysis
FA
a d e a* b c a
b c
1.42 1.85 1.970.43 0.66 0.529.51 11.3 9.7527.7 29.0 29.2
0.96 0.93 0.940.64 0.78 0.650.51 0.245.81 5.77 5.2325.5 24.1 25.510.6 10.5 9.640.48 2.74 2.34tracetrace trace
0.1 trace 0.09
4.61 4.39 4.26
1.15 0.82 1.16
0.23 0.09
1.03 0.35 0.85
tracetrace 0.17
14:015:016:016:ln-716:ln-516:216:316:417:018:018:ln-918: ln-718:2n-618:3n-618:3n-318:4n-318:5n-320:020:ln-920:ln-720:4n-620:4n-320:5n-322:022:].22:422:5n-322:6n-324:024:ln-9
5.25 5.47 12.88 13.4 15.20.41 0.46 0.45 0.26 0.4116.6 19.3 14.9 10.4 9.8231.5 34.6 12.9 7.09 8.1
0.30.58 1.16 0.62
0.23 0.3 0.5 0.13 0.470.25 0.26 0.17 0.13 0.30.24 0.27 trace2.25 2.49 3.57 2.2 2.126.18 8.89 22.2 14.4 16.35.32 5.27 5.78 4.9 3.731.79 1.51 3.84 3.91 3.530.19 trace trace0.08 trace 3.54 3.85 3.73
trace 4.0 5.09 5.28
trace trace 0.22 0.14 0.341.63 1.79 3.67 2.57 2.530.44 0.39 0.68 0.18 0.423.64 3.27 trace tracetrace 1.32 2.13 1.8613.53 11.1 0.32 0.3 0.42
0.36 0.32 0.08 0.28 0.540.08 trace 1.1
1.3 0.821.97 4.05 3.370.171.24 19.4 10.7
a: enriched for 24 h at 20°Ca*: sample lostb: a second 24 h enrichment at 20°CC: a second 24 h enrichment at 10°Cd: Rotifers deprived of food for 24 h at 20°Ce: Rotifers deprived of food for 24 h at 10°c

107
The changes in fatty acid profiles in relation to duration
of enrichment and the enrichment temperature can be seen in
the Isochrysis treatment, e.g. the 16 : ln-7 which is high in
yeast-grown rotifers decreases from J' 28% to 13% after
transferring rotifers to !sochrysis for 24 h and to 7% after a
further 24 h at 20° C. Likewise, 22 : 6n-3 of which only trace
amounts were detected in yeast-enriched rotifers, increased
to 1.97% after 24 h in Isochrysis at 20°C and to either 3.4% or
4.05% after a further 24 h at 10°C or 20°C respectively.

108
DISCUSSION
A. The diets
The two rotifer types, L and S, used throughout the project
had characteristic widths of 151 t 9.8 and 113 t 6.7 (iim ± s.d.)
respectively. Their respective mean dry weights, calculated
according to the relation of dry weights of B. plicatilis to its width
(Theilacker & Kimball, 1984):
y = 1.4 x 10 5 X 2 ; (y = dry weight, .tg; X = width, i.tm)
are 323 ng and 178 ng. These values relate exceptionally well to
the dry weights experimentally determined here, which for
unstarved L-type rotifers was 326 t 33 ng and for S-type (see results
section B.1) was 179 t 15 ng. The dry weight of the S-type rotifer
is identical to that employed by Tandler & Mason (1984) and Doohan
(1973). Scott & Baynes (1978) reported a range of 113-650 ng for
the rotifer, depending on the feeding regime. However, in improved
nutritional conditions rotifers tend to increase their reproduction
rates, and with it the ratio of eggs to females. The dry weight
estimates of Scott & Baynes, mentioned above, did not bring this
factor into consideration. As such they are only comparable to the
dry weights of L-type rotifers, used in the present study, at
equivalent egg/female ratios of 0.17-0.2 which they estimated at
306-340 ng.
Since rotifer eggs are surrounded by a shell containing chitin
(Wurdak et al., 1978), which is most likely indigestible to fish larvae,
it is essential, when using rotifers for estimates of larval nutrition,
to correct for egg/female ratios. The presence of undigested
rotifer eggs in the guts of the different species of larvae employed
in this study corroborates this contention.

109
Rotifer dry weights can fluctuate by up to 30% depending on
feeding regimes such as starvation or excess feeding (Scott &
Baynes, 1978; Leimeroth, 1980). This does not imply a concomitant
change in the size of the animal as the lorica in which it is
enveloped is a rigid structure. Such effects were observed in the
present experiments where rotifers from the mass culture lost 33%
of their dry weight when deprived of food for 24 h at 20°C, or
gained 12-23% dry weight following prolonged enrichment in the
presence of algae. Interestingly, it was found that in the present
experiments, proximate composition was relatively unaffected by
the duration and temperatures of enrichment or food deprivation.
Since fish larvae consume food in relation to availability (Boehlert &
Yoklavich, 1984; Werner & Blaxter, 1981) fluctuations in the
rotifer's dry weight will affect the daily ration of the larvae. This
could be very significant in a mariculture facility where rotifers are
introduced into the rearing systems at fixed levels. This point,
which has also been stressed by Scott and Baynes (1978), is an
important reason for using "green-water" in fish larval culture units
since the presence of algae in the larval tanks ensures that the prey
offered will have a continually high nutritive value.
Average ash-free calorific value for unstarved L-type rotifers
was 6.46 cal/mg or 1.95 x 10 cal/individual. These values are
higher than the 4.8 cal/mg reported by Theilacker & Kimball (1984)
and the 5.3 cal/mg reported by Theilacker & McMaster (1971). Such
differences could have arisen if the rotifer's ash content estimate
employed in the present study was lower than its value in the
literature (see Methods, H.3). The discrepancy can also be resolved
if the calorific values of individual rotifers are calculated on the
basis of their proximate composition. By using conversion factors

110
of Platt & Irwin (1973), where the protein, carbohydrate and lipid
equal 5.65, 4.1 and 9.45 cal/mg respectively, it transpires that the
average ash free calorific value of a single L-type rotifer is
1.79 x io cal/individual which agrees well with the 1.8 x icr3
cal/individual for the same width class given by Theilacker &
Kimball (1984). These authors estimated calorific value of S-type
rotifers, as 0.97 x 10 cal. This value can be used to convert data
into calorific terms in the present study whenever S-type rotifers
were used.
Proximate analysis of rotifers suggests that diet has no effect
on their basic chemical composition (Scott & Baynes, 1978;
Watanabe et al., 1983b; Dendrinos & Thorpe, 1987). A recent
publication showing wide fluctuations as a result of changes in diet
(Ben-Amotz et al., 1987) most likely suffers from an artefact
introduced by not rinsing salts, present in the growth medium, from
the samples before drying them. The present results are in
accordance with the first findings. Quantitatively they are very
similar to those of Scott & Baynes (1978) with protein in the range
of 50-58% and lipid as 9-16% of dry weight. They differ from
results summarised by Watanabe et al. (1983a) and those of
Dendrinos & Thorpe (1987) where protein and lipids were 65% and
23.5% respectively in the former and 33-42% and 14-28% in the
latter. Protein requirements of adult fish are 40-60% of diet dry
weight (Castell et al., 1986) and although direct comparisons
between adults and larvae should be made with caution, it would
seem that rotifers meet this protein requirement.
Amino acid profiles of rotifers enriched with algae or yeast
were similar to each other and to other profiles reported in the
literature (Watanabe et al., 1983b; Dendrinos & Thorpe, 1987). The

111
amino acid content of phytoplankton and consequently of
zooplankton is generally regarded to be high in essential/non-
essential acids for both bivalves (Epifano, 1979) and finfish (Castell
et a!., 1986). One can expect that they will also meet the
requirements of fish larvae. However, it is also quite obvious that
any differential growth patterns observed in the different larval
species when fed the different diets, can not be attributed to the
amino acid profiles of the diets.
Lipids are required in finfish diets both as an energy and an
essential fatty acid (EFA) source. The total lipid content of the
rotifers used here, 10-13%, was somewhat lower than values
published by Watanabe at a!. (1983b) and Dendrinos & Thorpe (1987)
which were 23.5% and 14-28% respectively. The observations on
rotifer lipid content in this work also suggest that, to a limited
extent, lipid levels were altered in accordance with the duration and
temperature of enrichment. In adult fish the ration of dietary
protein invested in growth can be enhanced, to a limited extent, by
increasing the lipid content of the diets (Cowey, 1979). Although it
is questionable whether a similar mechanism operates in fish larvae
it might be worthwhile pursuing this point. Enhancing the lipid
content of the rotifer might be achieved by enriching it with algae
at low temperatures (10° C, as shown in the present study) or raising
them on marine algae with high lipid levels or lipid fortified yeasts
such as those used in Japan (Watanabe at al., 1983a).
Of all the biochemical components analysed in this study the
change in fatty acid (FA) profiles as a result of the different
enrichments and their durations was the most remarkable. It is
characteristic of rotifers to acquire an FA profile similar to that of
their diet (Scott & Midclleton, 1979; Dendrinos & Thorpe, 1987;

112
Watanabe at al., 1983a; Lubzens at 81., 1985; Ben-Amotz et al.,
1987). Furthermore the rotifer changes its FA profile within 6-24 h
of having its diet changed from one food organism to another
(Watanabe et al., 1979). This trend was clearly manifested in the
present experiment where 24 h after being transferred from yeast to
Isochrysis a major change had taken place in the rotifer's FA profile,
with only minor changes taking place at longer enrichment periods.
However, it should be noted that the percentage of 22:6n-3, a fatty
acid considered as essential to the nutrition of marine fish,
continued to increase during the second enrichment period in
Isochrysis from 1.9% to 3.4% and up to 4.2%.
FA profiles of rotifers grown on baker's yeast had only trace
amounts of n-3 acids. The characteristic FA profile of baker's
yeast is devoid of any n-3 acids and of fatty acids with chain lengths
of over 18 carbons (Lubzens et al., 1985). It is most likely
therefore that the trace amounts of 18:3n-3, 22:6n-3 and of all the
longer chain acids found in the rotifers resulted from de novo
synthesis of these acids by the rotifer as reported by Lubzens at al.
(1985).
Rotifers enriched with Isochrysis were rich in n-3 fatty acids
(8-15.5%), and had both the essential fatty acids for marine fish, i.e.
18:3n-3 and 22:6n-3. This pattern is typical of rotifers enriched
with this algae (Lubzens et a!., 1985; Ben-Amotz at at., 1987).
Scott & Middleton (1979) found an additional 3% of 20:5n-3 in
rotifers raised on Isochrysis. Such variations can arise from
different fatty acid profiles related to the origin of the algal strain
employed (Helm & Laing, 1987), or due to contamination by other
micro-organisms at the time of enrichment.

113
Enriching the rotifers with Nannochioropsis also raised the n-3
fatty acid levels to 12-15%. However, the situation with the fatty
acids from the n-3 series was reversed, with little or no 18:3n-3 and
22:6n-3 in the rotifers and appreciable quantities of 20:5n-3
(11-13.5%). Although as yet there are no reports in the literature
concerning the FA profile of N. oculata, a recent analysis of the
algae (P. Hodgeson, pers. comm.) showed a similar profile with
20:5n-3 amounting to 18% of the total fatty acids. A congeneric
species N. sauna has been found to have a similar FA profile which
manifested itself as 6.5% 20:5n-3 in the rotifer (Ben-Amotz et al.,
1987). Witt et at. (1984) found that rotifers enriched with
Nannochloris sp. had 21.4% of 20:5n-3, no 22:6n-3 and trace
amounts of 18:3n-3 (percent of total fatty acids). This FA profile
resembles that of Nannochioropsis enriched rotifers used in the
present study. The genus Nannochioris has recently been
reclassified as a member of the Eustigmatophyceae and the genus
name changed to Nannochioropsis (Antia et al., 1975). Furthermore,
as the FA profiles of algae seem to be characteristic of algal classes
(Leftley, pers. comm.) it might very well be that Witt et a!. (1984)
have misclassified their algae.
In summary, it may be stated that the three rotifer diets
employed here were unique only in their FA profiles, while being
equal for all other biochemical components tested. Undoubtedly,
however, other biochemical components within the rotifer would
have been subject to the type of enrichment employed. These could
be levels of vitamins such as E, B12 or C that are prevalent in plant
matter and not in yeast, or hydrocarbons and trace elements present
in the pigments of the individual algae employed.

114
B. The effects of the diets on growth of the larvae
The species of fish used in these experiments can be divided
into two main categories according to their response to the three
diets tested. The first comprised the herring and plaice which grew
equally well on both of the algal enriched diets and the second, the
turbot, which grew better on the Isochrysis compared with the
Nannochloropsis-enriched rotifers. However, common to all three
larval species was firstly, an asymptotic relation of growth to age
and secondly, the arrest of ontogeny at an early developmental
stage when fed the yeast-enriched rotifer diet.
The effect of the yeast-enriched rotifer diet could not be
attributed to starvation. The experiments clearly demonstrated
that considerable numbers of larvae, of all three species, offered
these rotifers survived beyond the stage of mortality commonly
associated with starvation.
Clyde herring larvae, of the same batch used in the 1986
experiment, have been shown to reach the PNR at day 12-13 post-
hatch, 50% starvation mortality (t 50) at 16-17 d post-hatch and
100% mortality at day 22 (Yin & Blaxter, 1987). Identical values
for t50 (16.2 d), irrespective of the diet offered to the larvae, were
recorded in the present experiments. Since some larvae in all three
treatments survived beyond the period of mortality associated with
starvation it may be concluded that the treatment influenced the
magnitude of the starvation mortality. Furthermore, on the final
day of the experiment herring larvae fed on the yeast-enriched
rotifer diet could not be classified as starving for two reasons.
First, their dry weight had increased from 148 15 tg on day 4 to
215 t 10.2 tg on day 28 post-hatch. Second, there was a steady
improvement in their condition factor, such that on day 28 the

115
average RCF of the surviving larvae was 0.15 (relative condition
factor 8S defined by Ehrlich et a!., 1976, employing their value of
b=4.57) which is higher than the 0.11-0.13 reported by the above
authors for starving specimens at PNR.
Turbot larvae did not exhibit any significant mortalities on
days 6-8 post-hatch, the period associated with starvation mortality
as estimated on a group of control larvae. Jones (1972) showed that
at 17.5°C turbot reached their PNR at 7 days post-hatch and
starvation mortality was 100% on day 9 post-hatch. Cousin et a!.
(1986), using histological criteria, showed that starved turbot larvae
died on days 6-8 post-hatch. These authors have also shown that in
larvae which start feeding, but die between days 8-14 post-hatch,
the alimentary canal showed a continuing development with the
coiling of the mid-gut and appearance of the swimbladder. The
authors suggest that nutritional deficiencies probably cause the
larvae to stop feeding and a degeneration of the alimentary canal
and associated structures sets in. Similarly, in the present
experiments, turbot fed yeast-enriched rotifers continued to grow
beyond the yolk sac stage and up to day 8, at which time they had
doubled their weight from 33.75 ig to 67.3 'g They also exhibited
the definitive ontogenetical development events mentioned before,
i.e. coiling of the mid-gut and appearance of the swimbladder.
However, the inflation of the swimbladder seems to have been
affected by the diet since it was only inflated in 20-33% of the fish
examined, compared with 70-80% inflation in those larvae receiving
the algae-enriched rotifer diet. The development of these larvae
terminated abruptly at the initiation of hypural element formation
and the larvae ceased to thrive.

116
Plaice were very similar to turbot; they did not exhibit any
initial starvation mortalities, which would be expected between days
12-16 post-hatch (Riley, 1966). Larvae fed the yeast-enriched
rotifer diet developed a coiled mid-gut (plaice do not develop a
swimbladder), and furthermore, in the 1986 experiment ontogeny
ceased on day 14 and the larvae ceased to thrive.
Feeding by fish larvae is mediated by vision and can be
modulated, amongst other factors, by prey characteristics such as
colour and contrast with the background (Blaxter, 1980). As an
example of this it has been shown that feeding intensity of Dover
sole larvae can be enhanced by staining the prey, Artemia, black
(Dendrinos et al., 1984). The colour of the prey in the present
experiments was noticeably altered from a pale yellow in yeast to
green after enrichment with Nannochioropsis or greenish brown with
Isochrysis. It is likely that these changes in colour altered the
contrast between the rotifer and the black background provided by
the rearing tanks. Such changes might have influenced feeding
intensities on different prey so leading to different growth rates.
Other factors which might have influenced feeding intensities are
olfactory and gustatory responses (Dempsey, 1978; Appelbaum et
al., 1983; Iwai, 1980). These factors, however, did not seem to
effect initial feeding success as ascertained in the turbot and plaice
experiments, or feeding intensities as indicated by absence of any
significant variation in gut content indexes during the first feeding
days of the various species.
The most likely explanation for the stunted growth and heavy
mortalities, experienced by the larvae feeding on yeast-enriched
rotifers only, is that the diet was deficient in a nutritional
component, namely the highly unsaturated fatty acids (HUFA) of the

117
n-3 series. Similar growth and mortality responses by marine fish
larvae to an identical diet have previously been shown for red sea
bream (Watanabe et al., 1983a), and black sea bream Mylio
macrocephalus (Lee et a!., 1981). The inadequacy of such rotifers
was related to the deficiency of n-3 fatty acids (18:3n-3, 20:5n-3
and 22:6n-3) and the condition could be rectified by soaking the
rotifers in emulsified marine lipids rich in HUFA before introducing
them into the larval tanks (Watanabe et a!., 1983). In the case
mentioned above cuttlefish (squid) liver oil was used; other oils such
as pollock or cod liver oils are, however, just as suitable.
The limited growth and development which did occur in the
present experiments, when larvae were fed the yeast-enriched
rotifer diet, can be explained on the basis of conservation and
differential utilization of the n-3 fatty acids that had been
incorporated into the larvae from the egg. This process of
selective retention of HUFA during embryogenesis and early larval
development has been demonstrated in herring (Tocher & Sargent,
1984; Tocher et al., 1985a,b) and may be of wide occurrence in
marine fish larvae. It will most certainly prevent the loss of these
essential body constituents during short food deprivation periods,
such as those related to the availability and distribution of
zooplankton in the sea. Furthermore, this capacity will enable the
larvae to subsist or even grow for an interim period, when faced
with a nutritional deprivation, in the anticipation of obtaining the
suitable diet. The duration that a larva will withstand a dietary
HUFA deprivation will most likely be related to its potential
specific growth rate at the pertaining environmental conditions in
the presence of a diet containing the full complement of fatty acids.
Accordingly, herring larvae which had slow specific growth rates on
118
the HUFA rich diets (3-5%/d), in the present experiments,grew
during the 23 days from first feeding at a steady 1.3-1.8%/d on the
HUFA-deficient diet; plaice with higher specific growth rates
(7.5%Id) grew at a slower O.46%/d on the deficient diets. Turbot
which exhibit very high specific growth rates (20-27%/d) grew at
higher rates on the deficient diet, 6.6%/cl, though only for a short
duration (8 days) following which not only did growth cease but their
weight declined.
The finding that all three larval species, when fed the yeast-
enriched rotifer diet, ceased to develop at commencement of fin
development is probably the result of the disruption of metabolic
processes in the larvae rather than absence of particular nutrients
required for fin formation in the diet.
Turbot larvae have been shown to have a dietary requirement
for both 20:5n-3 and 22:6n-3 HUFA (Scott & Middleton, 1979). Witt
et al. (1984) have further suggested a preferential requirement of
22:6n-3 over 20:5n-3 by these larvae. The growth results obtained
for turbot larvae in the present experiments are in agreement with
the above reports. Namely, larvae fed rotifers enriched with algae
grew better due to the input of HUFA into the diet. Furthermore,
the higher growth rates recorded when L galbana was used for
enriching the rotifers, was a direct result of their 22:6n-3 content,
compared with its absence from N. oculata which contains only
20:5n-3. Although the present results demonstrate unequivocally
preferential requirement for 22:6n-3 compared with 20:5n-3, they
also show that turbot can attain a high degree of development even
in the absence of the former fatty acid. Superficial observations
also did not show any long, term effects of the lack in 20:5n-3 during
the initial feeding stages. Once these larvae were transferred to an

119
Artemia nauplii diet at least 25% of the larvae, irrespective of the
initial treatment, metamorphosed.
According to the literature, and results presented here, there
do not seem to be any qualitative differences between dietary EFA
requirements of larvae, juveniles or adult turbot. Growth of adult
turbot is better on a diet containing lipids of marine origin rich in
n-3 HUFA, than on n-6 HUFA from corn oil or saturated fats from
coconut oil (Cowey et al., 1976). This requirement for n-3 HUFA is
only satisfied if both 20:5n-3 and 22:6n-3 are present in the diet
since these fish lack the enzymatic capacity for converting 18:3n-3
to C:20 and C:22 HUFA (Owen et aL, 1975; Cowey et al., 1976).
This capacity seems to be lacking in larvae as well, as shown by the
results of Scott & Middleton (1979) and Witt et al. (1984). The
quantitative requirement of 20:5n-3 plus 22:6n-3 is 0.8% of the dry
diet for adults (Gatesoupe et al., 1977a), while larvae seem to
require higher levels of these lipids, 1.3% of the dry diet (Le-
Milinaire et al., 1983).
Wild adult plaice have the high levels of phospholipid C:20 and
C:22 n-3 fatty acids characteristic of marine fish (Owen et al.,
1972). They have the capacity for selectively retaining these fatty
acids in their phospholipids if deprived of such a dietary input and
probably lack the ability for elongation and further desaturation of
dietary linolenic (18:3n-3) and linoleic (18:3n-6) acids. The picture
that emerges from the present experiments is that the larvae can
equally exploit dietary 20:5n-3 (present in N. oculata), or 22:6n-3
plus 18:3n-3 (as in I. galbana). In other words, larval plaice do not
have an apparent EFA requirement for 22:6n-3 throughout most of
their early life history. Furthermore, plaice larvae can be reared
through to metamorphosis on Artemia alone (e.g. Riley, 1966 and
120
the pigmentation experiments of this work), an organism lacking the
22:6n-3 fatty acid (Leger et al., 1984). This observation might
imply that plaice eggs contain sufficient 22:6n-3 for getting the
larvae through to metamorphosis, a most unlikely explanation in
view of the five-fold increase in larval weight in its first 30 days
alone. It might mean that larval phospholipids containing C:20 or
C:22 HUFA are physiologically compatible within the environmental
conditions experienced by the larvae in the experiments.
Alternatively, contrary to what has been suggested for the adults
(Owen et al., 1972) it might be that larvae can convert C:18 and
C:20 to C:22 HUFA at a rate which precludes any deficiency
symptoms from being manifested. This point can only be evaluated
by comparison of larval phospholipid fatty acids with that of their
diet and subsequent radio-labelling of the suspected C:22 HUFA
precursors. Ability for bio-conversion of C:18 and C:20 to C:22
HUFA has been suggested on the basis of fatty acid analysis for
Atlantic silverside (Schauer & Simpson, 1979). It has also been
demonstrated conclusively for a number of teleosts though its level
is usually lower in marine compared with freshwater forms (see
Kanazawa, 1985).
Composition of phospholipid fatty acids from cultured adult
herring shows very high levels of 22:6n-3 and 20:5n-3 (Owen &
Middleton, 1977). This suggests that the capacity for preferential
HUFA conservation observed in embryos and early (non-feeding)
larvae of this species (Tocher et al., 1985) is most likely extended
into adult life. Neutral lipid fatty acids, on the other hand, which
tend to reflect the fishes' diet have higher levels of 20:lri-3 and
22:ln-11 in wild compared with cultured fish (Owen & Middleton,
1977; Lambertsen & Braekkan, 1965; Gatten et a!., 1983). This
121
results from a transition to a wax ester-rich copepod diet that
larvae of these fishes undergo in the wild at around day 60 post-
hatch (Gatten et al., 1983). From hatching and up to day 60 the
dominant neutral lipid fatty acids of larvae reared in large
ecosystems are the n-3 C:20 and C:22 HUFA (Gatten at al., 1984).
This would suggest a similar HUFA profile in the phospholipid
fraction although this has not yet been evaluated. The present
experiments clearly show that C:20 or C:22n-3 HUFA are equally
suitable for growth of herring larvae during its first month post-
hatch. Owing to the relatively slow SGR of this species, however, if
an EFA requirement for 22:6n-3 does exist it might have been met
(in larvae reared in the presence of Nannochioropsis) by the fatty
acid carried through from the egg. On the other hand it is possible
that this species has a capacity for bio-converting the 20:5n-3 to
22:6n-3. If a dietary requirement for 22:6n-3 exists in herring it
will most likely manifest itself at the transition stages which in
clupeoids are noted for the proliferation of pyloric caeca, coiling of
the gut and thickening of body musculature (O'Connell, 1981;
Blaxter & Hunter, 1982). Supporting this hypothesis is the fact that
at their later growth stages larval herring will not grow on a diet of
brine shrimp alone (Blaxter, 1966) and that the mortalities are
preceded (at about day 30 post-hatch) by a decline in assimilation
efficiency (Klumpp & von Westerenhagen, 1986) which, as pointed
out earlier, is one of the symptoms of dietary fatty acid
deficiencies.
The dietary requirements of marine fish larvae, with the
exception of turbot, have so far not been assessed in such a way that
will distinguish between the effectiveness of 22:6n-3 or 20:5n-3 as
EFA. Growth and survival of red sea bream larvae was found to be

122
substantially improved when yeast mass-cultured rotifers were
enriched with Chlorella minutissima (Kitajima et aL, 1979), which
was due to the input of 20:5n-3 by the algae (Watanabe et al.,
1983b). Larval red sea bream were also compared for growth and
survival over a 27 d rearing trial on diets of rotifers containing
either 20:5n-3 (grown on Chiorella) or both 20:5n-3 and 22:6n-3
(grown on w-yeast), showing minor improvements in growth and
survival when both HUFAs were available (Kitajima et al., 1980).
Tentatively, one could therefore suggest that for red sea bream
either C:20 or C:22 HUFA are suitable EFA, which would put it in
the same category as the plaice. Other larvae for whom EFA
requirements were assessed using the rotifer plus enrichments
method are black sea bream Mylio macrocephalus and the ayu
Plecoglosus altivelis (Watanabe et al., 1983b). In the former both
C:20 and C:22 were found to be essential and no distinction was
drawn between them. While for the ayu, a species that spends its
early life history in fresh waters (similar to salmonids), 18:3n-3 was
found to be an essential fatty acid. However a further enhancement
of ayu growth was achieved through use of C:20 and C:22 HUFA in
the diets (Oka et al., 1980).
Evaluation of larval fatty acid requirements has also been
carried out using Artemia enriched with various marine lipids, algae
or yeasts grown in the presence of marine lipids (Watanabe et al.,
1982c; Dendrinos & Thorpe, 1987). Yet again these experiments
were not designed to differentiate between requirements for C:20 or
C:22 HUFA, both of which were found to be essential for growth of
larval flounder Paralichthys olivaceus, rock sea bream Oplegnathus
fasciatus, later stages of the red sea bream and Dover sole.

123
As a result of the facts presented here either through the
experimental work, or those found in the literature, one might
conclude that with respect fo dietary HUFA, fish larval
requirements resemble those of their adult counterparts. In
practical terms this implies that when formulating diets for larvae
its FA profile should qualitatively resemble that of the adult fish.
However, due to their higher growth rates, the ration of essential
fatty acids required by the larvae might possibly be higher than that
of the adults as suggested by the 1.3% compared with 0.8-1%
(HUFA as percent of dry diet) needed in larvae versus adult turbot
(Le-Milina ire et al., 1983; Castell et al., 1986). On the other hand
Watanabe et a!. (1983b) suggest that 0.3-0.4% HUFA (percent dry
weight of food particle) are the necessary levels of these fatty acids
for good growth and survival of juvenile marine fishes.
C. The effects of the diets on pigmentation in plaice
The occurrence of albinism in hatchery reared flatfishes is
well documented. It has often been observed in plaice and has been
associated with rearing conditions such as food quantity (Riley,
1966) or larval population density (Shelbourne, 1974). Apart from a
probable reduced viability for released albino juveniles in the wild,
the lack of pigmentation could expose the fish, at the ongrowing
stage, to the harmful effects of UV radiation. Abnormally
pigmented fish also have a reduced market value as in the case of
Japanese flounder Paralychthys olivaceus (Seikai, 1985a). Recent
publications tend to relate albinism in flatfishes to dietary factors
(Seikai, 1985a,b; Seikai et a!., 1987).
The present work on plaice showed a pronounced effect of the
diet on the occurrence of albinism. Rotifers which had been

124
enriched with Isochrysis consistently conferred higher ratios of
normal to abnormal pigmented juveniles compared with rotifers
enriched with Nannochioropsis. It should be noted, however, that
this ratio differed between the two experiments and that in both
years it was never an all-or-nothing response. In the present
experiments pigmentation of juvenile fish could not be associated
with any growth or development responses of larvae to the diets as
these parameters were unaffected by it. Dietary effects on
pigmentation have also been noted in the Japanese flounder. These
fish show a high percent of normal pigmentation when raised on
natural zooplankton (Seikai, 1985b), or if Artemia of the San-
Francisco rather than the Tien tsin or Brazil strains are employed
(Seikai et al., 1987). The dietary factor(s) linked with the
pigmentation are not yet known. Mineral, heavy metals, pesticides
as well as lipid and fatty acid composition of the Artemia strains
mentioned above, did not reveal any differences which could explain
pigment abnormalities (Seikai et al., 1987). On the other hand
chioroplast pigments, such as chlorophylls and carotenoids, are
typical to algae from diverse taxonomical classes (e.g. Norgard et
al., 1974). The present results suggest that one should look at these
differences for clues as to the dietary factor(s) required for normal
flatfish pigmentation.
In the present experiments, larvae reared on rotifers enriched
with either of the algae were grown on to metamorphosis on
Artemia. The differences in pigmentation could, therefore, only be
attributed to the rotifer feeding phase which extended from first-
feeding and up to transition, stages lc-3c inclusive (Ryland, 1966).
A similar finding has been reported for the Japanese flounder.
Seikai (1985a) has shown that the extent of the unpigmented area on

125
the fishes' ocular side, and the ratio of albino to normal fish in a
population, can vary with the feeding regime. Larvae fed on
rotifers (enriched with Chlorella and w-yeast) for progressively
longer intervals, before being transferred to a diet of Artemia
nauplii (Brazilian strain), showed fewer pigmentation abnormalities
at metamorphosis. The turning point seemed to occur when larvae
were about 12.9-13.2 mm (TL), which corresponds with the final
stages of notochord flexure and initiation of eye migration
(Fukuhara, 1986). It therefore seems most likely that pigmentation
in flatfishes is related to developmental events taking place during
the period immediately preceeding metamorphosis. If so, the
dietary component(s) necessary for normal pigmentation should be
present in the diet up to this time.
D. Relations of growth to survival
Fish larvae have to grow in order to survive (Jones, 1973;
Laurence, 1977), their growth rates are high and furthermore, seem
to be genetically predetermined (Houde & Scheckter, 1981). The
present herring and turbot nutritional experiments show, in addition,
that at increasing growth rates survival is directly and
proportionally increased (see Figs 14 for herring and 25 for turbot).
Furthermore, in the yeast-enriched rotifer treatments where growth
was curtailed, though not through any starvation effects, mortalities
were highest. Growth and survival rates of marine fish larvae can
also be enhanced through elevating the density of prey organisms in
their environment. This effect has often been reported, amongst
others, for winter flounder Pseudopleuronectes americanus
(Laurence, 1977), sea bream Archosargus rhomboidalis, lined sole
Archirus lineatus, bay anchovy Anchoa mitchilli (Houde, 1978;
126
Houde & Schekter, 1981) and herring (Werner & Blaxter, 1981;
Chekley, 1984).
The parameter chosen for presenting the mortality component
differed between the two species. Turbot, which were followed
throughout most of their early life history (up to metamorphosis),
were presented by the daily mortality rates (the coefficients of the
mortality regressions). On the other hand, mortality models could
not be fitted to the data on herring as on day 28 these larvae had
only completed about one third of their larval cycle. Any model
employed for the herring would have, therefore, been predictive
rather than factual. For this reason data for these larvae were
presented by their survival values at the termination of the
experiment.
In the turbot experiment the larvae feeding on rotifers
enriched with Isochrysis had lower mortality and final survival rates
compared with those larvae feeding on Nannochioropsis-enriched
rotifers. This is contrary to the expected higher survival at lower
mortality rates. Using the mortality regressions for turbot larvae it
was possible to back-calculate from day 8, the first day that
mortalities in the tanks could be counted, to the initial stocking
numbers on day 1. These calculated values were then compared
with the 1,250 larvae initially stocked in each tank. Doing so
revealed that 800, 500 and 700 larvae were unaccounted for in
Isochrysis tanks a, b and c respectively, and that from the
Nannochloropsis treatments tank b was missing 600 larvae.
Although a mistake in the stocking procedures could be used to
explain the disparity in these numbers, it is most unlikely to have
been centered mainly on the Isochrysis treatment tanks. Likewise,
suggestions that mortalities were taking place, but were unobserved,
127
would be subject to the same criticism. This differential mortality,
or unaccounted larvae, is disturbing as the lower larval densities in
the tanks where growth rates were fastest could in itself be invoked
to explain the differential growth rates, rather than the differences
between the diets. However, it is plausible that the reduction in
the numbers of survivors in these tanks was the result of
cannibalism and that cannibalism behaviour commences at
development stages 4b-4c, which distinguishes the stage
distributions (Fig. 23) of larvae in the fastest growing tanks from
those of larvae in tanks where growth rates were slower.
Cannibalism is, in fact, very common among turbot larvae at the
stages of metamorphosis, when one can easily observe aggressive
behavioural patterns such as fin biting. This problem is sometimes
alleviated in hatcheries by removing the larger larvae to separate
tanks.
One of the characteristic growth patterns of larvae reared in
hatcheries is the increase in the range of sizes as the larvae get
older. This has been termed the "size hierarchy" effect (see
Blaxter, 1975). In the present turbot feeding experiment the
distribution of developmental stages for 15 day old larvae (Fig. 23)
was from the initiation of hypural element formation (stage 2c) to
the initial stages of eye migration (stage 4c), the respective range
of lengths was 5.1 to 7.9 mm and that of dry weights was 95 to
1050 g. With such large size differences predation of faster on
slower growing individuals is a distinct possibility. Furthermore,
the skewed stage distributions, for all Isochrysis-enriched rotifer
treatments, suggests that there was a differential loss of larvae
from the lower developmental stages.

128
E. Ingestion rates and conversion efficiencies
A steady increase in the number of organisms, their size and
total weight in the guts of fish larvae is to be expected in relation
to the increasing prey capture efficiency (e.g. Hunter, 1980), as well
as increases in mouth size and gut volume related to larval size.
This trend has been observed in species such as striped knifejaw
Oplegnathus fasciatus (Fukusho, 1979), bream Archosargus
rhomboidalis (Stepiens, 1976), as well as in clupeoids (Blaxter &
Hunter, 1982). In the larval flatfishes winter flounder (Laurence,
1977), and turbot (Kuhiman et al., 1981 and this study) the relation
of gut contents to larval weight has been found to be linear, so that
the gut contents are a constant percent of body weight. The
proportionality of gut volume to fish weight is maintained in adult
flatfishes, such as dab Limanda limanda (Jobling et a!., 1977), and
turbot (Flowerdew and Grove, 1979). The use of rotifers in the
present experiments produced a proportionality factor for turbot
larvae of 13%. This is larger than the 4.7% evaluated for the same
species by Kuhiman et al. (1981), who fed their larvae on copepods.
Such differences could have arisen from the different sampling
methodologies or the diverse food particles employed. In this
respect, the soft, spherical rotifers used in the present study might
well pack better than the irregular shaped, hard copepods used by
the latter authors. The proportionality of gut volume to larval
weight suggests that, throughout the larval period, the handling
capacity of the digestive system for a given species is constant per
body mass. Therefore, unless a larvae will increase its digestive
enzyme levels or complement, its assimilation efficiency should be
expected to remain constant.

129
The precise relation of gut contents to weight of herring
larvae has, up to the present study, not been evaluated. However,
herring larvae grown in large ecosystems, and therefore feeding on a
mixture of wild zooplankton, do show an increase in both the size-
range and quantity of organisms in their guts with age (Gamble et
al., 1981). It was therefore most intriguing to observe that the
logical linear relationship did not hold in the present herring feeding
trials and that the gut contents relative to body dry weight dropped
considerably from 8% to 2.5% between days 12 and 18 post-hatch.
This, however, did not reflect a loss of appetite since no reduction
in the daily intake of food was recorded during this period. The
decrease in the gut contents would only have occurred if the
residence time of the food relative to the rate of ingestion was
decreasing.
In adult fish the passage of food down the alimentary canal has
been studied in relation to the rate at which nutrients are
transferred from the stomach to the intestine. It transpires that
the stomach contracts at a regular frequency and that the volume
secreted at each contraction through the pylorus (the stroke volume)
is probably regulated via receptors in the upper intestine. These
receptors are sensitive to certain nutrients (amino acids) as well as
acidity levels (Jobling, 1986). According to Govoni et al. (1986)
passage of food through the larval alimentary canal is mediated, in
the lack of the longitudinally orientated smooth muscle of the
muscularis, via peristaltic contractions of a single layer of smooth
muscle. In some species this is also assisted by ciliated cells (Iwai
& Rosenthal, 1981; Watanabe, 1984b). However physiological
regulation of peristalsis and evacuation rates has not yet been
elucidated for larvae.
130
Gut evacuation time, for herring larvae continuously feeding
on Artemia naupili, has been estimated at 4-10 h (Rosenthal &
Hempel, 1970) and at 3-7 h, or over 7 h (Werner & Blaxter, 1980,
1981). Herring larvae feeding on copepods have slower evacuation
rates of 0.7-3 h (Pedersen, 1984). Apart from being related to
ambient temperatures (Blaxter, 1965; Laurence, 1971) and prey
species (Fossum, 1983) evacuation rates in herring larvae are
strongly influenced by prey density. The increased ingestion rates
at high prey densities can physically displace food in the gut, in
particular when a large food particle such as Artemia is employed
(Werner & Blaxter, 1981). Increase in ingestion rate itself has also
been shown to result directly in higher evacuation rate (Pedersen,
1984). This could have an overriding effect on gut evacuation rate
when prey organisms do not fill the gut to its maximum capacity.
Indeed, unlike the larger Artemia, the rotifers used in the present
experiments were never observed to fill the gut completely. Thus,
it is quite possible that the decrease in gut contents, observed in the
present herring experiments, was a direct result of the increased
evacuation rate as the ingestion rate increased with age.
Flatfish larvae differ from the clupeoids in being able to
complete all or most of their early life history on a small food
particle, such as rotifers (Howell, 1973, and this study). In other
species food size has often been implicated as one of the factors
limiting the growth of fish larvae. In E. mordax, growth stops at
about 6 mm when feeding on the dinoflagellate Gymnodinium
splendens, but continues to 20 mm when feeding on Brachionus
(Hunter, 1976a, 1980). This has been associated with the lower
calorific content of the algae 5 x 10 5ca1 compared with
17.9 x 10 5ca1 for the rotifer. Apart from the relation of calories

131
gained per bite, the degree to which a food particle is digested will
relate to the surface/volume ratio available for enzyme activity and
its residence time in the gut. If, as the present results for herring
suggest, small prey are rapidly defaecated, then some increase in
their size might improve their residence time and consequently, the
efficiency with which they are assimilated. Furthermore, the
inflection points in curves of gut contents on larval size, such as
that found for herring larvae in the present experiments, could be a
way for deciding when to increase the particle size offered to the
larvae.
Weight-specific ration, expressed as percent body weight
consumed per day, was larger for turbot (80%Id) than the herring
(30%/d). This is to be expected when one considers that the former
species was raised at a higher temperature and exhibited a much
faster growth rate. Houde & Schekter (1981) found that at equal
temperatures and prey densities, and for a given larval dry weight,
eel like larvae with a straight gut (Anchoa mitchilli) will consume
more food compared to larvae with a coiled gut (Achirus lineatus),
namely 140 compared with 90%/d respectively. The authors
associated this with the shorter retention time of food in larvae
with straight guts, necessitating higher feeding rates.
Daily ration estimates for Atlantic herring have mostly been
obtained for larvae feeding on Artemia. Checkley (1984) showed
that herring larvae consumed prey in relation to its availability,
with weight-specific rations ranging from 1-11% of body nitrogen/d.
The highest ration was found for larvae with a specific growth rate
of 4%/d. On a dry-weight basis this equals a daily ration of about
17%/d assuming that nitrogen in terms of dry weight equals 12.2%
for the larvae (same author) and 8.1% for Artemia (Leger et al.,

132
1986). Klumpp & von Westernhagen (1986) estimated the weight-
specific ration during the first month of larval life to be 16-28%/d,
with an average value of 21%/d specific growth rate between days
8-33 was 4.5%/d. These values correspond well with the present
results even though the food used here was Brachionus. Herring
larvae grown under natural conditions have been estimated to
consume prey at a rate of 16%/d at a specific growth rate of
7.7%/d, with larvae feeding on wild zooplankton at a concentration
of 12 items/I (Gamble et at., 1981).
As yet there are no estimates of daily ration in turbot.
Weight-specific ration estimates for other flatfishes are 90%/d for
lined sole (Houde & Schekter, 1981), 30-300%/d for winter flounder
(Laurence, 1977), 48-160%/d for summer flounder, Paralichthys
dentatus (Buckley & Dillmann, 1982) and 15-39%/d for plaice
(Klumpp & von Westernhagen, 1986).
Gross growth efficiencies, Ki, for herring in the present study
ranged between 20-40% and for turbot, ranged between 20-60%.
Estimated K1 values for marine fish larvae, other than the above
two species, range from 5 to 40% (Houde & Schekter, 1983) or
40-80% (Klumpp & von Westernhagen, 1986). The latter authors
estimated Ki values for herring larvae in the range 20-27%.
Checkley (1984) estimated that the K1 for herring larvae could
attain maximal values of 40-50%.
K1, being the ratio in percentage of the ingested food to
growth, is functionally related to ingestion. The value of Ki is 0
when ingestion only meets the demands of basic metabolism, is
maximal at some intermediate ingestion value (the optimal ration),
and declines at high ingestion rates (Brett & Grove, 1979).

133
In the present study, fluctuations in K1 values could not be
related to any particular developmental events noted in the larvae.
However, they did tend to fluctuate in accordance with the daily
weight-specific ration estimates. Reduction of Ki with increasing
rations in marine fish larvae have also been noted by Stepiens
(1976); Laurence (1977); Houde & Schekter (1981); Checkley
(1984); Boehlert & Yoklavich (1984) and Klumpp & von
Westernhagen (1986). This is associated with the lowering of
assimilation efficiencies at increased ingestion rates, due to the
rapid passage of food particles through the gut (Ryer & Boehiert,
1983; Boehlert & Yoklavich, 1984; Covoni et al., 1982). In herring
larvae offered Artemia at high densities it has been noted that
digestion of the food is incomplete (Werner & Blaxter, 1981). In the
Pacific herring, carbon assimilation decreases at the increasing
ingestion rates that result from high rotifer densities (Boehlert &
Yoklavich, 1984). Lowering of the gross growth efficiency will also
take place when food is consumed in excess of the intake relating to
the maximal growth rate a species is capable of. Furthermore,
rates of ammonia excretion increase asymptotically with the
amount of food ingested (Klumpp & von Westernhagen, 1986). This
implies that the high metabolic expenditure for digestion and
assimilation at high food intakes will detract from the gross growth
efficiency.
Estimates of food consumed daily or hourly by fish larvae
reveal an exponential increase as a function of larval age (Stepiens,
1976; Buckley & Dillman, 1982), or length (Okauchi et at., 1980;
Barahona-Fernandez & Conan, 1981). Since weight of larvae is an
exponential function of time or an allometric function of length, the
ingestion relations can be linearised if weights are employed as

134
estimates of both larval age and its daily ration (Barahona-
Fernandez & Conan, 1981; Buckley & Dillman, 1982). Table 31 and
Fig. 32a,b show the relation of daily ingestion to body weight in a
number of fish larvae from diverse taxonomical orders such as
Clupeiformes, Perciformes and Pleuronectiformes. It also includes
- data for herring and turbot obtained in this study. Excluded from
the Table are those studies in which daily ingestion was calculated
on the basis of gut contents multiplied by evacuation rates and hours
of feeding (Hunter & Kimbrell, 1980; Laurence, 1977) or hourly
feeding rates multiplied by feeding duration (Werner & Blaxter,
1981). This is because: a, larvae do not necessarily feed at a
constant rate (Hofer & Burkle, 1986), b, gut evacuation rates are
related to feeding rates (Werner & Blaxter, 1981) and c, food levels
both in nature and in a larval rearing tank are not necessarily
constant.
The weight-specific ingestion obtained from this model is the
coefficient of proportionality relating weights of ingested prey to
larvae and is expressed in units of d4 . It differs from weight-
specific ration (e.g. Houde & Schekter, 1981) which is the ratio, in
percentage, of ingestion to body weight on a single day. It also
differs from the estimate used by Checkley (1984) which was the
average nitrogen consumption (j.ig) by larvae over a period of time,
t, divided by the average bodily nitrogen content of larvae during
the same period.
The regression constant (b) becomes a proportionally smaller
fraction of the daily weight-specific ration with increasing larval
age. In other words, the tendency to consume food in excess of the
weight-specific ingestion decreases with increasing age. This is
probably the basis of the progressive reduction in the weight-

135
specific ration often observed as larvae grow older (Klumpp & von
Westernhagen, 1986; Stepiens, 1976; Houde & Schekter, 1981). The
reduced rations in older larvae have often led to the suggestion that
due to age related improvements in the digestive systems, the
efficiency of food utilisation increases allowing for reductions in
weight-specific rations. Indeed, blenny larvae, which are more
developed at hatching compared with most other planktonic fish
larvae, having a fully functional digestive system, (Klumpp & von
Westernhagen, 1986) do not exhibit any reduction of their weight-
specific ingestion throughout their larval period.
Larval flatfish have often been reported to exhibit improved
gross growth efficiencies near metamorphosis (Klumpp & von
Westernhagen, 1986; Buckley & Dillman, 1982; Cetta & Capuzzo,
1982; Laurence, 1977), perhaps resulting from an improvement in
both the efficiency of prey capture and of the developing digestive
system. In turbot, grown at 20°C, the stomach and pyloric caeca
evolve from about day 15 post-hatch when larval TL is 6.9-7.7 mm,
an event that also delineates the onset of peptic digestion (Cousin et
al., 1985). This event relates to morphological stages 4a-4c
(Al-Maghazachi and Gibson, 1986) which are characterised by the
flexure of the notochord. In Japanese flounder the stomach is
formed at day 29 post-hatch and peptic digestion is apparent from
day 30 (O'Connell, 1981 after Yasunaga, 1972). This event also
relates to the period characterised by notochord flexure, the
morphological stages E-F of Fukuhara (1986). Peptic digestion is
probably more efficient than the assimilation via pinocytosis of
macromolecules in the hind-gut prevalent in the larval forms
(Govoni et al., 1986). One can therefore assume that the
development of the gastric glands and peptic digestion is the

136
probable cause for the improved assimilation noted in larval
flatfishes prior to transformation. In the present study turbot did
not display an improvement in gross growth efficiency since the
stomach was probably not yet functional throughout the period in
which these larvae were tested.
It is well established that in fish, after metamorphosis, the
growth efficiency decreases with age due to rising metabolic costs
associated with weight (Gerking, 1971; Brett, 1979). In larval
fishes, however, there are conflicting opinions regarding the
possibility of an enhancement or a reduction in assimilation
efficiencies associated with larval development (Govoni at al.,
1986). Resolving this conflict might be possible if the definition of
the larval stage was to be made on a physiological basis. Thus
marine fish could be considered as larvae up to the event of gastric
gland formation and initiation of peptic digestion. Following this
event the fish would enter their juvenile stage. This type of
definition has been employed by Cousin et al. (1985) and O'Connell
(1981). Accordingly the larvae of the flatfishes previously
mentioned will exhibit an improved assimilation only during the
juvenile stage. However, their larval stage would be characterised
by a constant assimilation efficiency which is in accordance with
what is known for other larvae such as spot, Lelostomus xanthurus
(Covoni at al., 1982) and the fresh water fish Abramis abrama
(Sorokin & Panov, 1966). As pointed out by Covoni et al. (1986)
there is so far no histological or biochemical evidence supporting
the suggestions of increased assimilation efficiencies within the
larval period.
Examination of the ingestion data, in the linearised form in
which it has been presented in Table 31, suggests that some other

0,a)4-'
-C4-'
0
Ci44
Ci0)0.Cl)
0C
.0S.-4-,-C
a)
>.
.0
Ca>C..Co
5-
-Da)ECl,CCCi.000
.4-
4-'-C
a)
>'C-.
C0
.4-'Cl,a)0'
. a;
a)
.9a).'
I-.
'4-0o ,-iCl)XC
o 4-
Ca-....
-4
-4'—
II
.00CD
I-----.
-c-S
C-.
S.-C,
Ca
C.E U
a) a
I-
(3U-,
C0
4-'Cl,a)
C
>'a)
0
Cl)a)
Cia)C-
U,
C',I-.0
Cl)l
C
a)C-CO
(01
ul
cOlCl,'0)1CD
0,a)
Cia)C0I.-
a)
0-.
137
S5-4a)0\-4
C..a)4-'-a)
-CCi
(/)
a)-c
0I
C'4
a) a) a) '5--4 0' 0'
>'. a) - -4 - > a)0'
•_a) c' c',- e .- '°
I.-Cl) .' 0' 0) a) 0) 0, • 0'
r0(a O N -
r- >.. E °"
-'h . E 'E 4-''4 n > a) 0) 4- 0
'4- — 4-' 4-' — 4-' 4- E C
o--cl' o-u,_ 0 Ci a). oa) Ea'- E - -
C - - 0)4-,
' I Li-. 0 U,
0 0' 0' .i N 'J 0' - LA -
- " S .-r- r'dda' N LA -4 '.0 -4 - C'J ('.1 C'J C"l C•.J C'1 r\
0'. '.0 0' a) N'\ 0' 0' LA .N 0' 0'. a) 0 a) 0' 0' 0' 0'. 0' N - j' _id 00-4 C C CCC
N ('-4 .-1 N LA LI
0' LA N
d .- Rc'.d0'. 0 F i N . N e'4 N (N N
**\ '.0-40' CD 0' N N 0'. LA N
.-4 .-1 -1 .-1 0 '.0 LA '.0 N LA -- LA
0 0 0 0 0 0 000
re r4',c'-1 e'i (N'-.4 I I
I I I 0'. 4 N Y\ '.00'. '.0
0'. N 0' 0' N (N r-1 (N (N (N (N (N
CalC .—I C C
El 0 0
a)I 4-'
-C.0 C .-'i - -
'-I C CCa Co
-aCc c + a
ocac Ca 0 0C-. C-. C-. L C-. 0 0
NEIEI E 0) a) a) a) 0) N N
4- 4- '4- 4- 4-
.-00)Ia)l D— 4I4-I
0-- C-.ILI LI 0 0 0 0 0
<I<I <I
0,
a,0) rJ D
E .E 0)
x • .0
J j!1
.2
C C1 oi '-' 0
C 04 0)1 C -
0) 0 CO ci
— L Ci -LID 01< <
-cCi
4-,
ECD0
CiC
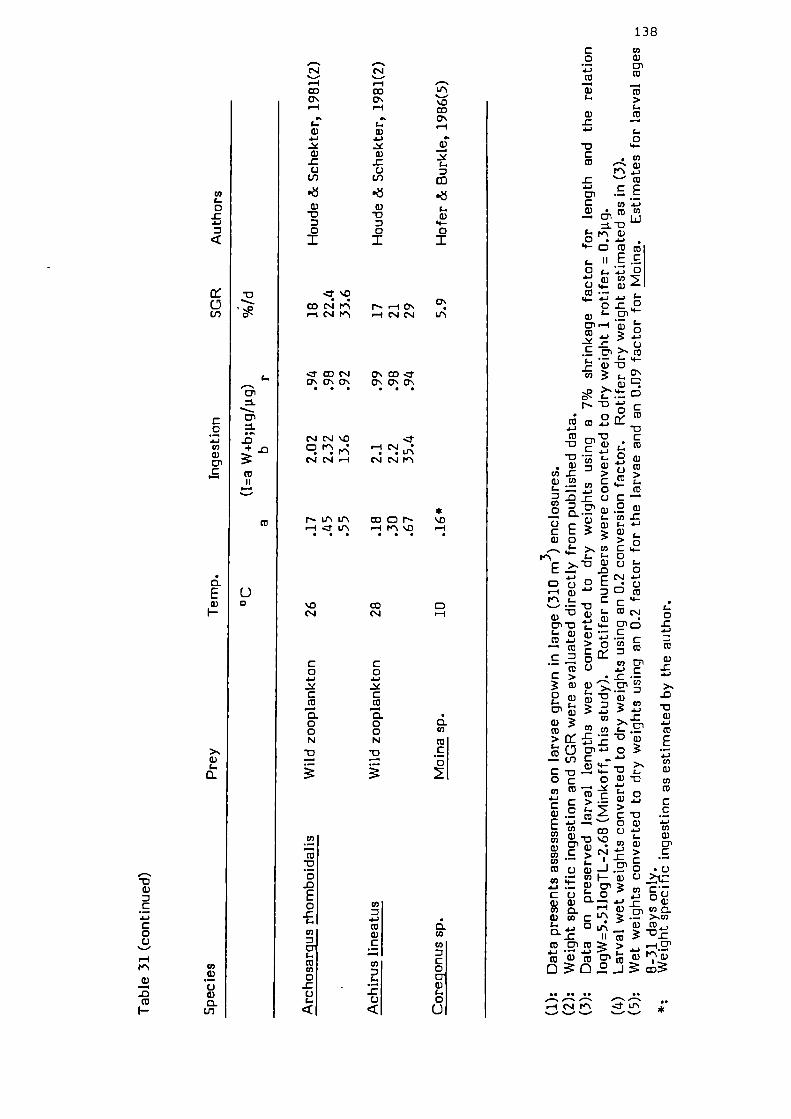
CU)
01
01C0
4-3U)
a)01C
0Ea)I-
Ua
a)
C4-,C0C)
-I
0)
CDI-
a)C)0)0
U,
I-a)4-)-C)
-CC-I
U,
a)
0I
0'
C-.
a)-'-a
-
a)-cC)
U,
a)-D
0I
II
'-I
a)
.C-.
C-
a).4-
0I
C0
4-,-'CCo
000N
0U)
CDC
0
U)
.13CoC)C
U)
C-.
-cC)
0U)
CI
a)I-0U
U)
0-c4-)
Co
>'a)L
ci
r--o.-fC4F C'JC-1
csJc-o 000
NiC'4\
C••1c'J.-1 1NJN
*NL1 N \D'i.qL, -r
Dc'J c'. -
C0
-I-,-CCo
0.00N
-D
U)
Co-D0
-cE0-CC-U)I
CoU)0
-cC)C.-
138
C U)o a)
01
CU
a) CDC- >
C.0) CD
—4-)
0-D '4-CCD
_C •-CD
C
- F C)o
'i- D CU CT3
i E .E
o 0
4-' a) (I,
C) '4- 0)C-
0 .0 0
a)01.-f a) C-
0
C C)
£.--0
Cl) C..
cD
r- .0
Co Co -•4-' -0Co -0 C0 ga) CD
CUU).c >>a) .! C ,
CD- - C) C —
a.91-9 a)—Or- a)C.--'-'Ca)0
-S > U) C '._
r C'.JD o 0 c •-f 0) -'fl' CDF._ C.. C '4-'---0
0010 4-'u-0 _C
L -C 4-'
Cn0lCCC) -
C> .C.--'--'
0)C)01 >.
.0
-D
Cl) >_ C.
CU CCTCOL.E CC
>E.E° a)
.-.0 .j.a
'4- >..'I'
0)
O 00 U)U) Co C- 0 CO
C
0).90 .
E--'°4-3
U)CJ) 04-) Cl)
> c': .E
CCC)_J91
.0
U) I- a) C)
CO.0 4-'O0)0) -'-'.0 a)
c. C)01U)0Q)U).->sCl)
0_ a) CC4-,
.0Co 01Co > .-i0'
D1C)Q)
oO2jo
-S
-fC'1N\ .-Lr1.— '__ 5___ - %__

Fig. 31. Relations for daily ingestion estimates of fish larvae
in dry weight food consumed/larval dry weight. The
area delimited by the broken line of Fig. 31a is
presented in Fig. 31b. The figure relates to the
regressions calculated in Table 31: 1, herring
(Klumpp & von-Westernhagen, 1986); 2, herring
(Minkoff, this study); 3, plaice (Howell, 1973);
4, plaice (Klumpp & von-Westernhagen, 1986);
5, blenny CKlumpp & vor?-Westernhagen, .2926);
6, turbot (Minkoff, this study); 7, Japanese striped
knifejaw (Fukusho, 1979); 8, porgy (Okauchi et al.,
1980); 9, 10, 11 sea bream (Stepiens, 1976); 12, 13
sea bream (Houde & Schekter, 1981); 14, 15, lined sole
(Houde & Schekter, 1981); 16, bay anchovy (Houde &
Schekter, 1981).

--.200
04-Ina)
100
15
1
8
139
30
600
100 200
300
Larval dry weight (jig)
----10
4-
200
4
200 400 600 800 1000
Larval dry weight (jig)

140
factors could be involved in the reduced weight-specific rations
commonly observed as larvae get older. As noted earlier the
regression constant (b) assumes a higher proportion of the weight
specific ingestion in younger compared with older larvae. One
might regard the regression constant (b) as a product of the
experimental methodology. Accordingly the magnitude of (b) could
be indicative of: food supplied in excess of an optimal requirement,
and in particular to the yonger larvae; some adaptive responses of
the growing larvae to their artificial surroundings which is expressed
in the lowering of the required daily ration, or some general
estimate relating to the deviation of the culture conditions from
those experienced by larvae in the wild. With regard to the supply
of excess food, the results of Houde & Schekter (1981) show that at
reduced prey concentration the magnitude of (b) diminishes and the
decline in weight-specific ingestion exhibited in older larvae is less
apparent. However, it should be noted that lowering prey
availability also reduced the specific growth rate of these larvae.
In the present experiments the weight-specific ingestion of
herring was 13%Id and the average weight-specific ration was
30%/d (Table 23). The weight-specific ingestion compares better to
the daily ration of 16%Id estimated for ecosystem populations by
Gamble et al. (19B1). This might suggest that the further 17% of
body weight consumed daily by larvae in the present study,
seemingly a "superfluous feeding", was a necessity imposed by the
confinements of the rearing containers. Such confinement probably
results in higher intraspecific competition for food, and probably
more avoidance manoeuvres relating to encounters with the walls
and other larvae. Interactions of this kind would tend to increase
the metabolic demands of the larvae, so leading to increased feeding

141
levels. Optimization of the rearing, through evaluation of
parameters such as tank volumes, might therefore reduce the
weight-specific ration required by larvae at a given specific growth
rate or conversely, increase the specific growth rate for a given
weight-specific ration. Theilacker (198Db) showed increased growth
rates and nutritional condition of jack mackerel Trachurus
symmetricus reared in 100 1 compared with 10 1 tanks. However,
although it is generally recognised that rearing larvae is preferable
in volumes of io 2 _io3 1 the field remains unexplored.
Weight-specific ingestion is lower for species living in
temperate (8-12°C) than sub-tropical (20-25°C) waters. Table 31
also lists the SGR values calculated for these larvae from the
presented data, showing that larvae from sub tropical waters also
exhibit higher specific growth rates. The relation of weight-specific
ingestion to SGR in units of %Id, for data where food was not a
limiting factor, is plotted in Fig. 32. The figure also includes data
for herring from Gamble et al., 1981 (I=16%/d, SGR=7.7%),
Checkley, 1981 (I=11%/d, SGR=4%/d) and data for a fresh water
coregonid from Hofer & Burkie, 1986 (I=16%/d, SGR=5.9%/d). The
regression fitted to these points is described by the equation:
I=1.91xSGR+3.46; (r=0.82; p < 0.001)
I and SGR in units of %Id.
From this it can be assumed that marine fish larvae have a minimal
daily food requirement which is roughly twice their daily weight
increment.
In the equation presented here the SGR was chosen as the
independent variable. The value of the specific growth rate,
whenever food was not limiting, was assumed to be characteristic
for any one species within its physiological range. This is not to say

Fig. 32.
The relation of weight specific ingestion to the
specific growth rate, both in percent/d for a number
of fish larvae. The figure relates to the data
presented in Table 31. 1, herring (Klumpp & von-
Westernhagen, 1986); 2, herring (Minkoff, this study);
3, plaice (Howell, 1973); 4, plaice (Klumpp & von-
Westernhagen, 1986); 5, blenny (Klumpp & von-
Westernhagen, 1986); 6, turbot (Minkoff, this study);
7, Japanese striped knifejaw (Fukusho, 1979); 8, porgy
(Okauchi et al., 1980); 9, 10, 11 sea bream (Stepiens,
1976); 12, 13 sea bream (Houde & Schekter, 1981); 14,
15 lined sole (Houde & Schekter, 1981); 16, bay
anchovy (Houde & Schekter, 1981); 17, herring
(Checkley, 1984); 18, herring (Gamble et al., 1981);
19, white fish (Hofer & Burkle, 1986).

80
60
4O0
C)
20
10 20 30
SOR (%Id)
142

143
that 5CR will not vary with fluctuations in temperature as shown by
Stepiens (1976), or ration as shown by Houde & Schekter (1981), and
Checkley (1984). However, it is most unlikely that a subtropical
species will function in the environment of a temperate species and
vice versa.
Checkley (1984) also noted the relation of SGR to weight-
specific ingestion and showed that in herring larvae the SCR
increased linearly with increasing ingestion. In this case ingestion
was used as the independent variable. Furthermore by normalizing
data available from the literature to 8°C using a 010 value of 2.3
(on the assumption that 010 is constant throughout) he established a
universal exponential relation:
g=0.13+0.OB8logi (r=0.85; p < 0.001)
g and i in units of
Thus, although he does not claim that all larvae can exist and
function at any temperature his equation implies that rates of
growth and ingestion will vary proportionally with temperature.
This is what the linear model developed in the present study shows.
In an attempt to fit the data in Fig. 31 to an exponential model,
similar to the one used by Checkley, it was found that the residual
sum of square was larger than that obtained for the linear model
presented here. The exponential model was therefore rejected.
So far it has generally been assumed that one should approach
with caution direct comparisons of ingestion parameters obtained by
independent workers on different larval species. This is due to the
fact that measurements related to feeding rates of larvae could be
affected by the number of fish and the type and concentration of
prey in the experimental container as well as by variables such as
illumination, the volume of the holding facilities and the duration of

144
feeding (Theilacker & Dorsey, 1980). However relations such as the
one developed here, or that of Checkley (1984) overcome these
difficulties and suggest that the relationship between ingestion and
specific growth rate is similar in a wide range of species.
The linear relation shown above could be used to evaluate
daily rations and optimal feeding strategies for larvae reared in
hatcheries. This is of particular importance when inert diets are
used due to the fact that zooplankton are mostly fed on an
individuals/volume basis but inert diets have to be introduced on a
weight-specific basis.
CONCLUSIONS
The present study is the first of its kind in which a few diet
combinations derived from a single food organism were tested on a
spectrum of marine fish larvae. The two main contributions to be
drawn from this study are:
a. The n-3 highly unsaturated fatty acid requirements of
larvae are similar to those of the adult forms. Incorporating both
20:5n-3 and 22:6n-3 into the diet will guarantee its suitability for
most larvae, though in some cases, such as herring and plaice,
22:6n-3 is not a necessity.
b. The quantity of food a larva consumes daily
approximates twice its daily weight increment on a dry weight basis.
This figure can help construct feeding schedules for larvae when
employing inert diets, thus avoiding excess feeding that could lead
to tank pollution.
Concerning the algal species employed there is a strong
indication that pigmentation of juvenile flatfish will benefit from

145
the incorporation of I. galbana into their diet prior to
metamorphosis. The nutrients in the algae responsible for this
phenomenon might possibly be certain carotenoids. Otherwise, N.
oculata proved to be an excellent alga for maricultural purposes in
having rapid growth rates, achieving high densities and by being able
to withstand culture conditions which are not aseptic.
The use of rotifers as nutritional probes seem to be limited to
investigating either daily ration, or fatty acid requirements of their
consumers. This technique does not enable us to take the quantum
leap to the formation of the elusive inert diet required for hatchery
purposes. Nevertheless, the results presented here suggest that the
composition of the diet should ideally resemble that of the rotifer
with respect to proximate as well as amino acid composition.
Future research should centre on the types and sources of proteins
that the larval digestive system, prior to the evolution of the
stomach and gastric glands, is able to digest.
146
REFERENCES
Adron, J.W., Blair, A. and Cowey, C.B., 1974. Rearing of plaice
(Pleuronectes platessa) larvae to metamorphosis using an
artificial diet. Fishery Bulletin, Vol. 72: 2, 353-357.
Al-Maghazachi, S. and Gibson, S., 1984. The developmental stages
of larval turbot, Scophthalmus maximus (L.). 3. exp. mar.
Biol. Ecol., Vol. 82: 35-51.
Antia, N.J., Bisalputra, T., Cheng, J.Y. and Katley, J.P., 1975.
Pigment and cytological evidence for reclassification of
Nannochloris oculata and Monoallantus salina in the
Eustigmatophyceae. 3. Phycol., Vol. 11: 339-343.
Appelbaum, S., 1985. Rearing of the Dover sole, Solea solea (L.)
through its larval stages using artificial diets. Aquaculture,
Vol. 49: 209-221.
Appelbaum, S., Adron, J.W., George, S.C., Mackie, A.M. and
Pine, B.J.S., 1983. On the development of the olfactory and
gustatory organs of the Dover sole Solea solea during
metamorphosis. 3. mar. biol. Ass. U.K., Vol. 63: 97-108.
Barahona-Fernandes, M.H. and Conan, C., 1981. Daily food intake
of reared larvae of the European seabass (Dicentrarchus
labrax L.) statistical analysis and modelling. Rapp. P.-v.
Reun. Cons. mt. Explor. Mer, Vol. 178: 41-44.
Barnabe, C., 1976. Elevage larvaire du Loup (Dicentrarchus
labrax (L.); Pisces, Serranidae) a laide d'aliment sec compose.
Aquaculture, Vol. 9: 237-252.

147
Beck, A.D. and Bengston, D.A., 1979. Evaluating effects of live and
artificial diets on survival and growth of the marine atherinid
fish, Atlantic silverside, Menidia menidia. pp. 479-490.
In: Finfish Nutrition and Fishfeed Technology Vol. I
(Halver, i.E. and Tiews, D., eds). Proc. World Symposium,
Hamburg 20-23 June 1978.
Bell, M.V., Henderson, R.J., Pine, B.J.S. and Sargent, 3.R., 1985.
Effects of dietary polyunsaturated fatty acid deficiencies on
mortality growth and gill structure in the turbot Scophthalmus
maximus. 3. Fish Biol., Vol. 26(2): p. 181.
Ben-Amotz, A., Fishier, R. and Schnelier, A., 1987. Chemical
composition of dietary species of marine unicellular algae and
rotifers with emphasis on fatty acids. Mar. Biol., Vol. 95:
31-36.
Blaxter, J.H.S., 1965. The feeding of herring larvae and their
ecology in relation to feeding. California Cooperative
Oceanic Fisheries Investigation, Vol. 10: 79-88.
Blaxter, J.H.S., 1966. The effect of light intensity on the feeding
ecology of herring. In: Light as an ecological factor
(Bainbnidge, R., Evans, G.C. and Rachman, 0., eds).
pp. 393-409. Blackwell, Oxford.
Blaxter, J.H.S., 1971. Feeding and condition of Clyde herring
larvae. Rapp.P.-v. Reun. Cons. perm. mt . Explor. Mer, Vol.
160: 128-136.
Blaxter, J.H.S., 1975. Reared and wild fish - how do they compare?
10th Euro. Sym. Mar. Biol., Vol. 1: 11-26.

148
Blaxter, 3.H.S., 1980. Vision and feeding of fishes. In: Fish
behavior and its use in the capture and culture of fishes
(Bardach, 3.E., Magnuson, 3.3., May, R.C. and Reinhart, J.M.,
eds). pp. 32-56. ICLARM Conference Proceedings 5.
Philippines.
Blaxter, J.H.S. and Hempel, C., 1963. The influence of egg size on
herring larvae. 3. Cons., Cons. mt. Explor. Mer, Vol. 28:
211-240.
Blaxter, 3.H.S. and Hunter, 3.R., 1982. The biology of clupeoid
fishes. Adv. Mar. Biol., Vol. 20: 1-223.
Boehiert, C.W. and Yoklavich, M.M., 1984. Carbon assimilation as
a function of Ingestion rate in larval Pacific herring Clupea
harengus pllasi Valenciennes. 3. exp. mar. Biol. Ecol.,
Vol. 79: 251-262.
Brett, 3.R., 1979. Environmental factors and growth. pp. 599-667.
In: Fish Physiology Vol. 8 (Hoar, W.S., Randal, D.3. and
Brett, 3.R. eds). Academic Press, New York.
Brett, 3.R. and Groves, T.D.D., 1979. Physiological energetics. pp.
279-352. In: Fish Physiology, Vol. 8, (Hoar, W.S., Randall,
D.J. and Brett, 3.R., eds). Academic Press, New York.
Bromley, P.3. and Howell, B.R., 1983. Factors influencing the
survival and growth of turbot larvae Scophthalmus maximus L.
during the change from live to compound feeds. Aquaculture,
Vol. 31: 31-40.
Bromley, P.3. and Sykes, P.A., 1985. Weaning diets for turbot
(Scophthalmus maximus L.), sole (Solea solea L.) and eel
(Gadus morhua L.). pp. 191-211. In: Nutrition and feeding in
fish (Cowey, G.B.,, Mackie, A.M. and Bell, Y.C., eds).
Academic Press Inc. (London) Ltd.

149
Buckley, L.J. and Dillmann, D.W., 1982. Nitrogen utilization of
larval summer flounder, Parallichthys dentatus (Linnaeus).
3. exp. mar. Biol. Ecol., Vol. 59: 243-256.
Caste!!, J.D., 1979. Review of lipid requirement of finfish.
pp. 59-85. In: Finfish Nutrition and Fishfeed Technology
Vol. I. (Halver, J.E. and Tiews, K., eds). Proc. World
Symposium Hamburg 20-23 June 1978.
Caste!!, J.D., Conklin, D.E., Craigie, J.S., Lall, S.P. and Norman-
Boudreau, K., 1985. Aquaculture nutrition. pp. 251-308. In:
Realisms in Aquaculture: Achievements, constraints,
perspectives (Bilio, M., Rosenthal, H. and Sidermann, C.S.,
eds). European Aquaculture Society, Bredene, Belgium.
Cetta, C.M. and Cupuzzo, J.M., 1982. Physiological and
biochemical aspects of embryonic and larval development of
the winter flounder Pseudopleuronectes americanus. Mar.
Biol., Vol. 71: 327-337.
Checkley, D.M. Jr., 1984. Relation of growth to ingestion for
larvae of Atlantic herring Clupea harengus and other fish.
Marine Ecology Prog. Ser. Vol. 18, pp. 215-224.
Cousin, J.C.B. and Baudin-Laurencin, F., 1985. Morphogenesis of
the digestive system and swimbladder of the turbot
Scophthalmus maximus L. (in French). Aquaculture, Vol. 47:
305 -319.
Cousin, J.C.B., Balouet, C. and Baudin-Laurencin, F., 1986.
Histological changes observed in turbot larvae (Scophthalmus
maximus L.) raised in intensive systems. Aquaculture, Vol.
52: 173-189 (in French).
150
Cousin, J.C.B., Baudin-Laurencin, F.B. and Cabaudan, 3., 1987.
Ontogeny of enzymatic activities in fed and fasting turbot
Scophthalmus maximus L. 3. Fish Biol., Vol. 30, 1: 15-34.
Cowey, C.B., 1979. Protein and amino acid requirements of finfish.
pp. 3-16. In: Finfish Nutrition and Fishfeed Technology,
Vol. I (Halver, J.E. and Tiews, K., eds). Proc. World
Symposium Hamburg, 20-23 June, 1978.
Cowey, C.B., Owen, J.M., Adron, .1W. and Middleton, C., 1976.
Studies on the nutrition of marine flatfish. The effect of
dietary fatty acids on the growth and fatty acid composition
of turbot (Scophthalmus maximus). Br. 3. Nutr., Vol. 36:
479-486.
Cowey, C.B. and Sargent, J.R., 1979. Nutrition. pp. 1-69. In:
Fish Physiology, Vol. 8 (Hoar, W.S., Randal, 0.3. and
Brett, J.R. eds). Academic Press, New York.
Dabrowski, K.R., 1986. Ontogenetical aspects of nutritional
requirements in fish. Comp. Biochem. Physiol., Vol. 85A, 4:
pp. 639-656.
Dempsey, C.H., 1978. Chemical stimuli as a factor in feeding and
intraspecific behaviour of herring larvae. 3. Mar. Biol. Assoc.
U.K., Vol. 58: 739-747.
Dendrinos, P., Dewan, S. and Thorpe, J.P., 1984. Improvement in
the feeding efficiency of larval, post larval and juvenile Dover
sole (Solea solea L.) by the use of staining to improve the
visibility of Artemia used in food. Aquaculture, Vol. 38:
137-144.

151
Dendrinos, P. and Thorpe, 3.P., 1987. Experiments on the artificial
regulation of the amino acid and fatty acid contents of food
organisms to meet the assessed nutritional requirements of
larval, post-larval and juvenile Dover sole (Solea solea L.).
Aquaculture, Vol. 61, 121-154.
Doohan, M., 1973. An energy budget for adult Brachionus plicatilis
Muller (Rotatoria). Oecologia (Ben.), Vol. 13: 351-362.
Doyle, M.J., 1977. A morphological staging system for the larval
development of the herring Clupea harengus L. 3. Mar. Biol.
Ass. U.K., Vol. 57: 859-867.
Dumont, H.3., 1977. Biotic factors in population dynamics of
rotifers. Arch. Hydrobiol. Beih. Ergebn. Limnol., Vol. 8:
98 -122.
Ehrlich, K.F., 1972. Morphometrical, behavioural and chemical
changes during growth and starvation of herring and plaice
larvae. Ph.D. Thesis, University of Stirling, 130 pp.
Ehrlich, K.F., Blaxter, 3.H.S. and Pemberton, R., 1976.
Morphological and histological changes during the growth and
starvation of herring and plaice larvae. Mar. Biol., Vol. 35:
105-118.
Epifano, C.E., 1979. Growth in bivalve molucs: Nutritional effects
of two or more species of algae in diets fed to the American
oyster Crassostrea virginica (Gmelin) and the hard clam
Mercenaria mercenania (L.). Aquaculture, Vol. 18: 1-12.
Flowerdew, M.W. and Groove, D.3., 1979. Some observations on the
effects of body weight, temperature, meal size and quality on
gastric emptying time in turbot, Scophthalmus maximus CL.)
using radiography. 3. Fish Biol., Vol. 14: 229-238.

152
Fossum, P., 1983. Digestion rate of food particles in the gut of
larval herring. Fiskeridir. Skr. Ser. Havunders. 347-357.
Fukuhara, 0., 1986. Morphological and functional development of
Japanese flounder in early life stages. Bull. Jap. Soc. Sd.
Fish., Vol. 52(1): 81-91.
Fukusho, K., 1979. Studies on fry production of Japanese striped
knifejaw Oplegnathus fasciatus, with special reference to
feeding ecology and mass culture of food organisms. Ph.D.
Thesis, 173 pp. Special report of Nagasaki Prefectural
Institute of Fisheries No. 6.
Fukusho, K. and Okauchi, M., 1982. Strain and size of rotifer,
Brachionus plicatilis being cultured in southeast Asian
countries. Bull. Natl. Res. Inst. Aquaculture No. 3: 107-109.
Fukusho, K. and Okauchi, M., 1983. Sympatry in natural
distribution of the two strains of a rotifer, Brachionus
plicatilis. Bull. NatI. Res. Inst. Aquaculture No. 4, 135-138.
Fukusho, K., Okauchi, M., Nuraini, S., Tsujigado, A. and
Watanabe, T. 1984. Food value of a rotifer Brachionus
plicatilis cultured with Tetraselmis tetrathele for larvae of
red seabream Pagrus major. Bull. Jap. Soc. Sci. Fish.,
Vol. 50(8), 1439-1444.
Gamble, iC., MacLachlan, P., Nicoll, N.T. and Baxter, I.G., 1981.
Growth and feeding of Atlantic herring larvae reared in large
plastic enclosures. Rapp. P.-v. Reun. Cons. mt. Explor. Mer,
Vol. 178: 121-139.
Gatesoupe, F.J., Leger, C., Metailler, R., Luquet, P. and Malaval,
M., 1977a. Alimentation lipidique du turbot (Scophthalmus
maximus L.). I. Influence de Ia longueur de chaine de acides
gras de Ia sane w3. Ann. Hydrobiol., Vol. 8(1): 89-97.

153
Gatesoupe, F.]. and Luquet, P., 1981. Practical diet for mass
culture of the rotifer Brachionus plicatilis: application to
larval rearing of sea bass Dicentrarchus labrax. Aquaculture,
Vol. 22: 149-163.
Gatten, R.R., Sargent, J.R. and Camble, 3.C., 1983. Diet induced
changes in fatty acid composition of herring larvae reared in
enclosed ecosystems. 3. Mar. Biol. Ass. U.K., Vol. 63:
575-584.
Cerking, S.D., 1971. Influence of rate of feeding and body weight
on protein metabolism in blue gill sunfish. Physiol. Zool.,
Vol. 44: 9-19.
Govoni, 3.3., 1980. Morphhological, histological and functional
aspects of alimentary canal and associated organ development
in larval Leisotomus xanthurus Lacepede. Rev. Can. Biol.,
Vol. 39: 69-80.
Covoni, 3.3., Peters, D.S. and Merriner, 3.V., 1982. Carbon
assimilation during larval development of the marine teleost
Leiostomus xanthurus Lacepede. 3. exp. mar. Biol. Ecol.,
Vol. 64: 287-299.
Govoni, 3.3., Boehlert, G.W. and Watanabe, Y., 1986. The
physiology of digestion in fish larvae. Env. Biol. Fish.,
Vol. 16, 1-3: 59-77.
Hay, D.E., 1981. Effects of capture and fixation on gut contents
and body size of Pacific herring larvae. Rapp. P.-v. Reun.
Cons. mt. Explor Mer, Vol. 178: 395-400.
Hay, D.E., 1984. Weight loss and change of condition factor during
fixation of Pacific herring Clupea harengus pallasi, eggs and
larvae. 3. Fish Biol., Vol. 25: 421-433.

154
Hayes, L.W., Tinsley, 1.3. and Lowry, R.R., 1972. Utilization of
fatty acids by developing steethead sac-fry (Salmo gairdneri).
Camp. Biochem. Physiol., Vol. 45B: 695-707.
Helm, M.M. and Laing, I., 1987. Preliminary observations on the
nutritional value of "Tahiti-Isochrysis" to bivalve larvae.
Aquaculture, Vol. 62: 281-288.
Hirata, H., 1980. Culture methods of the marine rotifer Brachionus
plicatilis. Mm. Rev. Data File Fish. Res., Vol. 1: 27-46.
Hjelmeland, K., Huse, I., Jorgensen, 3., Movik, C. and Raa, 3., 1983.
Trypsin and trypsinogen as indices of growth and survival
potential of cod (Gadus morhua L.) larvae. Flodevigen Rapp.,
Vol. 3: 1-17.
Hofer, R., 1985. Effects of artificial diets on the digestive
processes of fish larvae. In Nutrition and feeding in fish
(Cowey, C.B., Mackie, A.M. and Bell, .1G., eds), pp. 213-216,
Academic Press. Inc. (London) Ltd.
Hofer, R. and Burkle, 0., 1986. Daily food consumption, gut
passage rate and protein utilization in whitefish larvae
(Coregonus sp.). Arch. Hydrobiol. Beih. Ergebn. Limnol.,
Vol. 22: 189-196.
Houde, E.D., 1978. Critical food concentrations for larvae of three
species of sub-tropical marine fishes. Bull. Mar. Sci., Vol. 28:
395-411.
Houde, E.D. and Schekter, R.C., 1981. Growth rates, rations and
cohort consumption of marine fish larvae in relation to prey
concentrations. Rapp. P.-v. Reun. mt. Explor. Mer, Vol. 178:
441-453.

155
Houde, E.D. and Schekter, R.C., 1983. Oxygen uptake and
comparative energetics among eggs and larvae of three sub-
tropical marine fishes. Mar. Biol., Vol. 72: 283-293.
Houde, E.D., Berkeley, S.A., Klinovsky, 3.3. and Schekter, R.C.,
1976. Culture of larvae of the white mullet, Mugil curema
Valenciennes. Aquaculture, Vol. 8: 365-370.
Howell, B.R., 1973. Marine fish culture in Britain. VIII. A marine
rotifer Brachionus plicatilis Muller, and the larvae of the
mussel Mytilus edulis L. as foods for larval flatfish. 3. Cons.
Cons. mt. Explor. Mer, Vol. 35: 1-6.
Howell, B.R., 1979. Experiments on the rearing of larval turbot
Scophthalmus maximus L. Aquaculture, Vol. 18: 215-225.
Hunter, J.R., 1976a. Culture and growth of northern anchovy
Engraulis mordaxx larvae. Cal. Coop. Ocean Fish. mv. Rep.,
Vol. 19: 138-146.
Hunter, 3.R., 1976b. Report of a colloquiam on larval fish
mortality studies and their relation to fishery research,
January 1975. NaLl. Oceanic Atmosph. Adm. U.S. Nati Mar.
Fish. Serv. Circ., No. 395: 5 pp.
Hunter, 3.R., 1980. The feeding behaviour and ecology of marine
fish larvae. In: Fish behavior and its use in the capture and
culture of fishes (Bardach, i.E., Magnuson, 3.3., May, R.C. and
Reinhart, S.M., eds) pp. 287-330. ICLARM Conference
Proceedings 5. Manila, Philippines.
Hunter, i.R. and Kimbrell, C.M., 1980. Early life history of Pacific
mackerel Scomber japonicus. Fish. Bull., Vol. 78, 1: 89-102.
Ito, T., 1960. On the culture of the mixohaline rotifer Brachionus
plicatilis O.F. Muller in sea water. Rep. Fac. Fish. Pref.
Univ. Mie, Vol. 3: 708-740 (in Japanese, English summary).

156
lwai, T., 1980. Sensory anatomy and feeding of fish larvae. In:
Fish behaviour and its use in the capture and culture of fishes
(Bardach, i.E., Magnuson, 3.3., May, R.C. and Reinhart, J.M.,
eds). pp. 124-145. ICLARM Conference Proceedings 5,
Manila, Philippines.
Iwai, T. and Rosenthal, H., 1981. Ciliary movements in guts of
early clupeoid and salongid larvae. Mar. Ecol. Prog. Ser.,
Vol. 4: 365-367.
Mangor-Jensen, A. and Adolf, G.R., 1987. Drinking activity of the
newly hatched larvae of cod Gadus morhua L. 3. Fish Physiol.
and Biochem. Vol. 93, 480-505.
Jobling, M., 1986. Mythical models of gastric emptying and
implications for food consumption studies. Env. Biol. Fish.,
Vol. 16, No. 1-3, 35-50.
Jobling, M., Gwyther, D. and Grove, D.3., 1977. Some effects of
temperature, meal size and body weight on gastric evacuation
time in the dab Limanda limanda (L.). 3. Fish Biol., Vol. 10:
291- 298.
Jones, A., 1972. Studies on egg development and larval rearing of
turbot, Scophthalmus maximus L., and brill, Scophthalmus
rhombus L., in the laboratory. 3. mar. biol. Ass. U.K.,
Vol. 52: 965-986.
Jones, A., 1973. Observations on the growth of turbot larvae
Scophthalmus maximus L. reared in the laboratory.
Aquaculture, Vol 2: 149-155.
Kahan, D., Uhliz, C., Schwenger, D. and Horowitz, L., 1982. A
simple method for cultivating harpacticoid copepods and
offering them to fish larvae. Aquaculture, Vol. 26, 3, 4:
303 -310.

157
Kanazawa, A., 1985. Essential fatty acid and lipid requirement of
fish. In: Nutrition and feeding in fish (Cowey, C.B., Mackie,
A.M. and Bell, J.G., eds), pp. 281-294, Academic Press,
London.
Kawai, S. and Ikeda, S., 1973b. Studies on digestive enzymes of
fishes. IV. Development of the digestive enzymes of carp and
black sea bream after hatching. Bull. Jap. Soc. Sci. Fish.,
Vol. 39: 877-881.
Kuhiman, D., Quartz, G. and Witt, U., 1981. Rearing of turbot
larvae (Scophthalmus maximus L.) on cultured food organisms
and postmetamorphosis growth on natural and artificial food.
Aquaculture, Vol. 23: 183-196.
Kitajima, K., Fujita, S., Fumito, 0., Yone, Y. and Watanabe, T.,
1979. Improvement of dietary value for red sea bream larvae
of rotifers Brachionus plicatilis cultured with baker's yeast
Saccharomyces cerevisiae. Bull. Jap. Soc. Sci. Fish,
Vol. 45(4): 469-471.
Kitajima, C., Arakawa, T., Ogawa, F., Fujita, S., Imada, 0.,
Watanabe, T. and Yone, Y., 1980. Dietary value for red sea
bream larvae of rotifer Brachionus plicatilis cultured with a
new type of yeast. Bull. .]ap. Soc. Sci. Fish, Vol. 46(1): 43-46.
Klumpp, D.W. and von-Westernhagen, H., 1986. Nitrogen balance in
marine fish larvae: influence of developmental stage and prey
density. Mar. Biol., Vol. 93, 2: 189-199.
Korn, S. and Macedo, D., 1973. Determination of fat content in
fish with a nontoxic, noninflammable solvent. 3. Fish. Res.
Bd. Can., Vol. 30: 1880-1881.

158
Lambertsen, C. and Braekkan, D.R., 1965. The fatty acid
composition of herring oils. Fiskeridir. Norw. Skr. Ser.
Teknol. Unders., Vol. 4: 1-15.
Lauff, M. and Hofer, R., 1984. Development of proteolytic
enzymes in fish and the importance of dietary enzymes.
Aquaculture, Vol. 37: 335-346.
Laurence, G.C., 1971. Digestion rate of larval largemouth bass.
N.Y. Fish. Game 3., Vol. 18: 52-56.
Laurence, G.C., 1977. A bloenergetic model for the analysis of
feeding and survival potential of winter flounder
Pseudopleuronectes americanus larvae during the period from
hatching to metamorphosis. Fish. Bull. U.S., Vol. 75(3):
529 -546.
Lee, C.S., Hu, F. and Hirano, R., 1981. Organisms suitable as food
for larvae of black sea bream. Prog. Fish. Cult., Vol. 43(3).
pp. 121-124.
Leger, P., Bengtson, D.A., Simpson, K.L. and Sorgeloos, P., 1986.
The use and nutritional value of Artemia as a food source.
Oceanogr. Mar. Biol. Ann. Rev., Vol. 24: 521-623.
Le Milinaire, C., Gatesoupe, F.3. and Stephen, C., 1983. Approach
du besoin quantitaitif en acide gras longs polyunsaturates de Ia
serie n-3 chez Ia larve de turbot (Scophthalmus maximus).
C.R. Acad. Sc. Paris, Vol. 296: 917-920.
Liemeroth, L., 1980. Respiration of different stages and energy
budgets of juvenile Brachionus calyciflorus. Hydrobiologia,
Vol. 73: 195-197.
Lubzens, E., 1987. Raising rotifers for use in aquaculture.
Hydrobiologia, Vol. 147: 245-255.

159
Lubzens, E., Marko, A. and Tietz, A., 1985. De novo synthesis of
fatty acids in the rotifer Br8chionus plicatilis. Aquaculture,
Vol. 47: 27-37.
Moffatt, N.M., 1981. Survival and growth of northern anchovy
larvae on low zooplankton densities as affected by the
presence of a Chiorella bloom. Rapp. P.-v. Reun. Cons. mt.
Explor. Mer, Vol. 178: 475-480.
Nash, C.E., Kuo, C.M. and McConnel, S., 1974. Operational
procedures for rearing larvae of the grey mullet (Mugil
cephalus L.). Aquaculture, Vol. 3: 15-24.
Nogard, W.A.S., Jensen, S.L., Jensen, A. and Cuillard, R.R.L., 1974.
Chioroplast pigments and algal systematics. Biochem.
Systematics and Ecology, Vol. 2: 3-6.
O'Connell, C.P., 1981. Development of organ systems in the
northern anchovy Engraulis mordax and other teleosts. Amer.
Zoo!., Vol. 21: 429-446.
istad, V., 1987. Marine farms could raise 120,000 tons. In: Fish
Farmer International, Vol. 14, No. 4, p. 1.
Oka, A., Suzuki, N. and Watanabe, T., 1980. Effect of fatty acids
in rotifers on growth and fatty acid composition of larval ayu
Plecoglosus altivelis. Bull. Jap. Soc. Sci. Fish., Vol. 46(11),
1413-1418.
Okauchi, M., Oshiro, T., Kitamura, S., Tsujigado, A. and
Fukusho, K., 1980. Number of rotifer Brachionus plicatilis
consumed daily by a larva and juvenile of porgy,
Acanthopagrus schiegeli. Bull. Nat!. Res. Inst. Aquaculture,
Vol. 1: 39-45.
Olsen, 3., 1986. Will sea base and gilthead bream share turbots'
potential? Fish Farmer, Vol. 9, No. 5: 18-20.

160
Owen, B.M., Adron, .1W., Sargent, J.R.S. and Cowey, C.B., 1972.
Studies on the nutrition of marine flatfish. The effect of
dietary fatty acids on the tissue fatty acids of the plaice
Pleuronectes platessa. Mar. Biol., Vol. 13: 160-166.
Owen, 3.M., Adron, J.W., Middleton, C. and Cowey, C.B., 1975.
Elongation and desaturation of dietary fatty acids in turbot
Scophthalmus maximus L. and rainbow trout Salmo gairdneri
Rich. Lipids, Vol. 10: 528-531.
Owen, .J.M. and Middleton, C., 1977. Fatty acids of the lipids of
cultured herring. Aquaculture, Vol. 11: 369-372.
Pedersen, B.H., 1984. The intestinal evacuation rates of larval
herring (Clupea harengus L.) predating on wild plankton.
Dana., Vol. 3: 21-30.
Platt, R. and Irwin, D., 1973. Calorific content of phytoplankton.
Limnol. Oceanogr., Vol. 18: 306-310.
Policansky, D. and Sieswerda, P., 1979. Early life history of the
starry flounder Platichthys stellatus reared through
metamorphosis in the laboratory. Tran. Am. Fish. Soc.,
Vol. lOB: 326-327.
Rosenthal, H. and Hempel, C., 1970. Experimental studies in
feeding and food requirements of herring larvae (Clupea
harengus L.). In: Marine food chains (Steele, 3.H., ed.),
pp. 344-364, Oliver & Boyd, Edinburgh.
Riley, iD., 1966. Marine fish culture in Britain - VII. Plaice
(Pleuronectes platessa L.) post-larval feeding on Artemia
sauna L. nauplii and the effects of varying feeding levels. 3.
Cons. perm. i. Explor. Mer, Vol. 30: 204-221.

161
Ryer, C.H. and Boehiert, G.W., 1983. Feeding chronology, daily
ration and the effects of temperature upon gastric evacuation
in the pipefish Syganathus fucus. Env. Biol. Fish Vol. 9:
301-306.
Ryland, J.S., 1966. Observations on the development of larvae of
the plaice, Plenronectes platessa L., in aquaria. 3. Cons.
perm. mt. Explor. Mer Vol. 30, No. 2, 177-195.
Schauer, P.S. and Simpson, K.L., 1979. Fatty acids as biochemical
indicators of dietary assimilation in the marine fish Atlantic
silverside. : Finfish Nutrition and Fishfeed Technology
(Halver, J.E. and Tiews, K., eds), Vol. II, pp. 565-589. Proc.
World Symposium Hamburg 20-23 June, 1978.
Scott, A.P. and Baynes, S.M., 1978. Effects of algal diet and
temperature on the biochemical composition of the rotifer
Brachionus plicatilis. Aquaculture Vol. 14: 247-260.
Scott, A.P. and Baynes, S.M., 1979. The effect of unicellular algae
on survival and growth of turbot larvae (Scophthalmus
maximus L.). In: Finfish Nutrition and Fishfeed Technology
(Halver, J.E. and Tiews, K., eds). Proc. World Symp.
Hamburg 20-23 June 1978, Vol. I, pp. 423-433.
Scott, A.P. and Middleton, C., 1979. Unicellular algae as food for
turbot (Scophthalmus maximus) larvae - the importance of
dietary long chain polyunsaturated fatty acids. Aquaculture
Vol. 18: 227-240.
Scott, 3.M., 1981. The vitamin B12 requirement of the marine
reotifer Brachionus plicatilis. 3. Mar. Biol. Ass. U.K. Vol. 61:
983-994.

162
Scura, E.D. and Jerde, C.W., 1977. Various species of
phytoplankton as food for larval northern anchovy, Engraulis
mordax, and relative nutritional value of the dinoflagellates
Gymnodinium splendens and Gonyaulax polyedra. Fish. Bull.,
Vol. 75: 3, 577-583.
Seikai, T., 1985a. Influence of feeding periods of Brazilian Artemia
during larval development of hatchery reared flounder
Paralichthys olivaceus on the appearance of albinism. Bull.
Jap. Soc. Sci. Fish, Vol. 51(4): 521-527.
Seikai, T., 1985b. Reduction in occurrence frequency of albinism in
juvenile flounder Paralichthys olivaceus hatchery reared on
wild zooplankton. Bull. Jap. Soc. Sci. Fish, Vol. 51(8):
1261-1267.
Seikai, T., Watanabe, T. and Shimozaki, M., 1987. Influence of
three geographically different strains of Artemia nauplii on
occurrence of albinism in hatchery reared flounder
Paralichthys olivaceus. Bull. Jap. Soc. Sd. Fish., Vol. 53(2),
195-200.
Shelbourne, J.E., 1974. Population effects on the survival, growth
and pigment of tank-reared plaice larvae. In: Sea fisheries
(Jones, F.R.H., ed.), pp. 357-372.
Smigielski, A., 1979. Induced spawning and larval rearing of the
yellowtail flounder Limada feruginea. Fish. Bull., Vol. 26:
931-936.
Snell, T.W. and Carrillo, K., 1984. Body size variation among
strains of the rotifer Brachionus plicatilis. Aquaculture,
Vol. 37: 359-367.

163
Sorgeloos, P. and Persoone, C., 1975. Technological improvements
for the cultivation of invertebrates as food for fishes and
crustaceans. 2. Hatching end culturing of the brine shrimp
Artemia saline L. Aquaculture, Vol. 6: 303-317.
Sorokin, Vu.!. and Panov, D.A. 1966. The use of '4C for the
quantitative study of the nutrition of fish larvae. mt. Rev.
Gesamten Hydrobiol., Vol. 51: 743-756.
Stepiens, W.P. Jr., 1976. Feeding of laboratory reared larvae of the
sea bream Archosargus rhomboidalis (Sparidae). Mar. Biol.,
Vol. 38: 1-16.
Strickland, J.D.H. and Parsons, T.R., 1968. A practical handbook of
seawater analysis. Fish. Res. Bd. Can., Bull. 167.
Szlaminska, M., 1980. A histochemical study of digestive enzymes
in pike larvae. Fish. Manag., Vol. 11: 139-140.
Tanaka, M., 1973. Studies on the structure and function of the
digestive system of teleost larvae. Ph.D. Thesis, Department
of Fisheries, Faculty of Agriculture, Kyoto University, 136 pp.
Tandler, A, and Mason, C., 1984. The use of 14C labelled rotifers
(Brachionus plicatilis) in the larvae of gilthead seabream
(Sparus aurata): Measurements of the effect of rotifer
concentration, the lighting regime and seabream larval age on
their rate of rotifer ingestion. In: Research on Aquaculture
(Rosenthal, H. and Sang, C., eds) Eur. Mar. Soc. Sp. Publ.
No. 8. pp. 241-259.
Teshima, S., Kanazawa, A. and Sakamoto, M., 1981. Attempts to
culture the rotifers with microencapsulated diets. Bull. Jap.
Soc. Sci. Fish., Vol. 47: 1575-1578.

164
Theilacker, G.H., 198Db. Rearing container size affects
morphology and nutritional condition of larval jack mackerel
Trachurus symmetricus. Fish. Bull. U.S., Vol. 78: 789-791.
Theilacker, G.H. and Dorsey, K., 1980. Larval fish diversity, a
summary of laboratory and field research. IOC Workshop
Report No. 28: 105-142.
Theilacker, G.H. and Kimball, A.S., 1984. Comparative quality of
rotifers and copepods as foods for larval fishes. CaCOFI
Rep., Vol. XXV: 80-86.
Theilacker, G.H. and McMaster, M.F., 1971. Mass culture of the
rotifer Brachionus plicatilis and its evaluation as a food for
larval anchovies. Mar. Biol., Vol. 10: 183-188.
Tocher, D.R. and Sargent, 3.R., 1984. Analyses of lipids and fatty
acids in ripe roes of some Northwest European marine fish.
Lipids, Vol. 19, 7: 492-499.
Tocher, D.R., Fraser, A.J., Sargent, 3.R. and Gamble, J.C., 1985a.
Fatty acid composition of phospholipids and neutral lipids
during embryonic and early larval development of Atlantic
herring (Clupea harengus L.). Lipids, Vol. 20, No. 2, 69-74.
Tocher, D.R., Fraser, A.J., Sargent, 3.R. and Gamble, 3.C., 1985b.
Lipid class composition during embryonic and early larval
development in Atlantic herring (Clupea harengus L.). Lipids,
Vol. 20, No. 2: 84-89.
Watanabe, T., 1985. Importance of the study of broodstock
nutrition for further development of aquaculture. In:
Nutrition and feeding in fish (Cowey, C.B., Mackie, A.M. and
Bell, 3.G., eds). Academic Press, London. pp. 395-414.

165
Watanabe, T., Ogawa, F., Kitajima, C., Fujita, S. and Yone, Y.,
1979. Relationship between the dietary value of rotifers
Brachionus plicatilis and their content of3 highly unsaturated
fatty acids. Bull. Jap. Soc. Sd. Fish., Vol. 45(7): 883-889.
Watanabe, T., Tamiya, T., Oka, A., Hirata, M., Kitajima, C..). and
Fujita, S., 1983a. Improvement of dietary value of live foods
for fish larvae by feeding them onw3 highly unsaturated fatty
acids and fat soluble vitamins. Bull. Jap. Soc. Sci. Fish,
Vol. 49(3): 471-479.
Watanabe, T., Kitajima, C. and Fujita, S., 1983b. Nutritional values
of live organisms used in Japan for mass propagation of fish: a
review. Aquaculture, Vol. 34 (1/2): 115-144.
Watanabe, T., Ohta, M., Kitajima, C. and Fujita, S., 1983c.
Improvement of dietary value of brine shrimp Artemia sauna
for fish larvae by feeding them on 3 highly unsaturated fatty
acids. Bull. Jap. Soc. Sd. Fish, Vol. 48: 1775-1782.
Watanabe, Y., 1981. Ingestion of horseradish peroxidase by the
intestinal cells in larvae or juveniles of some teleosts. Bull.
Jap. Soc. Sci. Fish, Vol. 47(10): 1299-1307.
Watanabe, Y., 1982a. Intracellular digestion of horseradish
peroxidase by the intestinal cells of teleost larvae and
juveniles. Bull. Jap. Soc. Sd. Fish, Vol. 48(1): 37-42.
Watanabe, Y, 1984a. An ultrastructural study of intracellular
digestion of horseradish peroxidase by the rectal epithelium
cells in larvae of a freshwater cottid fish Cottus nozawa.
Bull. Jap. Soc. Sci. Fish, Vol. 50(3): 409-416.
Watanabe, Y., 1984b. Morphological and functional changes in
rectal epithelium cells of pond smelt during post-embryonic
development. Bull. Jap. Soc. Sci. Fish, Vol. 50(5): 805-814.

166
Werner, R.G. and Blaxter, J.H.S., 1980. Growth and survival of
larval herring (Clupea harengus L.) in relation to prey density.
Can. 3. Fish aquat. Sd, Vol. 37: 1063-1069.
Werner, R.G. and Blaxter, J.H.S., 1981. The effect of prey density
on mortality, growth and food consumption in larval herring
(Clupea harengus L.). Rapp. P.-v. Reun. Cons. in Explor.
Mer, Vol. 178: 405-408.
Wurdak, E.S., Gilbert, 3.3. and Jagles, R., 1978. Fine structure of
the resting eggs of the rotifers Brachionus calyciflorus and
Asplanchna siebold. Trans. Amer. Micros. Soc., Vol. 97:
49-72.
Witt, U., Quartz, C. and Kuhlmann, D., 1984. Survival and growth
of turbot larvae Scophthalmus maximus L. reared on different
food organisms with special regard to long-chain
polyunsaturated fatty acids. Aquaculture Engineering, Vol. 3:
177- 190.
Yamada, K., Kobayashi, K. and Yone, Y., 1980. Conversion of
linolenic acid to w3-highly unsaturated fatty acids in marine
fishes and rainbow trout. Bull. Jap. Soc. Sd. Fish, Vol. 46:
1231-1233.
Yin, M.C. and Blaxter, 3.H.S., 1987. Feeding ability and survival
during starvation of marine fish larvae. 3. exp. mar. Biol.
Ecol., Vol. 105, 73-83.

vii
Appendix I - Fatty acid analysis
Ia. Total lipid extraction:
Samples were thawed on ice then transferred to tubes where
volumes of CHCI 3 and seawater were estimated. The
volumes were adjusted to give CHCI 3:Methanol:sea water
ratio of 8:4:3. This was followed by vortex mixing and
teflon/glass homogenizing for 2 mm on ice. Biphasic layer
formation was speeded by centrifugation at 1,500 rpm (MSE
Super-Miror) for 30 s. The aqueous upper layer was discarded
and the lower organic layer filtered through Whatman No. 1
paper, followed by evaporation to dryness under oxygen free
nitrogen (OFN) overnight in a desiccator in vacuo.
lb. Fatty Acid Methyl Ester Preparation (FAME Prep)
Total lipid extracts were redisolved in 1% H2 SO4 in MeOH
plus toluene in 2:1 V/V ratios. The mixture was left at 50°C
overnight in loosely stopped tubes after flushing with OFN.
Following this 5 ml distilled H20 and 5 ml Hexane + 0.05%
butylated hydroxy toluene (BHT = anti oxidant) were added,
the mixture was vortex mixed and centrifuged as described
previously. The upper layer was removed to a second tube
whilst the remaining mixture underwent a repeat of the H20
and Hexane treatment and the upper layer was added to the
first lot. Into this second tube 3.5 ml of 2% KHCO 3 (aq) was
added followed by vortex mixing and centrifugation. The
upper layer was removed, a spatula full of anhydrous Na2504
was added, and it was vortex mixed and centrifuged. The
liquid layer was removed to another tube where it was

viii
evaporated to dryness under OFN. It was then redissolved in
hexane and BHT, streaked on TLC plate and
co-chromatographed with FAME standards, using solvent mix
Hexane/Diethyl Ether/Glacial Acetic Acid (85:15:1) by vol.
The TLC purified FAME were scraped into tubes and eluted
from silica using 10 ml Hexane + BHT, vortex mixed,
centrifuged and the liquid layer removed and evaporated to
dryness under OFN. This was then redissolved in Hexane +
BHT and analyzed by GLC.
Ic. GLC - Analysis
Carried out on a Packard 436 capillary gas chromatograph
using a Chranpack CP-WAX-52 CB 0.32 x 0.45 mm column
(50 m). Flame lonisation detector operated at 250°C.
Sample injected via an on-column injector. The column was
held at 50°C for 0.1 mm after which the oven temperature
was programmed to increase to 190°C at a rate of 39°C/mm
and then to rise at 1.5°C/mm to 225°C maximum which was
maintained for 15 mins. Peaks were identified by reference
to known standards and quantitated by a Shinadzu CR3A
recording integrator operating on a time lock program - lock
being on from 0.1 mm to 10.5 mm of the 50 mm analysis.
(This is to miss Hezane + BHT solvent from quantitative
analysis of methyl esters).