a system model of the effects of exercise on plasma ... · research article a system model of the...
TRANSCRIPT

RESEARCH ARTICLE
A system model of the effects of exercise on
plasma Interleukin-6 dynamics in healthy
individuals: Role of skeletal muscle and
adipose tissue
Micaela Morettini1,2*, Maria Concetta Palumbo2, Massimo Sacchetti3, Filippo Castiglione2,
Claudia Mazzà4,5
1 Interuniversity Centre of Bioengineering of the Human Neuromusculoskeletal System, University of Rome
“Foro Italico”, Rome, Italy, 2 Institute for Applied Calculus “Mauro Picone”, National Research Council of Italy,
Rome, Italy, 3 Department of Movement, Human and Health Sciences, University of Rome “Foro Italico”,
Rome, Italy, 4 Department of Mechanical Engineering, The University of Sheffield, Sheffield, United
Kingdom, 5 INSIGNEO Institute for in Silico Medicine, The University of Sheffield, Sheffield, United Kingdom
Abstract
Interleukin-6 (IL-6) has been recently shown to play a central role in glucose homeostasis,
since it stimulates the production and secretion of Glucagon-like Peptide-1 (GLP-1) from
intestinal L-cells and pancreas, leading to an enhanced insulin response. In resting condi-
tions, IL-6 is mainly produced by the adipose tissue whereas, during exercise, skeletal mus-
cle contractions stimulate a marked IL-6 secretion as well. Available mathematical models
describing the effects of exercise on glucose homeostasis, however, do not account for this
IL-6 contribution. This study aimed at developing and validating a system model of exer-
cise’s effects on plasma IL-6 dynamics in healthy humans, combining the contributions of
both adipose tissue and skeletal muscle. A two-compartment description was adopted to
model plasma IL-6 changes in response to oxygen uptake’s variation during an exercise
bout. The free parameters of the model were estimated by means of a cross-validation pro-
cedure performed on four different datasets. A low coefficient of variation (<10%) was found
for each parameter and the physiologically meaningful parameters were all consistent with
literature data. Moreover, plasma IL-6 dynamics during exercise and post-exercise were
consistent with literature data from exercise protocols differing in intensity, duration and
modality. The model successfully emulated the physiological effects of exercise on plasma
IL-6 levels and provided a reliable description of the role of skeletal muscle and adipose tis-
sue on the dynamics of plasma IL-6. The system model here proposed is suitable to simu-
late IL-6 response to different exercise modalities. Its future integration with existing models
of GLP-1-induced insulin secretion might provide a more reliable description of exercise’s
effects on glucose homeostasis and hence support the definition of more tailored interven-
tions for the treatment of type 2 diabetes.
PLOS ONE | https://doi.org/10.1371/journal.pone.0181224 July 12, 2017 1 / 12
a1111111111
a1111111111
a1111111111
a1111111111
a1111111111
OPENACCESS
Citation: Morettini M, Palumbo MC, Sacchetti M,
Castiglione F, Mazzà C (2017) A system model of
the effects of exercise on plasma Interleukin-6
dynamics in healthy individuals: Role of skeletal
muscle and adipose tissue. PLoS ONE 12(7):
e0181224. https://doi.org/10.1371/journal.
pone.0181224
Editor: Marta Letizia Hribal, Universita degli Studi
Magna Graecia di Catanzaro Scuola di Medicina e
Chirurgia, ITALY
Received: December 16, 2016
Accepted: June 27, 2017
Published: July 12, 2017
Copyright: © 2017 Morettini et al. This is an open
access article distributed under the terms of the
Creative Commons Attribution License, which
permits unrestricted use, distribution, and
reproduction in any medium, provided the original
author and source are credited.
Data Availability Statement: All relevant data are
within the paper.
Funding: This study was funded by the European
Commission under the 7th Framework Programme
(https://ec.europa.eu/research/fp7 MISSION-T2D
project, contract No.600803). The funder had no
role in study design, data collection and analysis,
decision to publish, or preparation of the

Introduction
The cytokine Interleukin-6 (IL-6) has a central role in glucose homeostasis; however, the evi-
dence of its dual nature of as an adipokine (i.e., adipose tissue-derived cytokine) and as a myo-
kine (i.e., muscle-derived cytokine) has been a matter of scientific debate [1]. Experimental
and clinical evidences suggest that an altered secretion of adipokines by the adipose tissue
determines a condition of “chronic low-grade inflammation”, correlated to insulin resistance
and IL-6 as one of the adipokines involved in this process [2–5]. It has also been shown that
IL-6 is secreted by skeletal muscles during exercise [6], in an amount that has proven to be
considerable and depending on the intensity and duration of the exercise [7–9]. IL-6 has been
shown to trigger the secretion of anti-inflammatory cytokines [10,11] and to contribute to an
improvement of insulin-stimulated glucose disposal [12].
The dual nature of IL-6 has been unveiled by the recent observation that, as a response to
changes in insulin demand, it mediates the crosstalk between insulin-sensitive tissues (muscle
ad adipose tissue), intestinal L-cells, and pancreatic islets [13]. IL-6 release, either from the
contraction of skeletal muscle or from white adipose tissue, stimulates the production and
secretion of Glucagon-like Peptide-1 (GLP-1) from intestinal L-cells and pancreas. This leads
to an enhanced insulin response and, thus, to improved glycemic levels [14]. As a consequence,
increased levels of circulating IL-6 observed in chronic low-grade inflammation, may repre-
sent a compensatory mechanism to maintain glucose homeostasis in insulin resistant condi-
tions [15].
Only a few mathematical models describing the effects of an exercise bout on hormones
and metabolites involved in glucose homeostasis have been developed to date [16–22] but
none of them accounts for IL-6 contribution. This might indeed limit the scope of applicability
of these models. Thus, the aim of this study was to design a system model of the effects of phys-
ical exercise on plasma IL-6 dynamics, able to account for both the adipose tissue and the skel-
etal muscle release.
Materials and methods
Model formulation
When at rest, subcutaneous and visceral adipose tissues are the principal responsibles for IL-6
production [23,24]. During physical exercise, on the contrary, IL-6 production is sustained by
the skeletal muscle through intracellular signaling pathways. Depending on the duration and
intensity of exercise [7], plasmatic IL-6 concentration increases exponentially [8] and then, as
a result of this increase, the hepatosplanchnic viscera remove IL-6 from plasmatic circulation
[25]. Consistently, it was postulated here that the IL-6 dynamics can be described by the model
reported in Fig 1. Oxygen consumption provides a measure of exercise intensity and is usually
quantified as percentage of the maximal oxygen uptake (VO2max, [26]). In this study it was
hypothesized that oxygen consumption increases at the onset of exercise, reaches its target
value within 5–6 minutes and then remains constant during the exercise; at the end of exercise,
it is assumed to return to its basal value within 5–6 minutes, following the first order dynamics
described in Roy [18].
The overall model is described by the following ordinary differential equations:
dPVO2maxðtÞdt
¼ � 0:8 � PVO2max tð Þ þ 0:8 � u tð Þ PVO2max 0ð Þ ¼ 0 ð1Þ
dIL6mðtÞdt
¼ SRex � PVO2max tð Þ � km � IL6m tð Þ IL6m 0ð Þ ¼ 0 ð2Þ
Modeling IL-6 dynamics in exercise
PLOS ONE | https://doi.org/10.1371/journal.pone.0181224 July 12, 2017 2 / 12
manuscript. There was no additional external
funding received for this study.
Competing interests: The authors have declared
that no competing interests exist. Prof. Massimo
Sacchetti and Dr. Filippo Castiglione are currently
serving as PLOS ONE Academic Editors. This does
not alter our adherence to PLOS ONE policies on
sharing data and materials.

dIL6pðtÞdt
¼ km � IL6m tð Þ � ke � IL6p tð Þ þRaIL6
VIL6p 0ð Þ ¼ IL6b ð3Þ
Eq (1) is taken from Roy et al. [18] and describes the dynamics of oxygen consumption for
the whole exercise duration and the recovery as a linear first-order differential equation. PVO2-
max(t) represents the suprabasal oxygen consumption, expressed as percentage of VO2max. u(t)is the model input, representing the target value of the exercise intensity above the basal level:
uðtÞ ¼
0 0 < t < tstartex
Tv tstartex � t � tend
ex
0 t > tendex
ð4Þ
8><
>:
The target value Tv ranges from 0 to 92%, considering a basal consumption equal to 8% of
the maximum value [27]. The coefficient 0.8 min-1 is chosen to allow PVO2max(t) to reach the
target value Tv in 5–6 minutes. In Eq (2), IL6m(t) represents the IL-6 concentration in the mus-
cle compartment. The first term on the right-hand side of Eq (2) accounts for muscle IL-6
increase from stationary conditions in response to muscle contraction during exercise, which
is described as linearly dependent on PVO2max(t) through SRex, representing the muscular IL-6
secretion rate. In Eq (3), IL6p(t) represents the IL-6 concentration in the plasma compartment.
The first term of the right-hand side of Eq (3) accounts for the increase in the plasma IL-6
from its basal value (IL6b) due to IL-6 released from the skeletal muscle. The second term of
Eq (3) represents the IL-6 removal from circulation after exercise operated by the hepatos-
planchnic viscera. Lastly, the third term accounts for the IL-6 production rate during non-per-
turbed conditions, which is represented by the adipose tissue contribution (RaIL6) normalized
to the distribution volume V. For given values of ke, V and IL6b, the value of RaIL6 was deter-
mined by imposing the steady-state condition (dIL6p(t)/dt = 0) representing the equilibrium of
Fig 1. Two-compartment description of the IL-6 dynamics during exercise. Skeletal muscle secretes IL-
6 in the local (muscle) blood flow (IL6m(t)) in response to change in oxygen consumption (PVO2max) with a
secretion rate equal to SRex. Plasma IL-6 (IL6p(t)) is the result of adipose tissue secretion (RaIL6),
hepatosplanchnic viscera removal (ke) and contribution coming from muscle compartment (through km).
https://doi.org/10.1371/journal.pone.0181224.g001
Modeling IL-6 dynamics in exercise
PLOS ONE | https://doi.org/10.1371/journal.pone.0181224 July 12, 2017 3 / 12

the dynamic system described by Eqs (1–3):
RaIL6 ¼ ke � IL6b � V ð5Þ
The initial value of IL6b in Eq (3) was set to the fasting pre-exercise value. The parameter Vwas assumed as fixed and assigned a numerical value taken from the literature [28]. The free
model parameters SRex, km and ke were identified by fitting the IL-6 plasma concentration data
during and after an exercise session as described in Parameter estimation.
Datasets
Four experimental studies and relevant datasets were used to build and validate the model, dif-
fering from each other in terms of implemented exercise protocol and hence allowing to inves-
tigate the ability of the model to predict changes in IL-6 response due to changes in exercise
intensity and duration.
• Dataset 1 (D1): Ostrowski et al. [29]. Venous blood was sampled in ten endurance-trained
male athletes before, during and after (6 h recovery period) 2.5 h of treadmill running at 75%
of their VO2max;
• Dataset 2 (D2): Fischer et al. [30]. Seven young healthy physically active non-athletes men
performed three hours of a dynamic two-legged knee-extensor exercise at 50% of their indi-
vidual maximal power output. Systemic arterial plasma IL-6 concentration was measured at
0, 30, 60, 120, 180, 210, 240, 300, 360 and 1380 minutes after the beginning of exercise;
• Dataset 3 (D3): Steensberg et al. [8]. Six young healthy not regularly training males per-
formed five hours of a dynamic one-legged knee-extensor exercise at 40% of their individual
maximal power output, and ~ 20% of their VO2max. Systemic arterial plasma IL-6 concentra-
tion was measured every hour during the exercise session;
• Dataset 4 (D4): Febbraio et al. [25]. Six healthy male subjects performed 120 min of semi-
recumbent cycling at 62% of their VO2max. Systemic arterial plasma IL-6 concentration was
measured immediately before exercise and at 30-min intervals during exercise.
In D1, D3 and D4 the target value for the exercise intensity was already expressed in terms
of %VO2max, thus allowing to exactly set the model input Tv. Conversely, an approximation
was required for D2 to convert exercise intensity from percentage of maximal power output to
%VO2max. The target value for exercise intensity Tv was set considering the conversion
reported in [31]. The values of Tv, IL6b and exercise duration for simulating the exercise proto-
cols are summarized in Table 1.
Parameter estimation
The estimation of the model parameters SRex, km and ke was performed by fitting literature
mean values of plasma IL-6 concentration, using a weighted non-linear least squares approach.
Table 1. Values of IL6b, Tv and exercise duration.
Study IL6b Tv Exercise duration
pg�ml-1 % min
D1: Ostrowski et al. [29] 1.7 67 150
D2: Fischer et al. [30] 1.7 47 180
D3: Steensberg et al. [8] 0.9 12 300
D4: Febbraio et al. [25] 1.8 54 120
https://doi.org/10.1371/journal.pone.0181224.t001
Modeling IL-6 dynamics in exercise
PLOS ONE | https://doi.org/10.1371/journal.pone.0181224 July 12, 2017 4 / 12

The weighted residual sum minimization procedure was performed by using the Levenberg–
Marquardt algorithm implemented in the lsqnonlin Matlab1 (The MathWorks, Natick, MA,
USA) function. Each element of the diagonal of the weight matrix was set to be equal to the
reciprocal of the error variance of the IL-6 measurement. The errors in IL-6 measurements
were assumed to be normally distributed random variables, with zero mean and a constant
percent coefficient of variation (assumed equal to 6.9%, obtained by averaging the IL-6 intra-
assay coefficients of variation reported in the considered datasets). The precision of the esti-
mate of each parameter was expressed using the percent coefficient of variation, CV% = (SDpi
/ pi), where the standard deviation SDpi was derived from the inverse of the Fisher information
matrix and pi is the corresponding parameter estimate [32].
Cross-validation for parameters selection
The ideal set of parameters would be the one maximizing the ability of the model to reproduce
a dataset that is independent of the data that have been used to originally train it. A K-fold
cross-validation procedure was used to determine which, among the K considered datasets,
provides the “best” set of estimated parameters according to this criterion.
The K-fold cross-validation procedure included four stages, one per dataset Dk (with
k = 1,. . .,4). At each stage of the procedure, the investigated Dk was used as the training dataset
to estimate SRex, km and ke (as described in Parameter estimation), while the remaining three
datasets were used for the validation. The model predictions used for the validation were calcu-
lated using these estimated parameters, together with the IL6b value and model input (duration
and intensity of the exercise) from the corresponding protocol (Table 1). The total number of
observations available was N ¼PK
k¼1nk where nk is the number of observations in each Dk.
At each stage, the Mean Squared Prediction Error (MSPE) for each dataset was computed
as:
MSPEk ¼1
nk
Pnkj¼1ðyj � y�j Þ ð6Þ
where yj is j-th experimental observation and yj
�
is the j-th model prediction. The Cross-Vali-
dation Prediction Error Estimate (CVPEE) for each stage of the procedure was then computed
as:
CVPEE ¼1
NPK
k¼1nk �MSPEk: ð7Þ
The “best set” of estimated parameters was chosen as the one providing the lowest CVPEE.
Results
Results of the cross-validation are reported in Table 2. In all four stages, the value of V (IL-6
distribution volume) was set to 14 l according to reported experimental data [28]. The half-life
duration corresponding to the turnover rate ke was 13 min for D1, 56 min for D2, 147 min for
D3 and 51 min for D4.
According to the results reported in Table 2, the lowest CVPEE was obtained at Stage 1,
using dataset D1 as estimation set. Stage 1 was also characterized by having the lowest sum of
CV% associated to the estimations of SRex, km and ke. Accordingly, the data from Ostrowski
et al. [29] were selected as the one to be used for the parameter estimation. The mean of experi-
mental IL-6, together with the IL-6 model prediction as fitted applying Eqs (1–3), are shown in
Fig 2. The time course of the weighted residuals is shown in Fig 3.
Modeling IL-6 dynamics in exercise
PLOS ONE | https://doi.org/10.1371/journal.pone.0181224 July 12, 2017 5 / 12

After the fitting with D1, the model was validated against the other three datasets. Figs 4A,
5A and 6A show the model predictions of the oxygen consumption kinetics. Figs 4B, 5B and
6B show the IL-6 concentrations obtained from the model validation, plotted alongside the
experimental data. The simulations of the IL-6 dynamics, ran imposing the initial conditions
used in [30], [8], [25] (IL6b values summarized in Table 1), led to computed values for RaIL6 of
1,252 pg/min, 809 pg/min and 1,335 pg/min, respectively.
Discussion
This study aimed at proposing and validating a system model describing the IL-6 dynamics
during an exercise bout. A preliminary single-compartment description has been proposed in
[33], however the novel two-compartment formulation here reported provides a more detailed
and physiologically sound description of the IL-6 dynamics within the skeletal muscle.
Although it’s typically assumed that both the exercise modality and the associated number
of engaged muscles play a role in determining IL-6 response [8,34,35], recent studies showed
that different exercise modalities with the same relative intensity (i.e. same %VO2max), may
result in similar absolute IL-6 releases [36]. For this reason, none of the model parameters
were designed to account for differences in the amount of muscles engaged in the exercise. As
a result, the model requires as an input only one target value of maximum oxygen consump-
tion, i.e., one value of %VO2max. This notably simplifies the mathematical description of the
exercise and, without a significant loss of precision, allows flexibility in predicting the IL-6
response to different kind of exercise (running, cycling, etc.). This is a notable advantage with
respect to the single-compartment formulation [33], which requires a continuous measure-
ment of the heart rate.
Table 2. Results of the cross-validation procedure.
Stage Estimation set Estimated parameters Sum of CV% CVPEE
SRex (CV%) km (CV%) ke (CV%) RaIL6
pg�ml-1�min-1 min-1 min-1 pg�min-1
1 D1 0.045 (7) 0.004 (10) 0.053 (<1) <18 17.5 1,261
2 D2 0.014 (9) 0.002 (<1) 0.012 (11) <21 48.6 296
3 D3 0.038 (171) 0.0002 (189) 0.0047 (92) 452 107 58
4 D4 0.637 (<1) 0.00008 (23) 0.013 (74) <98 86.2 340
https://doi.org/10.1371/journal.pone.0181224.t002
Fig 2. Model fit results. (A) PVO2max model prediction (B) Mean model fit (solid line) for IL-6. Measured IL-6
concentrations (means ± SEM) from Ostrowski et al. [29] are shown, along with the model fit.
https://doi.org/10.1371/journal.pone.0181224.g002
Modeling IL-6 dynamics in exercise
PLOS ONE | https://doi.org/10.1371/journal.pone.0181224 July 12, 2017 6 / 12

The model-fit results, reported in Fig 2B, showed that the model is able to capture well the
experimental plasma IL-6 time course, although its peak value was slightly underestimated.
This is probably due to the chosen definition of the dynamics of the oxygen consumption,
which was simplistically represented as a first-order differential equation (Eq (1)), even though
the data used for the parameter estimation come from athletes performing a heavy-intensity
exercise. As suggested in the literature [37], in fact, at least two kinetic components should be
used to characterize the oxygen uptake response dynamics to a heavy-intensity exercise. None-
theless, this choice did not seem to affect the model credibility, as inferred from the fact that
the weighted residuals reported in Fig 3 were substantially randomly distributed.
The selected set of parameters represents the “best set” according to the cross-validation
procedure and provided plausible estimates, as confirmed by comparison with previously pub-
lished data. In fact, the IL-6 half-life has been previously found to range between 5 to 11 min
[28,38] and a turnover rate ke of 0.053 min-1, corresponding to a half-life of 13 min when
Fig 3. IL-6 weighted residuals.
https://doi.org/10.1371/journal.pone.0181224.g003
Fig 4. Model validation results obtained using the conditions reported in the study by Fischer et al.
(A) PVO2max model prediction (B) Measured IL-6 concentrations (means ± SEM) from Fischer et al. [30],
shown along with the model prediction (solid line).
https://doi.org/10.1371/journal.pone.0181224.g004
Modeling IL-6 dynamics in exercise
PLOS ONE | https://doi.org/10.1371/journal.pone.0181224 July 12, 2017 7 / 12
considering a distribution volume of 14 l, was here estimated. Subcutaneous abdominal adi-
pose tissue IL-6 release in resting conditions has been previously reported to be 3.84 pg/100 g
adipose tissue/min [24]. Assuming that subcutaneous and visceral adipose tissue masses
release IL-6 at the same rate, for a non-obese individual, an IL-6 production rate for the whole
body adipose tissue mass (subcutaneous and visceral) of about 1 ng/min can be extrapolated
[24]. This latter value is consistent with the range of RaIL6 (0.8�1.3 ng/min) values obtained
in the present study. The RaIL6 values remained physiologically meaningful (ranging from
1,080 to 1,450 pg/min) even when accounting for IL6b variability (expressed as mean ± SEM)
in the dataset selected for parameter estimation. The estimates of RaIL6 and ke provided by the
other three datasets, conversely, were not physiologically meaningful.
The IL-6 secretion rate from adipose tissue increases at the end of a moderate exercise bout
and then remains higher for a prolonged post-exercise period [23]. The fact that this value was
set as constant within the model here investigated, should not have affected its accuracy, since
the relative contribution to systemic IL-6 level from organs other than the contracting skeletal
muscles is negligible during and after exercise [28]. Further studies are needed to fully corrob-
orate this hypothesis.
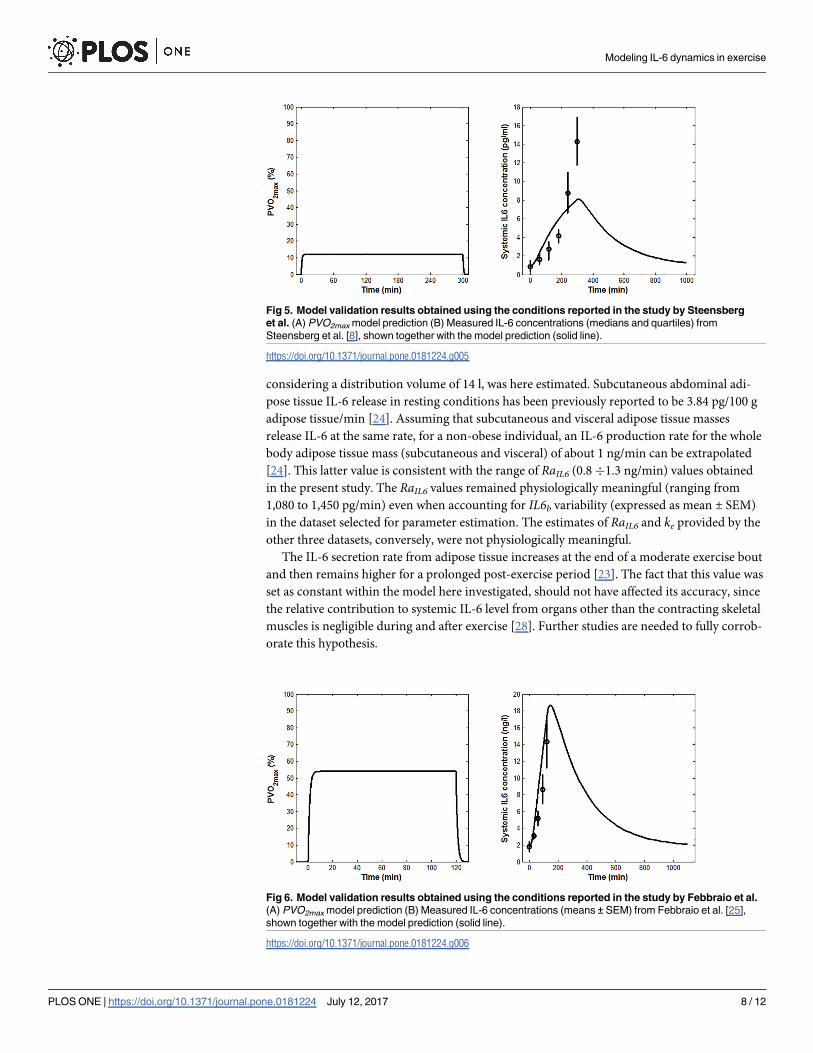
Fig 5. Model validation results obtained using the conditions reported in the study by Steensberg
et al. (A) PVO2max model prediction (B) Measured IL-6 concentrations (medians and quartiles) from
Steensberg et al. [8], shown together with the model prediction (solid line).
https://doi.org/10.1371/journal.pone.0181224.g005
Fig 6. Model validation results obtained using the conditions reported in the study by Febbraio et al.
(A) PVO2max model prediction (B) Measured IL-6 concentrations (means ± SEM) from Febbraio et al. [25],
shown together with the model prediction (solid line).
https://doi.org/10.1371/journal.pone.0181224.g006
Modeling IL-6 dynamics in exercise
PLOS ONE | https://doi.org/10.1371/journal.pone.0181224 July 12, 2017 8 / 12

The model reproduced well the effects on plasma IL-6 concentration due to changes in the
exercise duration and intensity. Its predictions were less accurate for low- than for high-inten-
sity exercise protocols (Fig 5 vs. Figs 4 and 6), for which the predicted peak value fell outside
the range of experimental values. The model prediction, however, might still be considered as
acceptable in light of the fact that previous studies on IL-6 response to low-intensity exercise
reported no increase during exercise [10,39]. Notably, the deviation of the model output from
the experimental data at the beginning of the exercise (Fig 4 and Fig 6) does not affect the over-
all IL-6 dynamics and the extent of the IL-6 increase. Such deviation could be ascribed to dif-
ferences among the subjects considered in the three chosen validation studies and, more
specifically, to the effect that the training status and the relevant muscular glycogen content
might have had on the IL-6 dynamics [34,35].
GLP-1-based clinical therapies have firmly established their importance among the thera-
peutical approaches available for the treatment of type 2 diabetes [40–42]; their action is
exerted by potentiating glucose-stimulated insulin secretion. Interestingly, GLP-1 secretion
increases in an IL-6-dependent manner [14], but also as a function of glucose transit into the
gastrointestinal tract [43]. Whereas mechanistic models enabling the quantitation of insulin
response to GLP-1, as well as models of GLP-1-mediated insulin response to glucose transit
into the gastrointestinal tract [44–49] have been previously proposed, the GLP-1 response to
IL-6 has never been modeled. The system model here proposed could be seen as an important
step toward the modeling of this response, and as such as a step toward the improvement of
GLP-1-based clinical therapy. An integrated description of the GLP-1-induced insulin secre-
tion, accounting for the contribution of exercise-induced IL-6 and of the meal-induced glucose
transit into the gastrointestinal tract could allow to reliably describe the response to exercise in
real-life situations. More importantly, this approach could be used to quantify the combined
effects of exercise and meal on glucose homeostasis regulation, hence favoring the definition
of a tailored exercise-based intervention in the control of insulin secretion for the treatment of
type 2 diabetes. Future research is recommended in this direction.
In conclusion, this study proposes an innovative two-compartment system model of the
effects of an exercise bout on IL-6 dynamics. The model is able to describe data from various
exercises, it is precise in the parameter estimation, and it is in good agreement with published
values of various experimentally measured physiological quantities.
Acknowledgments
The authors gratefully acknowledge Prof. Lorenzo Farina for providing helpful critical com-
ments on the model formulation and Prof. Aurelio Cappozzo who provided insight and exper-
tise that assisted the research.
Author Contributions
Conceptualization: Micaela Morettini, Claudia Mazzà.
Data curation: Micaela Morettini, Maria Concetta Palumbo.
Formal analysis: Micaela Morettini, Maria Concetta Palumbo, Filippo Castiglione.
Funding acquisition: Filippo Castiglione, Claudia Mazzà.
Methodology: Micaela Morettini, Maria Concetta Palumbo.
Project administration: Filippo Castiglione, Claudia Mazzà.
Resources: Filippo Castiglione.
Modeling IL-6 dynamics in exercise
PLOS ONE | https://doi.org/10.1371/journal.pone.0181224 July 12, 2017 9 / 12

Software: Micaela Morettini, Maria Concetta Palumbo.
Supervision: Massimo Sacchetti, Claudia Mazzà.
Validation: Massimo Sacchetti, Claudia Mazzà.
Visualization: Micaela Morettini, Maria Concetta Palumbo.
Writing – original draft: Micaela Morettini, Maria Concetta Palumbo.
Writing – review & editing: Micaela Morettini, Maria Concetta Palumbo, Massimo Sacchetti,
Filippo Castiglione, Claudia Mazzà.
References1. Pedersen BK, Febbraio M. Muscle-derived interleukin-6—a possible link between skeletal muscle, adi-
pose tissue, liver, and brain. Brain Behav Immun. 2005; 19: 371–376. https://doi.org/10.1016/j.bbi.
2005.04.008 PMID: 15935612
2. Hotamisligil GS. Inflammation and metabolic disorders. Nature. 2006; 444: 860–867. https://doi.org/10.
1038/nature05485 PMID: 17167474
3. Shoelson SE, Lee J, Goldfine AB. Inflammation and insulin resistance. J Clin Invest. 2006; 116: 1793–
1801. https://doi.org/10.1172/JCI29069 PMID: 16823477
4. Xu H, Barnes GT, Yang Q, Tan G, Yang D, Chou CJ, et al. Chronic inflammation in fat plays a crucial
role in the development of obesity-related insulin resistance. J Clin Invest. 2003; 112: 1821–1830.
https://doi.org/10.1172/JCI19451 PMID: 14679177
5. Vozarova B, Weyer C, Hanson K, Tataranni PA, Bogardus C, Pratley RE. Circulating interleukin-6 in
relation to adiposity, insulin action, and insulin secretion. Obes Res. 2001; 9: 414–417. https://doi.org/
10.1038/oby.2001.54 PMID: 11445664
6. Pedersen BK, Steensberg A, Fischer C, Keller C, Keller P, Plomgaard P, et al. Searching for the exer-
cise factor: is IL-6 a candidate? J Muscle Res Cell Motil. 2003; 24: 113–119. https://doi.org/10.1023/
A:1026070911202 PMID: 14609022
7. Ostrowski K, Schjerling P, Pedersen BK. Physical activity and plasma interleukin-6 in humans—effect
of intensity of exercise. Eur J Appl Physiol. 2000; 83: 512–515. https://doi.org/10.1007/s004210000312
PMID: 11192058
8. Steensberg A, van Hall G, Osada T, Sacchetti M, Saltin B, Pedersen BK. Production of interleukin-6 in
contracting human skeletal muscles can account for the exercise-induced increase in plasma interleu-
kin-6. J Physiol. 2000; 529: 237–242. https://doi.org/10.1111/j.1469-7793.2000.00237.x PMID:
11080265
9. Pedersen BK, Febbraio MA. Muscles, exercise and obesity: skeletal muscle as a secretory organ. Nat
Rev Endocrinol. 2012; 8: 457–465. https://doi.org/10.1038/nrendo.2012.49 PMID: 22473333
10. Hiscock N, Fischer CP, Sacchetti M, van Hall G, Febbraio MA, Pedersen BK. Recombinant human
interleukin-6 infusion during low-intensity exercise does not enhance whole body lipolysis or fat oxida-
tion in humans. Am J Physiol Endocrinol Metab. 2005; 289: E2–7. https://doi.org/10.1152/ajpendo.
00274.2004 PMID: 15741245
11. Steensberg A, Fischer CP, Keller C, Møller K, Pedersen BK. IL-6 enhances plasma IL-1ra, IL-10, and
cortisol in humans. Am J Physiol Endocrinol Metab. 2003; 285: E433–E437. https://doi.org/10.1152/
ajpendo.00074.2003 PMID: 12857678
12. Carey AL, Steinberg GR, Macaulay SL, Thomas WG, Holmes AG, Ramm G, et al. Interleukin-6
increases insulin-stimulated glucose disposal in humans and glucose uptake and fatty acid oxidation in
vitro via AMP-activated protein kinase. Diabetes. 2006; 55: 2688–2697. https://doi.org/10.2337/db05-
1404 PMID: 17003332
13. Ellingsgaard H, Hauselmann I, Schuler B, Habib AM, Baggio LL, Meier DT, et al. Interleukin-6 enhances
insulin secretion by increasing glucagon-like peptide-1 secretion from L cells and alpha cells. Nat Med.
2011; 17: 1481–1489. https://doi.org/10.1038/nm.2513 PMID: 22037645
14. Allen TL, Whitham M, Febbraio MA. IL-6 muscles in on the gut and pancreas to enhance insulin secre-
tion. Cell Metab. 2012; 15: 8–9. https://doi.org/10.1016/j.cmet.2011.12.004 PMID: 22225871
15. Cao H. Adipocytokines in obesity and metabolic disease. J Endocrinol. 2014; 220: T47–T59. https://doi.
org/10.1530/JOE-13-0339 PMID: 24403378
16. Derouich M, Boutayeb A. The effect of physical exercise on the dynamics of glucose and insulin. J Bio-
mech. 2002; 35: 911–917. PMID: 12052393
Modeling IL-6 dynamics in exercise
PLOS ONE | https://doi.org/10.1371/journal.pone.0181224 July 12, 2017 10 / 12

17. Kim J, Saidel GM, Cabrera ME. Multi-scale computational model of fuel homeostasis during exercise:
effect of hormonal control. Ann Biomed Eng. 2007; 35: 69–90. https://doi.org/10.1007/s10439-006-
9201-x PMID: 17111212
18. Roy A, Parker RS. Dynamic modeling of exercise effects on plasma glucose and insulin levels. J Diabe-
tes Sci Technol. 2007; 1: 338–347. https://doi.org/10.1177/193229680700100305 PMID: 19885088
19. Man CD, Breton MD, Cobelli C. Physical activity into the meal glucose–insulin model of type 1 diabetes. J
Diabetes Sci Technol. 2009; 3: 56–67. https://doi.org/10.1177/193229680900300107 PMID: 20046650
20. Adamu II, Garba EJD, Haruna Y. Mathematical model for the dynamics of glucose regulatory system
under the combined effect of dieting and physical activity. Ozean J Appl Sci. 2012; 5: 229–241.
21. Svitra D, Basov I, Vilkyte R. Modelling of glycaemia dynamics: impact of physical exercises. Nonlinear
Anal Model Control. 2010; 15: 213–232.
22. Singh S, Kumar D. A Mathematical model on glucose-insulin regulatory system with the impact of physi-
cal activities. Computational and Mathematical Biology 2016; 5: 5–8.
23. LyngsøD, Simonsen L, Bulow J. Interleukin-6 production in human subcutaneous abdominal adipose
tissue: the effect of exercise. J Physiol. 2002; 15: 373–378. https://doi.org/10.1113/jphysiol.2002.
019380
24. Mohamed-Ali V, Goodrick S, Rawesh A, Katz DR, Miles JM, Yudkin JS, et al. Subcutaneous adipose
tissue releases interleukin-6, but not tumor necrosis factor-α, in vivo. J Clin Endocrinol Metab. 1997; 82:
4196–4200. https://doi.org/10.1210/jcem.82.12.4450 PMID: 9398739
25. Febbraio MA, Ott P, Nielsen HB, Steensberg A, Keller C, Krustrup P, et al. Hepatosplanchnic clearance
of interleukin-6 in humans during exercise. Am J Physiol Endocrinol Metab. 2003; 285: E397–E402.
https://doi.org/10.1152/ajpendo.00134.2003 PMID: 12857677
26. Hill AV, Lupton H. Muscular exercise, lactic acid, and the supply and utilization of oxygen. QJM. 1923;
os-16: 135–171. https://doi.org/10.1093/qjmed/os-16.62.135
27. Felig P, Wahren J. Fuel homeostasis in exercise. N Engl J Med. 1975; 293: 1078–1084. https://doi.org/
10.1056/NEJM197511202932107 PMID: 1178025
28. Toft AD, Falahati A, Steensberg A. Source and kinetics of interleukin-6 in humans during exercise dem-
onstrated by a minimally invasive model. Eur J Appl Physiol. 2011; 111: 1351–1359. https://doi.org/10.
1007/s00421-010-1755-5 PMID: 21153418
29. Ostrowski K, Hermann C, Bangash A, Schjerling P, Nielsen JN, Pedersen BK. A trauma-like elevation
of plasma cytokines in humans in response to treadmill running. J Physiol. 1998; 513: 889–894. https://
doi.org/10.1111/j.1469-7793.1998.889ba.x PMID: 9824725
30. Fischer CP, Hiscock NJ, Penkowa M, Basu S, Vessby B, Kallner A, et al. Supplementation with vitamins
C and E inhibits the release of interleukin-6 from contracting human skeletal muscle. J Physiol. 2004;
558: 633–645. https://doi.org/10.1113/jphysiol.2004.066779 PMID: 15169848
31. Arts FJP, Kuipers H. The relation between power output, oxygen uptake and heart rate in male athletes.
Int J Sports Med. 1994; 15: 228–31. https://doi.org/10.1055/s-2007-1021051 PMID: 7960315
32. Carson ER, Cobelli C, Finkelstein L. The mathematical modeling of metabolic and endocrine systems:
model formulation, identification, and validation. New York: Wiley; 1983.
33. Morettini M, Sacchetti M, Cappozzo A, MazzàC. A mathematical model of interleukin-6 dynamics dur-
ing exercise. IFMBE Proceedings. 2015; 45: 431–434. https://doi.org/10.1007/978-3-319-11128-5_108
34. Keller C, Steensberg A, Pilegaard H, Osada T, Saltin B, Pedersen BK, et al. Transcriptional activation
of the IL-6 gene in human contracting skeletal muscle influence of muscle glycogen content. FASEB J.
2001; 15: 2748–2750. https://doi.org/10.1096/fj.01-0507fje PMID: 11687509
35. Steensberg A, Febbraio MA, Osada T, Schjerling P, van Hall G, Saltin B, et al. Interleukin-6 production
in contracting human skeletal muscle is influenced by pre-exercise muscle glycogen content. J Physiol.
2001; 537: 633–639. https://doi.org/10.1111/j.1469-7793.2001.00633.x PMID: 11731593
36. Leicht CA, Paulson TA, Goosey-Tolfrey VL, Bishop NC. Arm and intensity-matched leg exercise induce
similar inflammatory responses. Med Sci Sports Exerc. 2016; 48: 1161–1168. https://doi.org/10.1249/
MSS.0000000000000874 PMID: 26765632
37. Bell C, Paterson DH, Kowalchuk JM, Padilla J, Cunningham DA. A comparison of modelling techniques
used to characterise oxygen uptake kinetics during the on-transient of exercise. Exp Physiol. 2001; 86:
667–676. https://doi.org/10.1113/eph8602150 PMID: 11571496
38. LyngsøD, Simonsen L, Bulow J. Metabolic effects of interleukin-6 in human splanchnic and adipose tis-
sue. J Physiol. 2002; 543: 379–386. https://doi.org/10.1113/jphysiol.2002.021022 PMID: 12181308
39. Morettini M, Storm F, Sacchetti M, Cappozzo A, MazzàC. Effects of walking on low-grade inflammation
and their implications for Type 2 Diabetes. Prev Med Reports. 2015; 2: 538–547. https://doi.org/10.
1016/j.pmedr.2015.06.012 PMID: 26844115
Modeling IL-6 dynamics in exercise
PLOS ONE | https://doi.org/10.1371/journal.pone.0181224 July 12, 2017 11 / 12

40. Nauck M. Incretin therapies: highlighting common features and differences in the modes of action of glu-
cagon-like peptide-1 receptor agonists and dipeptidyl peptidase-4 inhibitors. Diabetes Obes Metab.
2016; 18: 203–216. https://doi.org/10.1111/dom.12591 PMID: 26489970
41. Kahn SE, Cooper ME, Del Prato S. Pathophysiology and treatment of type 2 diabetes: perspectives on
the past, present, and future. Lancet. 2014; 383: 1068–1083. https://doi.org/10.1016/S0140-6736(13)
62154-6 PMID: 24315620
42. Meier JJ. GLP-1 receptor agonists for individualized treatment of type 2 diabetes mellitus. Nature Rev
Endocrinol. 2012; 8: 728–742. https://doi.org/10.1038/nrendo.2012.140 PMID: 22945360
43. Baggio LL, Drucker DJ. Biology of incretins: GLP-1 and GIP. Gastroenterology. 2007; 132: 2131–2157.
https://doi.org/10.1053/j.gastro.2007.03.054 PMID: 17498508
44. Tura A, Muscelli E, Gastaldelli A, Ferrannini E, Mari A. Altered pattern of the incretin effect as assessed
by modelling in individuals with glucose tolerance ranging from normal to diabetic. Diabetologia. 2014;
57: 1199–1203. https://doi.org/10.1007/s00125-014-3219-7 PMID: 24658843
45. Burattini R, Morettini M. Identification of an integrated mathematical model of standard oral glucose tol-
erance test for characterization of insulin potentiation in health. Comput Methods Programs Biomed.
2012; 107: 248–261. https://doi.org/10.1016/j.cmpb.2011.07.002 PMID: 21803437
46. Salinari S, Bertuzzi A, Mingrone G. Intestinal transit of a glucose bolus and incretin kinetics: a mathe-
matical model with application to the oral glucose tolerance test. Am J Physiol Endocrinol Metab. 2011;
300: E955–E965. https://doi.org/10.1152/ajpendo.00451.2010 PMID: 21364121
47. Dalla Man C, Micheletto F, Sathananthan A, Rizza RA, Vella A, Cobelli C. A model of GLP-1 action on
insulin secretion in nondiabetic subjects. Am J Physiol Endocrinol Metab. 2010; 298: E1115–E1121.
https://doi.org/10.1152/ajpendo.00705.2009 PMID: 20179243
48. Silber HE, Frey N, Karlsson MO. An integrated glucose-insulin model to describe oral glucose tolerance
test data in healthy volunteers. J Clin Pharmacol. 2010; 50: 246–256. https://doi.org/10.1177/
0091270009341185 PMID: 19940230
49. Brubaker PL, Ohayon EL, D’Alessandro LM, Norwich KH. A mathematical model of the oral glucose tol-
erance test illustrating the effects of the incretins. Ann Biomed Eng. 2007; 35: 1286–1300. https://doi.
org/10.1007/s10439-007-9274-1 PMID: 17393338
Modeling IL-6 dynamics in exercise
PLOS ONE | https://doi.org/10.1371/journal.pone.0181224 July 12, 2017 12 / 12