a phase-based electrical plethysmography approach to ... · pdf file1 . a phase-based...
TRANSCRIPT

1
A phase-based electrical plethysmography approach to bladder
volume measurement
José Zariffa1,2, Vladimir Grouza1, Milos R. Popovic1,2 and Magdy M. Hassouna1,3,4
1. Toronto Rehabilitation Institute – University Health Network, Toronto, Ontario, Canada
2. Institute of Biomaterials and Biomedical Engineering, University of Toronto, Toronto,
Ontario, Canada
3. Toronto Western Hospital – University Health Network, Toronto, Ontario, Canada
4. Department of Surgery, Faculty of Medicine, University of Toronto, Toronto, Ontario,
Canada
J. Zariffa, V. Grouza, M.R. Popovic, and M.M. Hassouna "A Phase-Based Electrical Plethysmography Approach to Bladder Volume Measurement." Annals of biomedical engineering 44.4 (2016): 1299-1309. Author’s accepted version. The final publication is available at link.springer.com

2
Abstract
Neuromodulation approaches to treating lower urinary tract dysfunction could be substantially
improved by a sensor able to detect when the bladder is full. A number of approaches to this
problem have been proposed, but none has been found entirely satisfactory. Electrical
plethysmography approaches attempt to relate the electrical impedance of the bladder to its
volume, but have previously focused only on the amplitudes of the measured signals. We
investigated whether the phase relationships between sinusoidal currents applied through a
pair of stimulating electrodes and measured through a pair of recording electrodes could
provide information about bladder volume. Acute experiments in a rabbit model were used to
investigate how phase-to-volume or amplitude-to-volume regression models could be used to
predict bladder volumes in future recordings, with and without changes to the saline
conductivity. Volume prediction errors were found to be 6.63 + 1.12 ml using the phase
information and 8.32 + 3.88 ml using the amplitude information (p = 0.44 when comparing the
phase and amplitude results, n = 6), where the volume of the filled bladder was about 25 ml.
When a full/empty binary decision rule was applied based on the regression model, the
difference between the actual threshold that would result from this rule and the desired
threshold was found to be 4.24 + 0.65 ml using the phase information and 106.92 + 189.82 ml
using the amplitude information (p = 0.03, n = 6). Our results suggest that phase information
can form the basis for more effective and robust electrical plethysmography approaches to
bladder volume measurement.

3
Introduction
Lower urinary tract (LUT) dysfunction is a situation that can occur after a disruption to the
neural control of the bladder, for example after spinal cord injury (SCI), multiple sclerosis (MS),
stroke, diabetes and Parkinson’s disease. LUT dysfunction can manifest itself as impairments of
the two main functions of the bladder, namely storage of urine and micturition (voiding) [1].
These impairments in turn can result in compromised renal function and repeated urinary tract
infections, leading to increased morbidity and mortality. These symptoms are highly
detrimental to the quality of life of the affected individuals. For example, after SCI, individuals
with paraplegia have reported that recovery of bladder and bowel functions is their second
highest priority, after sexual function [2].
A number of treatment modalities exist for LUT dysfunction, most notably pharmacological
intervention, surgery (denervation or augmentation procedures), behavioral therapy, and sacral
neuromodulation [3]. Indications for sacral neuromodulation have included urge incontinence,
urge frequency, and nonobstructive urinary retention [1, 4, 5]. Neuromodulation techniques
use electrical stimulation to directly alter activity in the neural circuitry of the bladder, and are
appealing because they can be applied via minimally invasive interventions and avoid the side-
effects that can occur with pharmacotherapy [6].
Neuromodulation systems dedicated for impaired voiding generally require the user to
manually activate the device in order to induce voiding. Similarly, neuromodulation systems

4
dedicated for incontinence inhibit the voiding function most of the time by stimulating the
storage function of the bladder, but again require manual intervention when voiding is
required. In individuals who have impaired bladder sensation and cannot detect when the
bladder is full (e.g. after SCI), the voiding is performed at regular intervals, which has two
drawbacks: (i) the user’s quality of life is reduced by the need to adhere to a rigid voiding
schedule that depends mainly on the fluid consumption, and (ii) if the bladder fills too much
before the scheduled voiding time, the high bladder pressures may result in kidney damage.
Neuromodulation systems for LUT dysfunction could therefore be improved by incorporating
implanted sensors that can monitor bladder volume reliably and accurately, and allow users to
activate voiding only when needed. A number of different approaches have been suggested for
monitoring bladder volume, highlighting the clinical importance of this goal, but so far no
method has been found to be entirely satisfactory for chronic use in humans [7].
Intravesical pressure measurement has been suggested as a surrogate for bladder volume, and
can be measured using pressure transducers attached to the bladder wall. This method is
limited by the complex relationship between bladder volume and intravesical pressure, by the
difficulty of achieving stable placement of the sensors over long periods of time, and by its
susceptibility to movement artifacts [8-10]. Strain-gauge plethysmography offers to measure
the bladder volume by using sensors that measure deformations on the outer wall of the
bladder, which occur as a result of distention or contraction. The challenge in this method is to
develop sensitive and biocompatible sensors that can remain in place over long periods of time
and provide accurate information despite the irregular and variable shape of the bladder [11].
Wearable ultrasound devices have also been used to measure bladder volume. Although the
5
technique works under well-controlled conditions, it is sensitive to probe movement, posture
and interfering factors such as bowel function [12, 13]. An implantable miniaturized ultrasound
probe was explored in an animal model in 2004 [14], but to the best of our knowledge has not
been tested clinically.
Electroneurographic signals have also been proposed to monitor bladder volume. The
extraction of bladder information from peripheral nerve recordings using nerve cuffs has been
demonstrated in a number of animal models [15-19] as well as in humans [20]. Whereas many
of these studies focused on detecting bladder contractions, bladder volume information is
more tonic in nature and has proven more difficult to detect reliably. Jezernik et al. and
Kurstjens et al. in separate studies obtained partial success in obtaining bladder volume
information (in pig and human, respectively), but both noted that these recordings were more
difficult to obtain reliably than bladder contraction signals [18, 20]. Recent studies by Bruns et
al. demonstrated that bladder afferent information could also be extracted from the dorsal root
ganglia of the sacral roots using microelectrode arrays [21], though the chronic viability in
humans of these devices has not yet been established. Mendez et al. have demonstrated that
bladder volume information can be extracted from afferent activity in the sacral roots, using
recordings from dissected fine filaments, but the potential of this method to be translated
clinically is currently uncertain [22].
Electrical impedance plethysmography functions by using a pair of electrodes to inject current
into the bladder, either non-invasively through the abdominal wall or using implanted
6
electrodes placed directly on the bladder wall. This process gives information about the
electrical impedance of the bladder, which is related to its volume. On the other hand, this
relationship has been found by many investigators to be weak. The effectiveness of electrical
impedance plethysmography has further been found to be limited by a number of confounding
factors, including electrode placement, the variable conductivity of urine, and body fat [23-28].
The previous studies that have examined the electrical impedance of the bladder using
implanted electrodes have focused on the resistance component of the impedance [25, 26, 28].
As the bladder fills with urine and the distance between the electrodes changes, however, it is
possible that capacitive effects will also play a role and lead to a change in the reactance
component as well. These effects may in turn be manifested as changes in the phase
relationships between an injected current sinusoid and the waveforms measured by pairs of
recording electrodes on the bladder wall. The objective of this study was to determine whether
such phase relationships can provide information about bladder volume, and whether this
relationship is robust in the presence of confounding factors that have been shown to reduce
the usefulness of resistance-based predictions, in particular variations in urine composition.
Materials and Methods
Nine adult male New Zealand white rabbits (Charles River Laboratories, MA, USA) were used in
this study, weighing approximately 3.6 kg on average. Incomplete datasets were obtained in 3

7
rabbits, and so in the following we report data from 6 rabbits. All procedures were approved by
the University of Toronto Animal Care Committee.
Surgical Methods and Data Acquisition
The rabbits were given glycopyrrolate and acepromazine via subcutaneous injection, following
which anesthesia was induced using isoflurane. Anesthesia was maintained continuously
throughout the experiment with inhaled isoflurane (2%). Hydration was maintained using an
intravenous catheter introduced into the marginal ear vein. Blood gases (SpO2) and heart rate
were continuously monitored using a pulse oximeter. The rabbit was placed on a circulating
warm water pad. A midline abdominal incision was used to gain access to the lower abdominal
cavity. A urinary catheter (3.5 Fr) was inserted through the urethra and its location inside the
bladder confirmed by visual inspection. The bladder was voided manually and the other end of
the catheter was attached to a 30cc syringe filled with room temperature saline (0.9%). The
bladder was then gently exposed and kept out of the abdominal cavity via the abdominal
incision. EEG Electrodes (Chalgren Entreprises, CA, USA) loaded with electrolyte paste were
attached to the bladder dome using VetBond tissue adhesive such that the adhesive formed a
good seal around the circular electrode perimeter. Either three (n=2) or four (n=4) electrode
pairs were attached to the bladder, depending on the surface area available. Stimulating
electrodes were always placed closest to the bladder neck, while consecutive pairs of recording
electrodes were positioned towards the apex (Fig. 1a). The electrodes were attached while the
bladder was full, in order to facilitate the placement procedure. A reference needle electrode

8
(Ambu Neuroline monopolar needle, Denmark) was placed in muscle tissue in the abdominal
cavity adjacent to the bladder. The bladder was covered with a gauze pad which was wetted
periodically with saline throughout the experiment to prevent the bladder from drying out.
A function generator (33220A, Agilent, CA, USA) was connected to the stimulating electrodes
via an analog stimulus isolator (Model 2200, A-M Systems, WA, USA). The function generator
was used to pass 50mV peak-to-peak sine waves of 250 Hz, 500 Hz, 750 Hz, 1 kHz, 2kHz, 3 kHz,
4kHz, 5 kHz, 6 kHz and 7 kHz across the bladder (in the first of the 6 rabbits, only stimuli from 1
kHz to 7 kHz were used). Each stimulation period lasted 10 seconds. The order of the frequency
applied was randomized in 3 rabbits in order to avoid confounding the stimulation frequency
variable with time; in the other 3 rabbits the frequencies were applied in increasing order.
Current flowing through the stimulating electrodes was measured by placing a 1 Ohm resistor
in series between the isolator and the positive stimulating electrode and recording the
potential difference across the resistor. This potential was amplified 1000x using a DC-amplifier
(ETH-256C, iWorx Systems, Inc., NH, USA) before being recorded by the data acquisition system.
Signals from individual recording electrodes were acquired vs. the remote reference, and the
potential difference across each pair of recording electrodes was then computed (Fig. 1b). All
signals were sampled at 30 kHz and acquired using a Cerebus Data Acquisition System
(Blackrock Microsystems, Utah).
The experiment was completed in three sets. Starting with a completely empty bladder, the
bladder was sequentially filled to 5, 10, 15, 20, and 25 ml, and a complete frequency sweep
9
performed at each step (including empty). The injections were performed manually, at a rate of
approximately 10-20 seconds per 5 ml. The bladder’s distension during each step occurred
smoothly. Following the completion of the first frequency/volume set (hereafter referred to as
Set 1), the syringe was removed and the bladder was allowed to drain passively. The
experiment was repeated after one hour in order to investigate the effect of potentially time-
varying properties of the electrode/bladder interface (Set 2). Finally, the experiment was
repeated immediately after Set 2 with a higher concentration of saline (~2%) in order to
investigate effect of changes in urine conductivity on the measurements (Set 3).
Extraction of amplitude and phase information
Following acquisition, all data were imported into MATLAB for offline analysis. The acquired
sinusoidal waveforms from the stimulation and recording electrodes were filtered with a 10th
order Butterworth bandpass filter with corner frequencies of +/- 100 Hz of the stimulation
frequency for each trial. A forward-backward application of the filter was used to achieve zero
phase distortion. Next, the power spectra of the “input” (stimulating) electrode and “output”
(recording) electrodes were computed using Welch's modified periodogram. This was done by
dividing each signal into 16 non-overlapping segments, windowing with a Hanning window, and
averaging the result. The amplitude of each sine wave at the stimulation frequency was
recovered by integrating the power spectra at 10 indices about the center of the stimulation
frequency band, multiplying by the frequency increment, and adjusting for digitization and
windowing effects (Eq. 1):
10
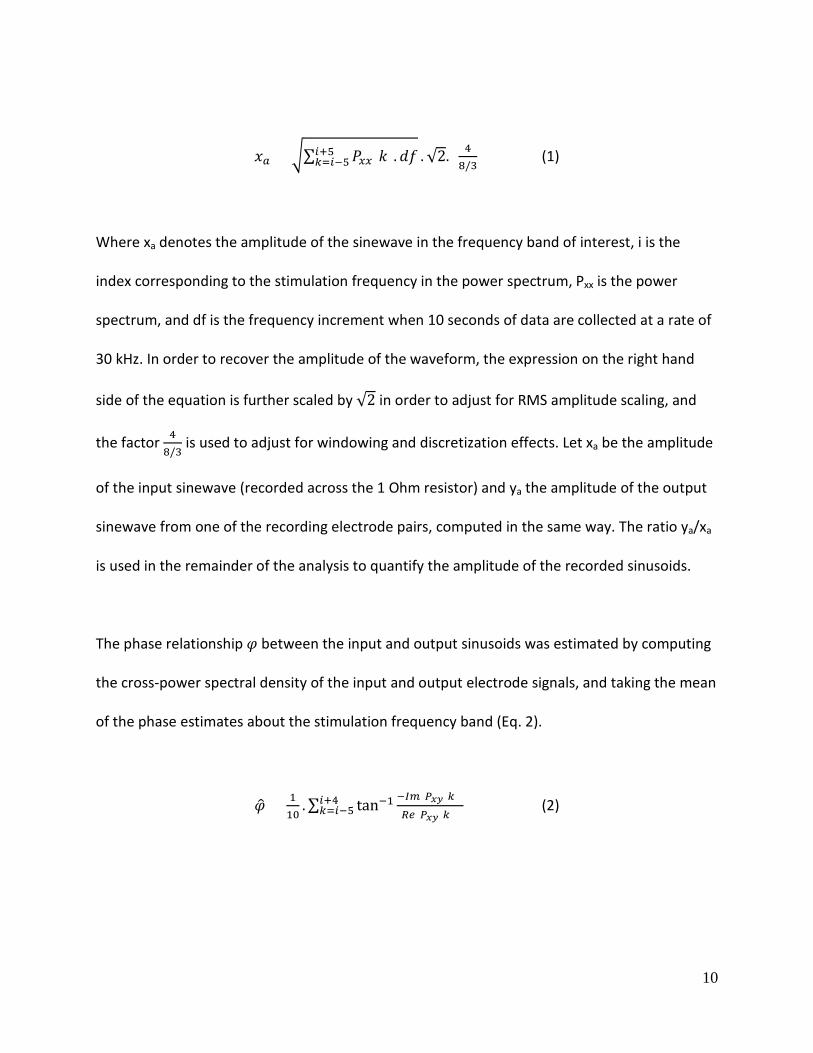
𝑥𝑥𝑎𝑎 = �∑ 𝑃𝑃𝑥𝑥𝑥𝑥[𝑘𝑘].𝑑𝑑𝑑𝑑𝑖𝑖+5𝑘𝑘=𝑖𝑖−5 .√2. ( 4
8/3) (1)
Where xa denotes the amplitude of the sinewave in the frequency band of interest, i is the
index corresponding to the stimulation frequency in the power spectrum, Pxx is the power
spectrum, and df is the frequency increment when 10 seconds of data are collected at a rate of
30 kHz. In order to recover the amplitude of the waveform, the expression on the right hand
side of the equation is further scaled by √2 in order to adjust for RMS amplitude scaling, and
the factor 48/3
is used to adjust for windowing and discretization effects. Let xa be the amplitude
of the input sinewave (recorded across the 1 Ohm resistor) and ya the amplitude of the output
sinewave from one of the recording electrode pairs, computed in the same way. The ratio ya/xa
is used in the remainder of the analysis to quantify the amplitude of the recorded sinusoids.
The phase relationship 𝜑𝜑 between the input and output sinusoids was estimated by computing
the cross-power spectral density of the input and output electrode signals, and taking the mean
of the phase estimates about the stimulation frequency band (Eq. 2).
𝜑𝜑� = 110
.∑ tan−1 −𝐼𝐼𝐼𝐼(𝑃𝑃𝑥𝑥𝑥𝑥[𝑘𝑘])𝑅𝑅𝑅𝑅(𝑃𝑃𝑥𝑥𝑥𝑥[𝑘𝑘])
𝑖𝑖+4𝑘𝑘=𝑖𝑖−5 (2)
11
Volume prediction
Relationships between phase and bladder volume and between amplitude and bladder volume
were established based on the data in Set 1, then used to predict bladder volume in Sets 2 and
3.
A linear regression was applied in each case to obtain a relationship of the form shown in
Equation 3.
𝑣𝑣𝑓𝑓,𝑅𝑅 = 𝑐𝑐1,𝑓𝑓,𝑅𝑅𝑥𝑥𝑓𝑓,𝑅𝑅 + 𝑐𝑐2,𝑓𝑓,𝑅𝑅 (3)
where the subscripts f and e refer to the stimulation frequency and recording electrode pair
used, respectively, 𝑣𝑣𝑓𝑓,𝑅𝑅 is the volume in milliliters, 𝑥𝑥𝑓𝑓,𝑅𝑅 is either the amplitude or the phase
(depending on the variable being examined), and the 𝑐𝑐1,𝑓𝑓,𝑅𝑅 and 𝑐𝑐2,𝑓𝑓,𝑅𝑅 are the regression
coefficients.
Bladder volumes in Set 2 and Set 3 were predicted using the regression obtained from Set 1 and
the phase or amplitude values measured in Sets 2 and 3, respectively. The root-mean-square
(RMS) value of the prediction error was computed and used to evaluate the quality of the
prediction. In each rabbit, in order to select the best combination of stimulation frequency and
electrode pair, the RMS values produced by the Set 1 regression in Set 1, Set 2 and Set 3 were
12
averaged, for each frequency/electrode combination. The frequency/electrode combination
producing the lowest average RMS value was selected. However, the error reported below is
the average only of the RMS values in Set 2 and Set 3.
Threshold determination
The motivation for obtaining information about the bladder volume is to create a sensor that
can detect bladder fullness and inform the user that voiding is needed. Thus, in some cases, the
objective is not to predict bladder volume as precisely as possible, but rather to develop a
robust binary decision rule to distinguish “full” and “empty” bladder states.
We used the Set 1 regression models developed in the volume prediction step to select a phase
or amplitude value corresponding to a desired volume threshold. Unless specified otherwise,
the volume threshold was set to 15 ml, corresponding to approximately 60% of the bladder
capacity. The phase or amplitude value obtained was then used to predict a volume threshold
using the regression models derived for Sets 2 and 3. The absolute difference between the
actual threshold obtained using this phase or amplitude value and the desired threshold value
(15 ml) was used as our error metric (Fig. 2). For example, if the desired threshold is 15 ml, but
the selected phase (or amplitude) value is such that the “full” decision will actually be reached
at 18 ml, then the threshold error is 3 ml. The mean of the error value for Set 2 and Set 3 was
computed for each combination of stimulation frequency and electrode pair, and the
combination yielding the lowest mean error was selected.
13
Statistical analysis
In order to compare the performance of the amplitude and phase predictions, Wilcoxon signed-
rank tests were applied for each error metric, with the significance level set at 0.05. Comparing
regression coefficients of determination between Sets 1, 2 and 3 was accomplished using a
Friedman test. Post-hoc comparisons were conducted using pair-wise Wilcoxon signed-rank
tests with Bonferroni correction.
Results
Volume prediction
We first investigated how well the phase and amplitude measurements could be used to
predict bladder volumes in the presence of changes in electrode impedance (due to time) and
saline conductivity. We further examined if there was a significant difference in the
performance of phase and amplitude for this task. An example of the sinusoidal waveforms
obtained is provided in Figure 3.
We first examined the quality of the linear regression models build using the phase
information. The coefficients of determination (R2) for the phase regression models across all
rabbits, stimulation frequencies and electrode pairs had a mean (+ standard deviation) of 0.64 +

14
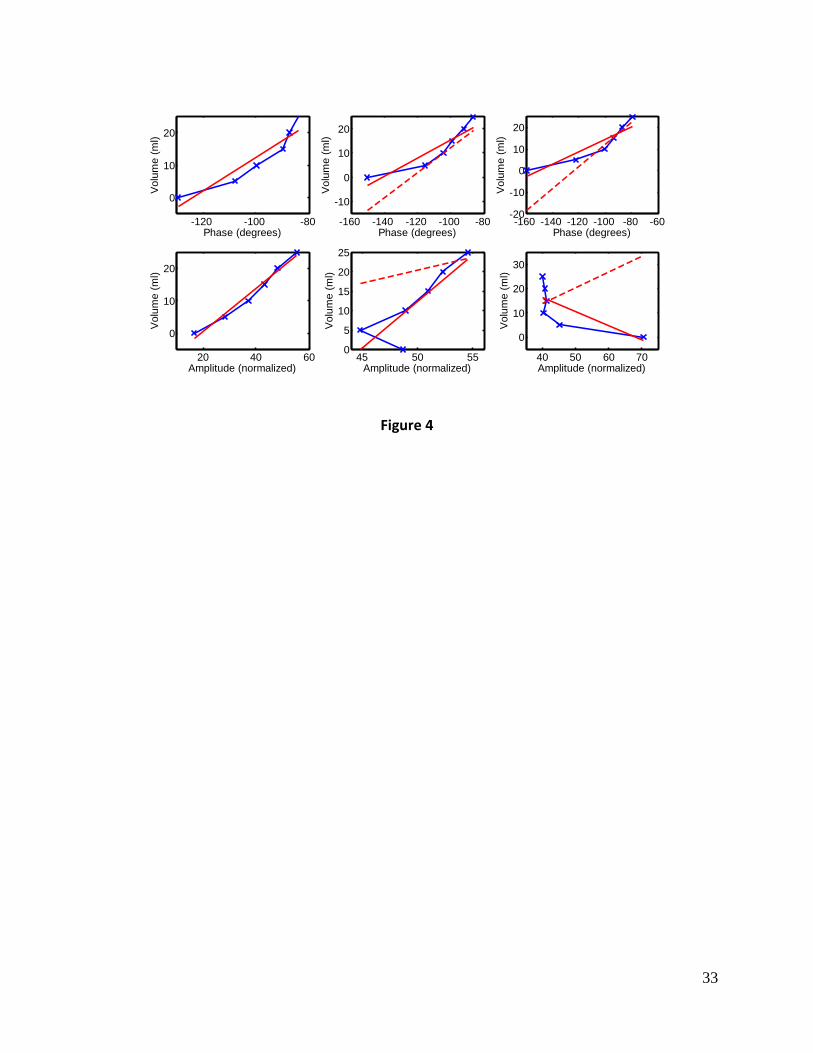
0.32 for Set 1, 0.58 + 0.31 for Set 2, and 0.52 + 0.32 for Set 3. An example of a phase to volume
relationship is provided in Fig. 4. A Friedman test revealed a significant difference between the
R2 statistics on the three sets (χ2(2) = 10.8, p = 0.0046). Post-hoc comparisons found a
significant difference only between Set 1 and Set 3 (p = 0.0018).
We next examined the volume prediction error based on the regression models developed
above. The mean RMS value of the prediction error in Set 1, Set 2 and Set 3 was used to select a
stimulation frequency and electrode pair for each rabbit. The selected combination for each
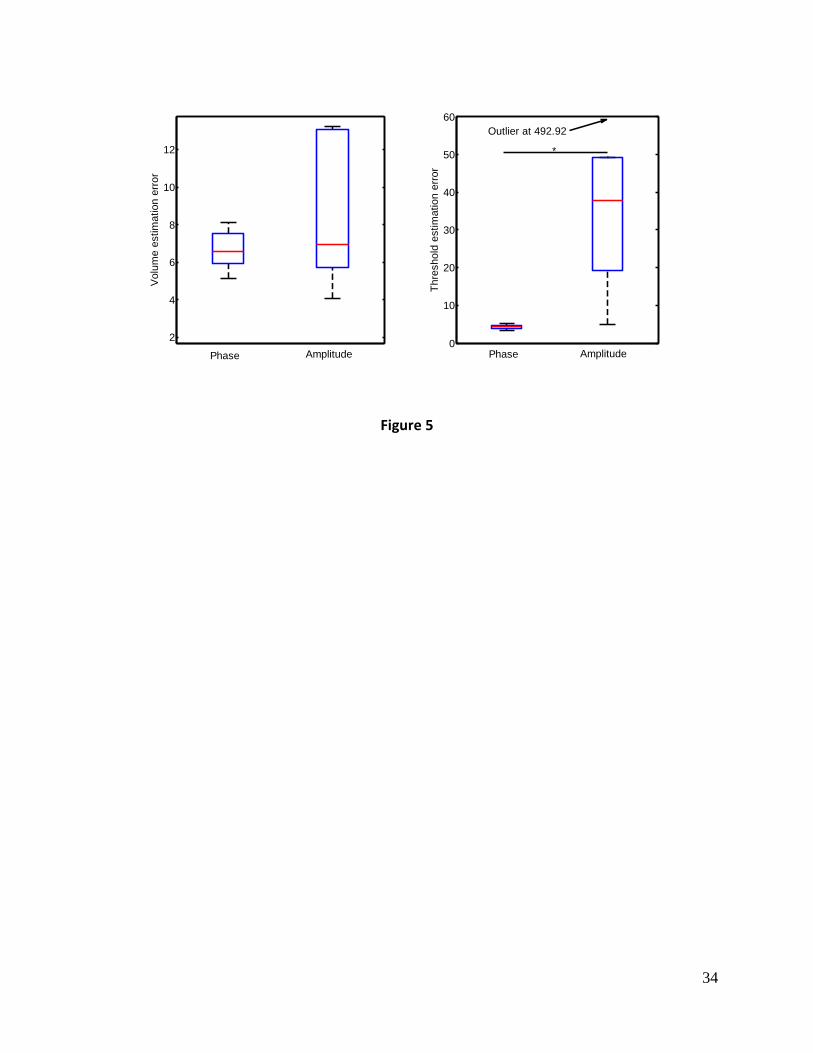
rabbit is provided in Table 1. Using these combinations, the mean volume prediction error in
Set 2 and Set 3 across all rabbits was 6.63 + 1.12 ml (Fig. 5), out of a bladder capacity of
approximately 25 ml.
These procedures were repeated for the amplitude regression models. The R2 statistics across
all rabbits, stimulation frequencies and electrode pairs had a mean of 0.59 + 0.34 for Set 1, 0.60
+ 0.27 for Set 2, and 0.57 + 0.24 for Set 3. An example amplitude to volume relationship is
provided in Fig. 4. An Friedman test found no significant differences between the three sets
(χ2(2) = 0.57, p = 0.75).
The selected combination of frequency and electrode pair for each rabbit using the amplitude
regression models is provided in Table 1. Using these combinations, the mean volume
prediction error in Set 2 and Set 3 across all rabbits was 8.32 + 3.88 ml (Fig. 5).

15
We compared the performance of the phase and amplitude approaches. When only the best-
performing frequency-electrode combinations in each rabbit were considered, the volume
prediction errors using the phase regressions was not significantly different from the errors
using the amplitude regressions (p = 0.44 in a Wilcoxon signed-rank test, n = 6). However,
when all frequency-electrode combinations were considered, the phase regressions gave
significantly lower volume prediction errors than the amplitude regressions (16.88 + 19.37 ml vs
23.71 + 20.91 ml, p < 0.001 in a Wilcoxon signed-rank test with n = 151).
Threshold determination
Our second step was to investigate how well the phase and amplitude measurements could be
used to obtain an empty/full binary decision rule, and to compare the performance of the two
approaches for this task.
First using the phase regressions, the mean fullness threshold error in Set 2 and Set 3 (for a
target threshold of 15 ml) was used to select a stimulation frequency and electrode pair for
each rabbit. The selected combination for each rabbit is provided in Table 1. Using these
combinations, the mean threshold error across all rabbits based on the phase regressions was
4.24 + 0.65 ml.

16
Next, using the amplitude regression models, the combinations of frequency and electrode
pairs selected are also provided in Table 1. Using these combinations, the mean volume
threshold error across all rabbits using the amplitude regressions was 106.93 + 189.82 ml (Fig.
5). Note that the threshold error may be larger than the actual bladder volume (25 ml) if the
linear regression on the Set 2 (or Set 3) data is poor or very different than the Set 1 regression:
the amplitude threshold selected from Set 1 may not be in the range of amplitudes actually
observed in Set 2 (or Set 3), leading to a predicted volume that could be outside the range 0-25
ml. Notably, as can be seen in Fig. 5, there is one large outlier in the amplitude threshold
estimation results; if this value is excluded, the mean volume threshold error becomes 29.73 +
18.57 ml.
We compared the performance of the phase and amplitude approaches. When only the best-
performing frequency-electrode combinations in each rabbit were considered, the threshold
errors using the phase regressions was significantly lower than the errors using the amplitude
regressions (p = 0.03 in a Wilcoxon signed-rank test, n = 6; if the outlier discussed in the
previous paragraph is excluded, significance is narrowly missed with p = 0.06, n = 5). Likewise,
when all frequency-electrode combinations were considered, the phase regressions gave
significantly lower threshold errors than the amplitude regressions (14.97 + 16.70 ml vs 26.37 +
46.51, p < 0.001 in a Wilcoxon signed-rank test with n = 151).

17
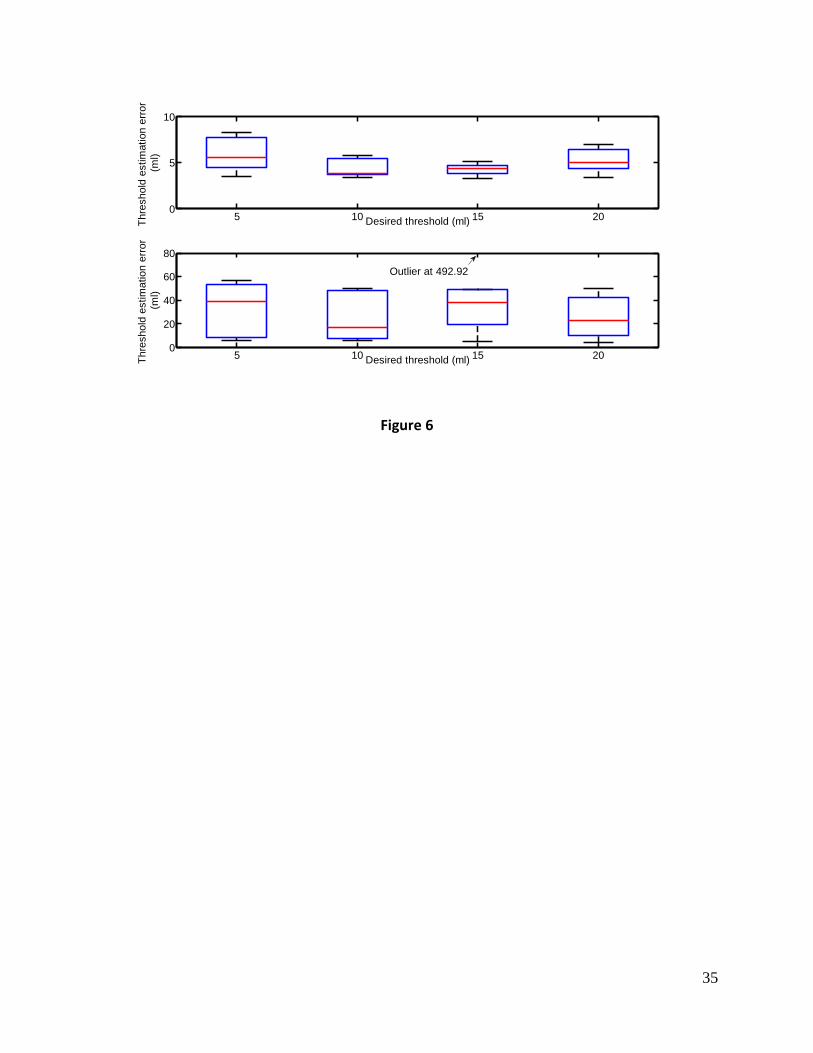
The variations in the threshold errors as a function of the desired threshold are shown in Fig. 6
(using the best frequency-electrode combination for each rabbit). The choice of threshold was
not found to qualitatively affect any of the conclusions that can be drawn from our analysis.
Discussion
We evaluated the accuracy of bladder volume estimation using a phase-based electrical
plethysmography approach. By injecting a sinusoidal waveform through a pair of stimulating
electrodes, and measuring from pairs of recording electrodes placed on the outside of the
bladder wall, we found clear relationships between the phase shift in the recorded sinusoid and
the volume of saline in the bladder. The phase-based estimation was found to be more
accurate than estimation based on the amplitude of the recorded sinusoids.
The most important difference was found when a binary empty/full decision rule was derived
based on the regression models. With the phase information, a threshold error of 4.24 + 0.65
ml was obtained, corresponding to approximately 15% of the bladder volume. This error is well
within the range of clinical relevance for this application, since a 15% error would still be able to
provide a user with very meaningful feedback about when they need to void their bladder. With
the amplitude regression models, the threshold errors were very large and did not suggest any
translational potential.
18
Importantly, the phase-based approached provided improved performance even in the
presence of variations in the concentration of the saline. This was particularly evident when the
volume threshold metric was used (4.24 + 0.65 ml threshold error, as discussed in the previous
paragraph). Variations in urine conductivity have previously been reported to have a significant
impact on the performance of impedance-based volume estimation methods [25], and are
considered to be an important obstacle to the robustness of implanted bladder volume
estimation devices in a chronic in vivo situation [7]. Previous studies examined only the
relationship of the amplitude with bladder volume [25, 26, 28]. Our study is the first to
examine whether the phase information might also be useful for predicting bladder volume.
Thus, the finding that phase information can help overcome changes in urine conductivity is
novel and has high clinical relevance.
Interestingly, there was found to be a significant difference in the R2 values of the Set 1 and Set
3 phase regression models, but not for the amplitude regressions. This suggests that the saline
conductivity had a stronger effect of the linearity of the relationship with the phase models.
Nonetheless, as discussed above, the phase models yielded better volume predictions and
considerably better threshold estimations. This finding suggests that, although the phase
relationship became less linear with changes in conductivity, the approximate range of the
phase values was not dramatically different between Set 1 and Set 3, such that meaningful
volume predictions remained possible. With the amplitude models, on the other hand, the
range of the values measured shifted in Sets 2 and 3, making volume prediction difficult. As
19
illustrated by the example in Figure 4, there was also more variability in the shape of the
amplitude response, further complicating amplitude-based predictions.
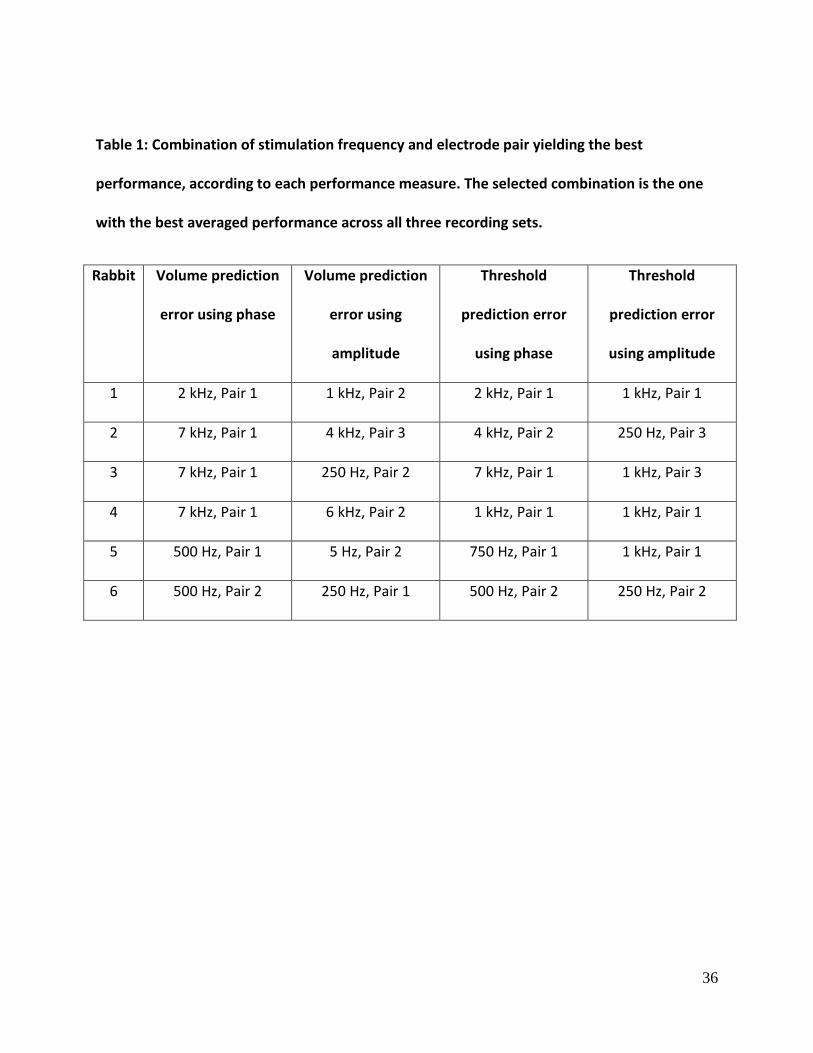
Examining the combinations of stimulation frequency and electrode pair that yielded the best
performance for each rabbit and performance metric did not reveal any obvious trends (Table
1). This suggests that selecting these parameters a priori will likely not be possible, and that
some type of calibration process will be required for the electrode site and the stimulation
parameters. The reasons for the heterogeneity of these results are not certain, but are likely
related to inter-subject variations in the anatomy and electrical properties of the bladder, the
exact placement of the electrodes, and the contact impedance achieved when attaching the
electrodes.
We considered only univariate regression models linking the volume to the phase or amplitude
from a single recording electrode pair. It is possible that multiple regression approaches
combining phase and amplitude information from one or several recording pairs may improve
performance. However, as the number of predictor variables increases, so does the amount of
data points needed to avoid overfitting the model. The dataset used in this study is not large
enough to support an investigation into multivariate models, and the issue has therefore not
been explored here. On the other hand, as mentioned above, even with a single variable model
there will be a need for a calibration procedure when the method is implemented in a chronic
application. In a multivariate model the amount of calibration or training data would be
substantially higher. If the encouraging results presented here are found to translate well to
20
chronic studies, it is not certain that any performance improvements that can be derived from
multivariate models would be worth the added complexity of implementation. Similarly,
nonlinear univariate models would require a consistent response shape between experiments
and sets in order to justify a particular model form. Given the variability that we observed,
there was not sufficient justification for choosing a nonlinear model, and we opted to for the
simplicity of the linear model.
One limitation of this study is the use of a small animal model. The rabbit bladders were filled
to only 25 ml. Gill et al. previously reported that the performance of an impedance-based
bladder volume estimation method (using amplitude) decreased at higher volumes as the
relationship became non-linear [25]. It will be crucial to investigate the variations of the phase
information for bladder volumes up to the 400-600 ml range and characterize the phase-to-
volume relationship in more detail. This will require future studies in larger models. Note that a
non-linear relationship is not an obstacle to a reliable system, if that relationship can be well
characterized.
Another potential limitation is that the use of sinusoidal stimulation in the kilohertz range may
lead to nerve block effects [29] and alter the behavior of the physiological system. However, it
is important to note that the stimulation would not need to be applied continuously. A few
seconds of stimulation every few minutes would be sufficient to obtain a measurement and
make a decision on whether the bladder has exceeded a fullness threshold. It is unlikely that

21
this type of relatively infrequent stimulation would have any deleterious effects due to nerve
block, but this will have to be confirmed in future studies.
It is possible that the conclusions presented here may have been affected by the fact that the
bladder was outside the abdomen. With the bladder re-inserted, leakage currents through the
bladder wall to surrounding tissues may exist and complicate the relationship between the
applied and measured sinusoidal waveforms. Re-inserting the bladder into the abdomen was
not possible with the current version of our instrumentation, but will need to be explored in
future work. Additionally, because Set 1 was performed immediately after placing the
electrodes, it is possible that a transient settling period of the electrode-tissue interface may
have accounted for the different amplitude ranges observed between Set 1 and Set 2. Although
this eventuality will have to be investigated in more detail in future work, even if such a
transient effect was present, the fact would remain that the phase-based approach was more
robust than the amplitude-based approach to these variations in the electrode-tissue interface.
Recent studies have demonstrated that recordings of afferent neural signals can be used to
extract information about bladder volume. Recording sites have included dissected filaments in
the sacral roots [22], the sacral dorsal root ganglia [30], the pudendal nerve [31], and the spinal
cord [32]. The use of afferent recordings is appealing because it is taking advantage of
information naturally present in the physiological system, in contrast to the artificial
perturbations on which electrical impedance-based measures rely. On the other hand, none of
the afferent recording methods that have been proposed have a clear potential for clinical
22
translation. The surgeries involved are generally complex, and the chronic stability of the
recordings has not been demonstrated. Methods based on sensors placed on the bladder wall,
such as the one proposed here, may be more easily implemented in humans. The use of
artificial signals is also likely to provide more robust recordings over time than natural neural
signals with low signal-to-noise ratio and high sensitivity to small electrode movements.
However, future chronic studies in larger models are needed to confirm this.
Electrical plethysmography approaches to bladder volume measurement and fullness detection
can be improved by the use of the phase information in sinusoidal stimulation waveforms.
Accurate estimation of a fullness threshold (to within approximately 15% of bladder capacity)
was achieved even in the presence of large changes in the composition of the saline. These
findings suggest that an implanted sensor based on phase-based electrical plethysmography is a
promising solution to the problem of bladder fullness detection in neuromodulation systems for
LUT dysfunction, with a high translational potential.
Acknowledgments
This work was supported by the Physicians’ Incorporated Services Foundation (grant #12-30), as
well as by the Centre for Research in Advanced Neural Implant Applications (CRANIA) at the
University of Toronto. The authors wish to thank Rainer de Guzman for his help with the
experiments.

23
References
[1] M. S. Elkelini, A. Abuzgaya and M. M. Hassouna, "Mechanisms of action of sacral
neuromodulation," Int. Urogynecol. J. Pelvic Floor Dysfunct., vol. 21 Suppl 2, pp. S439-46, Dec,
2010.
[2] K. D. Anderson, "Targeting recovery: priorities of the spinal cord-injured
population," J. Neurotrauma, vol. 21, pp. 1371-1383, Oct, 2004.
[3] I. Milsom, P. Abrams, L. Cardozo, R. G. Roberts, J. Thuroff and A. J. Wein, "How widespread
are the symptoms of an overactive bladder and how are they managed? A population-based
prevalence study," BJU Int., vol. 87, pp. 760-766, Jun, 2001.
[4] M. Elkelini and M. M. Hassouna, "Canadian experience in sacral
neuromodulation," Urol. Clin. North Am., vol. 32, pp. 41-49, Feb, 2005.
[5] M. J. McGee, C. L. Amundsen and W. M. Grill, "Electrical stimulation for the treatment of
lower urinary tract dysfunction after spinal cord injury," J. Spinal Cord Med., vol. 38, pp. 135-
146, Mar, 2015.
[6] A. J. Wein, "Pharmacologic options for the overactive bladder," Urology, vol. 51, pp. 43-47,
Feb, 1998.
[7] A. Mendez and M. Sawan, "Chronic monitoring of bladder volume: a critical review and
assessment of measurement methods," Can. J. Urol., vol. 18, pp. 5504-5516, Feb, 2011.
24
[8] K. Takayama, M. Takei, T. Soejima and J. Kumazawa, "Continuous monitoring of bladder
pressure in dogs in a completely physiological state," Br. J. Urol., vol. 60, pp. 428-432, Nov,
1987.
[9] E. L. Koldewijn, P. E. Van Kerrebroeck, E. Schaafsma, H. Wijkstra, F. M. Debruyne and G. S.
Brindley, "Bladder pressure sensors in an animal model," J. Urol., vol. 151, pp. 1379-1384,
May, 1994.
[10] J. Coosemans and R. Puers, "An autonomous bladder pressure monitoring
system," Sensors & Actuators: A. Physical, vol. 123, pp. 155-161, 2005.
[11] S. Rajagopalan, M. Sawan, E. Ghafar-Zadeh, O. Savadogo and V. P. Chodavarapu, "A
Polypyrrole-based Strain Sensor Dedicated to Measure Bladder Volume in Patients with Urinary
Dysfunction," Sensors, vol. 8, pp. 5081-5095, 2008.
[12] P. Petrican and M. A. Sawan, "Design of a miniaturized ultrasonic bladder volume monitor
and subsequent preliminary evaluation on 41 enuretic patients," IEEE Trans. Rehabil. Eng., vol.
6, pp. 66-74, Mar, 1998.
[13] N. K. Kristiansen, J. C. Djurhuus and H. Nygaard, "Design and evaluation of an ultrasound-
based bladder volume monitor," Med. Biol. Eng. Comput., vol. 42, pp. 762-769, Nov, 2004.
[14] C. Seif, B. Herberger, E. Cherwon, F. J. Martinez Portillo, M. Molitor, T. Stieglitz, G. Bohler,
S. Zendler, K. P. Junemann and P. M. Braun, "Urinary bladder volumetry by means of a single
25
retrosymphysically implantable ultrasound unit," Neurourol. Urodyn., vol. 23, pp. 680-684,
2004.
[15] S. Jezernik, W. M. Grill and T. Sinkjaer, "Neural network classification of nerve activity
recorded in a mixed nerve," Neurol. Res., vol. 23, pp. 429-434, Jul, 2001.
[16] S. Jezernik, W. M. Grill and T. Sinkjaer, "Detection and inhibition of hyperreflexia-like
bladder contractions in the cat by sacral nerve root recording and electrical
stimulation," Neurourol. Urodyn., vol. 20, pp. 215-230, 2001.
[17] B. J. Wenzel, J. W. Boggs, K. J. Gustafson and W. M. Grill, "Detecting the onset of hyper-
reflexive bladder contractions from the electrical activity of the pudendal nerve," IEEE
Trans. Neural Syst. Rehabil. Eng., vol. 13, pp. 428-435, Sep, 2005.
[18] S. Jezernik, J. G. Wen, N. J. Rijkhoff, J. C. Djurhuus and T. Sinkjaer, "Analysis of bladder
related nerve cuff electrode recordings from preganglionic pelvic nerve and sacral roots in
pigs," J. Urol., vol. 163, pp. 1309-1314, Apr, 2000.
[19] G. A. M. Kurstjens, A. L. Dalmose, M. Haugland, N. J. M. Rijkhoff and T. Sinkjær, "Long-term
electroneurographic recordings from nerve cuff electrodes on sacral nerve root in
pigs," Proc. 6th Ann. Conf. IFESS, pp. 22-24, 2001.
[20] G. A. Kurstjens, A. Borau, A. Rodriguez, N. J. Rijkhoff and T. Sinkjaer, "Intraoperative
recording of electroneurographic signals from cuff electrodes on extradural sacral roots in
spinal cord injured patients," J. Urol., vol. 174, pp. 1482-1487, Oct, 2005.
26
[21] T. M. Bruns, R. A. Gaunt and D. J. Weber, "Multielectrode array recordings of bladder and
perineal primary afferent activity from the sacral dorsal root ganglia," J. Neural Eng., vol. 8, pp.
056010, Oct, 2011.
[22] A. Mendez, M. Sawan, T. Minagawa and J. J. Wyndaele, "Estimation of bladder volume
from afferent neural activity," IEEE Trans. Neural Syst. Rehabil. Eng., vol. 21, pp. 704-715, Sep,
2013.
[23] J. Abbey and L. Close, "Electrical impedance measurement of urinary bladder
fullness," J. Microw. Pow., vol. 18(3), pp. 305-309, 1983.
[24] A. Yamada, M. Fuse, T. Aoyagi, H. Hosaka, H. Toma and H. Yanagisawa, "Preventive
equipment for urinary incontinence: a device employing lower abdominal impendance
changes," Int. J. Artif. Organs, vol. 17, pp. 146-150, Mar, 1994.
[25] B. C. Gill, P. C. Fletter, P. J. Zaszczurynski, A. Perlin, D. Yachia and M. S. Damaser,
"Feasibility of fluid volume conductance to assess bladder volume," Neurourol. Urodyn., vol.
27, pp. 525-531, 2008.
[26] B. Provost and M. Sawan, "Proposed new bladder volume monitoring device based on
impedance measurement," Med. Biol. Eng. Comput., vol. 35, pp. 691-694, Nov, 1997.
[27] C. T. Kim, T. A. Linsenmeyer, H. Kim and H. Yoon, "Bladder volume measurement with
electrical impedance analysis in spinal cord-injured patients," Am. J. Phys. Med. Rehabil., vol.
77, pp. 498-502, Nov-Dec, 1998.
27
[28] A. Keshtkar, A. Mesbahi and P. Mehnati, "The effect of bladder volume changes on the
measured electrical impedance of the urothelium," Int J Bio Eng Tech, vol. 1(3), pp. 287-292,
2008.
[29] K. L. Kilgore and N. Bhadra, "Reversible nerve conduction block using kilohertz frequency
alternating current," Neuromodulation, vol. 17, pp. 242-54; discussion 254-5, Apr, 2014.
[30] T. M. Bruns, R. A. Gaunt and D. J. Weber, "Estimating bladder pressure from sacral dorsal
root ganglia recordings," Conf. Proc. IEEE Eng. Med. Biol. Soc., vol. 2011, pp. 4239-4242, Aug,
2011.
[31] K. S. Mathews, H. A. Wark, D. J. Warren, M. B. Christensen, N. F. Nolta, P. C. Cartwright and
R. A. Normann, "Acute monitoring of genitourinary function using intrafascicular electrodes:
selective pudendal nerve activity corresponding to bladder filling, bladder fullness, and genital
stimulation," Urology, vol. 84, pp. 722-729, Sep, 2014.
[32] J. H. Park, C. Kim, J. Shin, C. Im, C. S. Koh, I. S. Seo, S. J. Kim and H. Shin, "Detecting bladder
fullness through the ensemble activity patterns of the spinal cord unit population in a
somatovisceral convergence environment," Journal of Neural Engineering, vol. 10, pp. 056009,
2013.

28
Figure Captions
Figure 1: a) Example of the electrode placement on the bladder wall. b) Schematic
representation of the stimulation and recording circuit.
Figure 2: Illustration of the threshold determination process. A threshold phase is determined
based on the desired threshold and the linear fit from Set 1 (dashed red line). Then, using this
threshold phase, the actual threshold that would be obtained from the Set 2 (or Set 3)
regression (solid red line) is computed. The threshold error is the difference between the
desired and actual threshold. The experimental data is shown by the blue line.
Figure 3: Example of the recorded waveforms, at two different bladder volumes. In this case,
the stimulating frequency was 500 Hz. The dark gray lines were obtained with a bladder
volume of 5 ml, and the light gray lines with a bladder volume of 25 ml. The dashed lines are
the input waveforms obtained by recording the voltage across the 1 Ohm resistor. The solid
lines are the output waveforms obtained from a pair of recording electrodes. Both the
amplitude and phase changes are visible between the two different bladder volumes.
Figure 4: Top row: Bladder volume as a function of phase as well as linear fit of the relationship
for Set 1 (left), Set 2 (middle) and Set 3 (right), in a single experiment. In each figure the blue
line is the experimental data, where the abscissa shows the phase values that were measured
at different volume levels, and the ordinate shows the corresponding volumes. In Sets 2 and 3,
the solid red line represents the linear fit using the data from that set, whereas the dashed red
line is the relationship obtained using the data from Set 1. Bottom row: Analogous results to
29
the top row, using the amplitude instead of the phase information. The phase results are shown
for the frequency-electrode pair that maximized performance for the phase-based volume
prediction error, whereas the amplitude results are shown for the pair that maximized
performance for the amplitude-based volume prediction error. The shapes of the responses
observed varied between experiments; the data presented in this figure is from one experiment
only and is intended only to illustrate our analysis.
Figure 5: Comparison of the results obtained using the phase and amplitude information,
according to the volume prediction error (left) and the threshold estimation error (right). N = 6
in all cases. The box plots use the median and quartiles of the data.
Figure 6: Variation in the threshold estimation error as a function of the desired threshold. Top
plot: results using phase information. Bottom plot: results using amplitude information. N = 6
in all cases.

30
Figure 1
a)
b)

31
Figure 2

32
Figure 3
0.997 0.998 0.999 1 1.001 1.002
-800
-600
-400
-200
0
200
400
600
800
Time (s)
Am
plitu
de (u
v)
33
Figure 4
-120 -100 -80
0
10
20
Phase (degrees)
Vol
ume
(ml)
-160 -140 -120 -100 -80
-10
0
10
20
Phase (degrees)
Vol
ume
(ml)
-160 -140 -120 -100 -80 -60-20
-10
0
10
20
Phase (degrees)
Vol
ume
(ml)
20 40 60
0
10
20
Amplitude (normalized)
Vol
ume
(ml)
45 50 550
5
10
15
20
25
Amplitude (normalized)
Vol
ume
(ml)
40 50 60 70
0
10
20
30
Amplitude (normalized)
Vol
ume
(ml)
34
Figure 5
2
4
6
8
10
12V
olum
e es
timat
ion
erro
r
0
10
20
30
40
50
60
Thre
shol
d es
timat
ion
erro
r
Outlier at 492.92
*
Phase Amplitude Phase Amplitude
35
Figure 6
5 10 15 200
5
10
Desired threshold (ml)Thre
shol
d es
timat
ion
erro
r (m
l)
5 10 15 200
20
40
60
80
Desired threshold (ml)Thre
shol
d es
timat
ion
erro
r (m
l)
Outlier at 492.92
36
Table 1: Combination of stimulation frequency and electrode pair yielding the best
performance, according to each performance measure. The selected combination is the one
with the best averaged performance across all three recording sets.
Rabbit Volume prediction
error using phase
Volume prediction
error using
amplitude
Threshold
prediction error
using phase
Threshold
prediction error
using amplitude
1 2 kHz, Pair 1 1 kHz, Pair 2 2 kHz, Pair 1 1 kHz, Pair 1
2 7 kHz, Pair 1 4 kHz, Pair 3 4 kHz, Pair 2 250 Hz, Pair 3
3 7 kHz, Pair 1 250 Hz, Pair 2 7 kHz, Pair 1 1 kHz, Pair 3
4 7 kHz, Pair 1 6 kHz, Pair 2 1 kHz, Pair 1 1 kHz, Pair 1
5 500 Hz, Pair 1 5 Hz, Pair 2 750 Hz, Pair 1 1 kHz, Pair 1
6 500 Hz, Pair 2 250 Hz, Pair 1 500 Hz, Pair 2 250 Hz, Pair 2