a minor research project - shiksha mandal
TRANSCRIPT

1
A MINOR RESEARCH PROJECT
SUBMITTED TO THE UGC
Sanctioned by University Grants Commission, Western Regional Office,
Ganeshkhind, Pune – 411 007
STUDY ON LABOUR AND MARKETING
PROBLEMS OF VEGETABLE GROWERS
IN WARDHA DISTRICT
Principal Investigator
Dr. Sanjay Seshraoji Kanode
Ex. Associate Professor, Shrikrishnadas Jajoo Grameen Seva Mahavidyalaya, Pipri- Wardha (M.S.)
Co – Investigator
Prof. Shirish M. Sutar
Assit. Professor Shrikrishnadas Jajoo Grameen Seva Mahavidyalaya, Pipri- Wardha (M.S.)

2
Certificate This is to certify that Dr. Sanjay Seshraoji Kanode worked as
Associate Professor in Co-operation, Shrikrishnadas Jajoo Grameen Seva
Mahavidyalaya, Pipri- Wardha from June 01, 1996 to April 04, 2016 as a
regular and permanent Faculty Member and currently performing his
duties as Principal at Vidyabharti College Seloo, Wardha, has completed
his Minor Research Project in the subject Management entitled “Study on
Labour and Marketing Problems of Vegetable growers in Wardha
District” as a Principal Investigator. He has fulfilled the regulations set by
the University Grants Commission, New Delhi. In my opinion the project
has been satisfactorily completed
It is also certified that this Project has not been submitted to any
other University or Institution for the award of any academic purpose.
Dr. P. M. Kalbhut Principal Shrikrishnadas Jajoo Grameen Seva Mahavidyalaya, Pipri Wardha

3
DECLARATION
I hereby declare that this Minor Research Project entitled, “Study
on Labour and Marketing Problems of Vegetable growers in Wardha
District”, is not submitted to any university, and is not substantially the
same as the one, which has already been submitted to any university
Dr. Sanjay Seshraoji Kanode
Principal Investigator
File No. 23-1193/14 (WRO)

4
Acknowledgements
It gives us immense pleasure to write few words about those who
have helped to undertake this Minor Project. On the outset we express our
gratitude to the Authorities of University Grants Commission for
financially supporting us for undertaking this research work. Without the
financial assistance from the UGC this work would not have been
possible.
We express our gratitude to all the participants who have co-
operated and participated in the survey for this project. We thank them
for their participation by way of filling up the questionnaire and
expressing their views about the labour and Marketing Problems
regarding vegetable production.
We also express our gratitude towards Shri Sanjayji Bhargava sir,
Chairman, Shiksha Mandal, Wardha, and Principal Dr. P. M. Kalbhut for
encouraging us to write a proposal for this minor research project. We
also thank the office and library staff of the institute for their cooperation.
Less but not least we express sincere appreciation towards all our
colleagues in the institute who by way of suggestions, encouragement,
discussions have helped us to conclude this research work successfully.
Dr. Sanjay S. Kanode
Prof. Shirish M. Sutar

5
INDEX
Sr.
No. Chapter Contents
Page
Number
1 Chapter I Introduction 1-4
2 Chapter II Review of Literature 5-11
3 Chapter III Methodology 12-29
4 Chapter IV Result 30-91
5 Chapter V Discussion 92-107
6 Chapter VI Conclusion 108-109
7 Annexure I References 110-113
8 Annexure II Questionnaire 114-117
9 Annexure III U. G. C. Sanction Letter 118

6
CHAPTER I
INTRODUCTION
India is basically an agricultural society where sole dependence has been
on agriculture since time immemorial. In the olden days, the agricultural
produce was fundamentally barter by nature where farmers exchanged goods
for goods and also against services. Gradually the scenario changed with the
changing times and agriculture produce began being sold with an element of
commercial value. Trading of agriculture produce began for exchange of
money. And from trading to marketing of agricultural produce began although
mostly it is a way of traditional selling. The marketing as a term is broader than
traditional trading. And agricultural marketing as a concept is still evolving in
the Indian agrarian society. Mahatma Gandhi the father of the nation, who
always stressed upon “self sufficient villages” as the building blocks for
making India a strong nation. Hence, the present study is a modest attempt to
throw the more light on the farmers’ problems in marketing of their produce in
the study area.
Indian agriculture can play a vital role in economic development. It is
therefore agricultural production should be stepped up. The increase in
agricultural production calls for a simultaneous improvement in the marketing
system. Thus for the country predominantly dependent upon agriculture the
efficient agricultural marketing system is very essential and vital.
The agricultural sector today is facing serious threats and challenges.
The farmers are so poverty suffering and indebted. As a consequence, the death
toll of farmers’ suicides is rapidly increasing at an alarming rate. The
contribution of agriculture to GDP has been declining year after year. There is
shift in agricultural labour force. The statistical data reveal that agricultural
labour forces are shifting towards the construction industry, textile industry and
other unorganized sectors, causing scarcity of labour force. The excess use of
fertilizer, pesticides further affects the productivity.

7
The rise in input cost, scarcity of labour and rise in wages and
unorganized market structure are the main problems of Indian farmers. Today,
high risk and low-profit margin are the twin conditions of Indian agriculture.
“If we seed the Agriculture it will feed the world”
Agriculture continues to be the core of livelihood for more than 50 per
cent of the population in Maharashtra. It contributes 12 per cent of Net State
Domestic Product. It is the single largest private sector providing job
opportunities for rural people besides being the source of supply of food grains
and other dietary staples and serving as the prime source of raw materials for
industries. Agricultural development is essential not only to achieve self-
reliance in food grains at the state level, but also for ensuring household food
security and to bring equity in distribution of income and wealth resulting in
ultimate reduction of the poverty level. In fact, high economic growth will have
no meaning for the masses of people living in rural areas unless agriculture is
rejuvenated. Agriculture in Maharashtra is overwhelmed with a number of
adverse characteristics such as declining total cultivable area in relation to
scarcity of cultivable land, low productivity per unit of labour in most of the
regions, predominance of small and marginal farmer households, risk aversion
due to production by tenants and agricultural labourers under insecure
conditions, vast seasonal variations and presence of a large percentage of
tradition loving farmers.
Marketing of agricultural products has been posing a big problem for the
farmers. The farmers, who produce crops, struggle a lot of bring them up. They
plough and tilt the land, seed the plants, water resources, clean them and pack
the products ready to be taken to the markets for sale. Even at the time of
producing the crops and at the time of selling them they face a lot of hurdles
and obstacles such as the interference of brokers and middlemen, lack of
insurance facility, lack of finance, high cost of inputs, storehouses and
transporting problems. In the market the farmers are cheated by the brokers the
purchases like charging the goods less, weighing the products in unbalanced
machines and so on. Thus the farmers face a number of problem form the

8
initial stage of production to till the sale of the products in the market. And all
these are interwoven and ultimately make a deep impact on agricultural
marketing. As a result agriculture as an occupation becomes unprofitable and
therefore, unviable. Agriculture in India is subject to variety of risks arising
from rainfall aberrations, temperature fluctuations, hailstorms, cyclones, floods,
and climate change. These risks are exacerbated by price fluctuation, weak
rural infrastructure, imperfect markets and lack of financial services including
limited span and design of risk mitigation instruments such as credit and
insurance. These factors not only endanger the farmer’s livelihood and incomes
but also weaken the viability of the agriculture sector and its potential to
become apart of the problem of widespread poverty of the agricultural labour
and the National economic development. In order to develop mechanisms and
strategies to mitigate risk in agriculture it is very important to understand the
sources and extent of problem involved in agricultural marketing.
The vegetable production is important since it provides all the essential
nutrients necessary for the human beings. It is essential to sustain increased
production of vegetables in order to meet the demands of people. The
vegetables are the cheapest form of natural food. The vegetables are also used
for medical and industrial purposes.
Importance of vegetable Production :
Vegetable crops are very important in our daily diet by supplying protective
nutrients and tone up energy and vigour of man. It contains large quantities of
minerals, vitamins and essential amino acids
a) Importance of vegetable in human nutrition
i) Vegetable is a good source of roughages which promote digestion
and helps to prevent constipation.
ii) Vegetables are rich source of minerals.
iii) Vegetable foods are the base former.
iv) Vegetables are good source of carbohydrates and proteins.
v) Vegetables are rich source of vitamins

9
b) Importance of vegetables in farmer’s economy.
i) Vegetables are important source of farmers’ income.
ii) Per acre yield of vegetables is very high.
iii) More vegetables can be raised in one year.
c) Importance of vegetables production for medicinal properties.
d) Aesthetic value of vegetables.
Per capita availability of vegetables in India is 357 gm/ person/day,
which is helping in fighting malnutrition (Source: Department of Agriculture,
Cooperation and Farmers Welfare) India continued to be second largest
producer of vegetables after China. India is a leader in production of vegetables
like peas and okra. Besides, India occupies the second position in production of
brinjal, cabbage, cauliflower and onion and third in potato and tomato in the
world. Vegetables such as potato, tomato, okra and cucurbits are produced
abundantly in the country.
Maharashtra is located in the western region of India and the capital is
Mumbai. It has 36 districts in total. The area occupied by the state Maharashtra
is 307,703 km square. The vegetables produced in this state include peas,
cauliflower, potato, brinjal, okra, cabbage, tomato among other vegetables. The
total vegetable productivity of this state is 8008 metric ton per year.

10
CHAPTER II
REVIEW OF LITERATURE The demand for vegetables has increased due to growing population,
simultaneously; production, labour and marketing are the two important
problems of vegetables production. Experts in this field have studied the
production, labour and marketing of fruits and vegetables. The review of
literature has evolved on the following lines
Chandregowda (1997) conducted a study in the Eastern dry zone of Karnataka
among chrysanthemum growers and reported that 59.00 per cent of them
belonged to middle age group.
Angadi (1999) conducted a study in Bagalkot district of Karnataka state and
reported that majority of the pomegranate growers (65%) were middle aged.
The respondents below 35 years of age were 18.75 per cent, while 16.25 per
cent of them were of old age.
Karpagam (2000) conducted a study in Erode district of Tamil Nadu state and
indicated that majority of the turmeric growing farmers (70.83%) belonged to
middle aged group.
Sunil Kumar (2004) from his study on tomato growers of Belgaum district of
Karnataka state indicated that majority of the tomato growers (53.30%)
belonged to middle age group.
Nagoormeeran and Jayaseelan (1999) in their study in South Arcot district of
Tamil Nadu state found that majority (42.00%) of the farmers had received
education upto high school, followed by pre-university (22.00%) and middle
school (16.00%) levels of education, respectively.
Vijayakumar (1999) in his study on rose growers in Bangalore district revealed
that 22.00 per cent of the rose growers were illiterates. More per cent of them
were studied upto high school (42.00%), followed by middle school (20.00%),
pre-university college (11.00%), primary school (4.00%) and graduation
(1.00%), respectively.

11
Palaniswamy and Sriram (2000) in their study to measure extension
participation of farmers revealed that majority of the farmers belonged to
medium education level (53.06%), while 21.77 and 25.17 per cent belonged to
low and high education levels, respectively.
Moulasab (2004) in his study on mango growers in North Karnataka indicated
that more than 23.00 per cent of growers were educated up to primary school
followed by higher secondary school (19.16%) and 4.16 per cent of them were
illiterates.
Karpagam (2000) in his study on knowledge and adoption behaviour of
turmeric growers in Tamil Nadu reported that majority of the respondents
(71.66%) had only farming as their occupation, followed by farming and dairy
(11.67%), farming and business (16.67%), respectively.
Patange et al. (2001) observed from his study conducted in Solapur district of
Maharashtra state that 70.62 per cent of respondents had farming as main
occupation and animal husbandry and dairy as subsidiary occupation. It also
seen that 11.87 and 11.64 per cent of the respondents participated in dairy
business along with service and other business with farming, respectively.
Jhamtani et al. (2003) revealed that more than half of the respondents (52.82%)
were engaged in farming as their main occupation. Whereas, 20.44 per cent of
them were engaged in service, followed by 12.00 per cent who were engaged in
more than one occupation, while 11.55 per cent of them were engaged in
labour work and only 3.11 per cent of them were engaged in business.
Kulkarni (2003) from his study conducted in Rahuri district of Maharashtra
state revealed that nearly two-third families of beneficiary women (64.17%)
had agriculture as their main occupation, 15.88 per cent had service while
relatively small portion of the families of beneficiary women were labourers
(6.47%), 5.30 per cent were engaged in dairy and 5.88 per cent had business
and other activities as their main occupation, respectively.
Anitha (2004) from her study conducted in Bangalore district of Karnataka
state reported that 3.33 per cent of farm women were practicing farming and
subsidiary enterprises in addition to other sources of income. Great majority of

12
farm women (92.50%) were practicing farming and subsidiary enterprises
while 4.17 per cent of them were dependent only on farming.
Saravana Kumar (1996) in his study in Krishnagiri taluk of Dharmapuri district
in Tamil Nadu observed that majority of the mango growers (64.18%) had
medium land holding while 21.66 and 14.66 had small and big land holdings,
respectively.
Vijayakumar (1999) from his study on floriculturists of Bangalore district of
Karnataka state revealed that 75 per cent of the rose growers belonged to small
farmers category, followed by medium (23.00%) and big (2.00%) farmers
category.
Angadi (1999) in his study in Bagalkot district of Karnataka found that
majority of the pomegranate growers (62.50%) had big farm size and only 6.25
per cent had lesser land holdings.
Karpagam (2000) conducted a study on turmeric growers in Erode district of
Tamil Nadu observed that 40.83 per cent of them had medium land holdings
and 31.66 per cent of them had semi-medium land holdings.
Shashidhar (2003) from his study on socio-economic profile of drip irrigation
farmers in Shimoga and Davanagere district of Karnataka state revealed that
comparatively more number of farmers (46.67%) belonged to semi-medium
category, followed by medium (32.22%) and small land holding categories
(18.89%).
Shivamurthy (1991) conducted a study on arecanut and cardamom growers in
Shimoga district of Karnataka state and reported that the majority of the
cardamom growers sold their produce to village traders (61.67%), followed by
gardeners’ societies (55.00%) and commission agents (32.50%) while none of
them sold to contractors.
Nawadkar D. S. et al. (1991), in their article explained the "Marketing of
vegetable in Western Maharashtra" The study shows that the profit of
intermediaries margin accounts for quite a large proportion of the price paid by
the consumers in both the markets. In order to ensure more and better
production, consumption and upliftment of the economy of the vegetable

13
growers will have to be assured of remunerative price. This could be done by
regulation of markets, providing storage facilities both in production areas and
in the market areas, packing material at subsidized rates, cheaper transportation
facilities and reducing a large number of intermediaries who retain quite a large
proportion of consumer's rupee. These measures are necessary to avoid price
fluctuation over time and space and to establish fair prices both for producers
and consumers.
Halakatti (1999) from his study on rainfed chilli production in Gadag district of
Karnataka state reported that majority of the farmers (96.71%) experienced the
problems of pest and disease which prevented them from attaining higher chilli
yield and about 83.00 per cent of them complained about the problems of
unfavourable climate conditions.
Agarwal and Sharma (1994) from their study on soybean growers of Jodhapur
district of Rajasthan identified the following marketing channels for soybean in
Rajasthan.
Channel-I : Producer →� Seller → Oilseed grower→� Co-operative
Societies→ Tilham Sangh
Channel-II : Producer→ Seller→ Commission agent→ Tilham Sangh
Channel-III : Producer→ Seller→ Commission agent→Wholesaler local
processor
Channel-IV : Producer→ Seller→ Commission agent→ Wholesaler
Ravishankar (1995)The main constraints perceived by the potato growers in
production were lack of technical guidance, more pest and diseases high cost of
fertilizers, high cost of plant protection chemicals, non-availability of seed
materials and non-availability of fertilizers in time.
Meenakshi (1983) studied the agricultural market information system in
Shimoga district and reported that the personal and market media were the
most important sources of market information to the farmers. Mass media such
as radio, newspaper were the least preferred sources of information.
Rotti (1983) from his study on sugarcane growers of Belgaum district of
Karnataka state found that sugarcane growers consulted 10 different sources of

14
information, out of which Agricultural Assistants was the top most source
consulted, followed by progressive farmers. Next source consulted in
sequential order were friends, relatively, neighboring farmers, radio, Cane
Inspector, Assistant Agricultural Officer, Opinion Leader and newspaper.
Shashikumar (1987) reported from his study on potato in Hassan district of
Karnataka state that the major problems faced by farmers while marketing of
potato were fear of price fall, weight loss in storage, lack of improved storage
facilities, high cost of transportation and higher commission charges.
Agarwal and Saini (1995) from their study on vegetable marketing in Jaipur
market of Rajasthan reported that marketing of vegetables posses more
problems as compared to agricultural commodities as they have a high degree
of perishability, bulkiness, existence of large number of middlemen in their
trade due to low capital investments and are grown mostly by the small and
marginal farmers. The middlemen manipulate the situation by offering low
prices to the growers under the pre-text of low demand falsely rejecting the
produce as substandard one. Sometimes, the vegetables also get accumulated in
particular areas, then make distress sale and get substantially low prices in
addition to wastage of large quantities of the produce.
Sharma et al. (1995) in their study on marketing of vegetables in Himachal
Pradesh reported that costly wooden boxes, time consumed for manual grading,
distant markets, high transportation charges, malpractices in the market and
lack of market information were the major problems faced by growers in
marketing of vegetables.
Narappanavar and Bavur (1998) in their study on marketing problems of potato
in Dharwad district of Karnataka, reported that the problem of transportation
was mostly felt by small and marginal farmers and the transportation facility
was easily available to almost all large farmers. The reason for this was many
of the large farmers owned tractors and small and medium farmers were to
depend upon the large farmers only to take their produce to market for sale and
these large farmers run their tractors on hire charges. Due to lack of
transportation facilities at the required time, it was not possible for the small

15
and medium farmers to sell their produce when the price was better in the
market. Transportation charges paid by small and medium farmers were also
higher.
Anil Kumar and Arora (1999) from their study on post-harvest management of
vegetables in the hills of Uttar Pradesh reported that 20 to 30 per cent of the
total harvest of vegetables produced annually is lost primarily because of lack
of adequate infrastructure, post-harvest technology relevant to their needs and
machinery for technology dissemination. This has led to the continuous
adoption of unorganized marketing practices, very low share of farmers in the
price consumers pay in major consuming centers, frequent occurrence of glut
situations, forcing distress scale on the producers and low quality of produce.
Atibudhi (1998) concluded from his study on agricultural marketing in
Sakhigopal district of Orissa state that the exploitation of farmers by the traders
can be minimized by strengthening the market committee, providing proper
marketing facilities, competent staff and strict enforcement of regulated market
act.
Shrivastava et al. (1998) from his study on chilli growers of Nagpur district of
Maharashtra state suggested that high yielding variety be evolved possessing
the pest and disease resistance and early in maturity crop loan facility should be
timely and adequately the price of fertilizers, insecticides and fungicides should
be reduced and the technical information should be given well in time to the
farmers.
Murthy and Subramanyam (1999) reported that India’s exports to neighbouring
SAARC countries were either decreasing or stagnated. Hence, it should aim not
only to capture the new markets but also to arrest the declining trend and to
increase the exports to existing traditional market like Sri Lanka, Nepal and
Bangladesh.
Shah (1999) stated that to create chain of scientific onion storages in different
region of the country, cut down upon the post-harvest losses in order to meet
increasing demand in the international market, marketing system encompassing
onions also need improvement in the efficiency.

16
Mohapatra (1999) found that establishment of storage godowns at each block
headquarter and in the onion producing areas is necessary to get fair prices for
the produce in lean season, regulation of onion sale price should be done by
government through involvement of regulated market committee (NAFED) by
establishing procurement centers so that exploitation by middlemen can be
minimized institutional credit facilities at right time should be extended to the
onion farmers on propriety basis.
Waman and Patil (2000) from their study on onion growers of Solapur district
of Maharashtra state observed that concerned efforts of the extension agencies
working in the area growing onion crop were necessary to overcome to the
problems faced by grower

17
CHAPTER III
METHODOLOGY
This chapter deals with the methods and procedures used for carrying
our in present study. Every possible effort was made to adopt appropriate
method and procedure in order to reach reliable, unbiased and practical
conclusion. This chapter deals with the description of procedure followed for
carrying out the investigation. It contains the tools and techniques employed for
data collection. The sampling procedure adopted as well as the devices used for
analysis of data are also explained. Whole chapter described as fallowing
• Location of Study
• Selection of respondents and sampling procedure
• Statistical Tools used for analysis of data
Location of study:
The present study was conducted in Wardha district of Vidarbha region
of Maharashtra state.
Physiography :
The geographical area of the district is 6309 Sq. Km. Wardha district is
situated between parallels of 200 .73 latitude and between meridians of 78.61
latitude. The actual cultivated area is 4484 Sq. Km and 769 Sq. Km is under
forest. Wardha district comprises of 1361 villages.
The population of Wardha district according to 2011 census is 13.00
lakh out of which 6.68 lakh are male and 6.32 are female. The rural population
8.77 lakh and urban being 4.23 lakh.
Soil :
The soil of Wardha district is black cotton or dark brown soil. viz., kali,
morand, khardi and bardi.

18
Map of Maharashtra Showing Wardha District within V idarbh
Talukawise Map of Wardha District

19
Climate :
The climate of Wardha district is characterized by hot, dry and sub
humid bioclimate with dry summers and mild winters. The year may be divided
into three seasons.
1) Moderately warm wet season from June to September
2) Cool dry season from October to February
3) Hot dry season from March to May.
Selection of respondents and sampling procedure :
As the study aimed to study on labour and marketing problems of
vegetable growers in Wardha district. Wardha district is purposively selected
for the study because it is one of the important districts in growing vegetables
crops of Vidarbha region. There are total eight talukas in Wardha district
namely Arvi, Ashti, Karanja, Deoli, Wardha, Samudrapur, Seloo and
Hinganghat.
Selection of Talukas :
There are eight talukas out of which Arvi, Hinganghat, Selu and Wardha
these four talukas were vegetable crops are taken since four to five years and
the growers are more in number were selected for the purpose of study. Out of
these selected talukas, the village where the cultivators growing vegetables
were more in numbers was purposefully selected. The villages selected for the
study are Kachnur, Rasulabad, Kharagna, Rohna and Virul from Arvi taluka.
Yeranwadi, Shirul, Allipur, Sonegoan (Dhote) and Pimpalgoan from
Hinganghat taluka. Rehaki, Ghorad, Gondapur, Kanhapur and Vahitpur from
Selu taluka. Dhanora, Ashta, Tigoan, Rotha and Umri from Wardha taluka
Selection of the respondents :
From various taluka agricultural officers, Head quarters of Agriculture
in Wardha district, village wise list of total 200 vegetable growers was obtained
from 20 villages. These respondents from 20 villages (10 respondents per
village) growing vegetables Since 5 years were selected by random selection
method. Thus 200 farmers constituted the sample for the study.

20
The numbers of selected vegetable growers contacted for the study schedule
taluka wise are given below.
Sr.
No.
Name of Taluka Number of Vegetable
Growers selected
1. Arvi 50
2. Wardha 50
3. Selu 50
4. Hinganghat 50
Total 200
Preparation of interview schedule :
The response was obtained with the help of structured schedule specially
designed for the purpose of study, which was personally filled by the
researchers.
Research Design and technique measurement :
Variables and their measurements
Operational definition of the variables
Age :
Age refers to the chorological age of the respondents. The respondent
according to the age were classified as under.
Sr. no. Category Age years
1. Young Up to 32 years
2. Middle 33 to 54 years
3. Old 55 and Above

21
Education :
It refers to the formal education of the respondents, the score of which
were given as follows.
Sr. No. Category Score
1. Illeterate 0
2. Primary Education (upto 4th class) 1
3. Secondary education (5th to 10 class) 2
4. Junior college (11th & 12th class) 3
5. Higher Education ( Graduate and above) 4
Occupation:
Two occupational groups are considered. Respondents engaged in
Agriculture constitute the one group, where as the respondents doing
agriculture as well as subsidiary occupation which includes service as small
scale business viz. grossary shop, dairying etc. were considered in the second
subsequent group.
Agriculture as main occupation was given one score, where as
agriculture plus subsidiary occupation was given two score
Sr. No. Occupation Score
1. Agriculture 01
2. Agriculture + subsidiary occupation 02
Land Holding :
In present study, the land holding was defined as the number of hectares
of land possessed by the respondents. The following categories were formed
with respect to size of holding of the vegetable farmer for the analysis.

22
Sr. No. Categories Holding
1. Small Farmer Up to 2 Ha.
2. Medium Farmer 2.01 to 6 Ha.
3. Big Farmer 6.01 Ha. and Above
Family Size :
In present study the family members was defined as the number of blood
related members residing in the family of the respondents. The following
categories were formed with respect to the size of family of the vegetable
farmer for the analysis.
Sr. No. Categories Numbers of Members
1. Small Family Up to 3 members
2. Medium Family 4 to 6 members
3. Big Family 7 and above members
Subsidiary occupation :
It was operationalized as the activities in which the farmer and his
family members are engaged with the major activity for extra income
Sr. No. Categories Score
1. Dairy / Goat farming 1
2. Agriculture inputs shop 2
3. Labour 3
4. Grocery shop 4
5. Other business (floor mill/ vegetable shop /
workshop, Tent rent & decoration)
5
6. Transport / tractor 6

23
Area under Irrigation
It refers to the field area covered under irrigation with available
irrigation source.
Sr. No. Categories Score
1. No Irrigation 0
2. Up to 1Ha 1
3. 1.01 Ha to 3 Ha 2
4. 3.01 Ha and above 3
Professional Crops
In present study the Professional crops refers to the other major/
commercial crops cultivated on the respondents field
Sr. No. Categories Score
1. Cotton 1
2. Soybean 2
3. Wheat 3
4. Gram (chickpea) 4
5. Fruit crops 5
6. Floriculture 6
7. Other crops (Tur-pegionpea, sugarcane
etc.) 7
24
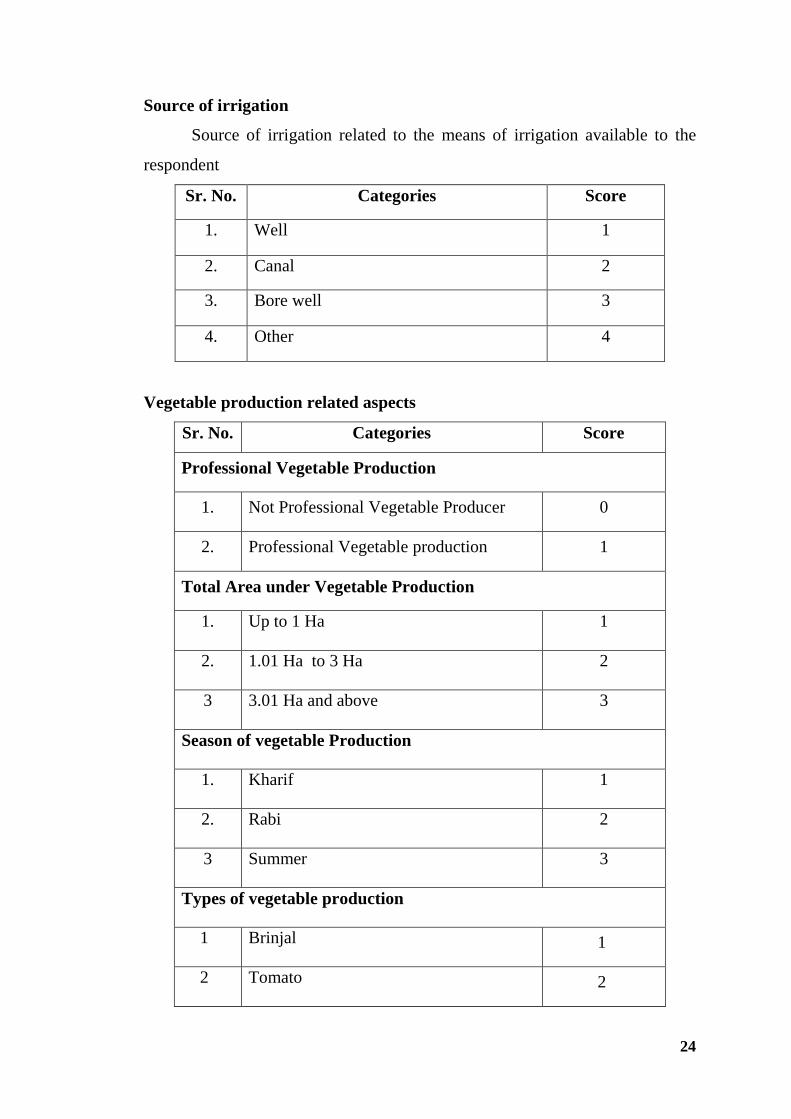
Source of irrigation
Source of irrigation related to the means of irrigation available to the
respondent
Sr. No. Categories Score
1. Well 1
2. Canal 2
3. Bore well 3
4. Other 4
Vegetable production related aspects
Sr. No. Categories Score
Professional Vegetable Production
1. Not Professional Vegetable Producer 0
2. Professional Vegetable production 1
Total Area under Vegetable Production
1. Up to 1 Ha 1
2. 1.01 Ha to 3 Ha 2
3 3.01 Ha and above 3
Season of vegetable Production
1. Kharif 1
2. Rabi 2
3 Summer 3
Types of vegetable production
1 Brinjal 1
2 Tomato 2

25
3 Spinach 3
4 Cauliflower 4
5 Cow Pea 5
6 Ladies Finger 6
7 Others, (Chili, Cluster bean Bottle Gourd
etc.) 7
Objectives of vegetable production
1 To get Cash 0
2 Less Expensive 1
3 Family get vegetable easily 2
4 Other 3
Other Objectives
1 a) Support to Farming
b) Meet family Expenses 1
2 Economical Support 2
3 Meet Family Expenses 3
4 For more Income 4
5 Support Farming 5
Source of information regarding vegetable seeds
1 Agricultural assistant 1
2 Big farmers 2
3 Center for sustainable Agriculture 3
4 Agriculture Input Shop 4
5 No Answer 5

26
Source of vegetable Seed purchase
1 Agriculture Nursery 1
2 Agriculture input shop 2
Guaranty of Production from Seeds
1 No Guaranty of seed for production 0
2 Guaranty of seeds for production 1
Vegetable farming Groups
1 Vegetable farming with Group 0
2 No Groups 1
Input from farming Groups
1 Take inputs from groups 0
2 Don’t take inputs from groups 1
The labour related aspects and labour problems of the vegetable growers
Total Labours required for production of vegetable on 1 Arc of Land
1 Up to 5 Labours 1
2 6 to 15 Labours 2
3 More than 15 Labours 3
Availability of Labours
1 Labour are not available 0
2 Labours are available 1
Requirement of skilled labours for vegetable production
1 Skilled labours are not required 0
2 Skill labours required 1

27
Availability Skilled of labour
1 Skilled labours are not available 0
2 Skilled labours available 1
Time Hours of labours need
1 Morning Hours 1
2 Afternoon Hours 2
3 Full Day 3
Requirement of Skilled labours for vegetable Pickings
1 Skilled labours not required 0
2 Skilled labour required 1
Period of vegetable production
1 Up to 3 months 1
2 3.01 to 5 months 2
3 More than 5 month 3
Mode of wages payments
1 Barter 1
2 Money 2
Types of wage fixation
1 Hourly Basis 1
2 Per Day Basis 2
3 Monthly Basis 3
Problems regarding labour
1 Labours are not easily Available 0
2 Labours wages are High 1
3 Other villages labours have to brought 2

28
4 No Problems 3
Solution Suggested on Labour Problems
1 Use High tech farming 1
2 Give proper rates to veg produce 2
3 Sometimes labours were brought from
other villages
3
4 Labour rates should be fixed 4
5 No Solutions Suggested 5
The marketing related aspects and marketing problems of the
vegetable growers
Level of vegetable Market
1 District of Market 0
2 Taluka (Block) Level 1
3 Village Market 2
4 Other 3
Market Type
1 Wholesale Market 1
2 Retail Market 2
System of Selling Vegetable Produce
1 By self 1
2 Through Commission Agent (Brokers) 2
If sold by own then what are the rates
1 Lowered rates 0
2
As per market rates 1

29
Commission Percent of Agents (Broker)
1 2 to 8 percent 1
2 9 to 12 percent 2
Brokers Commission Affordable
1 Affordable 0
2 Not Affordable 1
Types of charges by Broker
1 No reply 0
2 Commission 1
3 Commission + Hamali 2
4 Commission +Hamali + Weighing charge 3
5 Commission + Weighing charge 4
6 Hamali 5
7 Hamali + Market Fee 6
8 Hamali + Weighing charge 7
Rates get when vegetable produce sold through Brokers
1 Not Get proper Rates 0
2 Sometimes get proper Rates 1
3 Get Proper Rates 2
Time for getting cash after selling produce through Broker
1 Cash get late 0
2 Cash get immediately 1
Broker free market concept
1 Didn’t answer 0
2 Can’t say 1

30
3 Broker free market 2
4 A Broker are required 3
5 Best options should be discovered 4
Problems regarding brokers
1 Didn’t answer 0
2 Brokers do malpractice, partialities 1
3 Commission should be reduce 2
4 Vegetables should get proper rates 3
5 Broker free market 4
6 No Problem 5
Selling of produce in group (Group selling)
1 Personal Marketing 0
2 Marketing in groups 1
Grading of vegetables
1 Don’t Grade 0
2 Do Grading 1
Facilities available at wholesale markets
1 Didn’t answer 0
2 No facilities available 1
3 All facilities available 2
Satisfaction about facilities available at wholesale market
1 Not satisfied 0
2 Satisfaction with facilities available 1
Reasons of dissatisfaction for facilities available at wholesale market
1 Can’t say 0

31
2 Facilities aren’t proper 1
3 No Cleanness 2
If supply of vegetables in wholesale market increases then the rates
gets decreases
1 Supply increase Rate decrease 0
2 Supply increase Rate not decrease 1
Availability of cold storage if vegetable rates are low
1 Cold storage not Available 0
2 Cold storage available 1
Vegetable is perishable so have to sell as early as possible
1 Not to sell early 0
2 Have to Sell early 1
As vegetable in Perishable do it gets proper rates
1 Didn’t get proper rates 0
2 Get proper rates 1
Knowledge regarding cold storage
1 Don’t know about cold storage 0
2 Know about cold storage 1
Use of cold storage, If provided
1 Will not use the cold storage if provided 0
2 Use the cold storage if provided 1
Problems regarding storage facilities
1 No storage facilities 0
2
Vegetables are Perishable so Cold storage
facilities should be provided
1

32
Vegetables purchase by APMC
1 APMC not purchase vegetable produce 0
2 APMC purchase vegetable produce 1
Vegetable should have minimum support price
1 Minimum Support Price should not be for
vegetable produce 0
2 There should be Minimum Support Price
for vegetable produce 1
Wholesale market is controlled by Brokers
1 Can’t say 0
2 Wholesale market is not controlled by
Brokers
1
3 No, Wholesale market is controlled by
Brokers
2
Information Regarding Transport of vegetables
Means of vegetable transport
1 Bullock cart 1
2 Five wheeler Auto 2
3 Bike 3
4 Bicycle 4
5 Other,(407, Auto 3, Truck, 207, Bus, etc) 5
Personal Transport facility
1 Don’t have Personal Transport 0
2 Personal Transport avaliable 1
Timely Availability of transport facility
1 Transport facility Not Available Timely 0

33
2 Transport facility Available Timely 1
Losses Due to Non Availability Transport facility timely
1 Have to Bear Losses 0
2 Don’t had losses 1
Problems regarding Transport facilities
1 No Problems 0
2 No Transport facility in village 1
3 Transport is not available timely 2
4 No proper roads 3
5 Transport is Expensive 4
6 Police give challans 5
Suggestion for transport facilities
1 No suggestion 0
2 Transportation rates should be reduced 1
3 Special facility should be made available for
vegetable transport
2
Suggestions regarding Government actions required
Government actions required
1 Proper rates/minimum support price 1
2 Proper Facilities/storage/cold storage 2
3 Brokers free marker 3
4 Government should keep control on
Brokers /Market 4
5 Government should communicate or SMS
for veg. rates/schemes/new tech
5
6 Proper roads/transport /no challans 6

34
7 Guaranteed vegetable seeds 7
8 Didn’t answer 8
Use of statistical tests :
Simple statistical tools like frequency, percentage were used for analysis of
data. To calculate the percentage the frequency of the particular category was
multiplied by hundred and divide by the total number of respondents in that
category

35
Chapter IV
RESULTS
Present investigation entitled “problems of Vegetable Growers in
Wardha District” was undertaken with a view to study the extent of labour and
marketing problems of vegetable growers.
The findings of the study have been presented under following heads.
1) Personal and economic characters of respondents.
2) Information regarding vegetable production.
3) The labour related aspects and labour problems of the vegetable
growers.
4) Suggestions given by vegetable growers regarding labour problems.
5) The marketing related aspects and marketing problems of the vegetable
growers.
6) Suggestions regarding marketing problems given by the vegetable
growers.

36
4.1 Personal and Economic characters
Distribution of respondents and the basis of their personal and economic
characters.
Table 1
Distribution of vegetable growers according to their Age
Sr. No. Age Frequency Percentage
1. Young age( up to 32
years)
42 21.00%
2. Middle age( 33 to 54
years)
103 51.50%
3. Old age (55 and above) 55 27.50%
Total 200
It was observed from the table-1, that majority (51.50 per cent) of the
respondents were from middle age group (33 to 54 years) followed by 27.50
per cent from old age (55 and above years) and 21.00 per cent from young age
group (up to 32 years)
0.00%
10.00%
20.00%
30.00%
40.00%
50.00%
60.00%
Young age( up to
32 years)
Middle age( 33 to
54 years)
Old age (55 and
above)
21.00
51.50
27.50
Pe
rce
nta
ge
Age
Distribution of respondents according to Age

37
Table 2
Distribution of vegetable growers according to their Education
Sr. No. Education Frequency Percentage
1. Illiterate 09 4.50
2. Primary Education 24 12.00
3. Secondary Education 84 42.00
4. Junior college education 50 25.00
5. Higher Education 33 16.50
Total 200
With regards, educational qualifications it was revealed from table-2,
that 42.00 per cent of the respondents were educated up to secondary level,
25.00 per cent respondents were educated up to junior level (10+2 level), 16.50
per cent respondents were educated up to higher education level, 12.00
respondents were educated up to primary education level and 4.50 per cent of
respondents were found illiterate.
0
10
20
30
40
50
Illiterate Primary
Education
Secondary
Education
Junior
college
education
Higher
Education
4.5
12
42
25
16.5
Pe
rce
nta
ge
Education
Distribution of respondents according to
Education

38
Table 3
Distribution of vegetable growers according to their Family Size
Sr. No. Family Size Frequency Percentage
1. Up to 3 members 23 11.50
2. 4 to 6 members 146 73.00
3. 7 and above members 31 15.50
Table no. 3, indicates that most of the respondents (73.00 per cent) were
having 4 to 6 family members where as 15.50 per cent of respondents having 7
and above family members, similarly 11.50 per cent of respondents having
small family i.e. up to 3 family members.
01020304050607080
Up to 3 members 4 to 6 members 7 and above
members
11.5
73
15.5
Pe
rce
nta
ge
Family Size
Distribution of respondents according to Family
members

39
Table 4
Distribution of vegetable growers according to their Occupation
Sr. No. Occupation Frequency Percentage
1. Agriculture 159 79.50
2. Agriculture + Subsidiary
occupation
41 20.50
Table-4, indicates that most of the respondents (73.50 per cent) were
having agriculture as their main occupation where as 20.50 per cent of the
respondents were engaged in the agriculture as well as other subsidiary
occupation
0
20
40
60
80
Agriculture Agriculture + Subsidiary
occupation
79.5
20.5
Pe
rce
nta
ge
Occupation
Distribution of respondents according to
Occupation

40
Table 4.1
Distribution of vegetable growers according to their Land Holding
Sr. No. Land Holding Frequency Percentage
1. Small Farmers (up to 2 Ha)) 11 5.50
2. Medium Farmers (2.01 to 6.00
Ha)
102 51.00
3. Big Farmers (above 6.01 Ha) 87 43.50
Total 200
.
It is observed from the table 4.1 that, 51.00 per cent respondents had
medium size land holding (2.01 Ha to 6 Ha), 43.50 per cent respondents had
big size land holding (6.01 Ha) and 5.50 per cent respondents had small size
land holding (below 2 Ha).
0
10
20
30
40
50
60
Small Farmers (up to 2
Ha))
Medium Farmers (2.01
to 6.00 Ha)
Big Farmers (above
6.01 Ha)
5.5
51
43.5
Pe
rce
nta
ge
Land Holding
Distribution of respondents according to Land Holding

41
Table 4.2
Distribution of vegetable growers according to their Subsidiary occupation
Sr. No. Subsidiary Occupation Frequency Percentage
1. Dairy / Goat farming 18 43.90
2. Agriculture inputs shop 01 02.43
3. Labour 02 04.87
4. Grocery shop 10 24.37
5. Other business (floor mill/ vegetable
shop/ workshop, Tent rent & decoration) 07 17.07
6. Transport / tractor 03 07.31
It was revealed from the table 4.2, that substantial number (43.90 per
cent) of the respondents are engaged in Dairy farming or Goat farming
business, 24.37 per cent of respondents were engaged in house hold grocery
shop, 17.07 per cent respondents are engaged in various other business such as
household flour mill, vegetable shop, wielding workshop, tent suppliers etc,
where as 4.87 per cent respondents were engaged in labour and 2.43 per cent of
respondents were having agriculture inputs shop.
05
1015202530354045
Da
iry
/ G
oa
t fa
rmin
g
Ag
ric
ult
ure
inp
uts
sho
p La
bo
ur
Gro
ce
ry s
ho
p
Oth
er
bu
sin
ess
(flo
or
mil
l/
ve
ge
tab
le s
ho
p/
…
Tra
nsp
ort
/ t
rac
tor
43.9
2.43 4.87
24.3717.07
7.31
Pe
rce
nta
ge
Subsidiary Occupation
Distribution of respondents according to Subsidiary
Occupation

42
Table 4.3
Distribution of vegetable growers according to their Area under Irrigation
Sr. No. Area under Irrigation Frequency Percentage
1. No Irrigation 30 15.00
2. Up to 1Ha 30 15.00
3. 1.01 Ha to 3 Ha 92 46.00
4. 3.01 Ha and above 4.8 24.00
It was observed from the table 4.3 that 46.00 per cent of the respondents
having 1.01 Ha. to 2 Ha. of land under irrigation, 24.00 per cent of respondents
holding 3.01 Ha. and above land under irrigation, where 15.00 per cent
respondents having only up to 1 Ha. land under irrigation and 15.00 per cent
respondents don’t have irrigation.
05
101520253035404550
No Irrigation Up to 1Ha 1.01 Ha to 3 Ha 3.01 Ha and
above
15 15
46
24
Pe
rce
nta
ge
Area under Irrigation
Distribution of respondents according to Area under Irrigation

43
4.2 Information regarding vegetable production
Table 5
Distribution of vegetable growers according to their growing of
Professional Crops
Sr. No. Professional crops Frequency Percentage
1. Cotton 197 98.50
2. Soybean 150 75.00
3. Wheat 137 68.50
4. Gram (chickpea) 93 46.50
5. Fruit crops 08 4.00
6. Floriculture 09 04.50
7. Other crops (Tur- pegionpea, sugarcane etc.) 18 09.00
Table -5 indicates that 98.50 per cent of respondents grow gram, cotton,
75.00 per cent of respondents grow soybean, 68.50 per cent of respondents
grow wheat, 45.50 per cent of respondent grow wheat, 46.50 percent of
respondents grow gram (chick pea), 9.00 percent respondents grow other crops
(tur (arhar), sugarcane etc.), 4.50 percent respondents grow floriculture and
4.00 percent respondents grow fruit crops on their fields.
0
100
98.575 68.5
46.5
4 4.5 9
Pe
rce
nta
ge
Cultivation of Professional crops
Distribution of respondents according to cultivation of
Professional crops

44
Table 6
Distribution of vegetable growers according to their Source of irrigation
Sr. No. Source of irrigation Frequency Percentage
1. Well 191 95.50
2. Canal 01 0.50
3. Bore well 07 3.50
4. Other 01 0.50
Total 200
From table – 6 it is clear that most of respondents (95.50 Per cent) have
well, 3.50 per cent of respondents have Bore well, 0.50 per cent of respondents
having canal and 0.50 per cent of other irrigation facility on their farms.
0
10
20
30
40
50
60
70
80
90
100
Well Canal Bore well Other
95.5
0.5
3.50.5
Pe
rce
nta
ge
Source of Irrigation
Distribution of respondents according to Source of Irrigation

45
Table 7
Distribution of vegetable growers according to their Professional
Vegetable Production
Sr. No. Professional Vegetable production Frequency Percentage
1. Professional Vegetable production 199 99.50
2. Not Professional Vegetable
Producer
01 00.50
Total 200
Table- 7, It is highlighted that mostly all (99.50 per cent) of respondents
were professional vegetable and only 0.50 per cent respondents were not
professional vegetable growers.
0
20
40
60
80
100
Professional Vegetable
production
Not Professional Vegetable
Producer
99.5
0.5
Pe
rce
nta
ge
Professional Vegetable production
Distribution of respondents according to Professional
Vegetable production
46
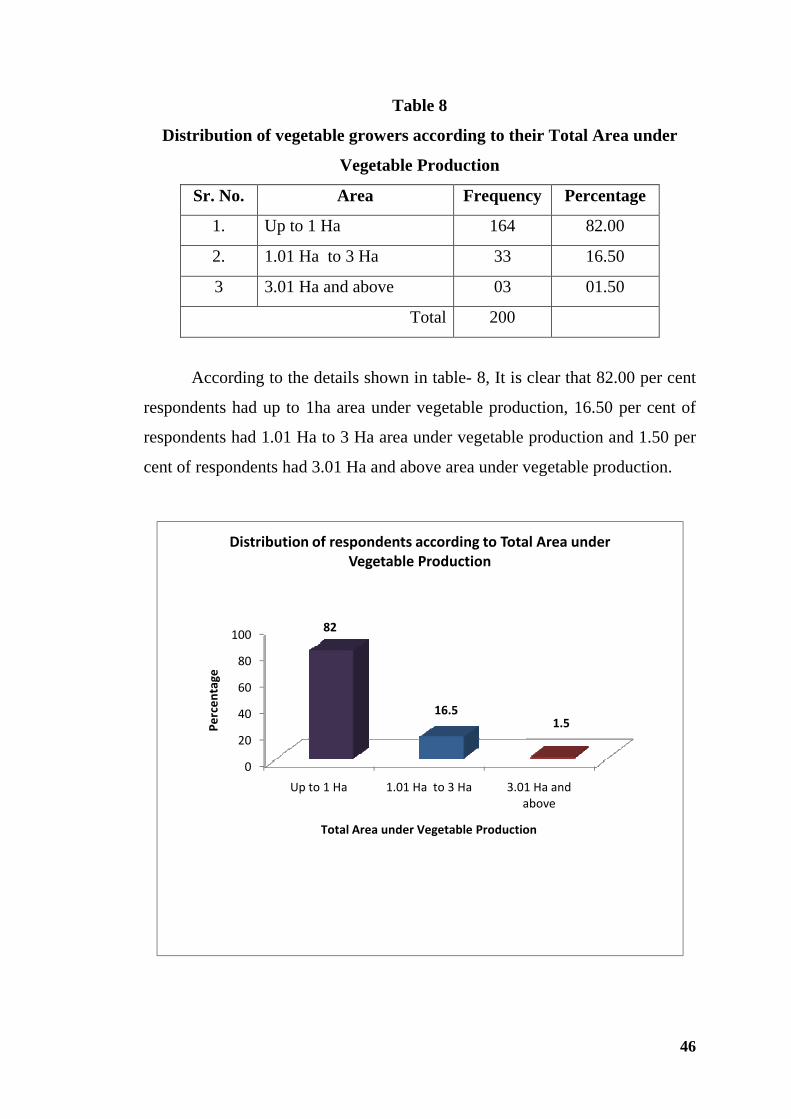
Table 8
Distribution of vegetable growers according to their Total Area under
Vegetable Production
Sr. No. Area Frequency Percentage
1. Up to 1 Ha 164 82.00
2. 1.01 Ha to 3 Ha 33 16.50
3 3.01 Ha and above 03 01.50
Total 200
According to the details shown in table- 8, It is clear that 82.00 per cent
respondents had up to 1ha area under vegetable production, 16.50 per cent of
respondents had 1.01 Ha to 3 Ha area under vegetable production and 1.50 per
cent of respondents had 3.01 Ha and above area under vegetable production.
0
20
40
60
80
100
Up to 1 Ha 1.01 Ha to 3 Ha 3.01 Ha and
above
82
16.51.5P
erc
en
tag
e
Total Area under Vegetable Production
Distribution of respondents according to Total Area under
Vegetable Production

47
Table 9
Distribution of vegetable growers according to their Season of vegetable
Production
Sr. No. Season Frequency Percentage
1. Kharif 172 86.00
2. Rabi 184 92.00
3 Summer 153 76.50
According to table-9, 92.00 per cent of respondents grow vegetable in
Rabi season, 86.00 per cent of respondents grow vegetable in Kharif Season
and 76.50 per cent respondents grow vegetable in Summer Season.
0
20
40
60
80
100
Kharif Rabi Summer
86 92
76.5
Pe
rce
nta
ge
Season of Vegetable Production
Distribution of respondents according to Season of Vegetable
Production

48
Table 10
Distribution of vegetable growers according to their Types of vegetable
production
Sr. No Types of vegetable grown Frequency Percentage
1 Brinjal 143 71.50
2 Tomato 96 48.00
3 Spinach 97 48.50
4 Cauliflower 31 15.50
5 Cow Pea 199 99.50
6 Ladies Finger 102 51.00
7 Others, (Chili, Cluster
bean Bottle Gourd etc.) 111 55.50
According to the details shown n table-10, 99.50 per cent respondents
grown cowpea, 71.50 per cent respondents grow Brinjal, 55.50 percent
respondents grow other vegetables (chili, bitter gourd, cluster beans, Bottle
gourd, pumpkin , etc), 51.00 respondents grow ladies Fingers 48.50 percent
respondents grow spinach, 48.00 percent respondents grow tomato and 15.50
percent respondents grow cauliflower on their fields.
0
20
40
60
80
100 71.5
48 48.5
15.5
99.5
51 55.5
Pe
rce
nta
ge
Types of Vegetable Grown
Distribution of respondents according to Types of Vegetable
Grown
49
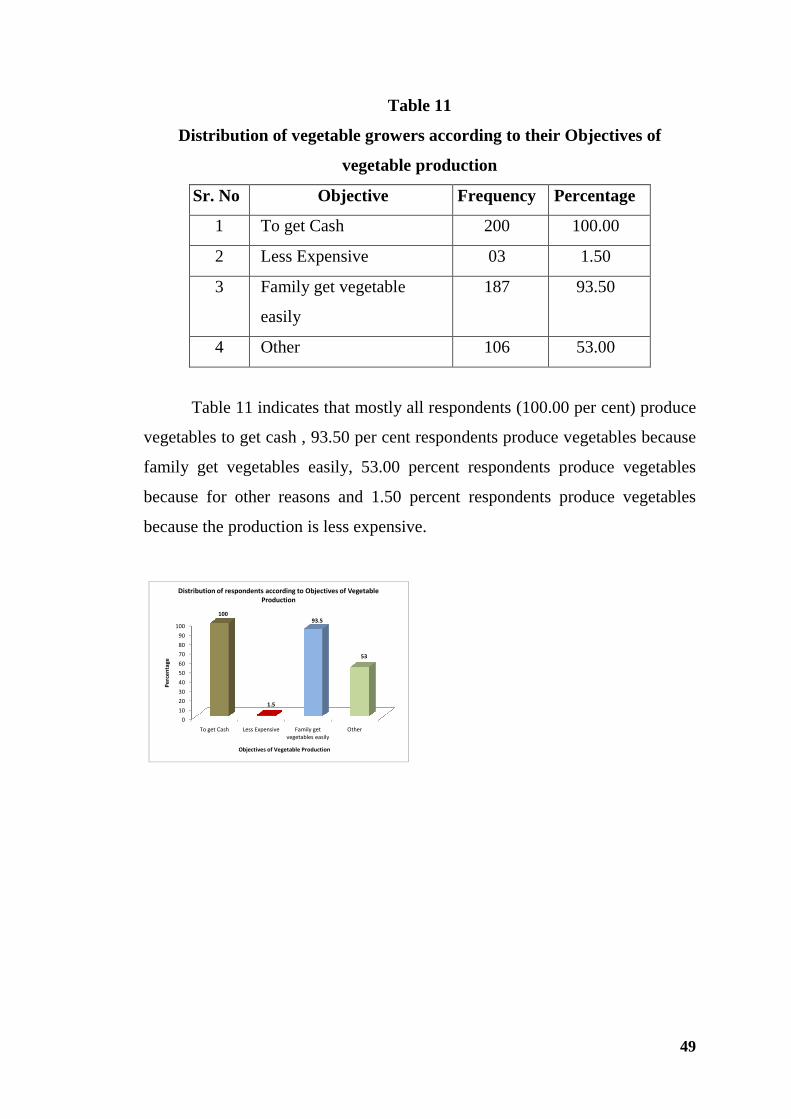
Table 11
Distribution of vegetable growers according to their Objectives of
vegetable production
Sr. No Objective Frequency Percentage
1 To get Cash 200 100.00
2 Less Expensive 03 1.50
3 Family get vegetable
easily
187 93.50
4 Other 106 53.00
Table 11 indicates that mostly all respondents (100.00 per cent) produce
vegetables to get cash , 93.50 per cent respondents produce vegetables because
family get vegetables easily, 53.00 percent respondents produce vegetables
because for other reasons and 1.50 percent respondents produce vegetables
because the production is less expensive.
0
10
20
30
40
50
60
70
80
90
100
To get Cash Less Expensive Family get
vegetables easily
Other
100
1.5
93.5
53
Pe
rce
nta
ge
Objectives of Vegetable Production
Distribution of respondents according to Objectives of Vegetable
Production

50
Table 11 a
Distribution of vegetable growers according to their Other Objectives of
growing vegetables
Sr.
No
Other objective Frequency Percentage
1 a) Support to Farming
b) Meet family Expenses 10 9.43
2 Economical Support 15 14.15
3 Meet Family Expenses 12 11.32
4 For more Income 01 0.0.94
5 Support Farming 68 64.15
Total 106
Table-11a, indicates that mostly all respondents 100 percent produce
vegetable to get cash 93.50 percent respondents produce vegetable so family
get vegetable easily 53.00 percent respondents produce vegetables for other
reasons as given details in table no 11 a and 1.50 percent respondents produce
vegetable because it is less expensive.

51
Table 12
Distribution of vegetable growers according to their Sources of
information regarding vegetable seeds
Sr.
No
Source of information Frequency Percentage
1 Agricultural assistant 1 0.50
2 Big farmers 1 0.50
3 Center for sustainable
Agriculture
02 01.00
4 Agriculture Input Shop 181 90.50
5 No Answer 15 7.50
According to table 12, 90.50 percent respondents get information from
Agriculture input shop, 7.50 respondents didn’t answer, 01.00 percent of
respondents get information from center for sustainable Agriculture, 0.50
percent respondents get information from big farmers and 0.50 percent
respondents get information regarding vegetable seeds from Agriculture
Assistant of Agriculture department.
0
20
40
60
80
100
0.5 0.5 1
90.5
7.5
Pe
rce
nta
ge
Sources of Information
Distribution of respondents according to Source of
Information

52
Table 13
Distribution of vegetable growers according to their Sources of vegetable
Seed purchase
Sr.
No
Source of purchase Frequency Percentage
1 Agriculture Nursery 01 0.50
2 Agriculture input
shop
199 99.50
It is observed from table-13 that mostly all 99.50 percent respondents
purchase vegetable Seeds from Agriculture input Shop and only 0.50 percent
respondents purchase vegetable Seeding from Agriculture nursery.
0
20
40
60
80
100
Agriculture Nursery Agriculture input shop
0.5
99.5
Pe
rce
nta
ge
Sources of Vegetable Seed Purchase
Distribution of respondents according to Source of Vegetable
Seed Purchase

53
Table 14
Distribution of vegetable growers according to Guaranty of Production
from Seeds
Sr.
No
Seeds Viability Frequency Percentage
1 Guaranty of seeds production 119 59.50
2 No Guaranty of seed 81 40.50
It is clear from the Table-14 that 59.50 percent of respondents say that
here in Guarantee of seed for production and 40.50 percent of respondents says
that there in no guarantee of seed for production.
0
10
20
30
40
50
60
Guaranty of seeds
production
No Guaranty of seed
59.5
40.5
Pe
rce
nta
ge
Guaranty of Production from Seeds
Distribution of respondents according to Guaranty of
Production from Seeds

54
Table 15
Distribution of vegetable growers according to their Vegetable farming
Groups
Sr.
No
Groups Frequency Percentage
1 Vegetable farming with Group 33 16.50
2 No Groups 167 83.50
Table-15, shows clearly that 83.50 percent respondents grows
vegetables without any groups and 16.50 percent respondents do vegetable
farming with groups.
0
20
40
60
80
100
Vegetable farming with
Group
No Groups
16.5
83.5
Pe
rce
nta
ge
Vegetable farming Groups
Distribution of respondents according to Vegetable farming
Groups

55
Table 16
Distribution of vegetable growers according to their Input from farming
Groups
Sr.
No
Input from Groups Frequency Percentage
1 Take inputs from groups 10 30.30
2 Don’t take inputs from groups 23 69.69
Total 33
Table-16 indicates that 69.69 percent of respondents take input from
Groups and 30.30 percent respondents don’t take inputs from groups formed
for vegetable production.
0
10
20
30
40
50
60
70
Take inputs from groups Don’t take inputs from
groups
30.3
69.69
Pe
rce
nta
ge
Input from farming Groups
Distribution of respondents according to Input from farming
Groups

56
4.3 The labour related aspects and labour problems of the vegetable
growers.
Table 17
Distribution of vegetable growers according to the Total Labours required
for production of vegetable on 1 Arc of Land
Sr. No Total Labours required Frequency Percentage
1 Up to 5 Labours 143 71.50
2 6 to 15 Labours 55 27.50
3 More than 15
Labours
02 01.00
According table-17, 71.50 percent of respondent require up to 05
Labours for production of vegetable on 1 Arc of land, 27.50 percent of
respondent requires 6 to 15 Labours and 1.00 percent of respondent require
more than 15 labours for production off vegetables on 1 Arc of land.
0
10
20
30
40
50
60
70
80
Up to 5 Labours 6 to 15 Labours More than 15 Labours
71.5
27.5
1
Pe
rce
nta
ge
Total Labours required for production of vegetable on 1 Arc of Land
Distribution of respondents according to Total Labours required
for production of vegetable on 1 Arc of Land.

57
Table 17 a
Distribution of vegetable growers according to the Availability of Labours
Sr.
No
Availability of labour Frequency Percentage
1 Labours are available 166 83.00
2 Labour are not available 34 17.00
According table- 17.a it is seen that 83.00 per cent respondents said
labours are available and 17.00 00 per cent respondents said labours are not
available.
0
10
20
30
40
50
60
70
80
90
Labours are available Labour are not available
83
17
Pe
rce
nta
ge
Availability of labour
Distribution of respondents according to Availability of labour

58
Table 18
Distribution of vegetable growers according to the Requirement of skilled
labours for vegetable production
Sr. No Skilled labours requirement Frequency Percentage
1 Skill labours required 21 10.50
2 Skilled labours are not required 179 89.50
Table-18 indicates that 89.50 per cent of respondent did not requires
skilled labours for vegetable production and 10.50 per cent respondents
required skilled labours for vegetable production.
0
10
20
30
40
50
60
70
80
90
Skill labours required Skilled labours are not
required
10.5
89.5
Pe
rce
nta
ge
Requirement of skilled labours for vegetable production
Distribution of respondents according to Requirement of
skilled labours for vegetable production.

59
Table 19
Distribution of vegetable growers according to the Availability Skilled of
labour
Sr. No Availability of Skilled labour Frequency Percentage
1 Skilled labours available 177 88.50
2 Skilled labours are not available 23 11.50
It is observed from table-19 that 88.50 per cent of respondent says
skilled labours are available and 11.50 per cent of respondent says Skilled not
are available for vegetable production.
0
10
20
30
40
50
60
70
80
90
Skilled labours available Skilled labours are not
available
88.5
11.5
Pe
rce
nta
ge
Availability Skilled of labour
Distribution of respondents according to Availability Skilled
of labour

60
Table 20
Distribution of vegetable growers according to the Time Hours labours
need
Sr.
No
Time Hours Frequency Percentage
1 Morning Hours 157 78.50
2 Afternoon Hours 120 60.00
3 Full Day 34 17.00
According to the table-20 78.50 percent respondent required labour in
morning hours, 60.00 percent of respondents required labours in afternoon
hours and 17.00 percent respondents required full day labours for vegetable
production.
0
10
20
30
40
50
60
70
80
Morning Hours Afternoon Hours Full Day
78.5
60
17
Pe
rce
nta
ge
Timings of labours Hours needed
Distribution of respondents according to Time Hours
labours need

61
Table 22
Distribution of vegetable growers according to the Requirement of Skilled
labours for vegetable Pickings
Sr. No Skilled labour requirement for
picking
Frequency Percentag
e
1 Skilled labour required 23 11.50
2 Skilled labours not required 177 88.50
As per the details shown in the table-22, 88.50 per cent respondents
didn’t required Skilled labours for vegetable pickings and 11.50 per cent
respondents requires skilled labours for vegetable pickings in vegetable
production.
0
10
20
30
40
50
60
70
80
90
Skilled labour required Skilled labours not required
11.5
88.5
Pe
rce
nta
ge
Requirement of Skilled labours for vegetable Pickings
Distribution of respondents according to Requirement of Skilled
labours for vegetable Pickings

62
Table 23
Distribution of vegetable growers according to the Period of vegetable
production
Sr.
No
Period Frequency Percentage
1 Up to 3 months 131 65.50
2 3.01 to 5 months 16 8.00
3 More than 5 month 53 25.50
According to the table-23, 65.50 per cent respondents produce
vegetables having a period of 3 months, 25.50 per cent respondents produce
vegetable having a period of more than 5 months and 8.00 per cent respondents
produce vegetables having a period from 3.01 to 5 months.
0
10
20
30
40
50
60
70
Up to 3 months 3.01 to 5
months
More than 5
month
65.5
8
25.5
Pe
rce
nta
ge
Period of Vegetable Production
Distribution of respondents according to Period of
Vegetable Production

63
Table 24
Distribution of vegetable growers according to the Mode of wages
payments
Sr. No Mode Frequency Percentage
1 Barter 0 00.00
2 Money 200 100.00
It is clearly observed from table-24, that all 100.00 per cent respondents
pay money as mode of wages payment and there was no respondents using
barter system as mode of wages payment.
0
10
20
30
40
50
60
70
80
90
100
Barter Money
0
100
Pe
rce
nta
ge
Mode of Wages Payment
Distribution of respondents according to Mode of Wages
Payment

64
Table 25
Distribution of vegetable growers according to the Types of wage fixation
Sr.
No
Types of wage fixation Frequency Percentage
1 Hourly 11 5.50
2 Per Day Basis 196 98.00
3 Monthly Basis 0 0
According to the table-25, 98.00 per cent respondents fixes the wages as
per daily –basis, 5.50 per cent respondents fixes wages as per hourly basis and
no respondents fix wage on monthly basis.
0
20
40
60
80
100
Hourly Per Day Basis Monthly Basis
5.5
98
0Pe
rce
nta
ge
Types of Wage Fixation
Distribution of respondents according to Types of Wage
Fixation

65
Table 26
Distribution of vegetable growers according to their Problems regarding
labour
Sr. No Problems regarding labours Frequency Percentage
1 Labours are not easily Available 22 11.00
2 Labours wages are High 19 9.50
3 Other villages labours were brought 15 7.50
4 No Problems 144 72.00
Table-26, Indicates that 72.00 per cent respondents didn’t face any
problem regarding labors, 11.00 per cent of respondents says that labours are
not easily available, 9.50 per cent of respondents feels that labour wages are
high and 7.50 per cent respondents have to brought labours from other villages.
0
10
20
30
40
50
60
70
80
Labours are
not easily
Available
Labours
wages are
High
Other villages
labours were
brought
No Problems
119.5
7.5
72
Pe
rce
nta
ge
Labour Problems
Distribution of respondents according to Problems
regarding Labour

66
Table 27
Distribution of vegetable growers according to the Solution Suggested on
Labour Problems
Sr. No. Solutions Frequency Percentage
1 Use High tech farming 02 01.00
2 Give proper rates to veg produce 01 0.50
3 Sometimes labours were brought
from other villages
02 01.00
4 Labours rates should be fixed 04 02.00
5 No Solutions Suggested 191 95.50
It revealed from table-27, that majority number (95.50 per cent) of the
respondents not suggested any solutions, 2.00 per cent respondents suggested
that labours wages should be fixed, 1.00 per cent respondents suggested that
high tech farming should be used, 1.00 per cent respondents says that
sometimes labours have to brought from other villages and 0.50 per cent
respondents suggested that they should get proper rates to vegetable produce.
0102030405060708090
100
1 0.5 1 2
95.5
Pe
rce
nta
ge
Solution Suggested for Labour Problems
Distribution of respondents according to Solution Suggested
for Labour Problems

67
4.4 The marketing related aspects and marketing problems of the
vegetable growers.
Table 28
Distribution of vegetable growers according to the Level of vegetable
Market
Sr.
No
Level of Market Frequency Percentage
1 District of Market 124 62.00
2 Taluka (Block) Level 78 30.00
3 Village Market 30 15.00
4 Other 07 3.50
As per the table-28, 62.00 per cent respondents sold their vegetable
produce at District level market, 30.00 per cent respondents sold their
vegetable produce at Taluka (Block) Level market, 15.00 per cent respondents
sold their vegetable produce at village level market and 3.50 per cent of
respondents sold their vegetable produce in other markets.
0
10
20
30
40
50
60
70
District of
Market
Taluka (Block)
Level
Village Market Other
62
30
15
3.5
Pe
rce
nta
ge
Vegetable Market
Distribution of respondents according to Level of Vegetable
Market

68
Table 29
Distribution of vegetable growers according to their Market Type
Sr. No Market Type Frequency Percentage
1 Wholesale Market 191 95.50
2 Retail Market 26 13.00
According to the table-29, It is observed that 95.50 per cent respondents
sold their vegetable produce at wholesale vegetable market and 13.50 per cent
respondents sold their vegetable produce at retail market.
0
20
40
60
80
100
Wholesale Market Retail Market
95.5
13.5
Pe
rce
nta
ge
Market Type selected
Distribution of respondents according to Market Type
selected

69
Table 30
Distribution of vegetable growers according to their System of Selling
Vegetable Produce
Sr.
No
System Frequency Percentage
1 By self 12 06.00
2 Through Commission Agent
(Brokers)
188 94.00
As per the table 30, 94.00 per cent of respondents sell their vegetable
produce through commission agents (Brokers) and a meager percentage (06.00
per cent) of respondents sell their vegetable produce without taking help of
commission agent (Brokers).
0
20
40
60
80
100
By self Through Commission Agent
(Brokers)
6
94
Pe
rce
nta
ge
System of Selling Vegetable Produce
Distribution of respondents according to System of Selling
Vegetable Produce

70
Table 31
Distribution of vegetable growers according to their If sold by own then
what are the rates
Sr.
No
Rates of produce Frequency Percentage
1 As per market rates 186 93.00
2 Lowered rates 14 07.00
It is observed from the table-31, that 93.00 per cent respondents get
market rates if sell their vegetable produce by own and 7.00 per cent
respondents get lowered rates when sell their vegetable produce by own
(without taking help of commission Agent).
0
20
40
60
80
100
As per market rates Lowered rates
93
7Pe
rce
nta
ge
Rates of produce if sold by own
Distribution of respondents according to Rates of produce if
sold by own

71
Table 32
Distribution of vegetable growers according to the Percentage of
Commission Agent (Broker)
Sr.
No
Percentage of Commission
Agent
Frequency Percentage
1 2 to 8 percent 58 29.00
2 9 to 12 percent 142 71.00
From table-32, it reveals that 71.00 per cent respondents have to give 9
to 12 percent of commission to the agent (Broker) on their sold produce and
29.00 percent of respondent have to give 2 to 8 percent of commission to agent
(Broker) on their sold vegetable produce.
0
10
20
30
40
50
60
70
80
2 to 8 percent 9 to 12 percent
29
71
Pe
rce
nta
ge
to Percentage of Commission Agent (Broker)
Distribution of respondents according to Percentage of
Commission Agent (Broker)

72
Table 33
Distribution of vegetable growers according Brokers Commission
Affordable
Sr.
No
Brokers Commission Frequenc
y
Percentage
1 Affordable 50 25.00
2 Not Affordable 150 75.00
According to the table 33, 75.00 percentage of respondents not afford
Brokers Commission while selling vegetable produce and 25.00 percentage
respondent affort Brokers Commission while selling vegetable produce.
0
10
20
30
40
50
60
70
80
Affordable Not Affordable
25
75
Pe
rce
nta
ge
Brokers Commission
Distribution of respondents according to Brokers Commission
Affordable

73
Table 34 Distribution of vegetable growers according to their Types of charges by
Broker Sr. No Types of charges by Broker Frequency Percentage
1 No reply 24 12.00 2 Commission 17 8.50 3 Commission + Hamali 103 51.50 4 Commission +Hamali + Weighing charge 21 10.50 5 Commission + Weighing charge 07 03.50 6 Hamali 10 05.00 7 Hamali + Market Fee 16 08.00 8 Hamali + Weighing charge 02 01.00
As per the details shown in table-34, 51.50 per cent respondent were charged commission and hamali by the broker while selling vegetable produce in the whole sale market 12.00 per cent respondents had not replied or not known about the types of charges. 10.50 per cent of respondent were charged commission, Hamali and weighing charge by the Broker, 8.50 percent respondent says only commission was charged by the broker. 8.00 per cent respondents replied as they were charged Hamali and market fee, 5.00 per cent respondents were charged only Hamali by the broker. 3.50 per cent of respondent were charged commission and weighing charges and 1.00 percent of respondents were charged Hamali and weighing charge by the broker at the time of selling vegetable produce.
0
50
100
12 8.5
51.5
10.5 3.5 5 8 1
Pe
rce
nta
ge
Types of charges by Broker
Distribution of respondents according to Types of charges by
Broker

74
Table 35
Distribution of vegetable growers according to their Rates when vegetable
produce sold through Brokers
Sr.
No
Rates Frequency Percentage
1 Get proper Rates 129 64.50
2 Not Get Proper 50 25.00
3 Sometimes get proper Rates 21 10.50
From table 35, It is observed that 64.50 per cent respondent get proper
rates for their vegetable produce when sold through Brokers in the market.
25.00 per cent of respondent didn’t get proper rates and 10.50 per cent
respondent sometimes gets proper rates when their vegetable produce sold
through Brokers in the market.
0
10
20
30
40
50
60
70
Get proper Rates Not Get Proper Sometimes get
proper Rates
64.5
25
10.5
Pe
rce
nta
ge
vegetable produce sold through Brokers
Distribution of respondents according to Rates when
vegetable produce sold through Brokers

75
Table 36
Distribution of vegetable growers according to the Time for getting cash
after selling produce
Sr. No Cash get Frequency Percentage
1 Cash get immediately 194 97.00
2 Cash get late 06 03.00
As per the table-36, most of the respondents (97.00 percent) get the cash
immediately after selling the vegetable produce and 3.00 percent of respondent
get cash late of vegetable produce
0
10
20
30
40
50
60
70
80
90
100
Cash get immediately Cash get late
97
3
Pe
rce
nta
ge
Time for getting cash after selling produce
Distribution of respondents according to Time for getting
cash after selling produce

76
Table 37
Distribution of vegetable growers according to their Broker free market
concept
Sr.
No
Market Concept Frequency Percentage
1 Broker free market 128 64.00
2 A Broker are required 10 5.00
3 Best options should be
discovered 1 0.50
4 Can’t say 52 26.00
5 Didn’t answer 9 4.50
It is observed from the table 37, that 64.00 percent of respondents need
the market should be free from broker, 26.00 percent of respondents can’t say
about broker free market concept, 5.00 percent of respondents need broker in
the vegetable markets, 4.50 percent of respondents didn’t answer.
0
20
40
60
80
Broker free
market
A Broker
are
required
Best
options
should be
discovered
Can’t say Didn’t
answer
64
50.5
26
4.5Pe
rce
nta
ge
Broker free Market Concept
Distribution of respondents according to Broker free Market
Concept

77
Table 38
Distribution of vegetable growers according to their Problems regarding
broker
Sr.
No
Problems regarding broker Frequency Percentage
1 A Broker free market 31 15.50
2 Brokers do malpractice, partialities 20 10.00
3 Commission should be reduce 48 24.00
4 Vegetables should get proper rates 15 7.50
5 Didn’t answer 40 20.00
6 No Problem 46 23.00
As per the details shown in the Table-38, 24.00 per cent respondents feel
that commission should be reduce, 23.00 per cent respondents had no problem
with brokers, 20.00 per cent respondents didn’t answer, 15.50 per cent
respondents wanted a broker free market, 10.00 per cent respondents answered
that brokers do malpractice, partialities and keep their own interest and 7.50 per
cent respondents thought vegetables should get proper rates.
05
10152025
A B
rok
er
fre
e
ma
rke
t
Bro
ke
rs d
o
ma
lpra
ctic
e,
pa
rtia
liti
es
Co
mm
issi
on
sho
uld
be
re
du
ce
Ve
ge
tab
les
sho
uld
ge
t p
rop
er
rate
s
Did
n’t
an
swe
r
No
Pro
ble
m
15.5
10
24
7.5
2023
Pe
rce
nta
ge
Problems regarding Broker
Distribution of respondents according to Problems regarding
Broker
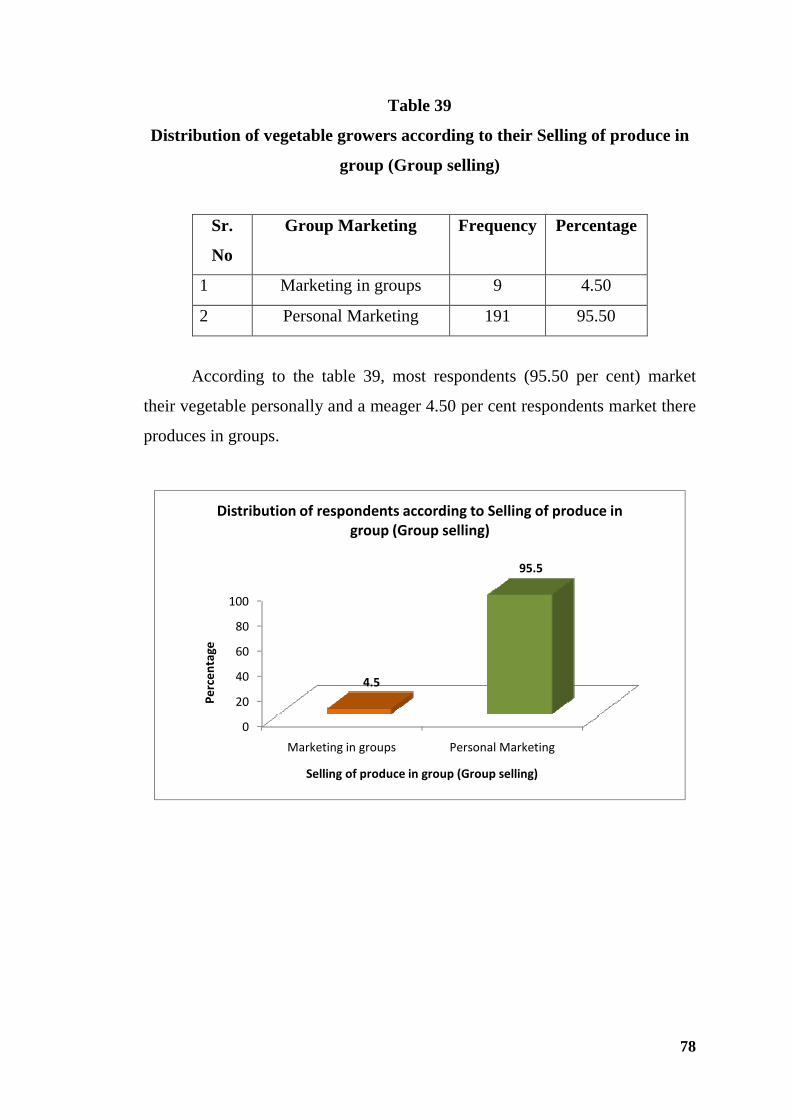
78
Table 39
Distribution of vegetable growers according to their Selling of produce in
group (Group selling)
Sr.
No
Group Marketing Frequency Percentage
1 Marketing in groups 9 4.50
2 Personal Marketing 191 95.50
According to the table 39, most respondents (95.50 per cent) market
their vegetable personally and a meager 4.50 per cent respondents market there
produces in groups.
0
20
40
60
80
100
Marketing in groups Personal Marketing
4.5
95.5
Pe
rce
nta
ge
Selling of produce in group (Group selling)
Distribution of respondents according to Selling of produce in
group (Group selling)

79
Table 40
Distribution of vegetable growers according to their Grading of vegetables
Sr.
No
Grading Frequency Percentage
1 Do Grading 180 90.00
2 Don’t Grade 20 10.00
Table 40 highlighted that majority (90.00 per cent) respondents grade
there vegetables produce before marketing, and 10.00 per cent respondents
don’t grade their vegetable produce before marketing.
0
10
20
30
40
50
60
70
80
90
Do Grading Don’t Grade
90
10
Pe
rce
nta
ge
Grading of vegetables
Distribution of respondents according to Grading of vegetables
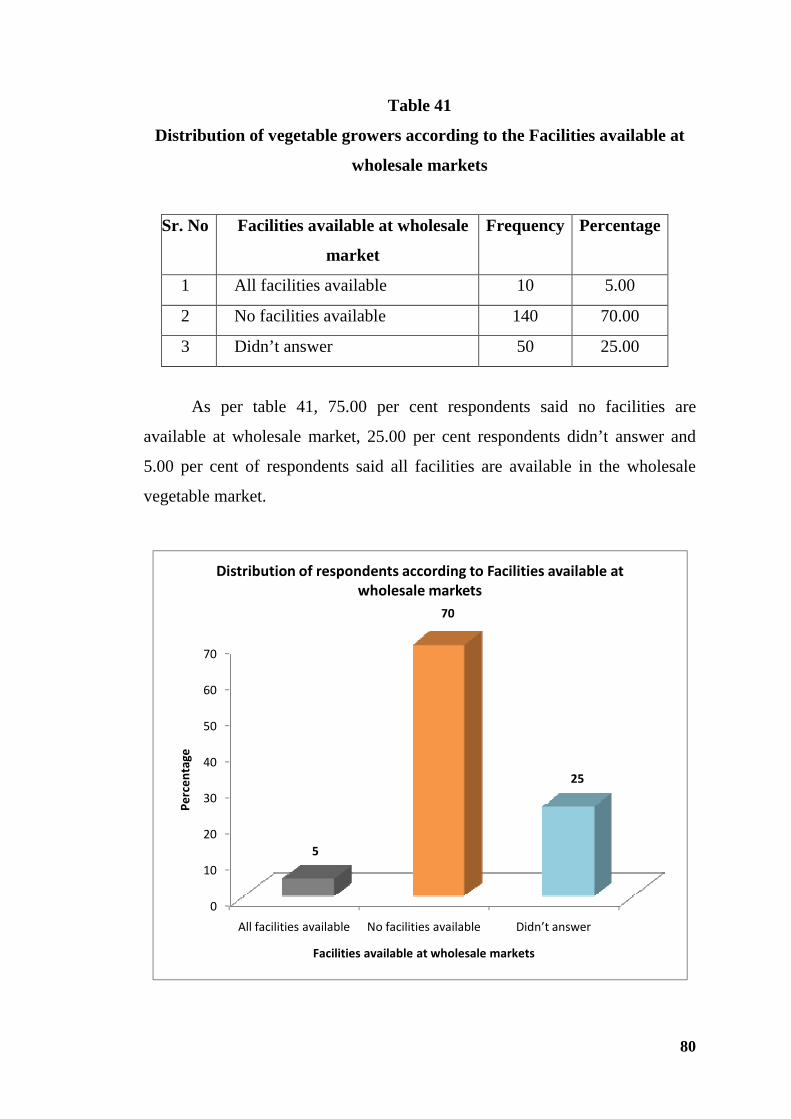
80
Table 41
Distribution of vegetable growers according to the Facilities available at
wholesale markets
Sr. No Facilities available at wholesale
market
Frequency Percentage
1 All facilities available 10 5.00
2 No facilities available 140 70.00
3 Didn’t answer 50 25.00
As per table 41, 75.00 per cent respondents said no facilities are
available at wholesale market, 25.00 per cent respondents didn’t answer and
5.00 per cent of respondents said all facilities are available in the wholesale
vegetable market.
0
10
20
30
40
50
60
70
All facilities available No facilities available Didn’t answer
5
70
25
Pe
rce
nta
ge
Facilities available at wholesale markets
Distribution of respondents according to Facilities available at
wholesale markets

81
Table 42
Distribution of vegetable growers according to the Satisfaction about
facilities available at wholesale market
Sr.
No
Satisfaction about facilities Frequency Percentage
1 Satisfied with facilities
available 37 18.50
2 Not satisfied 163 81.50
According to the table 42, 81.50 per cent respondents say they are not
satisfied by the facilities available at wholesale market while 18.50 percent
respondent say that they are satisfied by the facilities available at the wholesale
vegetable market.
0
20
40
60
80
100
Satisfied with facilities
available
Not satisfied
18.5
81.5
Pe
rce
nta
ge
Satisfaction about facilities available at wholesale market
Distribution of respondents according to Satisfaction about
facilities available at wholesale market

82
Table 43 Distribution of vegetable growers according to the Reasons of
dissatisfaction for facilities available at wholesale market Sr. No Reason of dissatisfaction Frequency Percentage
1 Facilities aren’t proper 193 96.5
2 Can’t say 6 3.00
3 No Cleanness 1 0.50
In table 43, majority (96.5 percent) respondents say that the facilities
aren’t proper, 3.00 percent respondent couldn’t answer the question while 0.50
percent respondents say the wholesale market premise aren’t clean.
Table 44
Distribution of vegetable growers according If supply of vegetables in
wholesale market increases, then the rates gets decreases
Sr. No If supply increase Rate decrease Frequency Percentage
1 Supply increase Rate decrease 196 98.00
2 Supply increase Rate not decrease 04 02.00
Table-44, Shows that 98.00 per cent respondents says that if supply of
vegetable produce in the wholesale market the rate get decreased and 2.00 per
cent respondents says that if supply increases the rate of vegetables not
decreases.
0
50
100
Supply increase Rate
decrease
Supply increase Rate
not decrease
98
2
Pe
rce
nta
ge
Rate Trends of Vegetables in Wholesale Market
Distribution of respondents according to If supply of
vegetables in wholesale market increases, then the rates gets
decreases

83
Table 45
Distribution of vegetable growers according to their Availability of cold
storage if vegetable rates are low
Sr. No Availability of cold
storage
Frequency Percentage
1 Cold storage available 23 11.50
2 Cold storage not
Available
177 88.50
It is clear from the table-45, that respondents (88.50 per cent) say that
cold storage facility is not available in the whole sale market if rates of
vegetable are low in the market where as 11.50 per cent respondents says cold
storage facilities are available in the market.
0
10
20
30
40
50
60
70
80
90
Cold storage available Cold storage not Available
11.5
88.5
Pe
rce
nta
ge
Availability of cold storage
Distribution of respondents according to Availability of cold
storage
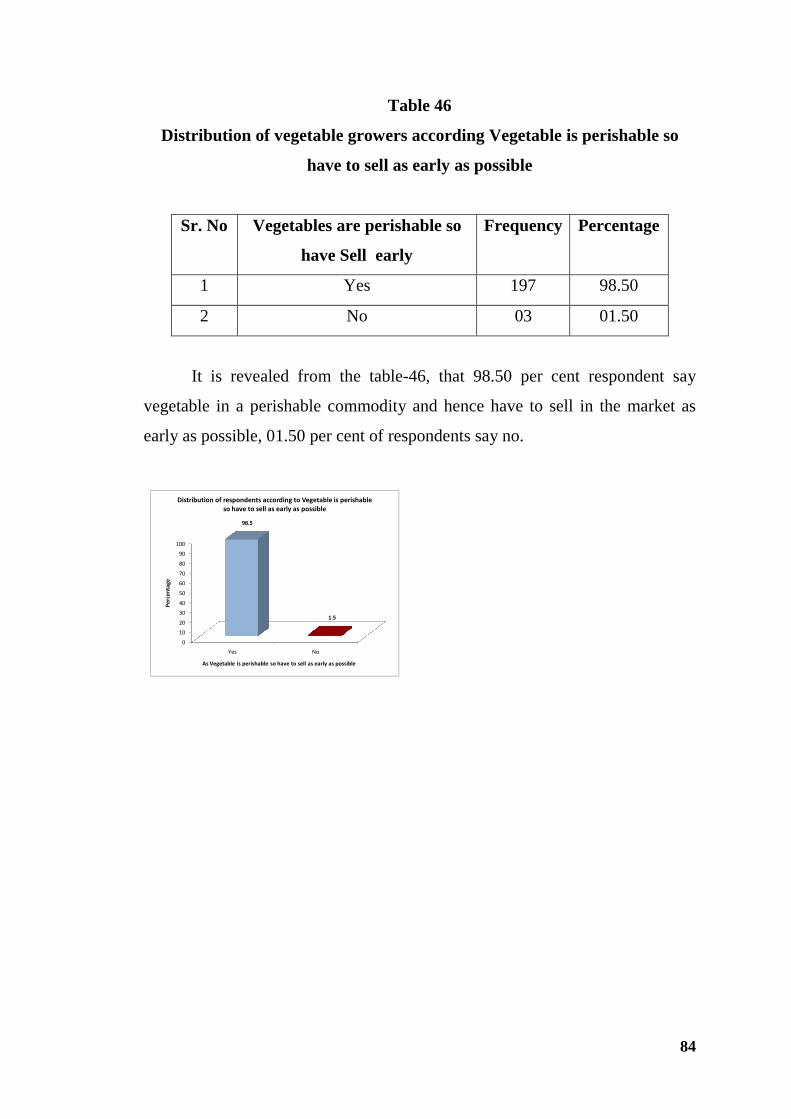
84
Table 46
Distribution of vegetable growers according Vegetable is perishable so
have to sell as early as possible
Sr. No Vegetables are perishable so
have Sell early
Frequency Percentage
1 Yes 197 98.50
2 No 03 01.50
It is revealed from the table-46, that 98.50 per cent respondent say
vegetable in a perishable commodity and hence have to sell in the market as
early as possible, 01.50 per cent of respondents say no.
0
10
20
30
40
50
60
70
80
90
100
Yes No
98.5
1.5
Pe
rce
nta
ge
As Vegetable is perishable so have to sell as early as possible
Distribution of respondents according to Vegetable is perishable
so have to sell as early as possible

85
Table 47
Distribution of vegetable growers according As vegetable is Perishable do
it gets proper rates
Sr. No Rates Frequency Percentage
1 Get proper rates 21 10.50
2 Didn’t get proper rates 179 89.50
As per the table-47, 89.50 per cent respondent says that they didn’t get
proper rates as vegetable in a perishable commodity and have to sell as early as
possible and 10.50 per cent respondents say that they get proper rates.
0
10
20
30
40
50
60
70
80
90
Get proper rates Didn’t get proper rates
10.5
89.5
Pe
rce
nta
ge
As vegetable in Perishable do it gets proper rates
Distribution of respondents according to As vegetable in
Perishable do it gets proper rates

86
Table 48
Distribution of vegetable growers according to their Knowledge regarding
cold storage
Sr. No Knowledge regarding cold
storage Frequency
Percentag
e
1 Know about cold storage 53 26.50
2 Don’t know about cold storage 147 73.50
It is observed from the table 48, that 73.50 per cent respondents don’t
know about cold storage and 26.50 per cent respondents know about cold
storage for vegetable produce.
0
10
20
30
40
50
60
70
80
Know about cold
storage
Don’t know about
cold storage
26.5
73.5
Distribution of respondents according to Knowledge regarding
cold storage
Know about cold storage
Don’t know about cold
storage

87
Table 49
Distribution of vegetable growers according to their Use cold storage, If
provided
Sr.
No
Use cold storage if provide Frequency Percentag
e
1 Use the cold storage if provided 173 86.50
2 Will not use the cold storage if
provided
27 13.50
As per table 49, 86.50 per cent of respondents says that they will use the
cold storage facility for vegetables if provided in the wholesale market. And
13.50 per cent respondents say that they will not use cold storage facility if
provided.
0
10
20
30
40
50
60
70
80
90
Use the cold storage if provided Will not use the cold storage if
provided
86.5
13.5
Pe
rce
nta
ge
Use cold storage, If provided
Distribution of respondents according to Use cold storage, If
provided

88
Table 50
Distribution of vegetable growers according to their Problems regarding
storage facilities
Sr. No Facilities Frequency Percentage
1 No storage facilities 153 76.50
2 Vegetables are Perishable so Cold
storage facilities should be
provided 153 76.50
As per the details shown in table-50, 76.50 per cent of respondents said
that there are no storage facilities in the wholesale vegetable market, 76.50 per
cent respondents said that vegetable are perishable commodity so cold storage
facility should be provided in the whole sale market.
0
10
20
30
40
50
60
70
80
No storage facilities Vegetables are Perishable so
Cold storage facilities should
be provided
76.5 76.5
Pe
rce
nta
ge
Problems regarding Storage Facilities
Distribution of respondents according to Problems
regarding Storage Facilities

89
Table 51
Distribution of vegetable growers according to their Means of vegetable
transport
Sr. No Means of transport Frequency Percentage
1 Bullock cart 06 03.00
2 Five wheeler Auto 75 37.50
3 Bike 78 39.00
4 Bicycle 04 02.00
5 Other,(407, Auto 3, Truck,
207, Bus, etc)
37 18.50
According to the table 51, 39.00 per cent respondents use bike to
transport vegetables from farm to wholesale market, 37.50 per cent respondents
use five wheeler Auto for transport of vegetables, 18.50 per cent respondents
use other transport facilities such as Truck, Matador, Minidoor, three wheeler,
passenger Auto, Bus etc, 3.00 per cent respondents use bullock cart for
transport of vegetables and 02.00 per cent of respondents use bicycle for
transport of vegetable from farm to wholesale market.
0
10
20
30
40
Bu
llo
ck
ca
rt
Fiv
e w
he
ele
r A
uto
Bik
e
Bic
yc
le
Oth
er,
(40
7, A
uto
3, T
ruc
k,
20
7,
Bu
s, e
tc)
3
37.5 39
2
18.5
Pe
rce
nta
ge
Means of vegetable transport
Distribution of respondents according to Means of vegetable
transport

90
Table 52
Distribution of vegetable growers according to their Transport facility
Sr. No Transport facility Frequency Percentage
1 Personal 87 43.5
2 Don’t have Personal 113 56.5
Table 52, shows that 56.50 per cent respondents don’t have their own
personal transport facility to transport vegetables from farm to wholesale
market and 43.50 per cent respondents have their own personal transport
facility to transport vegetable from farm to wholesale market.
0
10
20
30
40
50
60
Personal Don’t have Personal
43.5
56.5
Pe
rce
nta
ge
Transport Facility
Distribution of respondents according to Transport
Facility

91
Table 53
Distribution of vegetable growers according to the Timely Availability of
transport facility
Sr. No Timely Availability of transport
facility
Frequency Percentage
1 Timely Available 169 84.50
2 Not Available Timely 31 15.50
According to the table 53 it is observed that 84.50 per cent respondents
get the transport facility timely as and when required and 15.50 percent
respondents didn’t get the transport facilities timely to transport vegetables
from farm to wholesale market.
0
10
20
30
40
50
60
70
80
90
Timely Available Not Available Timely
84.5
15.5
Pe
rce
nta
ge
Timely Availability of transport facility
Distribution of respondents according to Timely Availability
of transport facility

92
Table 54
Distribution of vegetable growers according to their Losses Due to Non
Availability Transport facility timely
Sr. No Losses due to Non
Availability
Frequency Percentage
1 Have to Bear Losses 53 26.50
2 Don’t had losses 147 73.50
Table 54, shows clearly that 73.50 per cent respondents don’t have
losses due to non availability of transport facilities and 26.50 per cent
respondents have to bear losses due to non availability of transport facilities to
transport vegetable produce from farm to wholesale market.
0
10
20
30
40
50
60
70
80
Have to Bear Losses Don’t had losses
26.5
73.5
Pe
rce
nta
ge
Losses Due to Non Availability of Transport facility timely
Distribution of respondents according to Losses Due to Non
Availability of Transport facility timely

93
Table 55
Distribution of vegetable growers according to their Problems regarding
Transport facilities
Sr. No Problems regarding transport Frequency Percentage
1 No proper roads 02 01.00
2 Transport is Expensive 03 01.50
3 No Transport facility in village 01 0.50
4 Transport is not available timely 14 07.00
5 Police give challans 01 00.50
6 No Problems 179 89.50
As per the details shown in table 55, 89.50 per cent respondents had no
problems regarding transport facilities,7.00 per cent transport didn’t get
transport facilities timely, 1.50 per cent respondents says transport of
vegetable produce is expensive, 1.00 per cent respondents says roads are not
proper, 0.50 per cent of respondents says there are no transport facilities in
villages and 0.50 per cent respondents says traffic police give challans for
vegetable transport.
0
50
100
1 1.5 0.5 7 0.5
89.5
Pe
rce
nta
ge
Problems regarding Transport facilities
Distribution of respondents according to Problems regarding
Transport facilities

94
Table 56
Distribution of vegetable growers according to their Suggestions for
transport facilities
Sr. No Suggestions Frequency Percentage
1 Special facility should be made
available for vegetable transport
08 4.00
2 Transportation rates should be reduced 04 2.00
3 No suggestion 188 94.00
As shown in table 56, 94.00 per cent respondents didn’t suggest
regarding transport facilities, 4.00 per cent respondents says that special facility
should be made available for vegetable transport and 2.00 per cent respondents
says that transportation rates should be reduced.
Table 57
Distribution of vegetable growers according to the Vegetables purchase by
APMC
Sr. No Vegetable purchase by APMC Frequency Percentage
1 APMC purchase vegetable
produce
53 26.50
2 APMC not purchase 147 73.50
As per the table 57, 73.50 percent of respondents says that APMC not
purchase vegetable produce and 26.50 percent of respondents says APMC
purchase vegetable produce.

95
Table 58 Distribution of vegetable growers according to the Vegetable should have
minimum support price Sr. No Minimum Support Price For
vegetable produce Frequency Percentage
1 Yes 194 97.00 2 No 06 03.00
Table 58 shows that mostly all (97.00 per cent) respondent says that
there should be minimum support price for vegetable produce and only 03.00
per cent respondent say no for minimum support price for vegetable produce.
Table 59 Distribution of vegetable growers according to the Wholesale market is
controlled by Brokers Sr. No Wholesale market controlled by Brokers Frequency Percentage
1 Yes 88 44.00 2 No 107 53.50 3 Can’t say 05 02.50
According to the table-59, 53.50 per cent respondent says market is not
controlled by Brokers, 44.00 per cent respondents replied that vegetable
wholesale market in controlled by Brokers and 2.50 per cent respondents can’t
answer the questions.
0
10
20
30
40
50
60
Yes No Can’t say
44
53.5
2.5
Pe
rce
nta
ge
Wholesale market controlled by Brokers
Distribution of respondents according to Wholesale market
controlled by Brokers

96
Table 60 Distribution of vegetable growers according to the Government actions
required Sr. No Government actions required Frequency Percentage
1 Proper rates/minimum support price 67 33.50 2 Proper Facilities/storage/cold storage 48 24.00 3 Brokers free marker 22 11.00 4 Government should keep control on
Brokers/Market 10 05.00 5 Government should communicate or
SMS for veg. rates/schemes/new tech 06 03.00 6 Proper roads/transport /no challans 06 3.00 7 Guaranteed vegetable seeds 07 3.50 8 Didn’t answer 34 17.00
As per the details shown in table 60, 33.50 per cent respondents replied that there should be proper rates and minimum support price should be declared for vegetable produce, 27.00 per cent respondent replied that there should be proper facilities in the market and storage and cold storage facilities should be there,17.00 per cent respondents didn’t answer the questions, 11.00 per cent respondents says that the market should free from Brokers, 5.00 per cent respondents said that government should keep control on Brokers and market 3.50 per cent respondents replied that vegetable seeds should be guaranteed.
0
5
10
15
20
25
30
3533.5
24
11
53 3 3.5
17
Pe
rce
nta
ge
Government actions required
Distribution of respondents according to Government actions
required

97
Chapter V
DISCUSSION
Present investigation entitled “Study on Labour and Marketing problems
of Vegetable Growers in Wardha District” was undertaken with a view to study
the extent of labour and marketing problems of vegetable growers.
The specific objectives of the study were
1. To study the socio-economic profile of vegetable growers.
2. To study the labour problems faced by vegetable growers.
3. To study the marketing problems faced by vegetable growers.
4. To elicit the suggestions from vegetable growers on labour and
marketing problems
The results of the study are discussed under the following headings.
5.1 Socio-economic profile of vegetable growers.
5.2 Information regarding vegetable production
5.3 The labour related aspects and labour problems of the vegetable
growers.
5.4 The marketing related aspects and marketing problems of the
vegetable growers.
5.5 The suggestions from vegetable growers on labour and marketing
problems
Socio-economic profile of vegetable growers.
Age
It was observed from the table-1, that majority (51.50 per cent) of the
respondents were from middle age group (33 to 54 years) followed by 27.50
per cent from old age (55 and above years) and 21.00 per cent from young age
group (up to 32 years)
The results are in conformity with the findings of Karpagam (2000) and
Sunilkumar (2004).

98
Education
With regards, educational qualifications it was revealed from table-2,
that 42.00 per cent of the respondents were educated up to secondary level,
25.00 per cent respondents were educated up to junior level (10+2 level), 16.50
per cent respondents were educated up to higher education level, 12.00
respondents were educated up to primary education level and 4.50 per cent of
respondents were found illiterate.
These findings are in line with the studies of Moulasab (2004) and Santosh
kumar (2008)
Family Size
Table no. 3, indicates that most of the respondents (73.00 per cent) were
having 4 to 6 family members where as 15.50 per cent of respondents having 7
and above family members, similarly 11.50 per cent of respondents having
small family i.e. up to 3 family members.
The present findings are in accordance with the results of Morale (2010)
Occupation
Table-4, indicates that most of the respondents (73.50 per cent) were
having agriculture as their main occupation where as 20.50 per cent of the
respondents were engaged in the agriculture as well as other subsidiary
occupation.
These results are in conformity with the findings of Karpagam (2000), and
Santosh kumar (2008)
Land holding
It is observed from the table 4.1 that, 51.00 per cent respondents had
medium size land holding (2.01 Ha to 6 Ha), 43.50 per cent respondents had
big size land holding (6.01 Ha) and 5.50 per cent respondents had small size
land holding (below 2 Ha).
This trend is in line with the findings of Shashidhar (2003) and Santoshkumar
(2008)

99
Subsidiary occupation
It was revealed from the table 4.2, that substantial number (43.90 per
cent) of the respondents are engaged in Dairy farming or Goat farming
business, 24.37 per cent of respondents were engaged in house hold grocery
shop, 17.07 per cent respondents are engaged in various other business such as
household flour mill, vegetable shop, wielding workshop, tent suppliers etc,
where as 4.87 per cent respondents were engaged in labour and 2.43 per cent of
respondents were having agriculture inputs shop.
The results are in line with the findings of Biradar, (1997), Santoshkumar
(2008).
Area under Irrigation
It was observed from the table 4.3 that 46.00 per cent of the respondents
having 1.01 Ha. to 2 Ha. of land under irrigation, 24.00 per cent of respondents
holding 3.01 Ha. and above land under irrigation, where 15.00 per cent
respondents having only up to 1 Ha. land under irrigation and 15.00 per cent
respondents don’t have irrigation.
This trend is in line with the findings of Shashidhar (2003).
Information of Crops grown
Table -5 indicates that 98.50 per cent of respondents grow gram, cotton,
75.00 per cent of respondents grow soybean, 68.50 per cent of respondents
grow wheat, 45.50 per cent of respondent grow wheat, 46.50 percent of
respondents grow gram (chick pea), 9.00 percent respondents grow other crops
(tur (arhar), sugarcane etc.), 4.50 percent respondents grow floriculture and
4.00 percent respondents grow fruit crops on their fields
These results are in accordance with the findings Morale (2010)
Information regarding vegetable production
Source of irrigation
From table – 6 it is clear that most of respondents (95.50 Per cent) have
well, 3.50 per cent of respondents have Bore well, 0.50 per cent of respondents
having canal and 0.50 per cent of other irrigation facility on their farms.
This trend is in line with the findings of Biradar, (1997), Morale (2010)

100
Professional Vegetable Production
Table- 7, It is highlighted that mostly all (99.50 per cent) of respondents
were professional vegetable and only 0.50 per cent respondents were not
professional vegetable growers. These results are in conformity with the
findings Vijayakumar (1999), Morale (2010)
Total Area under Vegetable Production
According to the details shown in table- 8, It is clear that 82.00 per cent
respondents had up to 1ha area under vegetable production, 16.50 per cent of
respondents had 1.01 Ha to 3 Ha area under vegetable production and 1.50 per
cent of respondents had 3.01 Ha and above area under vegetable production.
These results are in accordance with the findings Vijayakumar (1999), Morale
(2010)
Season of vegetable Production
According to table-9, 92.00 per cent of respondents grow vegetable in
Rabi season, 86.00 per cent of respondents grow vegetable in Kharif Season
and 76.50 per cent respondents grow vegetable in Summer Season. The results
are in line with the findings of Vijayakumar (1999), Morale (2010)
Types of vegetable production
According to the details shown n table-10, 99.50 per cent respondents
grown cowpea, 71.50 per cent respondents grow Brinjal, 55.50 percent
respondents grow other vegetables (chili, bitter gourd, cluster beans, Bottle
gourd, pumpkin, etc), 51.00 respondents grow ladies Fingers 48.50 percent
respondents grow spinach, 48.00 percent respondents grow tomato and 15.50
percent respondents grow cauliflower on their fields.
This trend is in line with the findings of Waman (2000) and Morale (2010)
Objectives of vegetable production
Table 11 indicates that mostly all respondents (100.00 per cent) produce
vegetables to get cash , 93.50 per cent respondents produce vegetables because
family get vegetables easily, 53.00 per cent respondents produce vegetables
because for other reasons and 1.50 per cent respondents produce vegetables
because the production is less expensive.

101
This trend is in line with the findings of Waman (2000) Morale (2010)
Source of information regarding vegetable seeds
According to table 12, 90.50 percent respondents get information from
Agriculture input shop, 7.50 respondents didn’t answer, 01.00 percent of
respondents get information from center for sustainable Agriculture, 0.50
percent respondents get information from big farmers and 0.50 percent
respondents get information regarding vegetable seeds from Agriculture
Assistant of Agriculture department.
This trend is in line with the findings of Bhople (1996) and Kumar (1998) ,
Angadi (1999) and Morale (2010)
Source of vegetable Seed purchase
It is observed from table-13 that mostly all 9.50 percent respondents
purchase vegetable Seeds from Agriculture input Shop and only 0.50 percent
respondents purchase vegetable Seeding from Agriculture nursery.
These results are in conformity with the findings of Biradar, (1997),
Santoshkumar (2008) and Morale (2010).
Guaranty of Production from Seeds
It is clear from the Table-14 that 59.50 percent of respondents say that
here in Guarantee of seed for production and 40.50 percent of respondents says
that there in no guarantee of seed for production. The present findings are in
accordance with the results of Biradar, (1997), Morale (2010)
Vegetable farming Groups
Table-15, shows clearly that 83.50 percent respondents grows
vegetables without any groups and 16.50 percent respondents do vegetable
farming with groups
These results are in accordance with the findings Biradar, (1997), Morale
(2010)
Input from farming Groups
Table-16 indicates that 69.69 percent of respondents take input from
Groups and 30.30 percent respondents don’t take inputs from groups formed
for vegetable production.

102
These results are in conformity with the findings Biradar, (1997), Morale
(2010)
The Labour related aspects and labour problems of the vegetable growers.
Total Labours required for production of vegetable on 1 Arc of Land.
According table-17, 71.50 percent of respondent require up to 05
Labours for production of vegetable on 1 Arc of land, 27.50 percent of
respondent requires 6 to 15 Labours and 1.00 percent of respondent require
more than 15 labours for production off vegetables on 1 Arc of land. These
results are in conformity with the findings Waman (2000) and Chandrashekhar
(2007)
Availability of Labours
According table- 17.a it is seen that 83.00 per cent respondents said labours are
available and 17.00 00 per cent respondents said labours are not available
The results are in line with the findings of Waman (2000) and Chandrashekhar
(2007)
Requirement of skilled labours for vegetable production.
Table-18 indicates that 89.50 per cent of respondent did not requires
skilled labours for vegetable production and 10.50 per cent respondents
required skilled labours for vegetable production. The present findings are in
accordance with the results of Chandrashekhar (2007)
Availability Skilled of labour
It is observed from table-19 that 88.50 per cent of respondent says
skilled labours are available and 11.50 per cent of respondent says Skilled not
are available for vegetable production. The results are in line with the findings
of Chandrashekhar (2007)
Time Hours labours need
According to the table-20 78.50 percent respondent required labour in
morning hours, 60.00 percent of respondents required labours in afternoon
hours and 17.00 percent respondents required full day labours for vegetable
production.
103
These results are in accordance with the findings Waman (2000) and
Chandrashekhar (2007)
Requirement of Skilled labours for vegetable Pickings
As per the details shown in the table-22, 88.50 per cent respondents
didn’t required Skilled labours for vegetable pickings and 11.50 per cent
respondents requires skilled labours for vegetable pickings in vegetable
production.
These results are in conformity with the findings Chandrashekhar (2007)
Period of vegetable production
According to the table-23, 65.50 per cent respondents produce
vegetables having a period of 3 months, 25.50 per cent respondents produce
vegetable having a period of more than 5 months and 8.00 per cent respondents
produce vegetables having a period from 3.01 to 5 months.
This trend is in line with the findings of Morale (2010)
Mode of wage payments
It is clearly observed from table-24, that all 100.00 per cent respondents
pay money as mode of wages payment and zero per cent (00.00) respondents
use barter system as mode of wages payment. The present findings are in
accordance with the results of Chandrashekhar (2007)
Types of wage fixation
According to the table-25, 98.00 per cent respondents fixes the wages as
per daily –basis, 5.50 per cent respondents fixes wages as per hourly basis and
no respondents fix wage on monthly basis
The results are in line with the findings of Chandrashekhar (2007) and
Santoshkumar (2008)
Problems regarding labour
Table-26, Indicates that 72.00 per cent respondents didn’t face any
problem regarding labors, 11.00 per cent of respondents says that labours are
not easily available, 9.50 per cent of respondents feels that labour wages are
high and 7.50 per cent respondents have to brought labours from other villages.

104
These results are in accordance with the findings Chandrashekhar (2007) and
Santoshkumar (2008)
Solution Suggested on Labour Problems
It revealed from table-27, that majority number (95.50 per cent) of the
respondents not suggested any solutions, 2.00 per cent respondents suggested
that labours wages should be fixed, 1.00 per cent respondents suggested that
high tech farming should be used, 1.00 per cent respondents says that
sometimes labours have to brought from other villages and 0.50 per cent
respondents suggested that they should get proper rates to vegetable produce.
These results are in conformity with the findings Chandrashekhar (2007) and
Santoshkumar (2008)
The marketing related aspects and marketing problems of the vegetable
growers.
Level of vegetable Market
As per the table-28, 62.00 per cent respondents sold their vegetable
produce at District level market, 30.00 per cent respondents sold their
vegetable produce at Taluka (Block) Level market, 15.00 per cent respondents
sold their vegetable produce at village level market and 3.50 per cent of
respondents sold their vegetable produce in other markets.
This trend is in line with the findings of Santoshkumar (2008) and Morale
(2010).
Market Type
According to the table-29, It is observed that 95.50 per cent respondents
sold their vegetable produce at wholesale vegetable market and 13.00 per cent
respondents sold their vegetable produce at retail market.
The results are in line with the findings of Morale (2010) and Santoshkumar
(2008)
System of Selling Vegetable Produce
As per the table 30, 94.00 per cent of respondents sell their vegetable
produce through commission agents (Brokers) and a meager percentage (06.00

105
per cent) of respondents sell their vegetable produce without taking help of
commission agent (Brokers).
These results are in accordance with the findings Lakshmi (2000),
Chandrashekhar (2007) and Santosh kumar (2008)
If sold by own then what are the rates
It is observed from the table-31, that 93.00 per cent respondents get
market rates if sell their vegetable produce by own and 7.00 per cent
respondents get lowered rates when sell their vegetable produce by own
(without taking help of commission Agent)
These results are in conformity with the findings Lakshmi 2000), Santosh
kumar (2008) and Morale (2010)
Percentage of Commission Agent (Broker)
From table-32, it reveals that 71.00 per cent respondents have to give 9
to 12 percent of commission to the agent (Broker) on their sold produce and
29.00 percent of respondent have to give 2 to 8 percent of commission to agent
(Broker) on their sold vegetable produce.
The present findings are in accordance with the results of Chandran (1997),
Chandrashekhar (2007) and Santosh kumar (2008)
Brokers Commission Affordable
According to the table 33, 75.00 percentage of respondents not afford
Brokers Commission while selling vegetable produce and 25.00 percentage
respondent affort Brokers Commission while selling vegetable produce.
The results are in line with the findings of Lakshmi (2000),Chandrashekhar
(2007)
Types of charges by Broker
As per the details shown in table-34, 51.50 per cent respondent were
charged commission and hamali by the broker while selling vegetable produce
in the whole sale market 12.00 per cent respondents had not replied or not
known about the types of charges. 10.50 per cent of respondent were charged
commission, Hamali and weighing charge by the Broker, 8.50 percent
respondent says only commission was charged by the broker. 8.00 per cent

106
respondents replied as they were charged Hamali and market fee, 5.00 per cent
respondents were charged only Hamali by the broker. 3.50 per cent of
respondent were charged commission and weighing charges and 1.00 percent
of respondents were charged Hamali and weighing charge by the broker at the
time of selling vegetable produce.
These results are in accordance with the findings Meeta Krishna (2000),
Chandrashekhar (2007) and Santosh kumar (2008)
Rates when vegetable produce sold through Brokers
From table 35, It is observed that 64.50 per cent respondent get proper
rates for their vegetable produce when sold through Brokers in the market.
25.00 per cent of respondent didn’t get proper rates and 10.50 per cent
respondent sometimes gets proper rates when their vegetable produce sold
through Brokers in the market.
These results are in conformity with the findings Meeta Krishna (2000),
Chandrashekhar (2007) and Santosh kumar (2008)
Time for getting cash after selling produce
As per the table-36, most of the respondents (97.00 percent) get the cash
immediately after selling the vegetable produce and 3.00 percent of respondent
get cash late of vegetable produce
This trend is in line with the findings of Chandrashekhar (2007) and
Santoshkumar (2008)
Broker free market concept
It is observed from the table 37, that 64.00 percent of respondents need
the market should be free from broker, 26.00 percent of respondents can’t say
about broker free market concept, 5.00 percent of respondents need broker in
the vegetable markets, 4.50 percent of respondents didn’t answer. The present
findings are in accordance with the results of Lakshmi (2000), Chandrashekhar
(2007)
Problems regarding brokers
As per the details shown in the Table-38, 24.00 per cent respondents feel
that commission should be reduce, 23.00 per cent respondents had no problem

107
with brokers, 20.00 per cent respondents didn’t answer, 15.50 per cent
respondents wanted a broker free market, 10.00 per cent respondents answered
that brokers do malpractice, partialities and keep their own interest and 7.50 per
cent respondents thought vegetables should get proper rates.
The results are in line with the findings of Meeta Krishna (2000)
Chandrashekhar (2007) and Santosh kumar (2008)
Selling of produce in group (Group selling)
According to the table 39, most respondents (95.50 per cent) market
their vegetable personally and a meager 4.50 per cent respondents market there
produces in groups.
These results are in accordance with the findings Lakshmi (2000),Morale
(2010)
Grading of vegetables
Table 40 highlighted that majority (90.00 per cent) respondents grade
there vegetables produce before marketing, and 10.00 per cent respondents
don’t grade their vegetable produce before marketing. These results are in
conformity with the findings Morale (2010)
Facilities available at wholesale markets
As per table 41, 75.00 per cent respondents said no facilities are
available at wholesale market, 25.00 per cent respondents didn’t answer and
5.00 per cent of respondents said all facilities are available in the wholesale
vegetable market.
This trend is in line with the findings of Meeta Krishna (2000), Santosh kumar
(2008) and Morale (2010).
Satisfaction about facilities available at wholesale market
According to the table 42, 81.50 per cent respondents say they are not
satisfied by the facilities available at wholesale market while 18.50 percent
respondent say that they are satisfied by the facilities available at the wholesale
vegetable market.
The present findings are in accordance with the results of Meeta Krishna
(2000), Santosh kumar (2008) and Morale (2010)

108
Reasons of dissatisfaction for facilities available at wholesale market
In table 43, majority (96.5 percent) respondents say that the facilities
aren’t proper, 3.00 percent respondent couldn’t answer the question while 0.50
percent respondents say the wholesale market premise aren’t clean.
The results are in line with the findings of Meeta Krishna (2000), Santosh
kumar (2008) and Morale (2010)
Supply of vegetables in wholesale market increases then the rates gets
decrease
Table-44, Shows that 9.00 per cent respondents says that if supply of
vegetable produce in the wholesale market the rate get decreased and 2.00 per
cent respondents says that if supply increases the rate of vegetables not
decreases.
These results are in accordance with the findings Meeta Krishna (2000)
Chandrashekhar (2007) and Santosh kumar (2008)
Availability of cold storage if vegetable rates are low
It is clear from the table-45, that respondents (88.50 per cent) say that
cold storage facility is not available in the whole sale market if rates of
vegetable are low in the market where as 11.50 per cent respondents says cold
storage facilities are available in the market.
These results are in conformity with the findings Subramanyam (1999),
Chandrashekhar (2007) and Santosh kumar (2008)
Vegetable is perishable so have to sell as early as possible
It is revealed from the table-46, that 98.50 per cent respondent say
vegetable in a perishable commodity and hence have to sell in the market as
early as possible,01.50 per cent of respondents say no.
This trend is in line with the findings of Waman (2000), Meeta Krishna (2000),
Chandrashekhar (2007) and Santosh kumar (2008)
As vegetable in Perishable do it gets proper rates
As per the table-47, 89.50 per cent respondent says that they didn’t get
proper rates as vegetable in a perishable commodity and have to sell as early as
possible and 10.50 per cent respondents say that they get proper rates.
109
The present findings are in accordance with the results of Meeta Krishna
(2000), Santosh kumar (2008) and Morale (2010).
Knowledge regarding cold storage
It is observed from the table 48, that 73.50 per cent respondents don’t
know about cold storage and 26.50 per cent respondents know about cold
storage for vegetable produce.
The results are in line with the findings of Subramanyam (1999),
Chandrashekhar (2007) and Santosh kumar (2008)
Use of cold storage, if provided
As per table 49, 86.50 per cent of respondents says that they will use the
cold storage facility for vegetables if provided in the wholesale market. And
13.50 per cent respondents say that they will not use cold storage facility if
provided.
These results are in accordance with the findings Subramanyam (1999), Morale
(2010) and Santosh kumar (2008)
Problems regarding storage facilities
As per the details shown in table-50, 76.50 per cent of respondents said
that there are no storage facilities in the wholesale vegetable market, 76.50 per
cent respondents said that vegetable are perishable commodity so cold storage
facility should be provided in the whole sale market.
These results are in conformity with the findings Subramanyam (1999), Morale
(2010) and Santosh kumar (2008)
Means of vegetable transport
According to the table 51, 39.00 per cent respondents use bike to
transport vegetables from farm to wholesale market, 37.50 per cent respondents
use five wheeler Auto for transport of vegetables, 18.50 per cent respondents
use other transport facilities such as Truck, Matador, Minidoor, three wheeler,
passenger Auto, Bus etc, 3.00 per cent respondents use bullock cart for
transport of vegetables and 02.00 per cent of respondents use bicycle for
transport of vegetable from farm to wholesale market.

110
This trend is in line with the findings of Subramanyam (1999),Chandrashekhar
(2007) and Santosh kumar (2008)
Transport facility
Table 52, shows that 56.50 per cent respondents don’t have their own
personal transport facility to transport vegetables from farm to wholesale
market and 43.50 per cent respondents have their own personal transport
facility to transport vegetable from farm to wholesale market.
The present findings are in accordance with the results of Subramanyam
(1999), Morale (2010) and Santosh kumar (2008)
Timely Availability of transport facility
According to the table 53 it is observed that 84.50 per cent respondents
get the transport facility timely as and when required and 15.50 percent
respondents didn’t get the transport facilities timely to transport vegetables
from farm to wholesale market.
The results are in line with the findings of Subramanyam (1999), Santosh
kumar (2008) and Morale (2010)
Losses Due to Non Availability Transport facility timely
Table 54, shows clearly that 73.50 per cent respondents don’t have
losses due to non availability of transport facilities and 26.50 per cent
respondents have to bear losses due to non availability of transport facilities to
transport vegetable produce from farm to wholesale market.
These results are in accordance with the findings Subramanyam (1999),
Santosh kumar (2008) and Morale (2010)
Problems regarding Transport facilities
As per the details shown in table 55, 89.50 per cent respondents had no
problems regarding transport facilities, 7.00 per cent transport didn’t get
transport facilities timely, 1.50 per cent respondents says transport of vegetable
produce is expensive, 1.00 per cent respondents says roads are not proper, 0.50
per cent of respondents says there are no transport facilities in villages and 0.50
per cent respondents says traffic police give challans for vegetable transport.

111
These results are in conformity with the findings Subramanyam (1999),
Chandrashekhar (2007) and Santosh kumar (2008)
Suggestion for transport facilities
As shown in table 56, 94.00 per cent respondents didn’t suggest
regarding transport facilities, 4.00 per cent respondents says that special facility
should be made available for vegetable transport and 2.00 per cent respondents
says that transportation rates should be reduced.
This trend is in line with the findings of Subramanyam (1999), Morale (2010)
and Santosh kumar (2008)
Vegetables purchase by APMC
As per the table 57, 73.50 percent of respondents says that APMC not
purchase vegetable produce and 26.50 percent of respondents says APMC
purchase vegetable produce.
The present findings are in accordance with the results of Santosh kumar
(2008) and Morale (2010)
Vegetable should have minimum support price
Table 58 shows that mostly all (97.00 per cent) respondent says that
there should be minimum support price for vegetable produce and only 03.00
per cent respondent say no for minimum support price for vegetable produce.
The results are in line with the findings of Chandrashekhar (2007) and Santosh
kumar (2008)
Wholesale market is controlled by Brokers
According to the table-59, 53.50 per cent respondent says market is not
controlled by Brokers, 44.00 per cent respondents replied that vegetable
wholesale market in controlled by Brokers and 2.50 per cent respondents can’t
answer the questions.
These results are in accordance with the findings Vijayakumar (1999),
Chandrashekhar (2007)
Government actions required
As per the details shown in table 60, 33.50 per cent respondents replied
that there should be proper rates and minimum support price should be declared

112
for vegetable produce, 27.00 per cent respondent replied that there should be
proper facilities in the market and storage and cold storage facilities should be
there,17.00 per cent respondents didn’t answer the questions, 11.00 per cent
respondents says that the market should free from Brokers, 5.00 per cent
respondents said that government should keep control on Brokers and market
3.50 per cent respondents replied that vegetable seeds should be guaranteed.
These results are in conformity with the findings Vijayakumar (1999),
Chandrashekhar (2007)

113
CHAPTER VI
CONCLUSION
Present investigation entitled “Study on Labour and Marketing problems
of Vegetable Growers of vegetable growers.
The specific objectives of the study were
1. To study the socio-economic profile of vegetable growers.
2. To study the labour in Wardha District” was undertaken with a view to
study the extent of labour and marketing problems faced by vegetable
growers.
3. To study the marketing problems faced by vegetable growers.
4. To elicit the suggestions from vegetable growers on labour and
marketing problems
The conclusion of the study have been presented as following
� All vegetable growers produce vegetables to get cash.
� Majority of respondents get information from Agriculture input shop.
� More than half of the respondents say that there is no Guarantee of seed for
production.
� Majority of respondents grows vegetables without any groups.
� Majority of respondents said labours are available, didn’t face any problem
regarding labours, fixes the wages as per daily –basis, did not requires
skilled labours for vegetable production, sold their vegetable produce at
District level market. All the respondents pay money as mode of wages
payment.
� Majority of respondents sold their vegetable produce at wholesale vegetable
market
� Majority of respondents sell their vegetable produce through commission
agents (Brokers), have to give 9 to 12 percent of commission to the agent
(Broker) on their sold produce, didn’t afford Brokers Commission while
selling vegetable produce, get proper rates for their vegetable produce when

114
sold through Brokers in the market, get the cash immediately after selling
the vegetable produce.
� More than half of respondents need the market should be free from broker,
24.00 per cent respondents feel that commission should be reduced, 10.00
per cent respondents answered that brokers do malpractice, partialities and
keep their own interest.
� Majority of respondents grade there vegetables produce before marketing.
� Majority of respondents said no facilities are available at wholesale market,
not satisfied by the facilities available at wholesale market, if supply of
vegetable produce increases in the wholesale market the rate gets decreased.
� Majority of the respondents say that cold storage facility is not available in
the whole sale market, vegetable is a perishable commodity and hence have
to sell in the market as early as possible, they will use the cold storage
facility for vegetables if provided in the wholesale market, vegetables are
perishable commodity so cold storage facility should be available at
wholesale market.
� Majority of respondents said that there are no storage facilities in the
wholesale vegetable market
� More than half of the respondents don’t have their own personal transport
facility to transport vegetables from farm to wholesale market, 39.00 per
cent respondents use bike to transport vegetables from farm to wholesale
market, 37.50 per cent respondents use five wheeler Auto for transport of
vegetables.
� Majority of respondents get the transport facility timely as and when
required, don’t have losses due to non availability of transport facilities.
� Majority of respondent says that there should be Minimum Support Price
for vegetable produce.

115
REFERENCES
Agarwal, N. L. and Saini, T. C. (1995). Vegetable marketing – A study of Jaipur market (Rajasthan). Indian J. Agril. Mktg., 9(1) : 36-43.
Agarwal, N. L. and Sharma, J. L. (1994). Promoting agribusiness : Soybean marketing problems in Rajasthan. The Bihar J. Agril. Mktg., 11(1) : 43-53.
Angadi, S. C. (1999). A study on knowledge, adoption and marketing pattern of pomegranate growers in Bagalkot district in Karnataka state. M. Sc. (Agri.) Thesis, Univ. Agric. Sci., Dharwad (India).
Anil Kumar and Arora, V. P. S. (1999). Post-harvest management of vegetables in UP Hills. Ind. J. Agril. Mktg., 13(2) : 6-14.
Anitha, B. (2004). A study on entrepreneurial behaviour and market participation of farm women in Bangalore rural district of Karnataka. M. Sc. (Agri.) Thesis, Univ. Agric. Sci., Bangalore (India).
Arya, Prem Singh (2002). Text book of vegetable culture. New Delhi : kalyani Publishers.
Atibudhi, H. N. (1998). Role of market committee in regulating malpractices and increasing producer’s share in consumers rupee : A comparative study in Sakhigopal and Satsanka markets, Orissa. Indian J. Agril. Mktg., 12(3) : 87-90.
Bhople, R. S., Shinde, P. S. and Nimje, V. R. (1996). Production and marketing constraints faced by orange growers. Maharashtra Soc. Extn. Edun., 15 : 57-67.
Biradar, N. B. (1997). Effectiveness of teaching methods in communicating nutritional knowledge to rural women – An experimental study. Ph. D. Thesis, Univ. Agric. Sci., Dharwad (India).
Chandrashekhar, S. K. (2007). Analysis of Onion production and marketing behavior of farmers in Gadag district, Karnataka,M.Sc(Agri.) Thesis, University Agricultural Sciences, Dharwad.
Chandregowda, K. N. (1997). A study on extent of adoption of improved cultivation practices of chrysanthemum. M. Sc. (Agri.) Thesis, Univ. Agric. Sci., Bangalore (India).
Das, P. C. (2003). Vegetable crops of India. New Delhi : kalyani Publishers. Halakatti, A. B. (1999). Technical change, yield gap and constraints in rainfed
chilli production in Karnataka an economic analysis. M. Sc. (Agri.) Thesis, Univ. Agric. Sci., Dharwad (India).
Jhamtani, A., Sharma, J. P., Singh, R., Singh, D. K. and Chibber, V. (2003). Entrepreneurial orientation of educated unemployed rural youth. Indian J. Extn. Edun., 39(3-4) : 124-132.

116
Karpagam, C. (2000). A study on knowledge and adoption behaviour of turmeric growers in Erode district of Tamil Nadu. M. Sc. (Agri.) Thesis, Univ. Agric. Sci., Dharwad (India).
Kulkarni, N. M. (2003). A study of beneficiary women of self help groups organized by Jhana Prabadhini with special reference to their socio-economic development. M.Sc. (Agri.) Thesis, MPKV, Rahuri (India).
Kumar, H. S. (1998). A study on knowledge, adoption and economic performance of banana growers. M. Sc. (Agri.) Thesis, Univ. Agric. Sci., Bangalore (India).
Lakshmi, K., Ravikumar, K. N. and Raju, V. T. (2000). Problem of regulated agricultural marketing in Andhra Pradesh. Int. Convention in Agril. Mktg. Management –Challenges in Millennium, held during August 24-25, 2000, MANAGE, Hyderabad (India), p. 27.
Meenakshi, A. (1983). An evaluation of agricultural market information system and its impact on the farm economy of Shimoga district of Karnataka state. M. Sc. (Agri.) Thesis, Univ. Agric. Sci., Bangalore (India).
Meeta, Krishna (2000). Role of vegetable marketing federation (VEGFED) in marketing of vegetables in Bihar. Enclyclopaedia of Agril. Mktg., 4 : 123-135.
Memoriya, C. B. & Tripathi, B. B. (2003). Agricultural Problems in India. New Delhi : Kitab Mahal.
Mohapatra, S. C. (1999). Production and marketing of onion in Bolangiri district of Orissa. Indian J. Agril. Mktg., 13(1) : 40-43.
Morale, M. B. (2010). Production and marketing of tomato in Kolhapur district, Ph. D. Thesis, Shivaji University Kolhapur.
Moulasab, I. (2004). A study on knowledge and adoption of improved cultivation practices by mango growers of North Karnataka. M. Sc. (Agri.) Thesis, Univ. Agric. Sci., Dharwad (India).
Murthy, D. S. and Subrahamanyam, K. V. (1999). Growth and instability in export of onion from India. Indian J. Agril. Mktg., 13(3) : 21-27.
Nagoormeeran, N. and Jayaseelan, M. J. (1999). Socio-personal, socio-economic and socio psychological profile of shrimp farmers. J. Extn. Edun., 10(2) : 2445-2448.
Narappanavar, S. R. and Bavur, S. B. (1998). The marketing problems of potato : A study in Dharwad district of Karnataka. The Bihar J. Agril. Mktg., 6(2) : 155-159.
Nawadkar, D. S., Mahandale D.K., Sale D.L. and Dangat S.B. (1991). “Marketing of Vegetables in Western Maharashtra” Indian Journal of Agricultural Marketing, Vol.–5, No. 2, P. No. 182.
117
Palaniswamy, K. and Sriram, M. S. (2000). A scale to measure extension participation of farmers. Indian J. Extn. Edun., 19 : 325-328.
Patange, D. D., Wangkar, S. D., Kulkarni, A. N. and Kalyankar (2001). Effect of socioeconomic variables on milk production of Marathwad Buffalo Maharashtra. J.Extn. Edun., 20 : 92-96.
Ravishankar, R. L. (1995). Study on adoption and constraint analysis of potato farmers in Chikkaballapur. M. Sc. (Agri.) Thesis, Univ. Agric. Sci., Bangalore, India. Information by VLWS and factors associated with inter-communication behaviour. Ph. D. Thesis, Indian Agricultural Research Institute, New Delhi (India).
Rotti, N. B. (1983). Study on knowledge and adoption behaviour of sugarcane growers of Belgaum district of Karnataka state. M. Sc. (Agri.) Thesis, Univ. Agric. Sci., Dharwad (India).
Santosh kumar, S. P. (2008). Marketing behaviour, information source consultancypattern and problems of vegetable growers in Bijapur district of Karnataka M.Sc(Agri.) Thesis, University Agricultural Sciences, Dharwad.
Saravana Kumar, R. (1996). A study on management of mango gardens by farmers in Krishnagiri taluk of Dharmapuri district, Tamil Nadu. M. Sc. (Agri.) Thesis, Univ. Agric. Sci., Dharwad (India).
Shah, D. (1999). An economic evaluation of onion production and its marketing in Maharashtra. Indian J. Agril. Mktg., 13(3) : 11-20.
Sharma, R. K., Sharma, S. K. and Thakur, R. K. (1995). Marketing of vegetables in Himachal Pradesh. Ind. J. Agril. Mktg., 9(1) : 45-49.
Shashidhar, D. N. (2004). A study on influencing factors and constraints in drip irrigation by horticulture farmers of Bijapur district of Karnataka. M. Sc. (Agri.) Thesis, Univ. Agric. Sci., Dharwad (India).
Shashidhar, K. K. (2003). A study on socio-economic profile of drip irrigation farmers in Shimoga and Davanagere district of Karnataka. M. Sc. (Agri.) Thesis, Univ. Agri. Sci., Dharwad.
Shashikumar, H. J. (1987). Economics of production and marketing of rainfed potato in Hassan taluk of Karnataka. M. Sc. (Agri.) Thesis, Univ. Agric. Sci., Bangalore (India).
Shivamurthy, G. R. (1991). A study on the knowledge and adoption behaviour of arecanut and cardamom growers in Shimoga district of Karnataka state. M. Sc. (Agri.) Thesis, Univ. Agric. Sci., Dharwad (India).
Shivastava, R. C. (2006). Agricultural markets and transport network. New Delhi : Rawat Publications.
Shrivastava, K. K., Patel, H. L. and Bureth, L. S. (1998). Constraints in adoption of recommended chilli production technology. Maharashtra J. Extn. Edun., 17 : 390-393. Subramanyam, K. V., 1999, Risk reducing

118
and efficient marketing strategies for perishables, fruits and vegetables. Ind. J. Agril. Mktg., 13(2) : 22-23.
Sunil Kumar, G. M. (2004). A study on farmers knowledge and adoption of production and post-harvest technology in tomato crops of Belgaum district in Karnataka. M. Sc. (Agri.) Thesis, Univ. Agric. Sci., Dharwad (India).
Vijayakumar, A. C. (1999). A study on adoption pattern and certain aspects of marketing of potato by farmers of Malur taluk, Kolar district. M. Sc. (Agri.) Thesis, Univ. Agric. Sci., Bangalore (India).
Vijayakumar, A. C. and Narayana Gowda, K. (1999). Adoption of improved cultivation practices among rose growers. J. Extn. Edun., 10 : 2331-2334.
Waman, G. K. and Patil, P. S. (2000). Production, storage and marketing constraints faced by onion growers. Maharashtra J. Extn. Edun., 19 : 104-108.

119
¾Ö¬ÖÖÔ ×•Ö»ÊÖŸÖᯙ ³ÖÖ•Ö߯ÖÖ»ÖÖ ˆŸ¯ÖÖ¤ü�úÖÓ“µÖÖ ÁÖ´Öß�ú †Ö×�Ö ×¾Ö¯Ö�Ö−ÖÖÃÖÓ²ÖÓ¬Öß“µÖÖ ÃÖ´ÖõÖÖÓ“ÖÖ
†³µÖÖÃÖ
STUDY ON LABOUR AND MARKETING PROBLEMS OF VEGETABLE
GROWERS IN WARDHA DISTRICT
†) ¾µÖÛŒŸÖ÷ÖŸÖ ´ÖÖ×ÆüŸÖß
1. ³ÖÖ•Ö߯ÖÖ»ÖÖ ˆŸ¯ÖÖ¤ü�úÖ“Öê −ÖÖ¾Ö ------------------------------------------------------------
¾ÖµÖ ----------- ׿Ö�Ö�Ö ------------- ÷ÖÖ¾ÖÖ“Öê −ÖÖ¾Ö ---------- ŸÖÖ»Öã�úÖ --------------
�ãú™ãÓü²ÖÖŸÖᯙ ÃÖ¤üÃµÖ ÃÖÓ�µÖÖ : --------------
´Öã�µÖ ¾µÖ¾ÖÃÖÖµÖ : --------------
¤ãüµµÖ´Ö ¾µÖ¾ÖÃÖÖµÖ : --------------
¬ÖÖ¸ü�Ö ¿ÖêŸÖ•Ö×´Ö−Öß“Öê �Öê¡Ö±úôû : --------------
†Öê×»ÖŸÖÖ�ÖÖ»Öᯙ •Ö×´Ö−Öß“Öê �Öê¡Ö±úôû : --------------
�úÖê¸ü›ü¾ÖÖÆæü •Ö×´Ö−Öß“Öê �Öê¡Ö±úôû : --------------
2. ¾µÖÖ¾ÖÃÖÖ×µÖ�ú ¥üÛ™ü�úÖê−ÖÖŸÖæ−Ö �úÖê�Ö�úÖê�ÖŸÖß ×¯Ö�êú ‘Öê�µÖÖŸÖ µÖêŸÖê?
�úÖ¯ÖæÃÖ ÃÖÖêµÖÖ²Öß−Ö ÷ÖÆæü “Ö−ÖÖ
³ÖÖ•Ö߯ÖÖ»ÖÖ ±úôêû ±ãú»Öê
3. †Öê×»ÖŸÖÖ�ú׸üŸÖÖ �úÖê�ÖŸÖß ÃÖÖ¬Ö−Öê ˆ¯Ö»Ö²¬Ö †ÖÆêüŸÖ?
×¾Ö×Æü¸ü −ÖÆü¸ü ²ÖÖê¸ü¾Öê»Ö ‡ŸÖ¸ü
²Ö) ³ÖÖ•Ö߯ÖÖ»ÖÖ ˆŸ¯ÖÖ¤ü−ÖÖÃÖÓ²ÖÓ¬Öß ´ÖÖ×ÆüŸÖß
1. ¾µÖÖ¾ÖÃÖÖ×µÖ�ú ³ÖÖ•Ö߯ÖÖ»ÖÖ ×¯Ö�úÖ“Öê ˆŸ¯ÖÖ¤ü−Ö ‘ÖêŸÖÖ �úÖµÖ? ÆüÖêµÖ / −ÖÖÆüß --------------
2. ‹�æú�Ö •Ö×´Ö−Öß“µÖÖ ×�úŸÖß �Öê¡Ö±úôûÖŸÖ ³ÖÖ•Ö߯ÖÖ»ÖÖ ‘ÖêŸÖ»ÖÖ •ÖÖŸÖÖê?
†) þ֟Ö:“µÖÖ •Ö×´Ö−ÖßŸÖ --------------
²Ö) ´ÖŒŸµÖÖ−Öê �êú»Ö껵ÖÖ •Ö×´Ö−ÖßŸÖ --------------
3. ³ÖÖ•Ö߯ÖÖ»µÖÖ“Öê ˆŸ¯ÖÖ¤ü−Ö �úÖê�Ö�úÖê�ÖŸµÖÖ ÆÓü÷ÖÖ´ÖÖŸÖ ‘ÖêŸÖ»Öß •ÖÖŸÖÖŸÖ?
†) ¯ÖÖ¾ÖÃÖÖôûß -------------- ²Ö) ×Æü¾ÖÖôûß -------------- �ú) ˆ−ÆüÖôûß --------------
4. �úÖê�Ö�úÖê�ÖŸµÖÖ ¯ÖÏ�úÖ¸ü“µÖÖ ³ÖÖ•Ö߯ÖÖ»µÖÖ“Öê ˆŸ¯ÖÖ¤ü−Ö ‘ÖêŸÖ»µÖÖ •ÖÖŸÖê?
¾ÖÖÓ÷Öê / ™ü´ÖÖ™êü / ¯ÖÖ»Ö�ú / �úÖê²Öß / “Ö¾Öôûß / ³Öë›üß / ‡ŸÖ¸ü

120
5. ³ÖÖ•Ö߯ÖÖ»ÖÖ ˆŸ¯ÖÖ¤ü−Ö ‘Öê�µÖÖ´ÖÖ÷Öᯙ ˆ§êü¿Ö �úÖê�ÖŸÖê?
−Ö÷Ö¤üß ¯ÖîÃÖÖ ×´ÖôûŸÖÖê --------------
�ú´Öß �Ö“ÖÔ »ÖÖ÷ÖŸÖÖê --------------
�ãú™ãÓü²ÖÖ�ú׸üŸÖÖ ÃÖÆü•Ö ³ÖÖ•Ö߯ÖÖ»ÖÖ ˆ¯Ö»Ö²¬Ö ÆüÖêŸÖÖê --------------
‡ŸÖ¸ü --------------
6. ³ÖÖ•Ö߯ÖÖ»µÖÖ“µÖÖ ×²ÖµÖÖ�µÖÖ²ÖÖ²ÖŸÖ †Ö¯Ö�ÖÖÃÖ ´ÖÖ×ÆüŸÖß �ãúšêü ×´ÖôûŸÖê? --------------
7. ײֵÖÖ�Öê �ãúšæü−Ö �Ö¸êü¤üß �ú¸üŸÖÖ? --------------
8. ײֵÖÖ�µÖÖ²ÖÖ²ÖŸÖ ˆŸ¯ÖÖ¤ü−ÖÖ“Öß Æü´Öß †ÃÖŸÖê �úÖµÖ? ÆüÖêµÖ / −ÖÖÆüß --------------
9. ³ÖÖ•Ö߯ÖÖ»ÖÖ ˆŸ¯ÖÖ¤ü−ÖÖ�ú׸üŸÖÖ ¿ÖêŸÖ�ú·µÖÖÓ“Öê ÷Ö™ü †ÖÆêü �úÖµÖ? --------------
10. ³ÖÖ•Ö߯ÖÖ»µÖÖ“µÖÖ ˆŸ¯ÖÖ¤ü−ÖÖ�ú׸üŸÖÖ »ÖÖ÷Ö�ÖÖ·µÖÖ ×−Ö×¾ÖšüÖ †Ö¯Ö�Ö ÷Ö™üÖ´ÖÖ±ÔúŸÖ
‘ÖêŸÖÖ �úÖµÖ? --------------
�ú) ³ÖÖ•ÖßÖ¯ÖÖ»ÖÖ ˆŸ¯ÖÖ¤ü−ÖÖÃÖÖšüß »ÖÖ÷Ö�ÖÖ·µÖÖ ´Ö•Öæ̧ ü ¾Ö÷ÖÖÔ²ÖÖ²ÖŸÖ ´ÖÖ×ÆüŸÖß
1. ³ÖÖ•Ö߯ÖÖ»ÖÖ ×¯Ö�úÖ“µÖÖ ‹�ú¸üß ˆŸ¯Ö¤ü−ÖÖÃÖÖšüß ×�úŸÖß ´Ö•Öæ¸ü ¾Ö÷ÖÔ »ÖÖ÷ÖŸÖÖê? --------------
2. ³ÖÖ•Ö߯ÖÖ»ÖÖ ˆŸ¯ÖÖ¤ü−ÖÖ�ú׸üŸÖÖ ¯ÖÏ׿Ö×�ÖŸÖ ´Ö•Öæ¸ü ¾Ö÷ÖÖÔ“Öß ÷Ö¸ü•Ö †ÖÆêü �úÖµÖ? ÆüÖêµÖ / −ÖÖÆüß
3. †ÃÖ»µÖÖÃÖ ¯ÖÏ׿Ö×�ÖŸÖ ´Ö•Öæ¸ü ¾Ö÷ÖÔ ˆ¯Ö»Ö²¬Ö ÆüÖêŸÖÖê �úÖµÖ? ÆüÖêµÖ / −ÖÖÆüß
4. ‹�ú ‹�ú¸ü ³ÖÖ•Ö߯ÖÖ»ÖÖ ×¯Ö�úÖ“Öê ¾µÖ¾ÖãÖÖ¯Ö−Ö (»ÖÖ¾Ö�Öß ŸÖê �úÖœü�Öß) �ú׸üŸÖÖ
ÃÖÖ¬ÖÖ¸ü�Ö¯Ö�Öê ×�úŸÖß ´Ö•Öæ¸ü ¾Ö÷ÖÖÔ“Öß ÷Ö¸ü•Ö †ÖÆêü? --------------
5. ÆüÖ ´Ö•Öæ¸ü ¾Ö÷ÖÔ ÃÖÆü•Ö¯Ö�Öê ˆ¯Ö»Ö²¬Ö ÆüÖêŸÖÖê �úÖµÖ? ÆüÖêµÖ / −ÖÖÆüß
6. ³ÖÖ•Ö߯ÖÖ»ÖÖ ˆŸ¯ÖÖ¤ü−ÖÖ“µÖÖ �úÖ»ÖÖ¾Ö¬ÖߟÖᯙ ´Ö•Öã¸üÖ“µÖÖ �úÖ´ÖÖ“µÖÖ ¾ÖêôûÖ
�úÖê�ÖŸµÖÖ †ÖÆêüŸÖ? ÃÖ�úÖôû / ¤ãü¯ÖÖ¸ü / ¯Öæ�ÖÔ¾Öêôû
7. µÖÖ ÃÖ¾ÖÔ¾ÖêôûÖŸÖ ´Ö•Öæ¸ü ˆ¯Ö»Ö²¬Ö ÆüÖêŸÖÖê �úÖµÖ? ÆüÖêµÖ / −ÖÖÆüß
8. ³ÖÖ•Ö߯ÖÖ»µÖÖ“Öê ¯Öß�ú ÃÖÖ¬ÖÖ¸ü�Ö¯Ö�Öê ‹�ú Æü¯ŸµÖÖŸÖæ−Ö ×�úŸÖß ¾ÖêôûÖ ŸÖÖê›ü�µÖÖŸÖ µÖêŸÖê --------------
9. ‹�ú¸üß ³ÖÖ•Ö߯ÖÖ»ÖÖ ŸÖÖê›ü�µÖÖ�ú׸üŸÖÖ ×�úŸÖß ´Ö•Öæ¸ü »ÖÖ÷ÖŸÖÖŸÖ?
10. “Ö¾Öôûß ------- ±ãú»Ö�úÖê²Öß ------- ™ü´ÖÖ™ü¸ü ------ ¾ÖÖÓ÷Öê ------- ‡ŸÖ¸ü ------
³ÖÖ•Ö߯ÖÖ»ÖÖ ŸÖÖê›ü�µÖÖ�ú׸üŸÖÖ ¯ÖÏ׿Ö×�ÖŸÖ ´Ö•Öæ¸ü ¾Ö÷ÖÖÔ“Öß †Ö¾Ö¿µÖ�úŸÖÖ †ÖÆêü �úÖµÖ? ÆüÖêµÖ / −ÖÖÆüß
†ÃÖ»µÖÖÃÖ ŸÖÖê ÃÖÆü•Ö¯Ö�Öê ˆ¯Ö»Ö²¬Ö ÆüÖêŸÖÖê �úÖµÖ? ÆüÖêµÖ / −ÖÖÆüß

121
ˆŸ¯ÖÖ¤ü−ÖÖ“ÖÖ ÃÖÖ¬ÖÖ¸ü�Ö �úÖ»ÖÖ¾Ö¬Öß ×�úŸÖß »ÖÖ÷ÖŸÖÖê? --------------
´Ö•Öã¸üÖÓ−ÖÖ �úÖê�ÖŸµÖÖ ¯Ö¬¤üŸÖß−Öê ´Ö•Öã̧ üß ×¤ü»µÖÖ •ÖÖŸÖê? ¾ÖßÖæ / ¯Öî¿ÖÖ“µÖÖ --------------
´Ö•Öã¸üß ¤êü�µÖÖ“Öß ¯Ö¬¤üŸÖß �úÖê�ÖŸÖß †ÖÆêü?
ŸÖÖÃÖÖ¯ÖÏ´ÖÖ�Öê ------- ¸üÖê•ÖÖ¯ÖÏ´ÖÖ�Öê ---------- ´Ö×Æü−µÖÖ¯ÖÏ´ÖÖ�Öê -----------
´Ö•Öã¸üÖ²ÖÖ²ÖŸÖ †Ö¯Ö»µÖÖ †›ü“Ö�Öß �úÖê�ÖŸµÖÖ
--------------------------------------------------------------------------------------
--------------------------------------------------------------------------------------
´Ö•Öã¸üÖ²ÖÖ²ÖŸÖ †ÃÖ�ÖÖ·µÖÖ ÃÖ´ÖõÖÖÓ¾Ö¸ü †Ö¯Ö�Ö �úÖÆüß ˆ¯ÖÖµÖ µÖÖê•Ö−ÖÖ ÃÖæ“Ö¾Öæ ‡Û“”ûŸÖÖ �úÖµÖ? ÆüÖêµÖ / −ÖÖÆüß
†ÃÖ»µÖÖÃÖ �úÖê�ÖŸÖê ˆ¯ÖÖµÖ †ÖÆêüŸÖ
--------------------------------------------------------------------------------------
--------------------------------------------------------------------------------------
›ü) ³ÖÖ•Ö߯ÖÖ»ÖÖ ˆŸ¯ÖÖ¤ü−ÖÖ“µÖÖ ×¾Ö¯Ö�Ö−ÖÖÃÖÓ²ÖÓ¬Öß ´ÖÖ×ÆüŸÖß :
1. ˆŸ¯ÖÖפüŸÖ ³ÖÖ•Ö߯ÖÖ»µÖÖ“Öê ¯Öß�ú �úÖê�Ö�úÖê�ÖŸµÖÖ ²ÖÖ•ÖÖ¸ü¯ÖêšêüŸÖ ×¾Ö�Îúß»ÖÖ −Öê»Öê •ÖÖŸÖê?
וֻÆüÖ / ŸÖÖ»Öã�úÖ / ÷ÖÖ¾Ö²ÖÖ•ÖÖ¸ü / ‡ŸÖ¸ü --------------
2. ²ÖÖ•ÖÖ¸ü¯Öêšü �ú¿ÖÖ¯ÖÏ�úÖ¸ü“Öß †ÃÖŸÖê? šüÖê�ú / דֻ»Ö¸ü ²ÖÖ•ÖÖ¸ü --------------
3. šüÖê�ú ²ÖÖ•ÖÖ¸ü¯ÖêšêüŸÖ ´ÖÖ»ÖÖ“Öß ×¾Ö�Îúß �ú¸ü�µÖÖ“Öß ¯Ö¬¤üŸÖß �úÖê�ÖŸÖß? þ֟Ö: / ¤ü»ÖÖ»Ö
4. þ֟Ö: ×¾Ö�Îúß �ú¸üßŸÖ †ÃÖ»µÖÖÃÖ ²ÖÖ•ÖÖ¸ü ³ÖÖ¾ÖÖ−Öê ×¾Ö�úŸÖÖ �úß ŸµÖÖ¯Öê�ÖÖ �ú´Öß ³ÖÖ¾ÖÖ−Öê
²ÖÖ•ÖÖ¸ü ³ÖÖ¾ÖÖ−Öê ----------- �ú´Öß ³ÖÖ¾ÖÖ−Öê ------------
5. ¤ü»ÖÖ»ÖÖ“µÖÖ ´ÖÖ¬µÖ´ÖÖŸÖæ−Ö ×¾Ö�Îúß �ú¸üßŸÖ †ÃÖ»µÖÖÃÖ ×�úŸÖß ™üŒ�êú �ú×´Ö¿Ö−Ö ¤êüŸÖÖ? --------------
6. �ú×´Ö¿Ö−Ö ¤êü�Öê †Ö¯Ö�ÖÖÃÖ ¯Ö¸ü¾Ö›üŸÖê �úÖµÖ? ÆüÖêµÖ / −ÖÖÆüß
7. ¤ü»ÖÖ»ÖÖ´ÖÖ±ÔúŸÖ ×¾Ö�Îúß �êú»µÖÖÃÖ �úÖê�Ö�úÖê�ÖŸÖê ¿Öã»�ú †Ö�úÖ¸ü»Öê •ÖÖŸÖê --------------
8. ¤ü»ÖÖ»ÖÖ´ÖÖ±ÔúŸÖ ×¾Ö�Îúß �êú»µÖÖÃÖ µÖÖê÷µÖ ³ÖÖ¾Ö ×´ÖôûŸÖÖê �úÖµÖ? --------------
9. ×¾Ö�Îúß“ÖÖ “Öã�úÖ¸üÖ Ÿ¾Ö¸üßŸÖ ×´ÖôûŸÖÖê �úß ˆ¿Ö߸üÖ? --------------
10. ¤ü»ÖÖ»Ö ´ÖãŒŸÖ ²ÖÖ•ÖÖ¸ü¯Öêš µÖÖ µÖÖê•Ö−Öê²Ö§ü»Ö †Ö¯Ö»Öê ´ÖŸÖ �úÖµÖ? --------------

122
11. ¤ü»ÖÖ»ÖÖ ²ÖÖ²ÖŸÖ“µÖÖ †ÖÖ¯Ö»µÖÖ †›ü“Ö�Öß �úÖê�ÖŸµÖÖ †ÖÆêüŸÖ?
--------------------------------------------------------------------------------
12. ³ÖÖ•Ö߯ÖÖ»µÖÖ“Öß ×¾Ö�Îúß ÷Ö™üÖ´ÖÖ±ÔúŸÖ �ú¸üŸÖÖ �úÖµÖ? ÆüÖêµÖ / −ÖÖÆüß
13. ³ÖÖ•Ö߯ÖÖ»ÖÖ ×¾Ö�Îúß�ú׸üŸÖÖ ¯ÖÖšü×¾ÖŸÖÖ−ÖÖ ÃÖ±úÖ‡Ô ¾Ö ÷ÖÏê›êü¿Ö−Ö �êú»Öê •ÖÖŸÖê �úÖµÖ? ÆüÖêµÖ / −ÖÖÆüß
14. šüÖê�ú²ÖÖ•ÖÖ¸ü¯ÖêšêüŸÖ �úÖê�Ö �úÖê�ÖŸµÖÖ ÃÖã×¾Ö¬ÖÖ ˆ¯Ö»Ö²¬Ö †ÃÖŸÖÖŸÖ --------------
15. µÖÖ ÃÖã×¾Ö¬ÖÖ¯ÖÖÃÖæ−Ö †Ö¯Ö�Ö ÃÖ´ÖÖ¬ÖÖ−Öß †ÖÆüÖŸÖ �úÖµÖ? ÆüÖêµÖ / −ÖÖÆüß
16. −ÖÃÖ»µÖÖÃÖ �úÖ¸ü�Öê �úÖê�ÖŸÖß †ÖÆêüŸÖ? --------------------------------------------------
17. ²ÖÖ•ÖÖ¸ü¯ÖêšîüŸÖ †Ö¾Ö�ú ¾ÖÖœü»µÖÖÃÖ Ø�ú´ÖŸÖ �ú´Öß ÆüÖêŸÖê Æêü �Ö¸êü †ÖÆêü �úÖµÖ? ÆüÖêµÖ / −ÖÖÆüß
18. ²ÖÖ•ÖÖ¸ü¯ÖêšêüŸÖ †Ö�Ö»Öê»ÖÖ ´ÖÖ»Ö µÖÖê÷µÖ ³ÖÖ¾Ö −ÖÃÖ»µÖÖ´Öãôêû ×¾Ö�úÖµÖ“ÖÖ −ÖÃÖ»µÖÖÃÖ ÃÖÖšü¾Ö�Öæ�úß“Öß �úÖÆüß
ÃÖã×¾Ö¬ÖÖ ˆ¯Ö»Ö²¬Ö †ÖÆêü �úÖµÖ? ÆüÖêµÖ / −ÖÖÆüß
19. ³ÖÖ•Ö߯ÖÖ»ÖÖ ×¯Ö�ú Æêü −ÖÖ¿Ö¾ÖÓŸÖ †ÃÖ»µÖÖ−Öê ŸµÖÖ»ÖÖ Ÿ¾Ö¸üßŸÖ ×¾Ö�úÖ¾Öê »ÖÖ÷ÖŸÖê Æêü �Ö¸êü
†ÖÆêü �úÖµÖ? ÆüÖêµÖ / −ÖÖÆüß
20. µÖÖ ¯Ö׸üÛã֟ÖßŸÖ µÖÖê÷µÖ ³ÖÖ¾Ö ×´ÖôûŸÖÖê �úÖµÖ? ÆüÖêµÖ / −ÖÖÆüß
21. ²ÖÖ•ÖÖ¸ü¯ÖêšêüŸÖ −ÖÖ¿Ö¾ÖÓŸÖ ³ÖÖ•Ö߯ÖÖ»ÖÖ ÃÖÖšü¾Öæ−Ö šêü¾Ö�µÖÖ�ú׸üŸÖÖ ×¿ÖŸÖ÷ÖéÆüÖ“Öß
¾µÖ¾ÖãÖÖ †ÖÆêü �úÖµÖ? ÆüÖêµÖ / −ÖÖÆüß
22. ׿֟Ö÷ÖéÆüÖ²Ö§ü»Ö †Ö¯Ö�ÖÖ»ÖÖ ´ÖÖ×ÆüŸÖß †ÖÆêü �úÖµÖ? ÆüÖêµÖ / −ÖÖÆüß
23. ׿֟Ö÷ÖéÆüÖ“Öß ˆ¯Ö»Ö²¬ÖŸÖÖ —ÖÖ»µÖÖÃÖ †Ö¯Ö�Ö ŸµÖÖ“ÖÖ »ÖÖ³Ö ‘µÖÖ»Ö �úÖµÖ? ÆüÖêµÖ / −ÖÖÆüß
24. ³ÖÖ•Ö߯ÖÖ»ÖÖ ÃÖÖšü¾Ö�Öæ�úß²ÖÖ²ÖŸÖ †Ö¯Ö»µÖÖ †›ü“Ö�Öß ÃÖÖÓ÷ÖÖ
----------------------------------------------------------------------------------
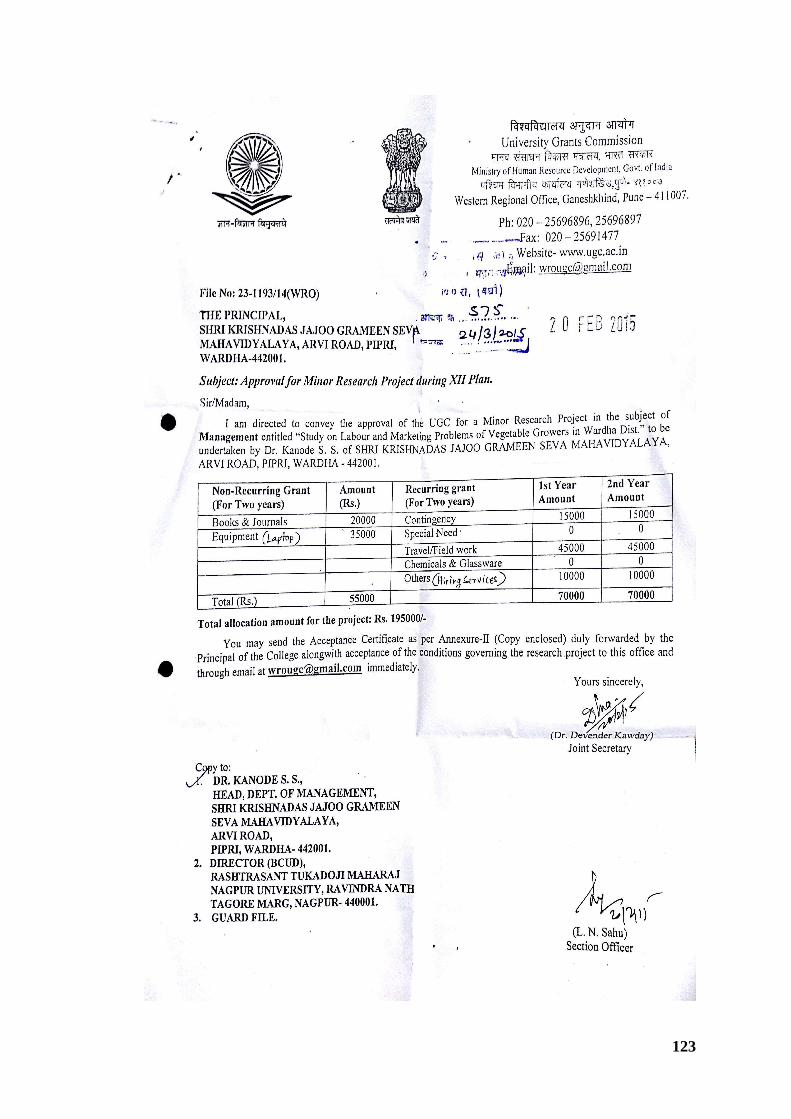
123