a consumer behaviour profile of olive oil consumers …
TRANSCRIPT
A CONSUMER BEHAVIOUR PROFILE OF OLIVE OIL CONSUMERS
IN KWA ZULU NATAL
ADHESTRA MUNIAN
Submitted in partial fulfilment ofthe requirements for the degree ofMASTERS IN BUSINESS ADMINISTRATION
Graduate School ofBusiness, Faculty of Management StudiesUniversity of Natal (Durban)
Supervisor: NIRISHA NAICKER
2003

DECLARATION
This research has not been previously accepted for any degree and is not being currently submitted incandidature for any degree.
Sign~.': ,
Date Jr::.!?!?jf!.~~ .

ACKNOWLEDGEMENTS
I wish to acknowledge the assistance, motivation and help of my friends
Colin Moonsamy, Alan Govender and especially Neroshni Naidoo.
A special acknowledgement to Nirisha Naicker whose guidance and support
made this study possible.
"Not that we are sufficient by ourselves to think anything as for ourselves;
but our sufficiency is from God."
2 Corinthians 3:5
III

DEDICATION
This study is dedicated to my dad.
"We should consider every day lost
in which we do not dance at least once"
Nietzsche
IV
ABSTRACT
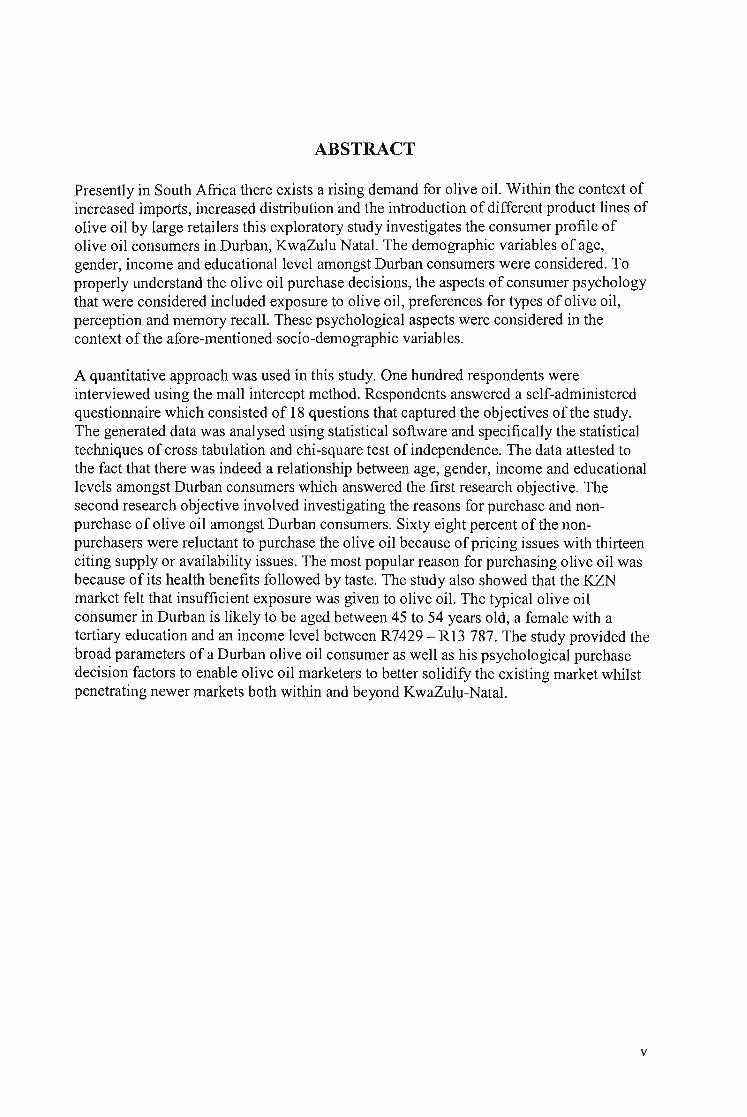
Presently in South Africa there exists a rising demand for olive oil. Within the context ofincreased imports, increased distribution and the introduction of different product lines ofolive oil by large retailers this exploratory study investigates the consumer profile ofolive oil consumers in Durban, KwaZulu Natal. The demographic variables of age,gender, income and educational level amongst Durban consumers were considered. Toproperly understand the olive oil purchase decisions, the aspects of consumer psychologythat were considered included exposure to olive oil, preferences for types of olive oil,perception and memory recall. These psychological aspects were considered in thecontext of the afore-mentioned socio-demographic variables.
A quantitative approach was used in this study. One hundred respondents wereinterviewed using the mall intercept method. Respondents answered a self-administeredquestionnaire which consisted of 18 questions that captured the objectives of the study.The generated data was analysed using statistical software and specifically the statisticaltechniques of cross tabulation and chi-square test of independence. The data attested tothe fact that there was indeed a relationship between age, gender, income and educationallevels amongst Durban consumers which answered the first research objective. Thesecond research objective involved investigating the reasons for purchase and nonpurchase of olive oil amongst Durban consumers. Sixty eight percent of the nonpurchasers were reluctant to purchase the olive oil because of pricing issues with thirteenciting supply or availability issues. The most popular reason for purchasing olive oil wasbecause of its health benefits followed by taste. The study also showed that the KZNmarket felt that insufficient exposure was given to olive oil. The typical olive oilconsumer in Durban is likely to be aged between 45 to 54 years old, a female with atertiary education and an income level between R7429 - R13 787. The study provided thebroad parameters of a Durban olive oil consumer as well as his psychological purchasedecision factors to enable olive oil marketers to better solidify the existing market whilstpenetrating newer markets both within and beyond KwaZulu-Natal.
v
TABLE OF CONTENTS
CHAPTER I-INTRODUCTION 1
1.1 STATEMENT OF THE PROBLEM 1
1.2 OBJECTIVES OF THE STUDy 1
1.3 MOTIVATION FOR THE STUDY 2
1.4 BACKGROUND TO THE STUDY 2
1.5 STRUCTURE OF THE DISSERTATION .4
1.6 LIMITATIONS OF THE STUDY 4
CHAPTER 2 - LITERATURE REVIEW 5
2.1 THE SOUTH AFRICAN MARKETING ENVIRONMENT 7
2.2 THE CONSUMERS CULTURE 8
2.2.1 ETHNIC AND RELIGIOUS INFLUENCES 8
2.2.2 SOCIAL CLASS INFLUENCES 9
2.2.3. AGE 10
2.3. THE PSYCHOLOGICAL CORE 17
2.3.1 UNIVERSAL FOOD CHOICE MODEL. 20
2.3.2 PROPERTIES OF THE FOOD 21
2.3.3 PERSON-RELATED FACTORS 21
2.3.4 DEMOGRAPHICS IN INTERACTION WITH FOOD ATTRIBUTES 23
2.3.5 PERSONAL HEIRACHY OF NEEDS IN INTERACTION WITH
ECONOMIC AND CULTURAL FACTORS 23
CHAPTER 3 - RESEARCH METHODOLOGY 25
3.1 INTRODUCTION 25
3.2 SECONDARY DATA 26
3.3 SAMPLING 26
3.3.1 POPULATION : 26
3.3.2 SAMPLING DESIGN 27
3.3.3 SAMPLE SIZE 28
VI
3.3.4 DATA COLLECTION 28
3.3.5 QUESTIONNAIRE DESIGN 30
3.3.6 QUESTIONNAIRE CONSTRUCTION 30
3.3.7 PRE-TEST QUESTIONNAIRE 32
3.3.8 RELIABILITY AND VALIDITY 33
CHAPTER 4: EVALUATION OF DATA ANALYSIS AND FINDINGS 34
4.1 INTRODUCTION 34
4.2 RESPONDENTS DEMOGRAPHICS 34
4.3 CROSS TABULATION RESULTS OF RESPONDENTS 39
4.3 CHI-SQUARE TEST OF INDEPENDENCE .43
CHAPTER 5 - RECOMMENDATIONS AND CONCLUSIONS 52
5.1 RESEARCH CONCLUSIONS 52
5.2 RECOMMENDATIONS 54
BIBLIOGRAPHY 55
APPENDIX A - QUESTIONNAIRE 59
SURVEY INSTRUMENT 59
vu
LIST OF FIGURES
FIGURE 4.1- GENDER OF THE RESPONDENTS (N = 100) 35
FIGURE 4.2 - AGE OF RESPONDENTS (N=lOO) 36
FIGURE 4.3 EDUCATIONAL LEVELS OF THE RESPONDENTS (N=lOO) 37
FIGURE 4.4 INCOME CATEGORY OF THE RESPONDENT (N=100) 38
FIGURE 4.5 FACTOR THAT INFLUENCE A NON-BUYER (N=lOO) .45
FIGURE 4.6: REASONS FOR OLIVE OIL PURCHASE AMONGST DURBAN CONSUMERS
(N=lOO) 46
FIGURE 4.7 DIFFERENT TYPE OF OLIVE OIL PURCHASED IN DURBAN (N=100) .47
FIGURE 4.8 EXPOSURE TO OLIVE OIL ADVERTS (N=100) .49
FIGURE 4.9: RISK PERCEPTIONS OF RESPONDENTS TO BUYING GOOD OLIVE OIL (N=lOO)
................................................................................................................................... 50
V1l1

LIST OF TABLES
TABLE 4.1 GENDER AND OLIVE OIL PURCHASE CROSS TABULATION (N=100) ••••••••••••••39
TABLE 4.2 AGE AND OLIVE OIL PURCHASE CROSS TABULATION (N=100) •••••••••••••••••••.40
TABLE 4.3 EDUCATIONAL LEVELS AND OLIVE OIL PURCHASE CROSS TABULATION
(N=100) 41
TABLE 4.4 INCOME LEVELS AND OLIVE OIL PURCHASE CROSS TABULATION (N=100).42
TABLE 4.5: CHI SQUARE TEST OF INDEPENDENCE (N=100) ••••••••••••••••••••••••••••••••••••••••••.43
IX
CHAPTER 1 - INTRODUCTION
1.1 STATEMENT OF THE PROBLEM
As society becomes more health conscious, there is an increased focus on eating
healthily to reduce the risk ofheart disease and other related ailments. Increased scientific
research into the Mediterranean diet has shown that their low levels of heart disease is
due in no small measure from the regions culturally entrenched use of naturally derived
products particularly virgin olive oil.
Over the past few years there has been increased imports of olive oil into South Africa
with many of the major retail chains introducing their own brands of olive oil product
lines ie extra virgin olive oil, virgin olive oil and olive oil. Essentially to many of olive
oil importers, distributors and retailers there has not been a study to identify the
demographic characteristics of age, gender, educational and income levels amongst
Durban consumers and olive oil purchase decisions.
Once such a relationship is established (if existent) a consumer profile can be established.
Many of the demographic variables are related to the consumers psychology including
the consumers motivation, preferences, risk perceptions and influences.
1.2 OBJECTIVES OF THE STUDY
This research investigates perceptions, motivation as well as preferences of current and
potential users of olive oil consumers in the Kwa-Zulu Natal, Durban region.
1
The objectives of the study can be defined as follows:
1. To detennine the relationship between olive oil purchasing and the demographic
variables of age, sex, income and educational level amongst Durban consumers.
2. To develop a broad consumer profile of olive oil consumer in Durban.
3. To investigate the reasons for the purchase and non-purchase of olive oil amongst
Durban consumers.
4. To investigate the motivation, exposure, risk perceptions and influences to olive oil
purchasing amongst Durban consumers.
1.3 MOTIVATION FOR THE STUDY
Olive oil imports into South Africa are on the increase for the past five years. More retail
chains are also introducing their own brands of olive oil. By profiling the consumer base
as well understanding the psyche behind their purchase the targeting of advertising and
promotional campaigns can be better achieved.
1.4 BACKGROUND TO THE STUDY
Olive oil was called "liquid gold" by the Greek author Homer. And not without good
reason. It has influenced, inspired, nourished, healed and helped maintain some of the
power of the most potent empires of the ancient world.
A completely natural product, olive oil is quite literally the juice ofthe olive oil. Canola,
peanut and sunflower oil are all extracted using chemical solvents. Oil is an essential part
of our diet. Olive oil naturally yields high levels ofmonounsaturated fatty acids, vitamin
E and antioxidants, all of which make the product the best option for the kitchen. Most
importantly olive oil lowers bad cholesterol (low density lipoproteins) and makes you
less susceptible to high blood pressure, heart disease and cancer. Olive oils aid the body
in other ways too. For instance, the presence of the vitamin D and K improves the
2
appearance of hair and skin whilst facilitating digestion and improves bone development
(www.tertuliaonline.com)
South Africa's burgeoning olive oil industry is burning ever brighter on the international
stage: two estates have already won acclaim. Striking gold last year, the Paarl based
Vesuvio Estates, the country's largest producer of olive oil for the local market, won first
prize in the "medium-fruity" category at the L'Orciolo D'Oro competition in Italy. In
2000 the estate walked off with a quality award in the "new world" category in the same
competition (Gold, 2002).
Besides the fact that the locally produced olive oil is of a very good quality there also
exists a rising demand for olive oil in the South African marketplace. In non-traditional
markets (such as South Africa) in the decade from 1987/88 to 1997/1998 consumption
increased almost exponentially. (Mili & Zuniga, 2001). South Africa produces less than
1000t/year of olive oil while global production exceeds 2m t/year and the annual shortfall
is about 200 OOOt/year. The rising demand for olive oils is largely due to the growing
popularity ofpizza houses and other restaurants. South Africans are increasingly
experimenting with different especially Mediterranean countries popular dishes in their
kitchens at home. South Africans are also becoming increasingly health conscious and
the products healthy properties are becoming widely known and its beginning to replace
other oils in food preparation (Van Zyl, 2000).
Considering the above factors an exploratory study using quantitative methods for data
collection will be conducted to investigate the relationship between olive oil purchasing
and the demographic variables of age, sex, income and educational levels amongst
Durban consumers. These demographic variables will help to develop a profile of
consumers and non-consumers of olive oil in the Durban region. However the
demographic profile of the consumer will only provide part of the understanding of the
olive oil consumer and it therefore is necessary to probe the psyche of the Durban
consumers and non-consumers to ensure that the advertising and promotion campaigns
can be better focused.
3
1.5 STRUCTURE OF THE DISSERTATION
Having provided the introduction, background and objectives of the study in chapter 1,
chapter 2 will review some of the literature pertaining to this study to provide a frame of
reference. Chapter 3 will provide the research methodology. Chapter 4 entails the data
analysis and findings using tables and figures to discuss research objectives. Chapter 5
presents the research conclusions and recommendations.
1.6 LIMITATIONS OF THE STUDY
Due to the time and financial constraints the research was confined to use:
a survey for the Kwa-Zulu Natal province only and
a convenience sample.
4
CHAPTER 2 - LITERATURE REVIEW
There remains an inherent need to understand the decision processes that consumers
undergo during an actual purchase or consumption. Why? Quite simply to ensure a repeat
purchase or consumption and to reduce buyer dissonance. The usage of a product or
service can influence other behaviours. Dissatisfied and negative consumers may
communicate their negative experiences to others and sometimes with devastating results
(Hoyer & MacInnis, 2001). Fortunately, however, the converse also holds true and a
fantastic product and service can generate positive word of mouth which can be the best
form of advertising that a company could possibly ask for.
The entire study of consumer behaviour suggests that acquisition, consumption and
disposition can occur over time in a dynamic sequence. To illustrate the sequence, a
family can acquire a bottle of olive oil. Usage of the olive oil can provide the family with
information- such as its taste, acidity, colour and health benefits. However it may
sometimes be the case that that the majority of the family may not like the taste of the oil
or its colour and in such an instance it may be necessary to dispose of that particular
bottle of oil or worse still to not consider another similar purchase.
What was alluded to in the preceding paragraph is the fact that consumer behaviour itself
can involve many people and does not necessarily reflect the action of a single individual.
In the purchase of a particular brand of cooking oil it might sometimes be the case that a
family friend may assume the role of information gatherer by collecting information
about potential oils. They may take the role of influencer and influence the mother of the
household to purchase the new type of oil. The father of the family may at times take the
role of paying for the actual consumption whilst the entire family engages in its
consumption. Thus it can be seen that sometimes a seemingly casual purchase may infact
be the cumulative sum of a number of influencing factors stemming from a variety of
sources.
5
Thus according to Hoyer and Maclnnis, 2001,the real study of consumer behaviour
involves understanding whether, why, when, where, how, how much and how long
consumers will buy, use or dispose of an offering. The insightful understanding of these
probing words lie at the heart of a marketers ability to promote a product to a consumer
at the right place to derive a profitable price. In addition to understanding how consumers
acquire products and services, marketers may also be interested in how consumers use an
offering. For example, marketers have found that in certain Mediterranean households
that olive oil has been used as a hair nourishing ointment and also as a salad dressing
which is gradually extending beyond just homes with Mediterranean ties (Robinson:
2001). By better understanding the different uses of olive oil marketers are better able to
position the product in a way that makes purchase the most likely outcome.
However in positioning the olive oil to the consumer there remains several factors which
influence the consumers decision making process. The marketers task is to understand
what happens in the buyers consciousness between the arrival of external stimuli and the
buyers purchase decision factors (Kotler, 2000).
MacInnis and Hoyer (200 l) suggest that consumer behaviour encompasses four main
domains: (1) the psychological core (2) the process of making decisions (3) the
consumers culture and (4) consumer behaviour outcomes. Each domain is related to all
the others. For example for consumers to make decisions to use olive oil consumers must
first engage in processes described in their psychological core. They need to be
motivated, able and have the opportunity to be exposed to, perceive and attend to
information about olive oil. The consumers will need time to think about the various
aspects of olive oil e.g. acidity, colour, health benefits etc to form attitudes about the
olive oil and to then form memories.
The cultural environment will affect what motivates consumers, how they process
information and the kinds of decisions that they make. Age, gender, social class,
ethnicity, families, friends and other groups affect values and lifestyles and hence
influence the decisions consumers make and how and why they are made. The outcome
of the buying decision will depend on many influencing variables both individual and
6

environmentaL Environmental variables of specific importance to marketers include
economic demand factors, and economic and business influences. Economic demand
factors refer to potential purchasing power based on availability of money, whereas
business and marketing influences refer to the direct contact that the firm has with the
customer, through advertising and for example taste tests of the olive oil (Du Plessis &
Rosseau, 1999). More specifically marketing influences or stimuli can be described as
elements of the marketing mix or the four P's: price, product, place and promotion and
relates to how consumers respond to changes in these elements of the marketing mix
(Kotler et aI, 1996).
2.1 THE SOUTH AFRICAN MARKETING ENVIRONMENT
In order to understand the external stimuli that impact on socio-cultural factors of
consumer purchase behaviour it is necessary to consider the broader South African
marketing environment. Marketing planning and the execution of a marketing strategy
are at the best of times demanding assignments. Doing so in a turbulent environment is a
challenge, to say the least.
South Africa has faced tremendous political changes over the past ten years and its
business sector and marketers in particular have not been insulated from these changes.
Variables such as unemployment, inflation, interest rates, exchange rates and the
economic growth rate can be seen as indicators of the state of affairs in the South African
economic environment. Willingness to spend or save depends to a large extent on levels
of consumer confidence (or lack thereof). These environmental factors will thus exert an
influence on consumer behaviour, attitude and perception.
The past political policies of South Africa have had a direct impact on present day
consumers exposure, awareness and more importantly opportunities to purchase
particularly what is perceived to be high end commodities such as olive oiL Therefore
any discussion of consumer opportunities and behaviour patterns involving these
perceptive high end commodities must be seen in the context of past policies particularly
7
for South Africa's previously disadvantaged communities. However a full racial analysis
of the purchase patterns of olive oil by race is at this stage beyond the scope of this study
and could well be a topic for further investigation.
Besides the broader South African political and marketing environment the other factors
which will play a role in influencing an olive oil consumers purchase decisions include
the consumers cultural factors of ethnic and religious influences, social class influences,
age, gender and household influences, social influences as well as psychographical
factors. Each of these consumer cultural factors will in itself play an important role in
influencing the purchase decision of olive oil but for the purposes of this study the
emphasis will be placed on the influence of gender, age, income and educational levels
on the purchase of olive oil.
2.2 THE CONSUMERS CULTURE
2.2.1 ETHNIC AND RELIGIOUS INFLUENCES
People of Mediterranean descent have had an intimate association with olive oil for
almost 6000 years where the characteristics of the olive tree and oil have been a recurring
symbol. There are many analogies from both the Old and New Testament of the Holy
Bible which relate to the olive tree. Infact this has been so much of a theme that Christ's
ascent into heaven took place from the Mount of Olives. In contrast to many of the
Mediterranean cultures the introduction of olives to South Africa has been relatively
recent, with the fIrst commercially grown olives occurring in the early twenties in the
Western Cape (van Zyl, 2000). Most of the commercially available olive oils on the
South African supermarket shelves are imported from many Mediterranean countries and
thus at this point in time the writer decided to exclude the influence of ethnic and regional
influences on olive oil purchase decisions. However it should be noted that within a
South African context there is bound to be different associations between white and black
consumers when viewing a product such as olive oil, mostly due to the previously alluded
to factors regarding product exposure to Black consumers.
8
2.2.2 SOCIAL CLASS INFLUENCES
The concept of social class implies that some people have more power, wealth and
opportunity than others do. Most societies have a social class heirachy that confers higher
status to some classes of people than to others. Members of a social class tend to share
similar values and behaviour patterns. However these social classes are not fonnal groups
with a strong identity but rather loose collections of individuals with similar life
experiences (Hoyer & MacInnis, 2001).
The influence of olive oil consumption and social class status was perhaps never more
pronounced than during the Roman Empire when it was stated that "You eat what you
are" (www2.carthage.edu). From the basic diet of the soldier to a small landowner or
tenant fanner the social class of the Roman people was strongly influenced by their diet.
During the Augustan era only the most wealthy consumed meat and fish and indulged in
one of the most prominent crops of the time namely olives. The olives were eaten but
more importantly their oil was used extensively in cooking and for other purposes such as
fuel for lamps, perfume and body oils (www2.carthage.edu). Such luxuries of having
perfumed olive oil as a body oil was well outside the reach ofmost ofthe less fortunate in
Rome.
Within the South African context the Living Standard Measures (LSMs) are utilised by
marketers to understand the various segments within South Africa. LSMs range from 1 to
10. Factors detennining the LSM group to which a particular consumer belongs include
demographics (age, educational levels, income, gender), exposure to media (radio, TV,
cinema and newspapers) and general categories which include access to services,
ownership of durables including computers and satellite dishes, and participation in
community and sporting activities. LSM groups 1 to 6 represent poor and middle class
communities with incomes between R 748 and R3731 a month. LSM groups 7 to 10 have
incomes between R 5495 to R13 406 per month. They represent approximately fifteen
percent ofthe population (www.saarf.co.za)
9
The consumption patterns of olive oil specifically within a South African context related
to LSMs is part of the exploratory work that will be addressed in this study. However
considering the high price of the olive oil at retail outlets it would be a safe assumption to
make that currently this product is being targeted to the high end of the market or to
individuals that are from the higher LSM groups viz. LSM 7 to 10.
2.2.3. AGE
Marketers often segment consumers by age. The basic logic is that people of the same
age are going through similar life experiences and therefore share common needs,
symbols and memories which in turn may lead to similar consumption patterns (MacInnis
& Hoyer, 2001)
The four major age groups identified by marketers are: (1) Teens (2) Generation X (3)
Baby Boomers and (4) the 50 and older market
2.2.3.1 TEENS
Teenagers have an influence on household purchasers and also have their own
discretionary power. Never before has so much of advertising been pitched to so many
who are so young. The Y Generation (born between 1980 and 1995) have become a
powerful consumer segment and essentially are the Web generation who will do more of
their shopping online than their parents (Clark & Deziel, 1999). However their influence
on the purchasing of groceries within households in South Africa will be briefly
elaborated on in this study.
10
2.2.3.2 GENERATION X'ERS
Generation X'ers were born between 1965 to 1976. Born and bred on TV, X'ers may
become cynical about obvious marketing techniques. However, X'ers may react
positively to efforts that are seen to be in tune with their values and motives. Healthy
eating habits and a healthy lifestyle is becoming of increasing importance to this
particular age group and are an important segment for the purchase of products that
promote this healthier lifestyle such as olive oil. Generation X'ers represent
approximately 16 % of the South African population (www.satssa.gov.za)
2.2.3.3 BABY BOOMER
Baby Boomers are those born between 1946 and 1962. This group is now between early
40's and late 50's - the prime earning and spending years. Because the baby boomers are
the segment with the greatest economic impact they are the target for many products and
services. This particular age segment is an important segment for the purchase of health
products and products relating to anti-ageing such as skin moisturisers and creams.
However this very large group is getting older and marketers therefore need to modify
their product offering. A fast-ageing population is the new reality in the United States and
in other industrialised nations such as Japan, Germany, Italy and Britain (parmar, 2003).
2.2.3.4 THE 50 AND OLDER MARKET
The Southern Africa region has the continents highest percentage of older inhabitants; 6.2
percent of the population in 1997 was estimated to be 60 years of age or older. South
Africa has the highest proportion of older population with more than 1 in 8 persons aged
50 and over and nearly 7 percent aged 60 and above. As more person live to older ages,
11
the growth rate of the 60 and over population has come to exceed that of the total
population. After the turn of the century, the fastest growing population segment is likely
to be persons aged 70 and over. There is a growing number of older persons and current
projections between 1997 and 2010 are projected to be an absolute growth in excess of 1
million persons. Considering the older age groups by race, more than one fourth of all
White are now aged 50 or above, with nearly 14 percent in the 60 and over category.
Corresponding figures for Blacks are 11 and 6 percent respectively and slightly less for
Asians and Coloureds (www.censlls.goV).
In terms of consumer behaviour, information processing skills tend to deteriorate with
age. Therefore, older and more mature consumers are less likely to search for information
and to have difficulty in remembering and making more complex decisions, especially
with large amounts of information. Thus they tend to engage in simpler more schematic
processing. Further, poor recognition memory makes them susceptible to the "truth
effect" (believing that often repeated statements are true). Mature consumers will also
tend to shop more often at discount stores (Maclnnis & Hoyer, 2001).
In a South African context this is an age segment which is one of the most important
purchasers of medicinal products and those relating to health care. According to the
South African Advertising and Research Foundation LSM groupings list, the 50+ age
groups falls under LSM 1, representing a group that received a primary education only.
As discussed earlier the dynamics of the South African marketplace are such that this
particular age segment experienced the majority of their lives under repressive political
laws that directly affected their purchasing power today. Marketing to the Black market
in this age segment will therefore have to be cognisant of some of the many nuances of
the past.
12
2.2.4 INCOME DISTRIBUTION
The gulf between the have and have nots in South Africa have widened since 1994.
"Winners and Losers: South Africa's Changing Income Distribution in the 1990s," a
study of income distribution from 1991 to 19996 by South African researchers at
Wharton Economic Forecasting Associates have found that while the rich continued to
become richer whilst the poorest of the poor, especially in the black community became
worse off.
While the Wharton Associates report confirms that racial inequalities of income persist, it
also shows there has been a significant redistribution of income towards previously
disadvantaged population groups. That is the country's economic elite is becoming
significantly more black and economic class divisions now bear markedly less correlation
to race.(Whiteford, 2001)
Figure 1.1 below confirms what many have suspected that the gap between the poor and
rich blacks have widened dramatically. The Gini coefficient measures this: it measures
from zero, where income is evenly spread across a population to one, where it is entirely
skewed. For blacks the Gini coefficient shot up from 0.35 in 1990, to 0.51 in 1995
(Economist, 1997)
13

FIGURE 1.1: PERCENTAGE OF BLACKS AND WHITES IN EACH INCOME
CATEGORY BY QUINTILE
Despite the widening wealth gap amongst Blacks, South Africa as a whole is becoming
less unequal The Gini coefficient for the whole population in 1995 had dropped to 0.55.
The marketing implication of this is that there could well be a greater potential
purchasing power out there amongst South African and particularly amongst the elite
Black consumers. These newly found rich segment will tend to engage more III
conspICUOUS consumption purchase patterns which will bode well for luxury good
marketers.
2.2.5 EDUCATION
South Africa has experienced major and social economic reform during the last two
decades. Further reforms are expected as the country emerges from a long period of
economic turmoil. These reforms will most likely include changes in the allocation of
14
resources to education. Marais (1994) shows that spending on education is very unevenly
distributed and that some equalisation of the distribution of resources is occurring. If the
South African labour market operates in a similar manner to that in industrial countries,
changes to the distribution of educational expenditures will have a major impact on
income distribution. The obvious implication is that any reforms which introduce a more
equal distribution of education might result in a distribution of income that is less unequal
in the longer term (Marais, 1994).
Marais (1994) conducted an empirical study that provided evidence that an investment in
education has been directly related to earnings across racial groups, an increase in the
average level of education has been associated with a narrower dispersion of earnings,
and a more equal distribution of education has been associated with a more equal
distribution of earnings. One policy implication is that a reforming government that
distributes resources in education more equally might simultaneously address in part
another issue that is at the heart ofmuch social and political discontent in the country,
namely, the unequal distribution of income. The implication of this to consumer purchase
behaviour is that one could anticipate that with a more even distribution of education that
the somewhat resulting income distribution will result in the purchase of goods that
reflect more of the buyers status and 'arrival' rather than survival and security need based
products.
2.2.6 GENDER
Males and females can differ in traits, attitudes and activities that can affect consumer
behavior. Over time, however, both male and female roles have been evolving. In
particular, many more women are delaying both marriage and starting a family in favour
of building a career, and an increased proportion of women are entering occupations that
were formerly the domain ofmen, such as management, engineering and law. More
women are also rejecting traditional roles related to submissiveness, homemaking and
15
sexual inhibition (MacInnis & Hoyer, 2001). Men and women also tend to exhibit
different eating patterns. In particular, women are more likely to engage in compensatory
eating - making up for deficiencies such as a lack of social contact or depression by
eating (Barone et aI, 1996).
Female consumers also tend to be make more feeling based purchase decisions and are
more concerned as to how people will be affected by their choice. These feeling based
decisions are generally based on personal and group values. Male shoppers generally tend
to be more analytical and prefer to decide based on logic, deciding impersonally based on
cause and effect (Labarbera, 1998). The marketing implication of these differences with
regards to olive oil purchase could possibly mean that much of the advertising and
promotion of the product should be based on branding that makes both head and heart
sense. The head sense aspect of advertising could possibly emphasise the health benefits
of using olive oil in reducing heart disease to appeal to male consumers.
2.2.7 PSYCHOGRAPHICS: VALUES, PERSONALITY AND LIFESTYLE
Psychographics basically relates to the description of consumers on the basis of their
psychological and behavioural characteristics. Traditionally, psychographics measured
consumer lifestyles, but more modem applications have broadened the approach to
include other concepts such as the psychological makeup of consumers, their values and
personality, and the way they behave with respect to specific products.
Psychographies provides marketers with a more detailed understanding of consumer
behaviour than demographic variables like ethnicity, social class, age, gender and
religion. For example, Generation X'ers can be divided into several psychographic
groups. So called Yup & Corners (28 percent of Generation Xers) have the highest levels
of income and education and are comfortable about themselves and their future.
Bystanders (37 percent) are predominantly practical, hardworking females. Playboys (19
percent) are self absorbed, fun loving, impulsive types who live on the edge; and Drifters
16
(16 percent) fit the Xer stereotype ofbeing frustrated, are the least educated members of
their generation and are looking for status (Maclnnis and Hoyer, 2001).
Because the study of personality, values and lifestyle of consumers is extensive in itself it
will not be covered in depth within this study. However it should be noted that this brief
introduction to psychographics in no way detracts from its relevance to the influence that
it will have on the purchase of olive oil. For example an individual who values a healthy
diet as an important part of his/her lifestyle, will be more likely to engage in the various
purchase decision factors involved in purchasing olive oil. This individual is more likely
to seek out more information about olive oil to possibly reinforce his various purchase
decisions. He will also tend to be more of a spokesperson for the product and could well
be a strong social influencer in increased purchase of olive oil.
Besides many of the broader consumer cultural aspects which affect the consumers
decision to purchase olive oil there are various psychological factors which also play an
important role. Although the focus of this study will primarily revolve around the
influence of age, gender, income and educational levels in the purchase decisions of olive
oil amongst Durban consumers it is necessary to acknowledge that these factors do not
occur in isolation but rather impact upon various psychological decision making factors
resulting in the desired outcome of the actual purchase of olive oil.
2.3. THE PSYCHOLOGICAL CORE
Because of the nature of olive oil itself in terms of the variety of choice (extra virgin
olive oil, virgin, light, extra light), the varying extraction processes involved, its acidity
variation, aroma differences, taste and flavour differences the purchase of the oil itself
can be regarded as a higher involvement purchase than many other types of groceries.
According to recent major surveys of consumer research (Cohen & Charavarti, 1990;
Jacoby, Johar and Morrin, 1998) the major emphasis is on purchase decisions with a
17

dominant cognitive approach to understanding how they are made. The cognitive
approach takes two main forms, social cognition and behavioural decision theory. These
major approaches propose consciously made, deliberate choices and decisions. The social
cognition models are mainly concerned with the conditions under which people do,
versus do not, engage in careful, effortful processing of the information contained in
persuasive messages. In this type of research even when the experimental participant is
not processing effortfully but is instead relying on simplifying shortcuts, she is still
focusing her efforts on the message, intentionally processing it, and then reporting a
consciously formed attitude or opinion.
Since 1980 however there have been two major developments in social cognition
research that will appear relevant to consumer research. These are the substantial role
played by nonconscious processes (and the minimal role played by deliberate, effortful
processes) in psychological and behavioural phenomena and the central and modifying
role of needs and goal pursuits. Because of the continued reliance of consumer research
on the 1980 - era models, these new developments have not yet made much impact.
However to the extent that consumers are behaving without conscious awareness and
guidance, models that assume the consumers deliberate and effortful scrutiny of the
choice or behaviour will likely miss much ofthe character and flavour of the consumer
behaviour in situ. (Bargh, 2002).
Consumers' normal food purchases are viewed as low-involvement decision activities. A
supermarket trip rarely involves long and complicated decision processes. Food
purchasing is often an unconscious, instantaneous act that is accompanied by consistent
and habitual purchasing behaviour. However, even with purchases of low involvement
food products, consumers generally go through a decision-making process before
selection is made. There does exists an argument that olive oil purchase might differ from
the purchase of other oils in that considerable information is required prior to purchase
and thus it can be considered to be a more involved purchase commodity.
18
Research studies have discovered certain personality attributes are strongly correlated
with food selection. In one study, undertaken in Germany, food purchase criteria were
measured in four different dimensions:
• Egoistic and hedonistic orientation usmg criteria of freshness, flavour, and
appearance;
• Egoistic and health orientation usmg as criteria healthiness, non genetically
produced foods, no preservatives and organically produced;
• Altruistic orientation using criteria such as environmental packaging, non
genetically produced goods, organically produced, regionally produced and with a
known producer;
• Marketing orientation using criteria of price, country-of-origin, quality mark, and
brand. (Wirthgen et ai, 2002)
In companson, the conceptual model of food choice developed by Furst (cited m
Roininen, 2001) highlights three factors:
• Life course such as a person's experience;
• Influences including ideals, personal factors, resources, social framework, and
food context;
• Personal systems and strategies for making choices and value negotiations such as
sensory perceptions, monetary considerations, convenience, health, nutrition,
management of relationship and quality.
While common attributes and criteria for food selection and purchase are noted across
studies, cultural or geographical differences are also evident. For example, American
consumers ranked in order of importance, taste, cost, nutrition, convenience and weight
control expectations. Taste was considered to be a minimum standard of food acceptance
except for fruit and vegetables. (Glantz et ai, 1998)
19
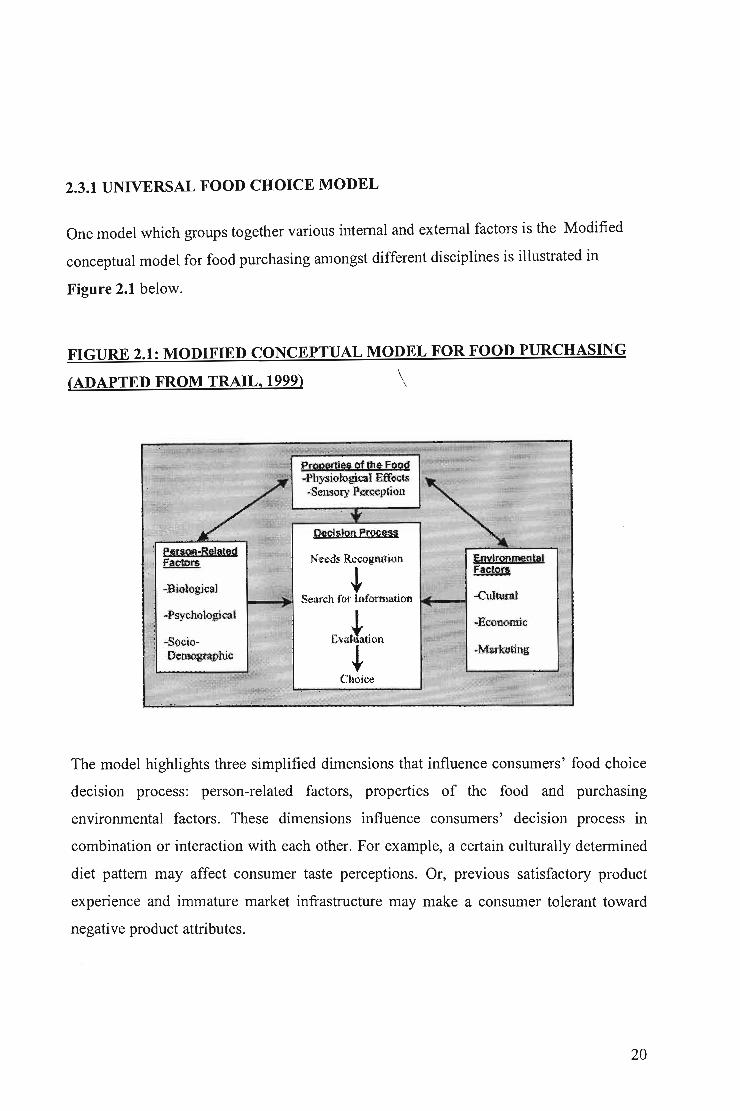
2.3.1 UNIVERSAL FOOD CHOICE MODEL
One model which groups together various internal and external factors is the Modified
conceptual model for food purchasing amongst different disciplines is illustrated in
Figure 2.1 below.
FIGURE 2.1: MODIFIED CONCEPTUAL MODEL FOR FOOD PURCHASING
(ADAPTED FROM TRAIL, 1999) \
.Psycholo,gicat
prppettj§of tht FoRd-Phtysiological Effects';SCllS0r] Pcr~p1ion
The model highlights three simplified dimensions that influence consumers' food choice
decision process: person-related factors, properties of the food and purchasing
environmental factors. These dimensions influence consumers' decision process in
combination or interaction with each other. For example, a certain culturally determined
diet pattern may affect consumer taste perceptions. Or, previous satisfactory product
experience and immature market infrastructure may make a consumer tolerant toward
negative product attributes.
20
2.3.2 PROPERTIES OF THE FOOD
Physiological properties of food such as nutritional effects, food safety and sensory
properties such as taste, smell and appearance affect individual's food choice decision
processes (Traill, 1999). As suggested above, there is an interactive effect between the
major factors, as examined in the following sections.
2.3.3 PERSON-RELATED FACTORS
Traill (1999) describes person-related factors that include lifestyles, value systems,
quality perceptions and environmental consciousness. In addition, biological factors are
included such as specific health conditions or dietary needs. Examples of these include
weight, cholesterol and food allergies concerns. Also, psychological concerns are
included such as ethics and attitudes to the food production method such as animal
husbandry. Other issues are addressed which include socio-demographics such as
education level and family composition.
Individual factors provide the key to purchase decisions when environmental or food
property factors were perceived to be the same (Traill, 1999). When a product of
universal attributes is sold under a similar price range and market conditions, personal
and individual factors often become the most influential. Termed another way, individual
factors become the final gatekeeper for food choice and purchase decision.
2.3.3.1 PROPERTIES OF FOOD IN PERSON-RELATED FACTORS
Physical product characteristics are the most important factors for guiding food choice.
Some attributes are more generic such as taste and price. Other attributes are more
21
product-specific such as meat fat content (Traill, 1999). Appendix A illustrates the
relative importance consumers place across different countries on various product
attributes.
However, consumers don't purchase foods for single item attributes per se but for
personal or environmental consequences (Traill, 1999). For example, eating non-fattening
foods may assist in weight loss or a ready-to-cook food may save time. These
consequences were found to notably influence product selection. The contributing
components may include security, family values, fun, enjoyment and social recognition
(Traill, 1999). The weight of these values varies across personal factors and
environmental background
Consumers' quality perception also influences food selection process. The majority of
Australian consumers have a preference for high quality household goods and services
and this is also true of food products (Zeitner, 2000). Since the focal point ofmany foods,
especially organic, is on quality, this consideration is an imperative for consumer
decision-making. However, the inference of quality is subjective and prone to distortion
by personal variables. These variables include product experiences, education levels,
perceived quality risks and quality consciousness in addition to situational aspects such as
usage goals, physical surroundings and time pressures (Kyriakopoulos & Ophuis, 1997).
Quality perception alone may not trigger consumers' purchase behaviour. Perceived
value may play a more important role in consumer purchase decision as it combines with
quality perception the factors of cost, income constraints, and other personal traits such as
attitudes (Stokes cited in Kyriakopoulos & Ophuis, 1997).
2.3.3.2 SENSORY PERCEPTION WITH PERSON RELATED ANDENVIRONMENTAL FACTORS
Sensory perception of food attributes is susceptible to personal differences resulting from
the various psychological and marketing factors. Sensory elements may be linked to
22
factors such as brand names, labels, texture and colour. These elements can influence and
trigger purchasing behaviour if viewed positively. Positive sensory appearance may
trigger an elevated evaluation of the product, leading to a higher quality perception and
this may ultimately make the product more desirable for purchase.
2.3.4 DEMOGRAPHICS IN INTERACTION WITH FOOD ATTRIBUTES
Among many demographic elements, income-related factors such as budget constraint
may strongly influence and moderate purchase intentions. The moderation process
happens in that once a food's quality is perceived the perception is justified against the
price before purchasing. For example, someone who thinks a certain brand offers only
supreme quality food products may consider paying high price premiums attached to the
brand lines.
Further, because customers rarely remember prices, they encode them as 'expensive' or
'cheap' (Kyriakopoulos & Ophuis, 1997). Thus the price factor would moderate purchase
intention through simplified encoding into a bimodal perceived price. External cues such
as coupons, private labels, brand name and cents-off offer creates information to simplify
a consumer's cognitive evaluation of value (Kyriakopoulos & Ophuis, 1997).
2.3.5 PERSONAL HEIRACHY OF NEEDS IN INTERACTION WITH
ECONOMIC AND CULTURAL FACTORS
In a study undertaken in USA, it was found that food-related price and convenience
concerns were highest among younger consumers and people with lower incomes (Glantz
et ai, 1998). Nevertheless, populations in affluent western cultures are more likely to be
driven by higher order needs having means to make more intelligent food choices.
Maslow's hierarchy of needs attempts to explain that individuals have needs that are
satisfied in a sequential way. The lower order physiological needs ofmeeting hunger and
23
thirst have to be initially satisfied. Once satisfied, safety needs are addressed which
includes factors such as security and protection. The process continues through the
hierarchy to higher order needs till a person reaches the self-actualisation stage.
The implications for marketers, from a consumer perspective, are that lower order needs
must be met before higher order needs are considered. Further, as consumers advance
through the hierarchy higher order needs need to be taken into account. In general, in
Australia and other western countries, lower order needs are seen to be largely met and
thus the focus is on attending to higher order needs. For example, someone trying to
make ends meet in developing countries may not spend more money to support
environmental causes. However, those who wish to satisfy a self-actualisation need
through supporting a cause such as animal welfare in affluent western countries may be
willing to pay more in order to fulfil their ideological ethical needs.
Food producers should not neglect the fact that the satisfaction of some of the lower
hierarchy needs is often the prerequisite for achieving higher order needs fulfilment.
Adding ingredients or attributes which satisfy higher order needs to the types of food that
conventionally satisfy lower hierarchy needs is likely to attract increased purchases.
Having placed this study with the context of some of the available literature the
subsequent chapter will consider the research methodology used.
24
CHAPTER 3 - RESEARCH METHODOLOGY
3.1 INTRODUCTION
This chapter outlines the research approach used in this study. It includes a full account
on the choice of research techniques and the data collection method employed. The data
analysis techniques used are also described. A systematic approach to researching the
demographic variables of olive oil consumers will help ensure that the results are reliable
and valid. The importance of reliable and valid results will also be briefly elucidated.
In this particular study information regarding the influence of age, gender, income and
educational levels on the purchase of olive oil within the Durban region was investigated.
Essentially the dilemma facing the researcher concerned the establishment of these
various demographic variables and their influence on the actual purchase decision of
olive oil. In order to be researchable the problem had to be either subject to observation
or to empirical data collection. This study took the approach of collecting primary data
which will be discussed in further detail within this chapter whilst the analysis of the data
will be done in chapter 4.
The exploration of the problem is accomplished through familiarisation with the available
literature, interviews with experts, focus groups or so some combination. The previous
chapter of this study attempted to provide more insight into the broader socio-economic
factors as well as the more detailed psychological consumer background that forms the
context of this particular research methodology and approach.
This particular study also undertook a sampling approach and a brief discussion in the
construction of the research technique used will also be done. Most researchers undertake
sampling studies because of an interest in estimating population values or testing a
statistical hypothesis. Carefully constructed delimitation's are essential for specifying an
appropriate probability sample (Cooper & Schindler, 2001). These issues will be
25
discussed in this chapter III order to provide a contextual understanding of the
methodology of this study.
3.2 SECONDARY DATA
Research for this study, began with the exploration of secondary data. Marketing
managers often use secondary data because previously collected information can benefit
marketing managers and researchers in a number of ways such as availability of data
from a wider variety of sources, lower costs in gathering the information and the fact that
it can be gathered in a short period of time. Having reviewed the existing information in
the context of its ability to address the objectives of the study, it was evident that the
literature available provided broad parameters that were able to guide the theory of the
investigative questions yet did not fully address the questions itself within the
geographical region of Durban. Thus it became necessary that primary data had to be
used for this particular study.
3.3 SAMPLING
The sampling process can make the sampling experience less complex. The first step is to
define the target population. The second step is to identify the sampling frame followed
by choosing the sampling method, determining the sample size and finally gathering the
data from the proper sample.
3.3.1 POPULATION
A population is the aggregate of all elements. A population is defined in terms of
elements, sample units, time and size. ill this study the population refers to both current
edible oil consumers and potential edible oil consumers within the Durban area. The
survey was conducted between the 19th ofMay 2003 and the 30th June 2003.
26
3.3.2 SAMPLING DESIGN
There are two major categories in which all methods of sampling may be included. They
are probability and non-probability sampling. In probability sampling every member of
the target population has a known and non-zero chance of being included in the sample.
Each sample element was chosen by chance and the chance was known for each element
being selected. The chance for each sample to be selected is not necessarily equa1. Non
probability sampling is when the researchers personal judgement dominates selecting the
sample elements. With a subjective approach like nonprobability sampling, the
probability of selecting population elements is unknown.
Although preference would have been given to utilising the somew~~=ViVr__:~'iI\"\lO.rGt71o
superior statistical techniques such as probability sampling methods of clu~~~~le~~\\;\r.;JCH'\iIS"\IJ,,~.this would have proven beyond the time and resource constraints of the researcher. In I
S" '!"'..~\~lri%~.¥t'~""lN\ £:~'i\.'''~'''·~·'''"''1cognizance of these constraints, a convenience sampling was condueted.
I~~~~';\ of:~t~e;~me'~:~;::ur~::~~:~int':;~~~~~~~;Zsoften conduct convenience
sampling with sample items that are either close at hand or otherwise easy to obtain. The
disadvantage is that it is the least reliable design. Researchers or field workers have the
freedom to choose whomever they find, thus the name convenience. Examples include
informal pools of friends and neighbours, using employees to evaluate the taste of a new
snack or "man-on-the street" intercept interviews. While a convenience sample has no
precision, it may still be a useful procedure. In the early stages of exploratory research,
when you are seeking guidance, you might use this approach. Because this study is the
first exploratory study with these particular objectives it was an added reason to consider
using convenience sampling to essentially form the foundation for more a more detailed
subsequent study. It is possible that the results from a convenience sampling method may
present evidence that is so overwhelming that a more sophisticated sampling procedure
may be unnecessary.
27
3.3.3 SAMPLE SIZE
The determination of the correct sample size from a population is an important and
practical problem in a sampling study. If the sample size is too large, more money and
time will be spent than is really necessary, but the result obtained from the large sample
may not necessarily be more accurate than that from a smaller sample. On the other hand
if the sample size is too small the study may not reach a valid conclusion. It is therefore
important to realise that the more elements that are properly sampled from the population
the less the sampling error (Shao, 2002). In this study 100 consumers from various
shopping malls were approached and asked to fill in a self administered questionnaire.
3.3.4 DATA COLLECTION
With data collection who generates the data is not as important as what is gathered.
Mechanical data collection can be performed through a variety of devices such as video
recorders, scanners and turnstiles. The bulk of mechanical data collection will be
performed through either computer technology and telephone lines. Because data
collection can be costly, tedious and time consuming this particular study chose a less
resource demanding approach of the mall intercept method. Other methods of primary
data collection that were considered included personal interviews; telephone surveys and
mail surveys. However having weighed the pros and cons of each of these methods and
matching them to the resources at the researchers disposal it was evident that the most
appropriate method that will adequately address the research investigative questions was
the use of the mall intercept survey method where the survey is self administered.
3.3.4.1 MALL INTERCEPT METHOD
Large shopping malls are ideal places to interview people. The considerable traffic flow
ofmalls with many different types of consumers can help facilitate the capturing of a
large sample. In this study young, energetic individuals were positioned in various malls
across Durban. The shoppers were intercepted and asked to answer a self-administered
28
survey at a nearby desk that was set up. In concept the mall intercept method can make a
lot of sense. However, in practice, there are major shortcomings to this method.
• Low response rates. People typically come to malls to shop, not to answer
questions that that they view as time consuming and an intrusion on their
privacy. However, in this particular study a response rate of lOO % was
obtained.
• Suspect data. Malls tend to draw from a relatively small area and thus may
not be representative of the target population. The sample is also influenced
by the stores immediately surrounding the location of the interviewer. Upscale
stores typically- draw high income people and discount stores a higher
percentage of lower income people, both of which can bias the sample. Thus
since the intention of the surveys was to sample consumers from a wide
variety of income levels, interviewers roamed the mall to increase the
likelihood of obtaining a more representative mix of consumers.
• Possible respondent selection bias. Respondents were chosen by the
interviewers who may have been less qualified to make this important
decision.
• Crowded, loud place. This can make malls somewhat less than optimum
places to conduct serious marketing research.
29

3.3.5 QUESTIONNAIRE DESIGN
In designing the questionnaire it was important to ensure that it answered the research
objectives. When the questionnaire was designed, several goals were kept in mind:
1. Questions should be user-friendly. The easier the questionnaire is to understand
the more likely it is that respondents will complete it.
2. The questionnaire should look professional.
3. It should be valid. The questionnaire should answer what it is supposed to
measure.
4. It should be attractive and motivational in nature.
5. The questionnaire should encourage respondents to answer honestly and
accurately.
6. The questionnaire should be short and simple. Considering that the participants in
this study were shopping this aspect was critical in the design of the
questionnaire.
3.3.6 QUESTIONNAIRE CONSTRUCTION
The questionnaire consisted of 18 questions in four sections pertaining to consumer
demographics, perceptions, attitudes and motives underlying the purchase of olive oil.
The questionnaire utilized in this study is available in Appendix A. Two types of
measurement scales were used namely Multiple Choice Multiple Response Scale
(Sections A,B,C) and Likert Scale (Section D).
The questionnaire consists of four sections. Section A comprises of questions 1-6.
Questions 1,2 : Considers the awareness of the consumer to determine the level of
exposure to the different types of edible oils.
30
Questions 3-6: Deals with demographic characteristics of both buyers and non-buyers of
olive oil
Section B comprises question 7 and 8 which investigate the reasons for non-purchase of
olive oil as well as the major influencing factor that would effect a purchase of olive oil.
By understanding the reasons for non-purchase as well as the factors that influence a
purchase will effectively mean that olive oil can be positioned in a way that will draw this
market from non purchaser to trial purchasers to regular consumers.
Section C comprises question 9 to 11 which investigates the types of olive oil
purchased, the motives for purchase and possible negative aspects of olive oil purchase.
An understanding of these factors will help understand which consumers (in terms of
demographic profiles) are more likely to purchase which types of olive oil and their
motives for that purchase. An understanding of these factors will have practical relevance
in the distribution and promotion strategies of olive oil in the Durban area.
Section D comprises questions 12 to 18 which analysed the consumers motivation, risk
perceptions, exposure, memory recall, attention and availability. The measurement scale
that was used was the Likert Scale.
Question 12: Availability of olive oil- affects the opportunity to purchase and has
implications for the distribution network of olive oil.
Question 13: Evaluates the amount of information that the consumer perceives is
necessary before he/she engages in a purchase. When a consumer makes an effort to
understand the types of olive oil etc it indicates that that consumer is more motivated to
make the purchase.
Question 14: Risk perception: Marketers need to ensure that the consumers risk
perception ofolive oil purchase is reduced or eliminated.
31
Question 15: Advert exposure: it become necessary to increase exposure of olive oil
benefits to increase its purchase.
Question 16: Memory recall and attention: tests the effectiveness of olive oil adverts.
Question 17: Motivation and personal Relevance: the personal relevance of the health
benefits of olive oil will affect its purchase. For example it may provide some indication
of how much emphasis should be placed on the health aspects of olive oil.
Question 18: Olive oil colour: Perception through vision - may indicate the role that the
colour of the product has on its purchase. Has implications for the packaging of the olive
oil.
3.3.7 PRE-TEST QUESTIONNAIRE
Regardless of the experience and the expertise of the questionnaire's designer,
individuals who were not involved in its design should test that it communicates clearly
and correctly. The designers can become too familiar with the questionnaire; that they
may not see the forest from the trees. Protesting involves a trial run of the questionnaire
using a small sample from the target population to detect any problems. The goal would
be to affirm that the questionnaire will capture the information required by the researcher.
The pre-test helps refine the instrument and identifies errors that may be apparent only to
the targeted population. Sometimes pre-testing can be a very humbling experience,
because weaknesses previously overlooked become glaringly apparent. Unfortunately,
though, while the pre-test questionnaire often identifies fundamental problems in a
questionnaire, it is the stage most likely to be squeezed out because of cost and time
constraints (Shao, 2002).
In this study the questionnaire was pre-tested with 10 participants before the actual study
took place. During this phase certain 'problem' questions were identified. Most of these
were either double -barreled, ambiguous questions or leading questions. For example
32
during the pretest, question 16 was initially worded as "It is easy to recall olive oil" and
this was interpreted by some of the pretest sample as meaning that it is easy for
distributors to recall olive oil products from the supermarket shelves. Therefore to rectify
the ambiguity of the question it was reworded as "It is easy to recall from memory olive
oil adverts". This process of refinement was conducted for all identified ambiguous,
double barreled questions and appropriately reworded to address the research objectives.
3.3.8 RELIABILITY AND VALIDITY
When measuring something researchers must use a reliable scale. Reliability refers to the
ability of a scale to produce consistent results if repeated measurements are taken.
Reliability is the extent to which scales are free of random error and thus produce
consistent results. In most marketing situations reliability is not absolute. Reliability can
be assessed by the test-retest method where subjects are measured at two different times
and under similar conditions to determine the reliability of the scores. The results indicate
the extent to which the scores are reliable. The smaller the difference between scores the
higher the reliability (Shao, 2002). The method used in this study was the Cronbach
coefficient alpha method which basically averages the possible ways of splitting the test
items and determines the degree of correlation. The Cronbach coefficient alpha method
was used for multi-item scales at the internal level of measurement. The Cronbach
coefficient alpha method was used to assess internal consistency for Section A, Band C
of the survey. The Reliability Coefficent Alpha obtained for all three sections indicated a
high degree of internal consistency amongst the items in each section.
• Section A - Questions 1 to 6 - produced a high reliability of 0.7509
• Section B - Question 7 to 8 - produced a high reliability of 0.951 0
• Section C - Questions 9 to 11 - produced a high reliability of 0.8621
As for validity, a face validity referring to professional agreement that confirms a scale's
content logically appears to accurately reflect what, was intended to be measured was
implemented.
33
CHAPTER 4: EVALUATION OF DATA ANALYSIS AND FINDINGS
4.1 INTRODUCTION
After collecting the data it was necessary to edit each piece of information received.
Editing involves carefully checking survey data for completeness, legibility, consistency
and accuracy. The most important purpose of editing is to eliminate or at least reduce the
number of errors in the raw survey data. Two forms of data can exist in raw survey data:
interviewer error and respondent error. Both ofthese types of errors were checked for in
the raw data and the necessary amendments effected.
After editing the data it was then coded so that it could be analysed by a PC-based
statistical analysis programme, Statistical Package for the Social Sciences (SPSS)
Release 11.5. Coding is the process of systematically and consistently assigning each
response a numerical score. In coding the data it was necessary to ensure that the coding
categories were mutually exclusive and collectively exhaustive.
The next step was to tabulate the data. The primary use of tabulation was to determine the
empirical distribution of the variables in question and to calculate the descriptive
statistics. A frequency distribution simply reports the number of responses that each
question received.
Frequency distribution tables are used in subsection 4.2 to illustrate the demographic
aspects of the respondents participating in this particular study.
4.2 RESPONDENTS DEMOGRAPHICS
Before a detailed analysis of the respondents is conducted in the context of the actual
purchase decision of olive oil or not it is necessary to first consider the broader
demographic overview of the respondents that participated in this study. The
demographics aspects that will be considered will be determined by the research
34
objectives of the study and therefore will involve specifically the gender, age, educational
and income levels ofthe respondents
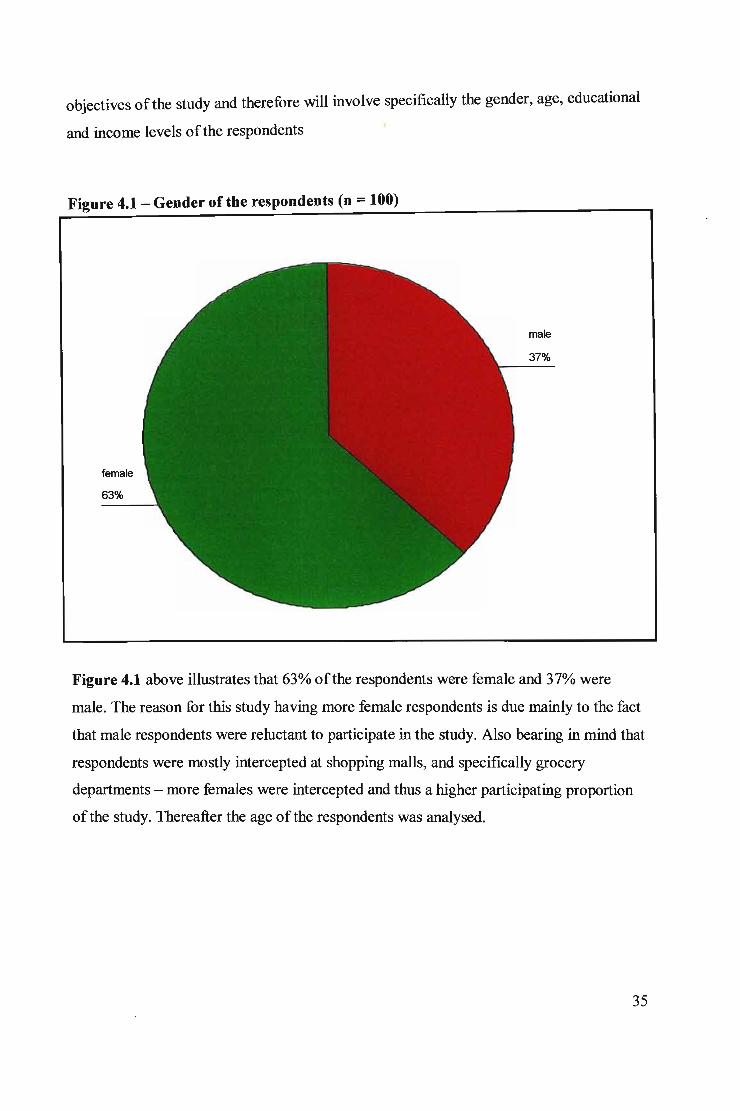
Figure 4.1 - Gender of the respondents (n = 100)
female
63%
male
37%
Figure 4.1 above illustrates that 63% ofthe respondents were female and 37% were
male. The reason for this study having more female respondents is due mainly to the fact
that male respondents were reluctant to participate in the study. Also bearing in mind that
respondents were mostly intercepted at shopping malls, and specifically grocery
departments - more females were intercepted and thus a higher participating proportion
of the study. Thereafter the age of the respondents was analysed.
35
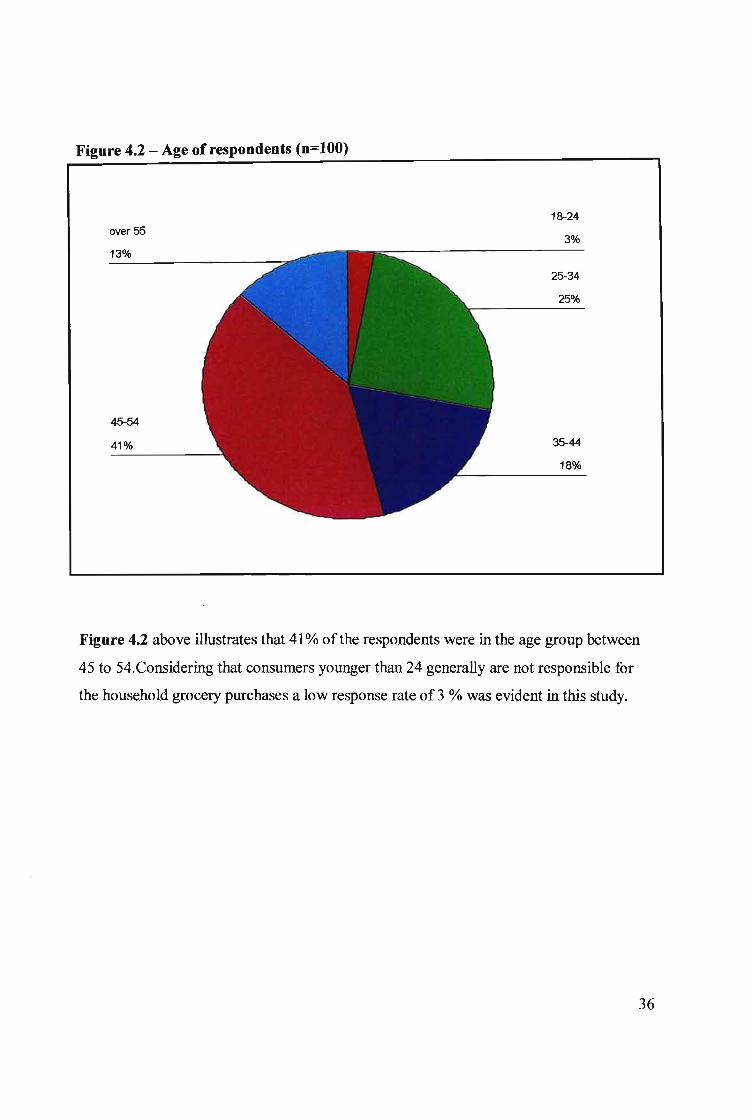
Figure 4.2 - Age ofrespoodeots (0=100)
over 55
13%
45-54
41%
18-24
3%
25-34
25%
35-44
18%
Figure 4.2 above illustrates that 41% ofthe respondents were in the age group between
45 to 54.Considering that consumers younger than 24 generally are not responsible for
the household grocery purchases a low response rate of3 % was evident in this study.
36
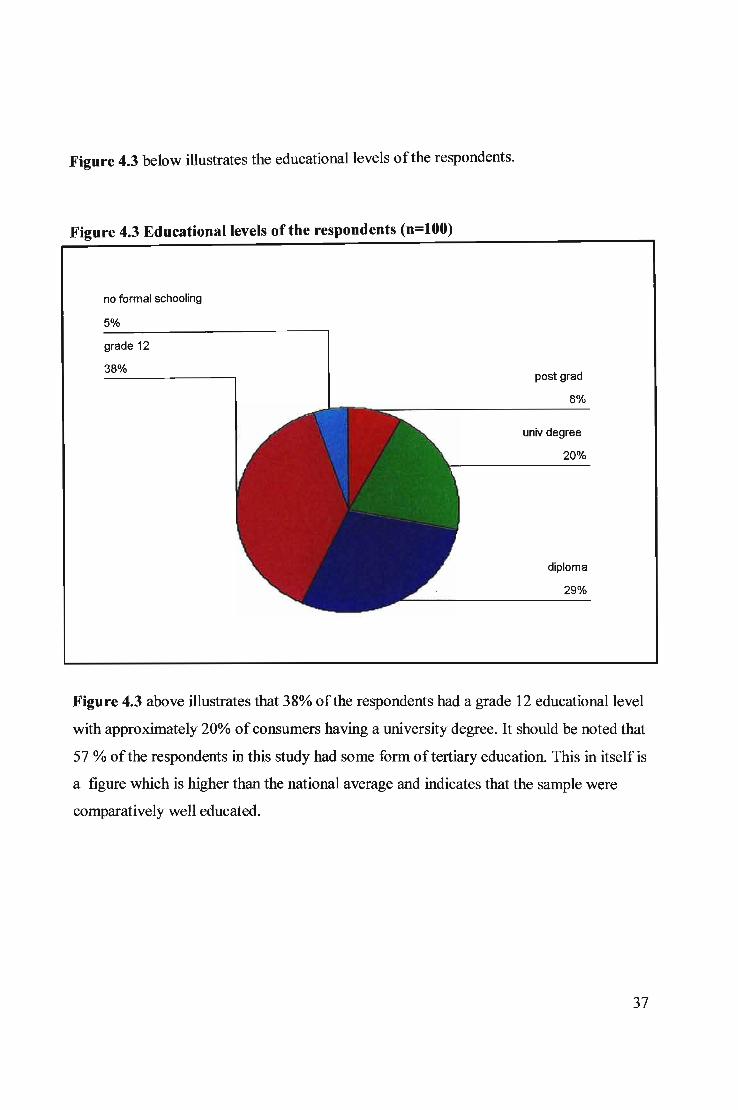
Figure 4.3 below illustrates the educational levels ofthe respondents.
Figure 4.3 Educational levels of the respondents (n=100)
no formal schooling
5%
grade 12
38%post grad
8%
univ degree
20%
diploma
29%
Figure 4.3 abov~ illustrates that 38% ofthe respondents had a grade 12 educational level
with approximately 20% ofconsumers having a university degree. It should be noted that
57 % ofthe respondents in this study had some form oftertiary education. This in itself is
a figure which is higher than the national average and indicates that the sample were
comparatively well educated.
37
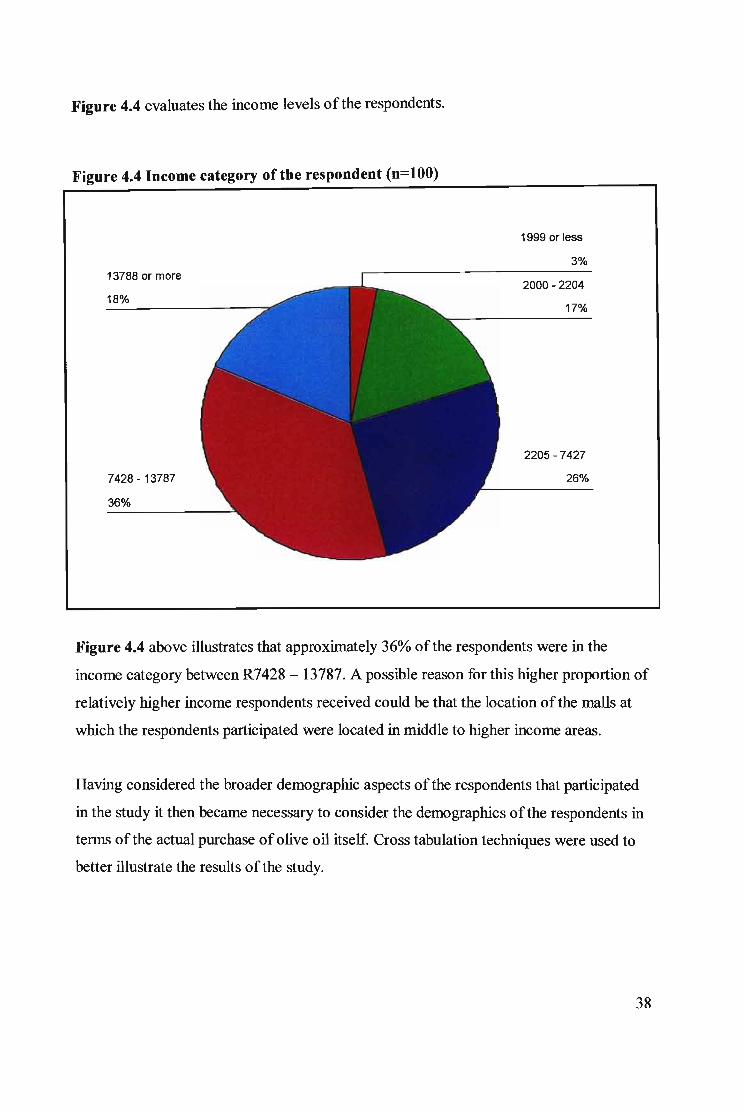
Figure 4.4 evaluates the income levels of the respondents.
Figure 4.4 Income category of the respondent (n=100)
1999 or less
3%13788 or more
18%
7428 - 13787
36%
2000 - 2204
17%
2205 -7427
26%
Figure 4.4 above illustrates that approximately 36% ofthe respondents were in the
income category between R7428 - 13787. A possible reason for this higher proportion of
relatively higher income respondents received could be that the location of the malls at
which the respondents participated were located in middle to higher income areas.
Having considered the broader demographic aspects of the respondents that participated
in the study it then became necessary to consider the demographics ofthe respondents in
terms of the actual purchase ofolive oil itself. Cross tabulation techniques were used to
better illustrate the results of the study.
38
4.3 CROSS TABULATION RESULTS OF RESPONDENTS
Cross tabulations were used to inspect the relationships between nominally scaled
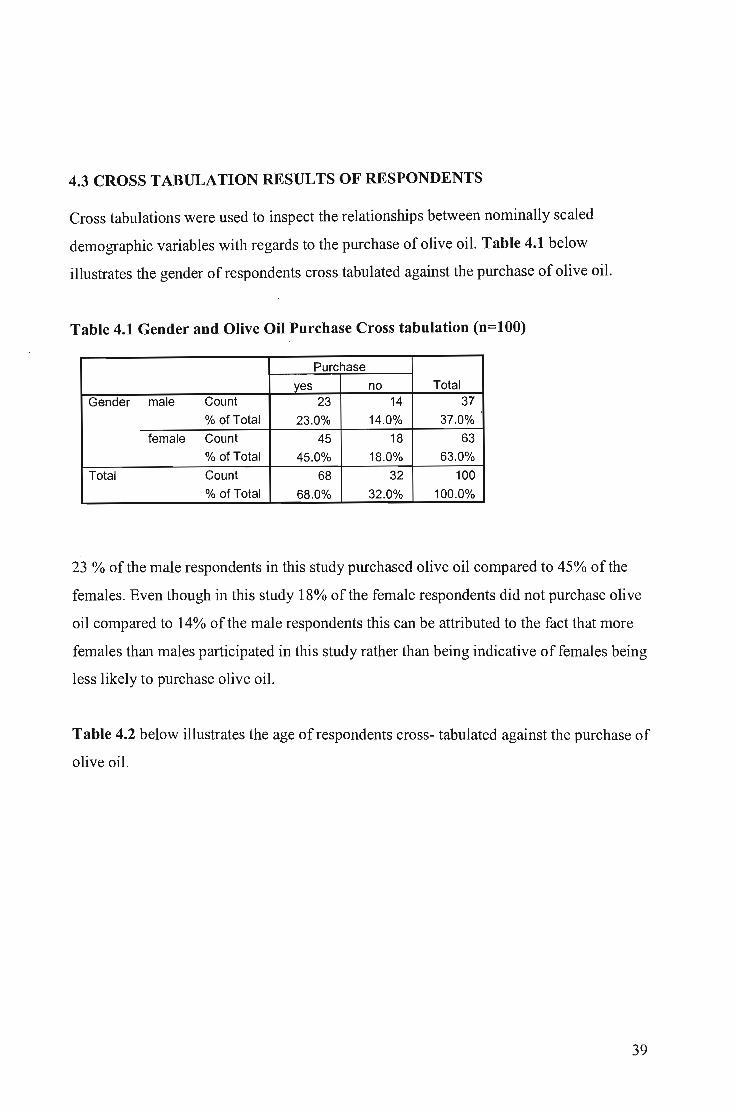
demographic variables with regards to the purchase of olive oil. Table 4.1 below
illustrates the gender of respondents cross tabulated against the purchase of olive oil.
Table 4.1 Gender and Olive Oil Purchase Cross tabulation (n=100)
Purchase
yes no TotalGender male Count 23 14 37 ,
% of Total 23.0% 14.0% 37.0%female Count 45 18 63
% of Total 45.0% 18.0% 63.0%Total Count 68 32 100
% ofTotal 68.0% 32.0% 100.0%
23 % of the male respondents in this study purchased olive oil compared to 45% of the
females. Even though in this study 18% of the female respondents did not purchase olive
oil compared to 14% of the male respondents this can be attributed to the fact that more
females than males participated in this study rather than being indicative of females being
less likely to purchase olive oil.
Table 4.2 below illustrates the age of respondents cross- tabulated against the purchase of
olive oil.
39
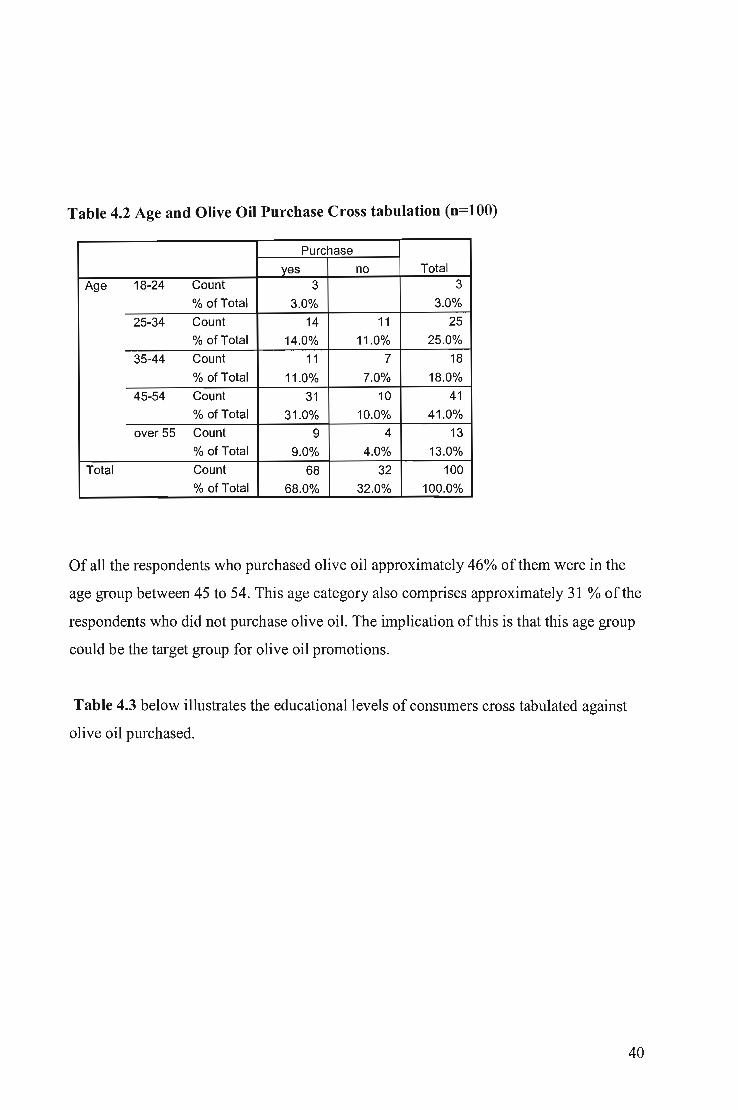
Table 4.2 Age and Olive Oil Purchase Cross tabulation (n=100)
Purchase
yes no TotalAge 18-24 Count 3 3
% of Total 3.0% 3.0%
25-34 Count 14 11 25
% of Total 14.0% 11.0% 25.0%
35-44 Count 11 7 18
% of Total 11.0% 7.0% 18.0%45-54 Count 31 10 41
% of Total 31.0% 10.0% 41.0%over 55 Count 9 4 13
% of Total 9.0% 4.0% 13.0%Total Count 68 32 100
% of Total 68.0% 32.0% 100.0%
Of all the respondents who purchased olive oil approximately 46% ofthem were in the
age group between 45 to 54. This age category also comprises approximately 31 % ofthe
respondents who did not purchase olive oil. The implication of this is that this age group
could be the target group for olive oil promotions.
Table 4.3 below illustrates the educational levels of consumers cross tabulated against
olive oil purchased.
40
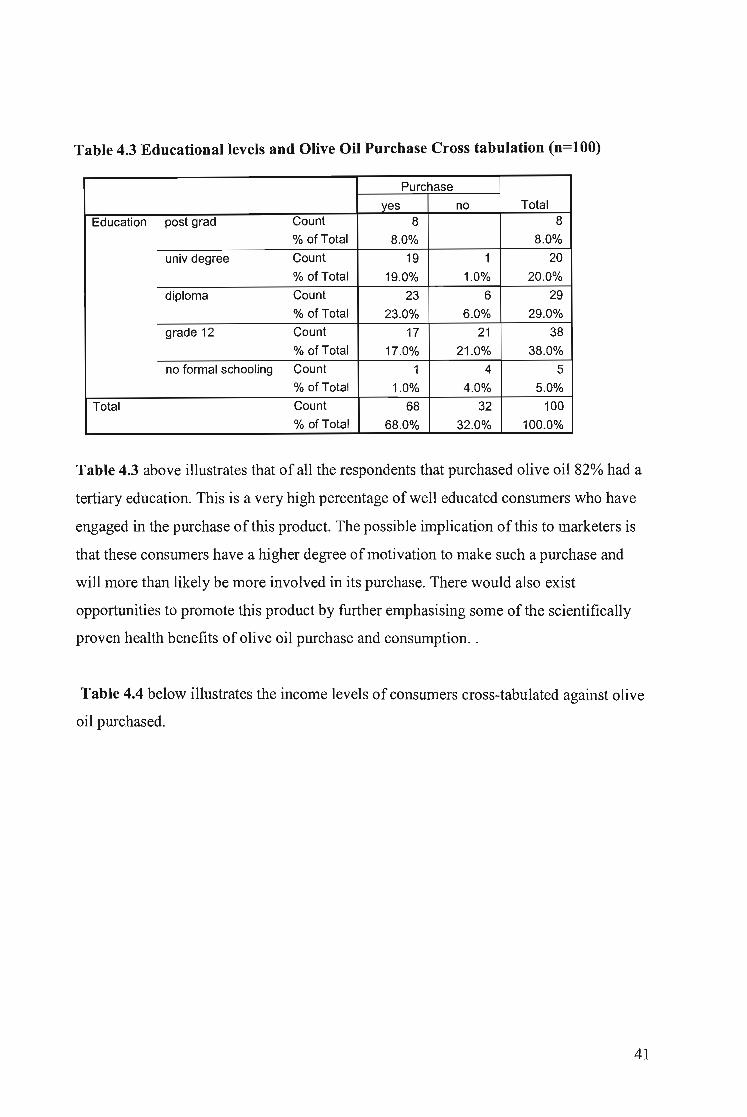
Table 4.3 Educational levels and Olive Oil Purchase Cross tabulation (n=100)
Purchase
yes no TotalEducation post grad Count 8 8
% of Total 8.0% 8.0%
univ degree Count 19 1 20
% of Total 19.0% 1.0% 20.0%
diploma Count 23 6 29
% of Total 23.0% 6.0% 29.0%
grade 12 Count 17 21 38% of Total 17.0% 21.0% 38.0%
no formal schooling Count 1 4 5% of Total 1.0% 4.0% 5.0%
Total Count 68 32 100% of Total 68.0% 32.0% 100.0%
Table 4.3 above illustrates that of all the respondents that purchased olive oil 82% had a
tertiary education. This is a very high percentage of well educated consumers who have
engaged in the purchase of this product. The possible implication of this to marketers is
that these consumers have a higher degree ofmotivation to make such a purchase and
will more than likely be more involved in its purchase. There would also exist
opportunities to promote this product by further emphasising some ofthe scientifically
proven health benefits of olive oil purchase and consumption..
Table 4.4 below illustrates the income levels of consumers cross-tabulated against olive
oil purchased.
41
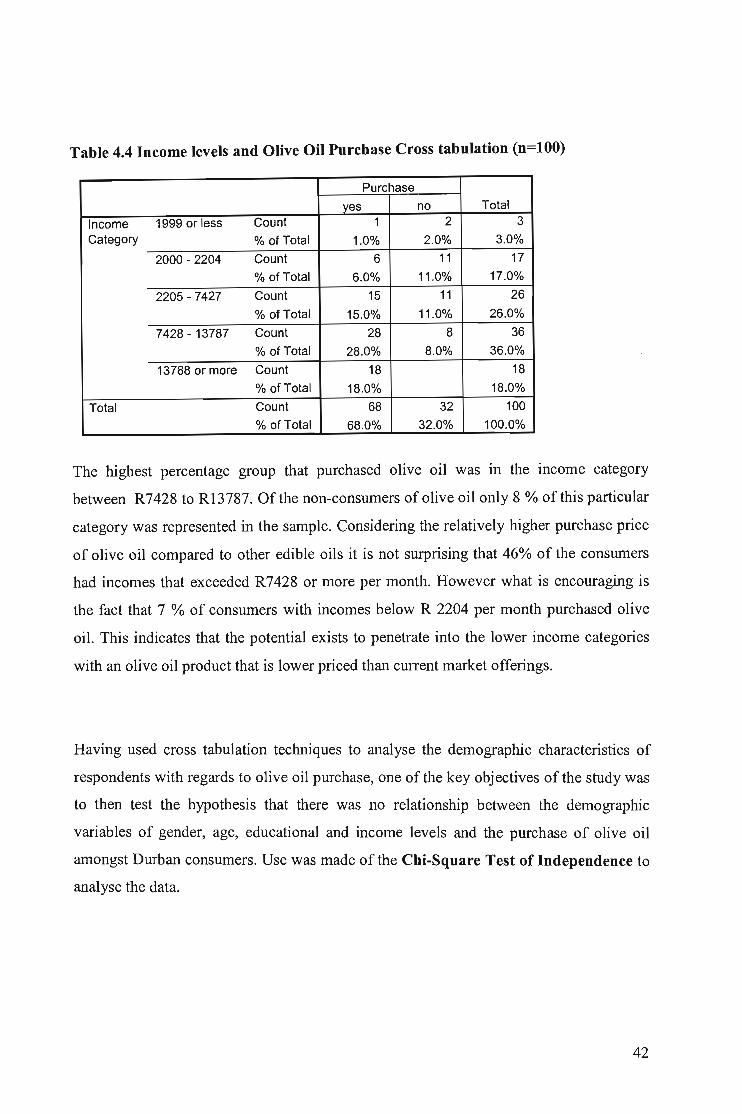
Table 4.4 Income levels and Olive Oil Purchase Cross tabulation (n=100)
Purchase
yes no TotalIncome 1999 or less Count 1 2 3Category % of Total 1.0% 2.0% 3.0%
2000 - 2204 Count 6 11 17% of Total 6.0% 11.0% 17.0%
2205 - 7427 Count 15 11 26
% of Total 15.0% 11.0% 26.0%
7428 - 13787 Count 28 8 36% of Total 28.0% 8.0% 36.0%
13788 or more Count 18 18% of Total 18.0% 18.0%
Total Count 68 32 100% of Total 68.0% 32.0% 100.0%
The highest percentage group that purchased olive oil was in the income category
between R7428 to R13787. Of the non-consumers of olive oil only 8 % of this particular
category was represented in the sample. Considering the relatively higher purchase price
of olive oil compared to other edible oils it is not surprising that 46% of the consumers
had incomes that exceeded R7428 or more per month. However what is encouraging is
the fact that 7 % of consumers with incomes below R 2204 per month purchased olive
oil. This indicates that the potential exists to penetrate into the lower income categories
with an olive oil product that is lower priced than current market offerings.
Having used cross tabulation techniques to analyse the demographic characteristics of
respondents with regards to olive oil purchase, one of the key objectives of the study was
to then test the hypothesis that there was no relationship between the demographic
variables of gender, age, educational and income levels and the purchase of olive oil
amongst Durban consumers. Use was made of the Chi-Square Test of Independence to
analyse the data.
42
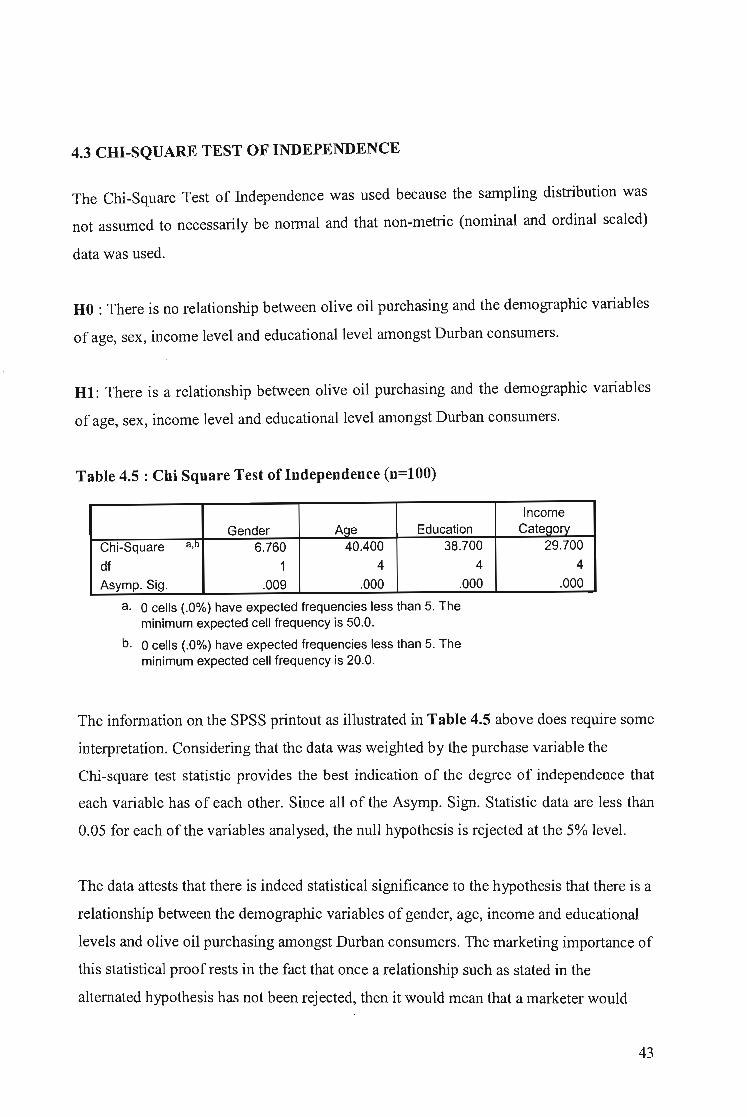
4.3 CHI-SQUARE TEST OF INDEPENDENCE
The Chi-Square Test of Independence was used because the sampling distribution was
not assumed to necessarily be normal and that non-metric (nominal and ordinal scaled)
data was used.
HO : There is no relationship between olive oil purchasing and the demographic variables
of age, sex, income level and educational level amongst Durban consumers.
Ht: There is a relationship between olive oil purchasing and the demographic variables
of age, sex, income level and educational level amongst Durban consumers.
Table 4.5 : Chi Square Test of Independence (n=100)
IncomeGender Aae Education Cateqorv
Chi-Square a,D 6.760 40.400 38.700 29.700
df 1 4 4 4Asymp. Sig. .009 .000 .000 .000
a. 0 cells (.0%) have expected frequencies less than 5. Theminimum expected cell frequency is 50.0.
b. 0 cells (.0%) have expected frequencies less than 5. Theminimum expected cell frequency is 20.0.
The information on the SPSS printout as illustrated in Table 4.5 above does require some
interpretation. Considering that the data was weighted by the purchase variable the
Chi-square test statistic provides the best indication of the degree of independence that
each variable has of each other. Since all of the Asymp. Sign. Statistic data are less than
0.05 for each of the variables analysed, the null hypothesis is rejected at the 5% level.
The data attests that there is indeed statistical significance to the hypothesis that there is a
relationship between the demographic variables of gender, age, income and educational
levels and olive oil purchasing amongst Durban consumers. The marketing importance of
this statistical proof rests in the fact that once a relationship such as stated in the
alternated hypothesis has not been rejected, then it would mean that a marketer would
43
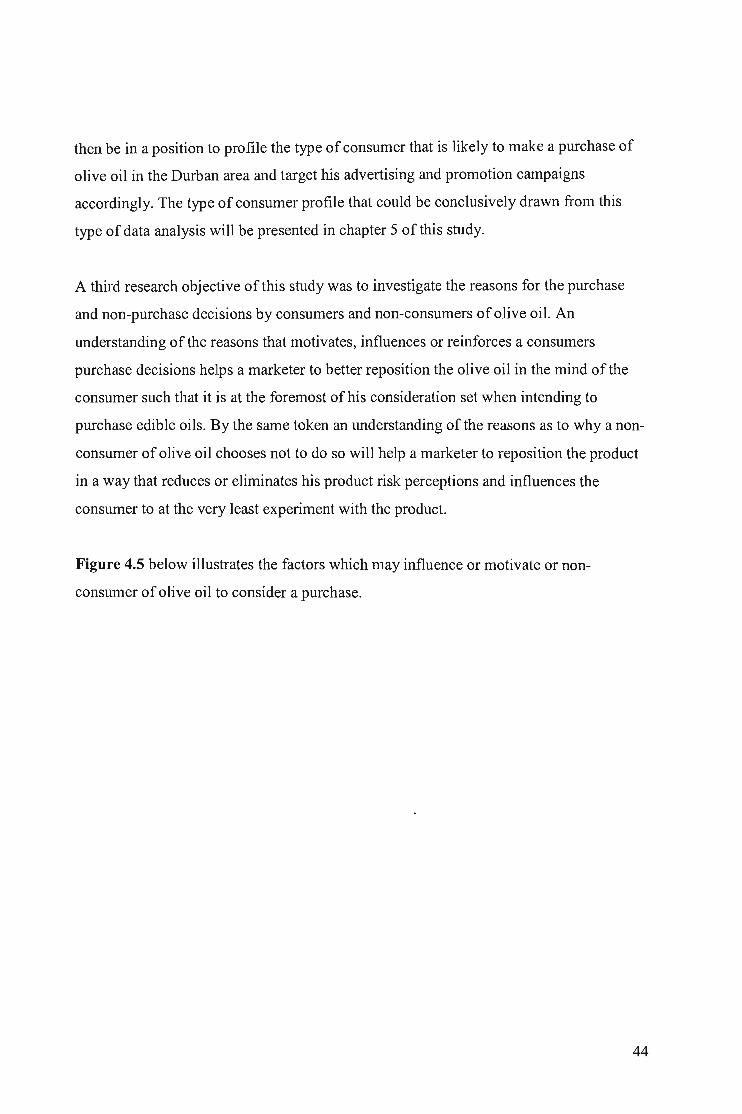
then be in a position to profile the type of consumer that is likely to make a purchase of
olive oil in the Durban area and target his advertising and promotion campaigns
accordingly. The type of consumer profile that could be conclusively drawn from this
type of data analysis will be presented in chapter 5 of this study.
A third research objective of this study was to investigate the reasons for the purchase
and non-purchase decisions by consumers and non-consumers of olive oil. An
understanding of the reasons that motivates, influences or reinforces a consumers
purchase decisions helps a marketer to better reposition the olive oil in the mind of the
consumer such that it is at the foremost of his consideration set when intending to
purchase edible oils. By the same token an understanding of the reasons as to why a non
consumer of olive oil chooses not to do so will help a marketer to reposition the product
in a way that reduces or eliminates his product risk perceptions and influences the
consumer to at the very least experiment with the product.
Figure 4.5 below illustrates the factors which may influence or motivate or non
consumer of olive oil to consider a purchase.
44
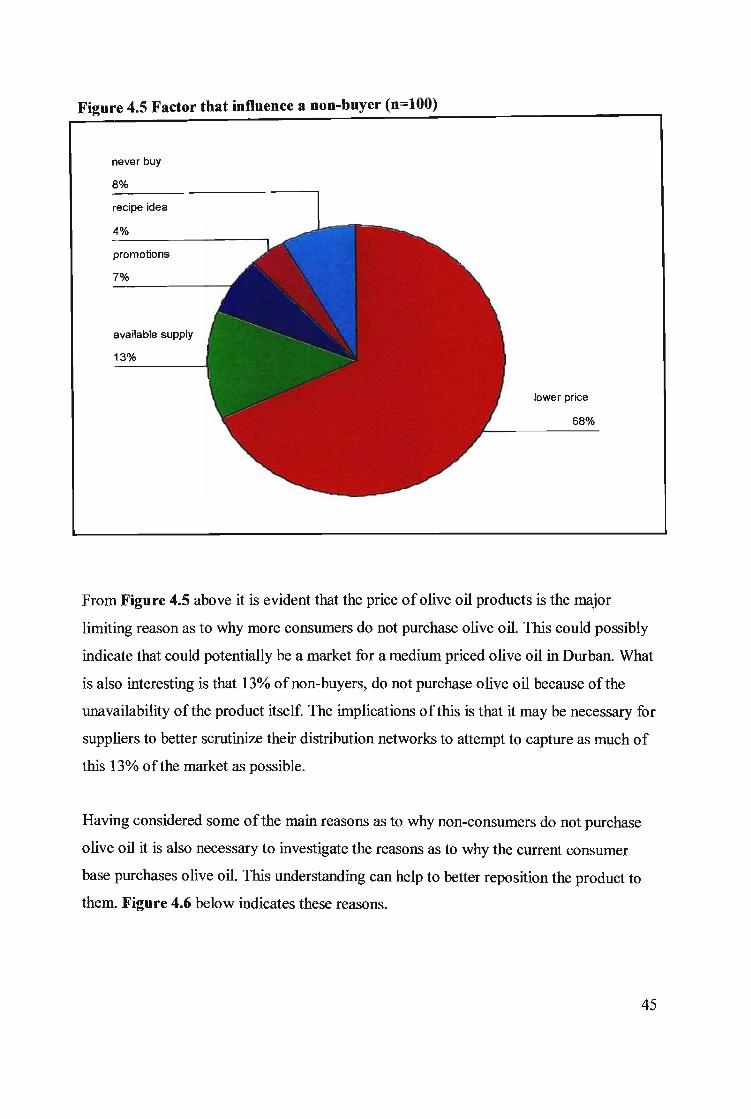
Figure 4.5 Factor that influence a non-buyer (n=100)
never buy
8%
recipe idea
4%
promotions
7%
available supply
13%
lower price
68%
From Figure 4.5 above it is evident that the price ofolive oil products is the major
limiting reason as to why more consumers do not purchase olive oil. This could possibly
indicate that could potentially be a market for a medium priced olive oil in Durban. What
is also interesting is that 13% ofnon-buyers, do not purchase olive oil because ofthe
unavailability of the product itself. The implications ofthis is that it may be necessary for
suppliers to better scrutinize their distribution networks to attempt to capture as much of
this 13% ofthe market as possible.
Having considered some ofthe main reasons as to why non-consumers do not purchase
olive oil it is also necessary to investigate the reasons as to why the current consumer
base purchases olive oil. This understanding can help to better reposition the product to
them. Figure 4.6 below indicates these reasons.
45
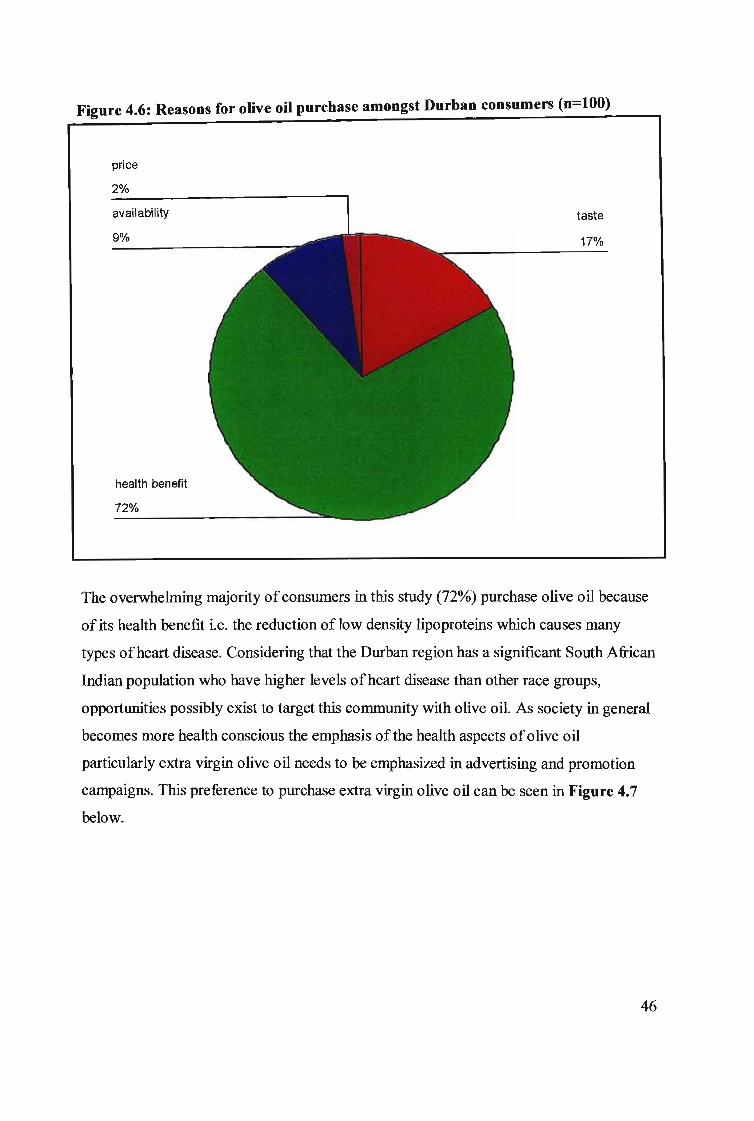
Figure 4.6: Reasons for olive oil purchase amongst Durban consumers (n=100)
price
2%
availability
9%
health benefit
72%
taste
17%
The overwhelming majority ofconsumers in this study (72%) purchase olive oil because
of its health benefit i.e. the reduction of low density lipoproteins which causes many
types ofheart disease. Considering that the Durban region has a significant South African
Indian population who have higher levels ofheart disease than other race groups,
opportunities possibly exist to target this community with olive oil. As society in general
becomes more health conscious the emphasis of the health aspects ofolive oil
particularly extra virgin olive oil needs to be emphasized in advertising and promotion
campaigns. This preference to purchase extra virgin olive oil can be seen in Figure 4.7
below.
46
Figure 4.7 Different type of olive oil purchased in Durban (n=100)
extra light
2%
pure olive
10%
virgin
41%
extra virgin
47%
From Figure 4.7 above it can be seen that 47 % ofthe olive oil consumers in Durban
purchased extra virgin olive oil. All extra virgin olive oils have no more than one percent
acidity and the very fmest olive oils have halfthat amount. The taste of these oils varies
from delicate to pronounced and is determined by which country and region is the
producer and the type ofolives used.
The second most popular olive oil type is virgin olive oil with 41% ofthe olive oil
consumers purchasing it. As with extra virgin olive oil it needs no refining and is only
filtered before being bottled. The usage ofvirgin olive oil for roasting or grilling foods
may be attributable for its higher usage.
47
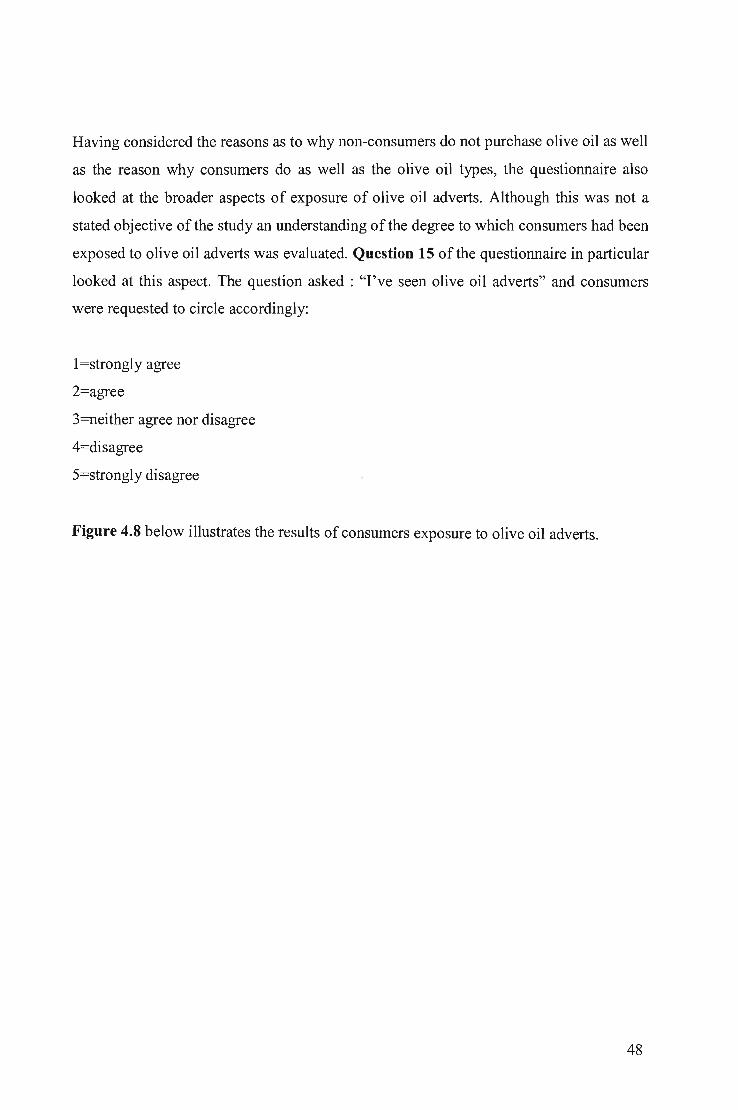
Having considered the reasons as to why non-consumers do not purchase olive oil as well
as the reason why consumers do as well as the olive oil types, the questionnaire also
looked at the broader aspects of exposure of olive oil adverts. Although this was not a
stated objective of the study an understanding of the degree to which consumers had been
exposed to olive oil adverts was evaluated. Question 15 of the questionnaire in particular
looked at this aspect. The question asked: "I've seen olive oil adverts" and consumers
were requested to circle accordingly:
I=strongly agree
2=agree
3=neither agree nor disagree
4=disagree
5=strongly disagree
Figure 4.8 below illustrates the results of consumers exposure to olive oil adverts.
48
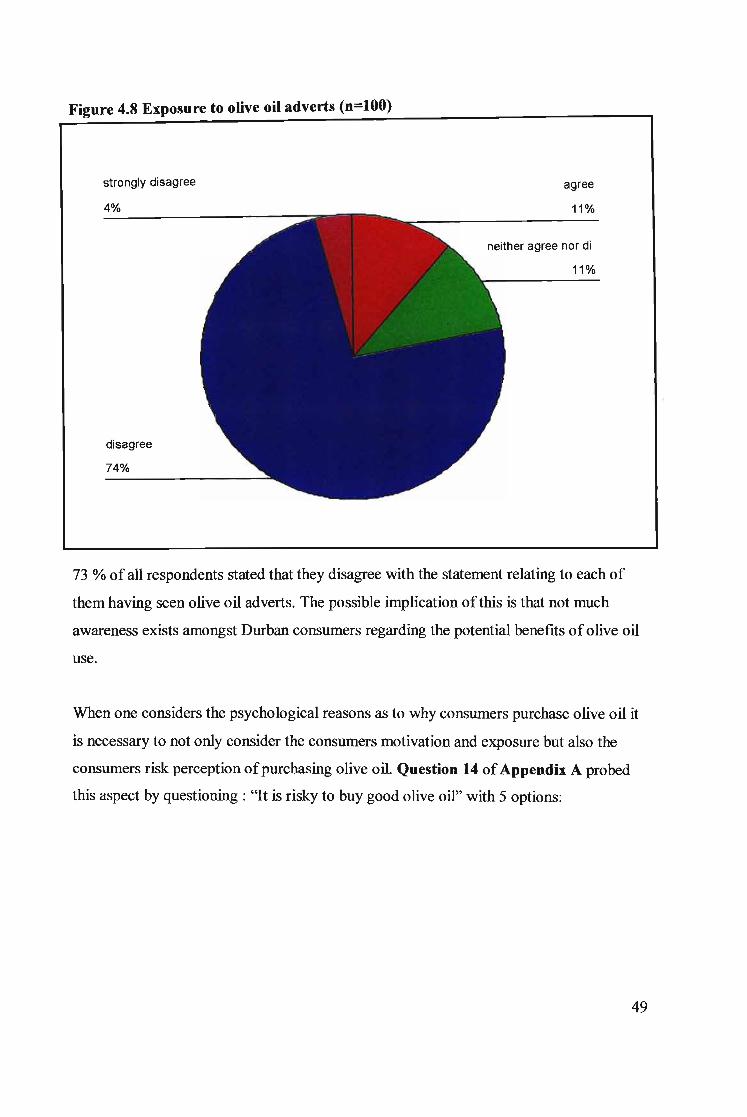
Figure 4.8 Exposure to olive oil adverts (n=100)
strongly disagree
4%
disagree
74%
agree
11%
neither agree nor di
11%
73 % ofall respondents stated that they disagree with the statement relating to each of
them having seen olive oil adverts. The possible implication of this is that not much
awareness exists amongst Durban consumers regarding the potential benefits ofolive oil
use.
When one considers the psychological reasons as to why consumers purchase olive oil it
is necessary to not only consider the consumers motivation and exposure but also the
consumers risk perception ofpurchasing olive oil. Question 14 ofAppendix A probed
this aspect by questioning: "It is risky to buy good olive oil" with 5 options:
49
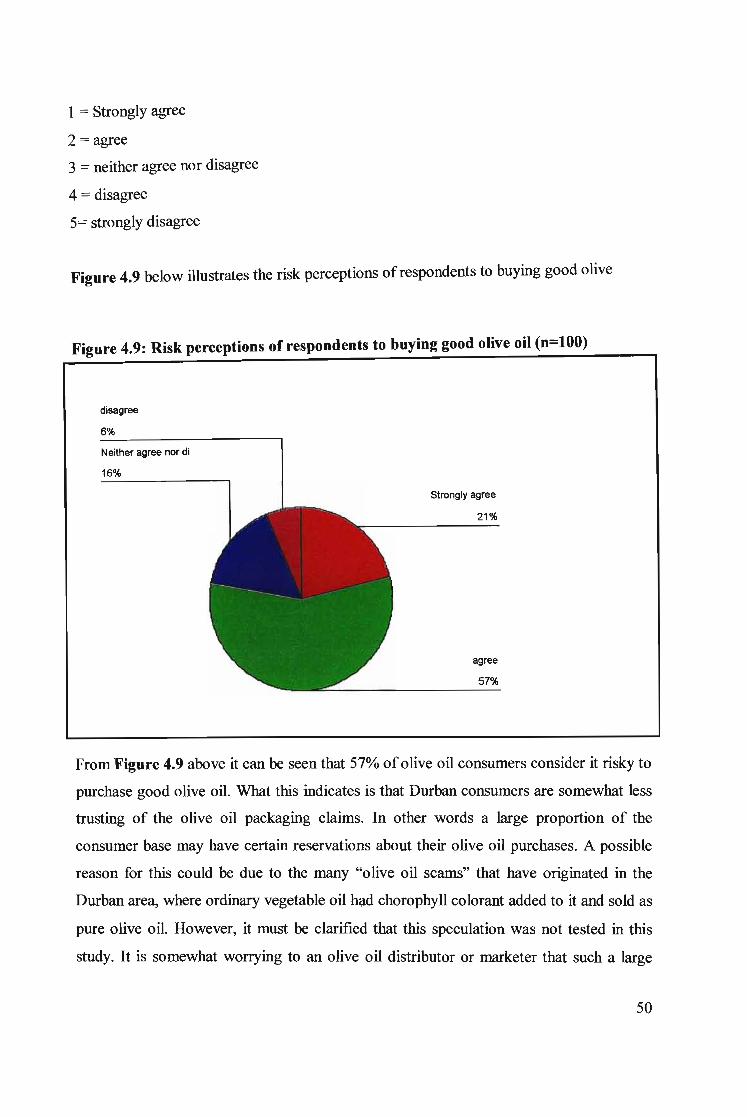
I = Strongly agree
2 = agree
3 = neither agree nor disagree
4 = disagree
5= strongly disagree
Figure 4.9 below illustrates the risk perceptions ofrespondents to buying good olive
Figure 4.9: Risk perceptions of respondents to buying good olive oil (n=100)
disagree
6%
Neither agree nor di
16%
Strongly agree
21%
agree
57%
From Figure 4.9 above it can be seen that 57% ofolive oil consumers consider it risky to
purchase good olive oil. What this indicates is that Durban consumers are somewhat less
trusting of the olive oil packaging claims. In other words a large proportion of the
consumer base may have certain reservations about their olive oil purchases. A possible
reason for this could be due to the many "olive oil seams" that have originated in the
Durban area, where ordinary vegetable oil h<;ld chorophyll colorant added to it and sold as
pure olive oil. However, it must be clarified that this speculation was not tested in this
study. It is somewhat worrying to an olive oil distributor or marketer that such a large
50

proportion of the consumer base has this type of reservation because this could easily
result in buyer dissonance and lessen the chance for a repeat purchase. A marketer would
therefore reinforce to the consumer the quality aspects of the olive oil to position it as a
high quality olive oil.
The various psychological aspects ofmotivation, perception, influences, and exposure all
affect the consumers attitude towards olive oil which to a large degree affect certain
aspects of the consumers culturally derived demographics influencing his propensity to
purchase olive oil. Chapter 5 provides the recommendations and conclusions to this
study in the light of the data analysed and literature reviewed in previous chapters.
51
•
CHAPTER 5 - RECOMMENDATIONS AND CONCLUSIONS
5.1 RESEARCH CONCLUSIONS
This research explored 4 objectives:
5.1.1 The first aim was to determine if there was a relationship between olive oil
purchasing and the demographic variables of age, gender, income and educational levels
amongst Durban consumers. Chi-square test statistic provides the best indication of the
degree of independence that each variable has of each other. Since all of the Asymp.
Significance Statistic data was less than 0.05 for each ofthe variables analysed, the null
hypothesis was rejected at the 5% level. Thus, a relationship does exist between olive oil
purchasing and the demographic variables of age, gender, income and educational levels.
5.1.2 Having established that there a relationship exists (from 5.1.1) the next research
objective was to develop a consumer profile for a Durban consumer of olive oil.
A typical olive oil consumer in the Durban region is likely to be:
• Sex:
• Age:
• Educational level :
• Income level:
Male or Female though more likely to be a female
45 - 54 years old.
The next most likely age category to purchase olive
oil is the age group 25 - 34.
Highly educated with more than 50% of the olive
oil consumers having a tertiary education, 19%
holding a university degree and 8% a post graduate
degree.
Income between R7429 - R 13 787. Grocery buyers
52
with monthly incomes that exceed R 7429 are more
likely than any other group to buy olive oil.
5.1.3 The third objective ofthe study was to investigate the reasons for olive oil purchase
amongst consumers as well as the reason for non purchase amongst non consumers of
olive oil. Amongst Durban consumers of olive oil the overwhelming reason for the
purchase of olive oil was because of the exceptional health benefits that olive oil offered
over other edible oil products on the market. Consumers preferred extra virgin olive oil.
With 72 % of the olive oil consumers preferring to purchase olive oil for its health
benefits only 17 % of the olive oil purchasers bought it for its taste.
5.1.4 The fourth objective of the study was to investigate the motivation, exposure, risk
perceptions as well as the influences to olive oil purchasing amongst Durban consumers.
Amongst the 68% of the respondents who purchased olive oil the strongest motivational
factor was the consumers desire for a healthier lifestyle or diet. 72 % of the consumers
indicated that their primary motivational reason for purchasing olive oil was for its health
benefits with 17% purchasing it for taste. Durban consumers have not been exposed to
much olive oil adverts with 74% of them not having been exposed to any adverts. This
lack of exposure will have a direct bearing on the motives of the consumers to purchase
olive oil. Amongst all Durban consumers, 57 % of the consumers felt that it was risky to
purchase good olive oil. This underlying mistrust of the product is a concern for
marketers and must be addressed in any advertising and promotional campaign.
The next section evaluates a few of the recommendations emanating from the conclusions
that have been drawn in this study.
53
5.2 RECOMMENDATIONS
From the responses provided in this survey and from the quantitative research, a series of
factors have been identified that would help to better target current and potential
consumers of olive oil.
What was evident was that olive oil use has penetrated the domestic market, particularly
in Durban, reaching approximately 68 percent ofthe households that were studied. These
high levels ofpenetration suggest that a potential sizeable market ofolive oil has been
developed. The challenge for the olive oil importers, producers and distributors in the
Durban region will be to capture this market. Part ofcapturing this share of the market is
to understand the motivations, influences and risk perceptions ofboth the olive oil
consumer and non-consumer.
This study has indicated that by emphasising the health benefits ofolive oil will greatly
increase the likelihood ofpurchase an decrease buyer dissonance. More than 72 per cent
ofconsumers purchasing olive oil have a basic understanding ofthe health benefits of
olive oil and more than 17 per cent ofolive oil consumers have become accustomed to its
taste. This suggests that olive oil can be easily differentiated from competing edible oils
as consumers become more aware of its unique characteristics. It could also indicate that
consumers can be educated into developing an appreciation ofthe flavour ofolive oil.
Finally, the research has also provided a consumer profile that may help the olive oil
industry to better target its promotional and advertising campaigns. Approximately 74 %
ofall consumers believe that insufficient olive oil advertisements have been
communicated to them and this obviously limits the exposure ofthe product. Thus it is
recommended that increased advertising and promotion be done to specifically increase
the exposure ofthe beneficial health aspects ofthe products to ultimately motivate
consumers to the point ofre-purchase.
54
BIBLIOGRAPHY
Bargh, lA. 2002. Losing Consciousness: Automatic Influences on Consumer Judgement,
Behaviour and Motivation. Journal ofConsumer Research. Vo129. Issue 2.
Barone, M.J, Rose, R.L Manning, K.C., Miniard, W. 1996. Another look at the impact of
reference information on consumer impressions ofnutrition information. Journal of
Public Policy and Marketing. pp 1-15.
Clark, A., Deziel, S. 1999. How Teens go the Power. MacIeans. Vo1112. Issue 12.
Cohen, 1, Chakravati, 1990. Consumer Psychology. Annual Review ofPsychology. 41.
pp 243-248.
Cooper, D., Schindler, P.2001.Business Research Methods.McGraw-Hill International
Edition. 7th edition.
Du Plessis, P.J., Rousseau, G.G.1999. Buyer behaviour: A multi-cultural approach. 2nd
edition. Thomson Publishing. Johannesburg.
Du Plessis, P.l., Rousseau, G.G., Blem, N.N. 1995. Buyer behaviour strategic marketing
applications. Halfway House: SA Southern Book Publications.
Glanz, K., Basil, M., Maibach, E., Goldberg, J., Snyder, D. 1998. Why Americans eat
what they do: Taste, nutrition, cost, convenience, and weight control concerns as
influences on food consumption. Journal ofthe American Dietetic Association. 98,1118
1126.
55
Gold, S.2002. Extending South Africa's olive branch. Mail & Guardian. July 26-
August 1.
Jacoby, J., Johar,G.V., Morrin, M.1998. Consumer Behaviour: A Quadrennium Annual
Review ofPsychology. 49. pp 319 - 344.
Hoyer, W.D., MacInnis,D.J. 2001. Consumer Behavior. Houghton Miftlin Company.
Boston. 107-138.
Kotler, P., Armstrong, G., Saunders, J., Wong, V.1996. Principles ofMarketing.
European Edition. Prentice Hall Europe. Hempstead.
Kotler, P.2000.Marketing Management. The Milleniuim Edition.Prentice-Hall
International New Jersey.
Kyriakopoulos, K & Ophuis, P.1997. A pre-purchase model ofconsumer choice for
biological foodstuff. Journal ofInternational Food and Agribusiness Marketing, 8, 37
53.
Larbarbera, P. 1998. Matching the Message to the Mind: Advertising Imagery and
Consumer Processing Styles. Journal ofAdvertising Research.VoI38. Issue 5. pp 18-25.
56
Marais, M.A 1994. The distribution ofresources in education in South Africa.
Department ofEconomics. The University of Western Australia
Marais, M.A 1994. Education and the distribution of income in South Africa. Education
Economics. Vo12. Issue 3.
Marais, M.A, Fridgjohn, P. 1986. Education and the distribution of earnings in South
Africa South African Journal ofEducation. 6. pp 144-149.
Mili, S., Zuniga, M.R. 2001. Exploring Future Developments in International Olive Oil
Trade and Marketing: A Spanish Perspective. Agribusiness. Vol17 (3) 397-415.
Parmar, A 2003. Knowledge ofmature market pays reward. Marketing News. Vo137.
Issue 9.
Robinson, M.2001.Salads mean more than a mouthful. Finance Week.p52, 1p.
The Economist.25/10/1997. Volume 345. Issue 8040. p46.
Roininen, K. 2001. Evaluation offood choice behaviour: development and validation of
health and taste attitude scales. Department ofFood Technology, University ofHelsinki.
Shao, AT.2002. Marketing Research: An Aid to Decision Making.2Dd edition. South
Western, a division ofThomson Learning. Pp373-378.
Traill, B. 1999. Prospects for the future: nutritional, environmental and sustainable food
production considerations- changes in cultural and consumer
habits.http://www.fao.org/docreplmeeting/X2697e.htm. Accessed June 2002.
van Zyl, J.2000. Slick Market for Olive Oil. Finance Week, 09/29/2000. p24.
57
Wirthgen. B, Kuhnert. H, Altmann. M, Demmin. D., Wirthgen. A. 2002. The
importance ofregion oforigin in influencing consumer behaviour for food products.
http://www.mluri.sari.ac.uk/livestocksystems/witz/wirthgen.htm. Accessed May 2002.
Whiteford, W. 2001. Black income gap parallels black-white whole. The Worldpaper.
December 12,2001.
Zeitner, R. (2000, May 6). Australia organic products 2000.
http://www.(as.usda.gov/gainfiles/200006/25677787.pdf Accessed May 2002.
Internet sites
www2.carthage.eduloutis/food.html. You Eat What You Are. Accessed June 2003.
www.census.gov/Press-Release/cb97-154.html.Aging Trends. Accessed June 2003.
www.tertliaonline.comlcontactus/why use olive oil.asp. Why Use Olive Oil. Accessed
June 2003.
www.saarfco.za. SAARF Living Standards Measure. Accessed July 2003.
www.statssa.gov.za. Census 2001. Accessed July 2003.
www.rirdc.gov.aulreportsINPPIDAQ-210Artf Potentialfor Establishing an Olive Oil
Industry. Accessed July 2003.
58

APPENDIX A - QUESTIONNAIRE
SURVEY INSTRUMENT
DURBAN OLIVE OIL CONSUMER PURCHASING PROFILE
Name
Date:
UserlNon-user:--------
No:
The following pages comprises of 11 questions which should take you approximately 3
5 minutes to complete.
When considering these questions please:
• Answer ALL questions as honestly as possible whether you are a user or non-user of
olive oil.
• All information will remain strictly confidential.
Your co-operation is highly appreciated.
59
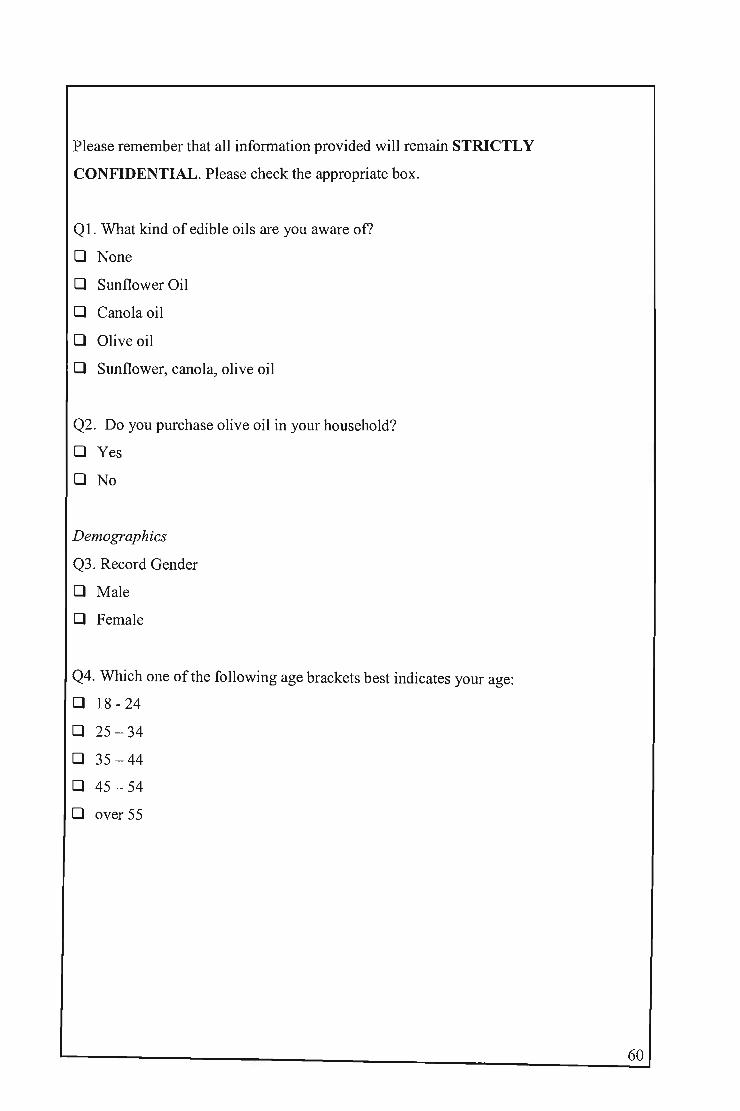
Please remember that all information provided will remain STRICTLY
CONFIDENTIAL. Please check the appropriate box.
Q1. What kind of edible oils are you aware of?
o None
o Sunflower Oil
o Canola oil
o Olive oil
o Sunflower, canola, olive oil
Q2. Do you purchase olive oil in your household?
OYes
o No
Demographics
Q3. Record Gender
o Male
o Female
Q4. Which one ofthe following age brackets best indicates your age:
o 18 - 24
o 25 - 34
o 35 -44
o 45 - 54
Dover 55
60
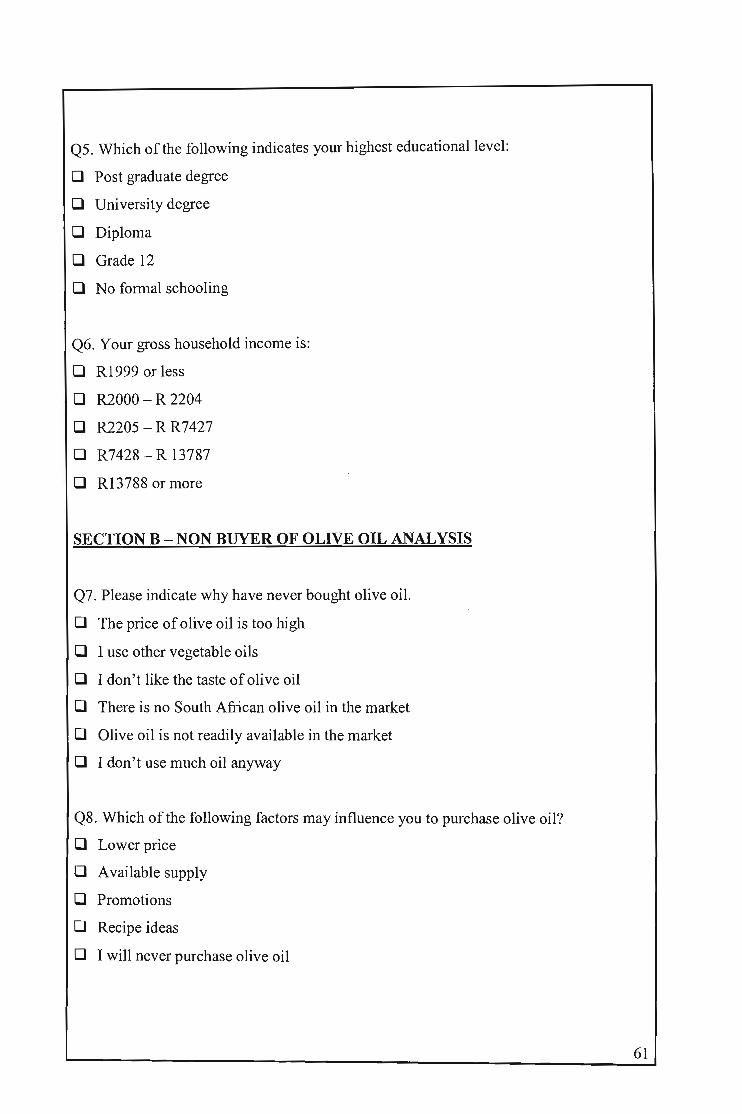
Q5. Which of the following indicates your highest educational level:
o Post graduate degree
o University degree
o Diploma
o Grade 12
o No formal schooling
Q6. Your gross household income is:
o R1999 or less
o R2000 - R 2204
o R2205 - R R7427
o R7428 - R 13787
o R13788 or more
SECTION B - NON BUYER OF OLIVE OIL ANALYSIS
Q7. Please indicate why have never bought olive oil.
o The price of olive oil is too high
o I use other vegetable oils
o I don't like the taste of olive oil
o There is no South African olive oil in the market
o Olive oil is not readily available in the market
o I don't use much oil anyway
Q8. Which ofthe following factors may influence you to purchase olive oil?
o Lower price
o Available supply
o Promotions
o Recipe ideas
o I will never purchase olive oil
61
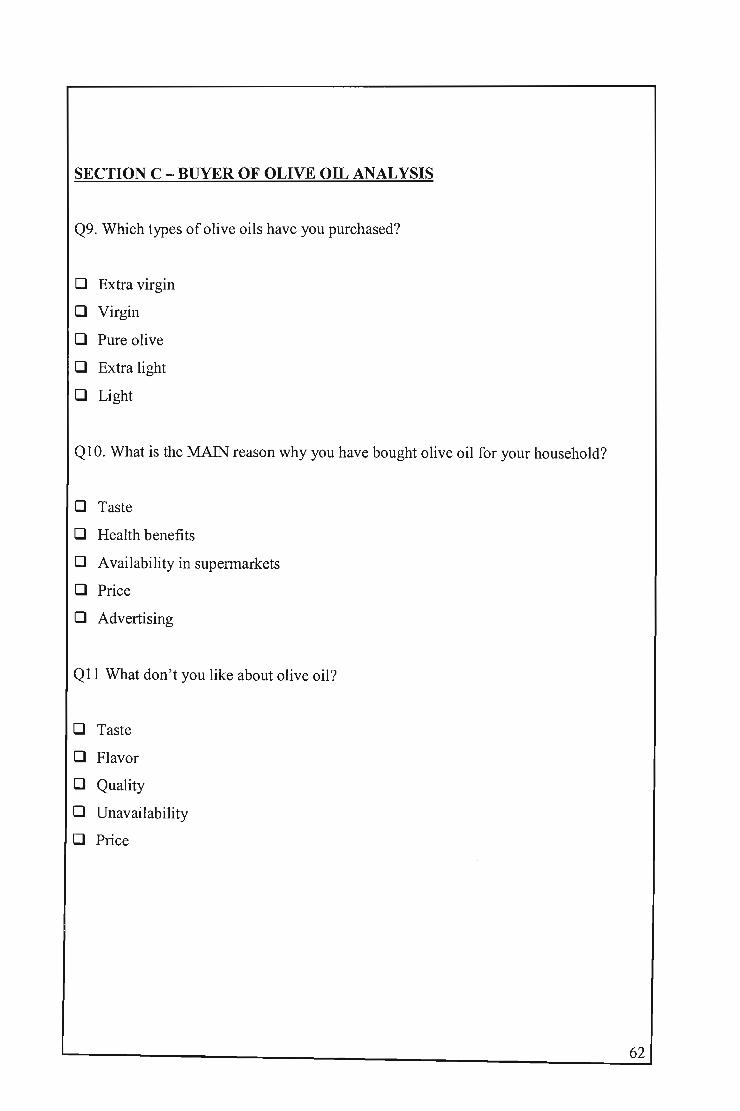
SECTION C - BUYER OF OLIVE OIL ANALYSIS
Q9. Which types of olive oils have you purchased?
0 Extra virgin
0 Virgin
0 Pure olive
0 Extra light
0 Light
Q10. What is the MAIN reason why you have bought olive oil for your household?
o Taste
o Health benefits
o Availability in supermarkets
o Price
o Advertising
Qll What don't you like about olive oil?
0 Taste
0 Flavor
0 Quality
0 Unavailability
0 Price
62
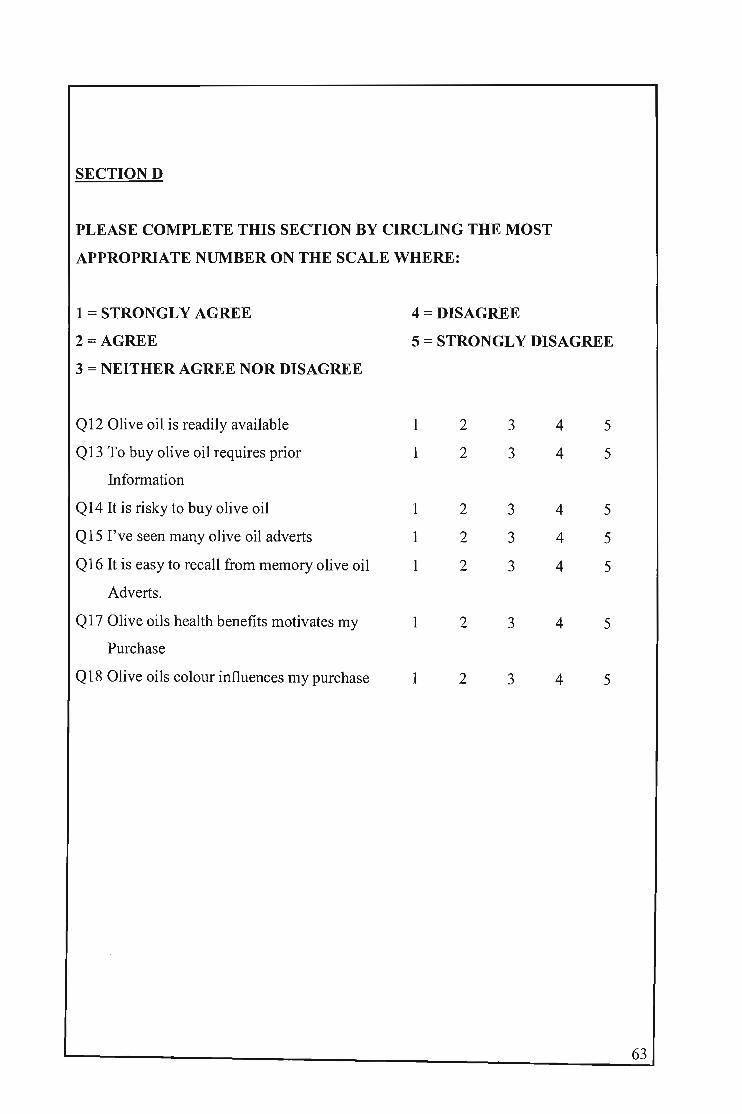
SECTIOND
PLEASE COMPLETE THIS SECTION BY CIRCLING THE MOST
APPROPRIATE NUMBER ON THE SCALE WHERE:
1 = STRONGLY AGREE
2 = AGREE
3 = NEITHER AGREE NOR DISAGREE
4 = DISAGREE
5 = STRONGLY DISAGREE
Q12 Olive oil is readily available 1 2 3 4 5
Q13 To buy olive oil requires prior 1 2 3 4 5
Infonnation
Q14 It is risky to buy olive oil 1 2 3 4 5
Q15 I've seen many olive oil adverts 1 2 3 4 5
Q16 It is easy to recall from memory olive oil 1 2 3 4 5
Adverts.
Q17 Olive oils health benefits motivates my 1 2 3 4 5
Purchase
Q18 Olive oils colour influences my purchase 1 2 3 4 5
63