impact of innovations on consumers behaviour: a case …
TRANSCRIPT
European Journal of Business and Innovation Research
Vol.2, No.6, pp.93-108, December 2014
Published by European Centre for Research Training and Development UK(www.eajournals.org)
93 ISSN 2053-4019(Print), ISSN 2053-4027(Oonline)
IMPACT OF INNOVATIONS ON CONSUMERS’ BEHAVIOUR: A CASE STUDY OF
PAK ELECTRON LIMITED.
Prof.Dr.Abdul Ghafoor Awan,
Dean,Faculty of Management and Social Sciences,
Institute of Southern Punjab-Pakistan.
Syeda Zuriat-ul-Zahra,
MS Scholar, Business Administration
Institute Of Southern Punjab-Pakistan
ABSTRACT: Innovations play a key role in changing behavior, purchasing habits and
improving living standard of customers. In this era of stiff competition, innovation is the only toil
through which business firms do not only fight a war of survival but also obtain competitive
advantage. This is the reason that business firms particularly high-tech companies spend billions
of dollars every years on research and development (R&D) and development of new products and
services keeping in view the changing needs and demand of the customers. The objective of this
study is to investigate how innovation affects the behavior of customers and which factors motivate
the customers to adapt innovation. Main research question of this study is to measure the impact
of innovation on consumer behavior with special reference to electronic industry. We have taken
Pak Electron Company Ltd, which is a market leader in Pakistan and manufacturing different
electronic products and marketing them since 1956. In order to measure the behavior of consumer
towards innovation products we have taken a sample of 200 male & female customers between the
ages of 18-65 years. The data which was primary in nature, was collected through field survey
and a questionnaire was structured for this purpose. Face to face interviews were conducted. A
standard likert scale was used to analyze data. This scale is commonly used for analysis in
qualitative studies. S-Curve model was used to measure the innovations made or introduced by
Pak Electronics Ltd in collaboration with other leading electronic companies of the world. Our
study evidence prove that the effect of innovations are significant on the behavior of customers
and 75% of respondents endorsed that innovative electronic products attracted and have brought
positive change in their behavior and living standards.
KEYWORDS: Innovation, S-curve, Customer behavior, purchasing intention, R&D
_____________________________________________________________________________
.
European Journal of Business and Innovation Research
Vol.2, No.6, pp.93-108, December 2014
Published by European Centre for Research Training and Development UK(www.eajournals.org)
94 ISSN 2053-4019(Print), ISSN 2053-4027(Oonline)
WHAT IS INNOVATION?
The word innovation is derived from Latin word “nova” meaning new. However, merely being
new does not quite catch the essence of innovation. An innovation is also normally something that
is novel and different. Just how different naris normally but typically most innovations have a
degree of novelty. This newness and novelty is captured in most defamation of innovations: Rogers
(1995) defines that an innovation is an idea practice or object that is perceived new by and
individual or other unit of adoption. Betje (1998) states that “innovations are new things applied
in business of producing, distributing and consuming products or services.” DTI (2004) says that
“innovation is the successful exploitation of ideas.” Freeman and soette (1997) define the
innovation as “first commercial application or production of a new process or product.”
These definitions are more effective because they are related to business and commerce. They
highlight the fact that innovation is about commercial explanation and application of ideas and
innovations so that they can be traded in marketplace. Hence innovations embrace both
technological and creative dimension.
Main Research Question
The main research question of this paper is to measure the impact of innovations on consumers’
behavior. We will investigate how innovations change the purchasing behavior of customers and
why do consumer purchase innovative products?
Objective of the Study
The objective of this paper are given below:-
1. To study whether the companies make innovations and introduce new products when their
existing products are selling in the market?
2. To investigate whether the consumers prefer to purchase new products?
3. To probe whether innovations improve the living standards of people.
4. To explore whether innovations help companies to sustain their competitive advantage.
Scope of study The scope of study is wide because millions of companies are working day and night and spending
billions of dollars all over the world to develop and introduce new products to meet the growing
needs of the customers. As the needs, habits, income and desires of the customers are changing
and the business firms will have to change their products, their marketing strategies and products
range to survive in the changing business environment. This study is directly relates to the
innovations and their impact on customers and as such its practical implication is definitely more
useful for business organizations and business researchers.
European Journal of Business and Innovation Research
Vol.2, No.6, pp.93-108, December 2014
Published by European Centre for Research Training and Development UK(www.eajournals.org)
95 ISSN 2053-4019(Print), ISSN 2053-4027(Oonline)
RESEARCH METHODOLOGY
Research methodology is a procedure which is used to conduct research. It facilitates the
researchers to use set qualitative and quantitative tools to obtain the objectives and draw the desired
results.
Data and Type In this paper we have used both primary and secondary data. We applied survey method and
collected primary data through a structure questionnaire. We extracted secondary data from the
annual reports of Pakistan Electron Company Ltd.
Sample of Research
Electronic industry is growing in Pakistan as in all over the world. Almost all major world
renowned electronic companies are doing business here and selling products through their sale
outlets. Pakistan Electron Company Ltd is an old electronic Pakistani company operating here
since 1956. It has variety of products and enjoying competitive advantage over its competitors.
Due this reason we have selected this company as a case study to measure the volume of its
innovations and its impact on its customer’s vis-à-vis its competitors. We have selected 200
customers of different age and education to record their views about innovations and their impact.
Estimation Technique
As this is a case study and qualitative research we have used likert scale and statistical tables and
charts to analyze the data.
Technology S-Curve model: One of the most frequently sited models of technological progress is the ‘technology s-curve’
developed in the early 1980s by Richard Foster, of Mckinsey-the US management consulting the
firm. The technology S-curve represents the typical trajectory of the improvement in the technical
performance of the technology relation to the cumulative R&D effort. It is an inductively derived
model of technological progress. The term, S-curve’ was coined from the resulting shape of the
curve when plotted, as illustrated in figure below.
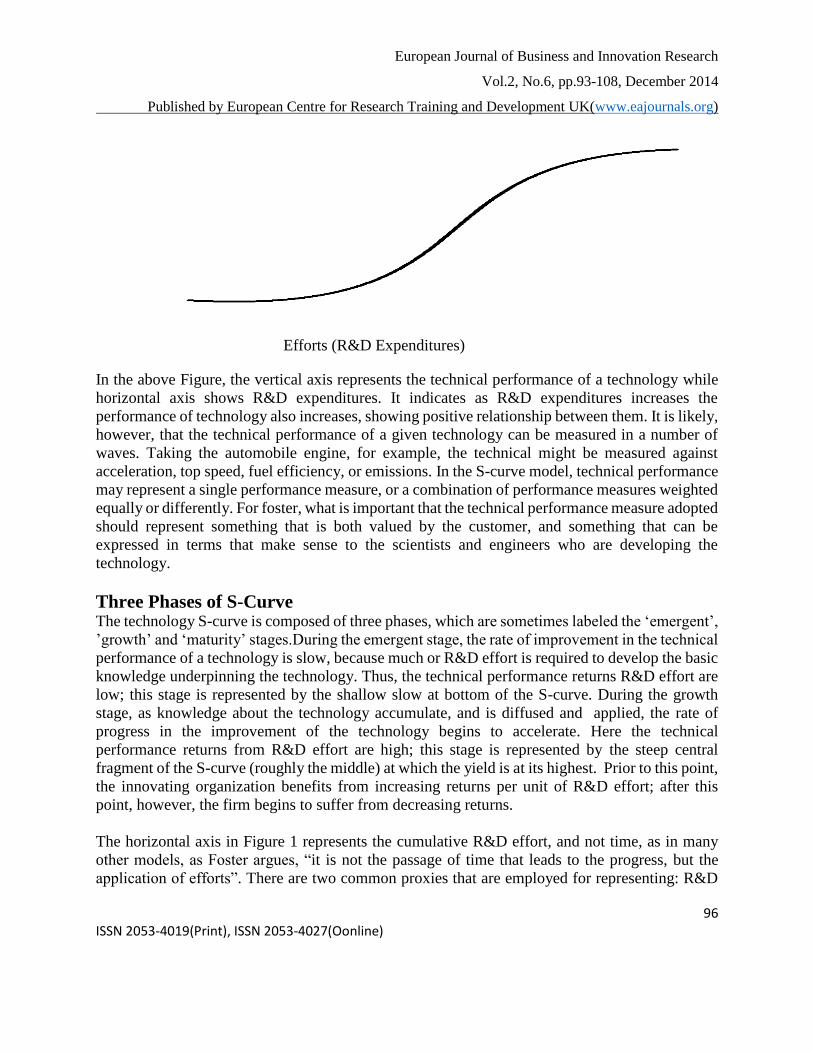
Figure 1 R&D Expenditures and technology performance
European Journal of Business and Innovation Research
Vol.2, No.6, pp.93-108, December 2014
Published by European Centre for Research Training and Development UK(www.eajournals.org)
96 ISSN 2053-4019(Print), ISSN 2053-4027(Oonline)
Efforts (R&D Expenditures)
In the above Figure, the vertical axis represents the technical performance of a technology while
horizontal axis shows R&D expenditures. It indicates as R&D expenditures increases the
performance of technology also increases, showing positive relationship between them. It is likely,
however, that the technical performance of a given technology can be measured in a number of
waves. Taking the automobile engine, for example, the technical might be measured against
acceleration, top speed, fuel efficiency, or emissions. In the S-curve model, technical performance
may represent a single performance measure, or a combination of performance measures weighted
equally or differently. For foster, what is important that the technical performance measure adopted
should represent something that is both valued by the customer, and something that can be
expressed in terms that make sense to the scientists and engineers who are developing the
technology.
Three Phases of S-Curve The technology S-curve is composed of three phases, which are sometimes labeled the ‘emergent’,
’growth’ and ‘maturity’ stages.During the emergent stage, the rate of improvement in the technical
performance of a technology is slow, because much or R&D effort is required to develop the basic
knowledge underpinning the technology. Thus, the technical performance returns R&D effort are
low; this stage is represented by the shallow slow at bottom of the S-curve. During the growth
stage, as knowledge about the technology accumulate, and is diffused and applied, the rate of
progress in the improvement of the technology begins to accelerate. Here the technical
performance returns from R&D effort are high; this stage is represented by the steep central
fragment of the S-curve (roughly the middle) at which the yield is at its highest. Prior to this point,
the innovating organization benefits from increasing returns per unit of R&D effort; after this
point, however, the firm begins to suffer from decreasing returns.
The horizontal axis in Figure 1 represents the cumulative R&D effort, and not time, as in many
other models, as Foster argues, “it is not the passage of time that leads to the progress, but the
application of efforts”. There are two common proxies that are employed for representing: R&D
European Journal of Business and Innovation Research
Vol.2, No.6, pp.93-108, December 2014
Published by European Centre for Research Training and Development UK(www.eajournals.org)
97 ISSN 2053-4019(Print), ISSN 2053-4027(Oonline)
effort’. There are two common proxies that are employed for representing R&D effort: R&D
expenditure and R&D man years.
During the maturity stage, the yield on the R&D effort begins to decline at an increasing rate as it
approaches the ‘Natural’ or ‘technical’ limits of the technology; this is represented by the shallow
slope at the top of the S-Curve. An important element of the S-curve model is the notion of a
‘technical limit’ beyond which the performance of a technology cannot be improved irrespective
of the R&D effort employed. A ‘technical’ limit’ is a physical constraint is set by the laws of
nature, such as the number of the transistors that can be placed on a square centimeter of silicon,
which is limited by the crystal structure of silicon. Another key aspects of S-curve model is the
concept of the ‘technical potential’ of a technology. This is the gap between the current state of
the art of a technology and its technical limit. The technical potential is the gap between the current
position on the s-curve for a given technology and the top of the s-curve.
Explanation of the Model
The model indicates that the early stages of the development of a technology require a great deal
of R&D effort simply to establish the basic knowledge and expertise to make subsequent progress,
that is, in the emergent phase of technology, R&D effort may yield very little tangible progress in
improving the performance of technology. Thus patience is required, because this ‘ground work’
is vital if the organization is able to move on the growth stage of the technology, at which R&D
effort will begin to yield rapidly increasing returns. Consider the extraordinary coordinated R&D
effort of laboratories around the world in developing human genetic structure through the “genome
”project-a necessary precursor to the growth stage of the s-curve for the development of human
gene therapies.
Example of Technical Limits The model also highlights the importance of determining the technical limits and thus the technical
potential of a technology. Innovative organizations therefore need to invest in understanding the
scientific basis of phenomena and materials behind the technology. The development of Rayon is
the best example. The first synthetic automobile type cord. To illustrate the importance of
determining technical limits in advance: of the US$ 100 million invested in developing rayon, the
first $60 million brought 800 percent improvement in technical performance of the material as the
technology moved towards maturity and ultimately towards its technical limits the subsequent $15
million investment in R&D resulted in only 5 percent. If the organization developing rayon known
the technical limits, then their R&D investment strategies might have been very different. The
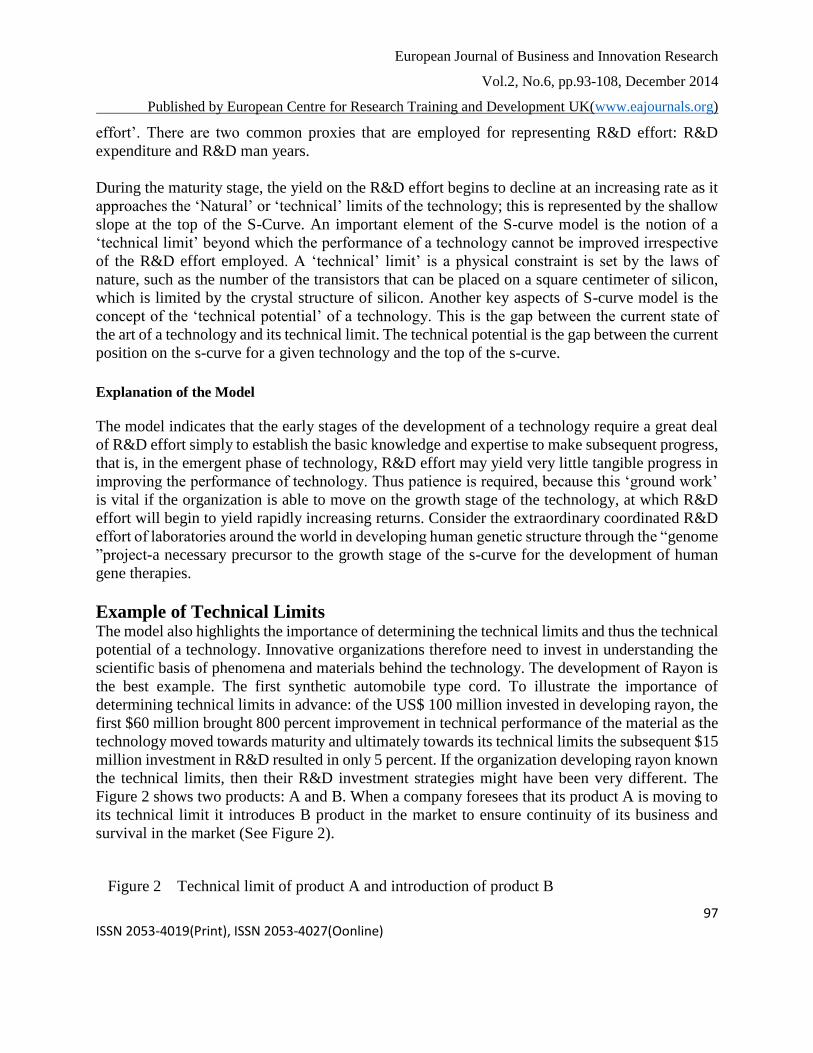
Figure 2 shows two products: A and B. When a company foresees that its product A is moving to
its technical limit it introduces B product in the market to ensure continuity of its business and
survival in the market (See Figure 2).
Figure 2 Technical limit of product A and introduction of product B
European Journal of Business and Innovation Research
Vol.2, No.6, pp.93-108, December 2014
Published by European Centre for Research Training and Development UK(www.eajournals.org)
98 ISSN 2053-4019(Print), ISSN 2053-4027(Oonline)
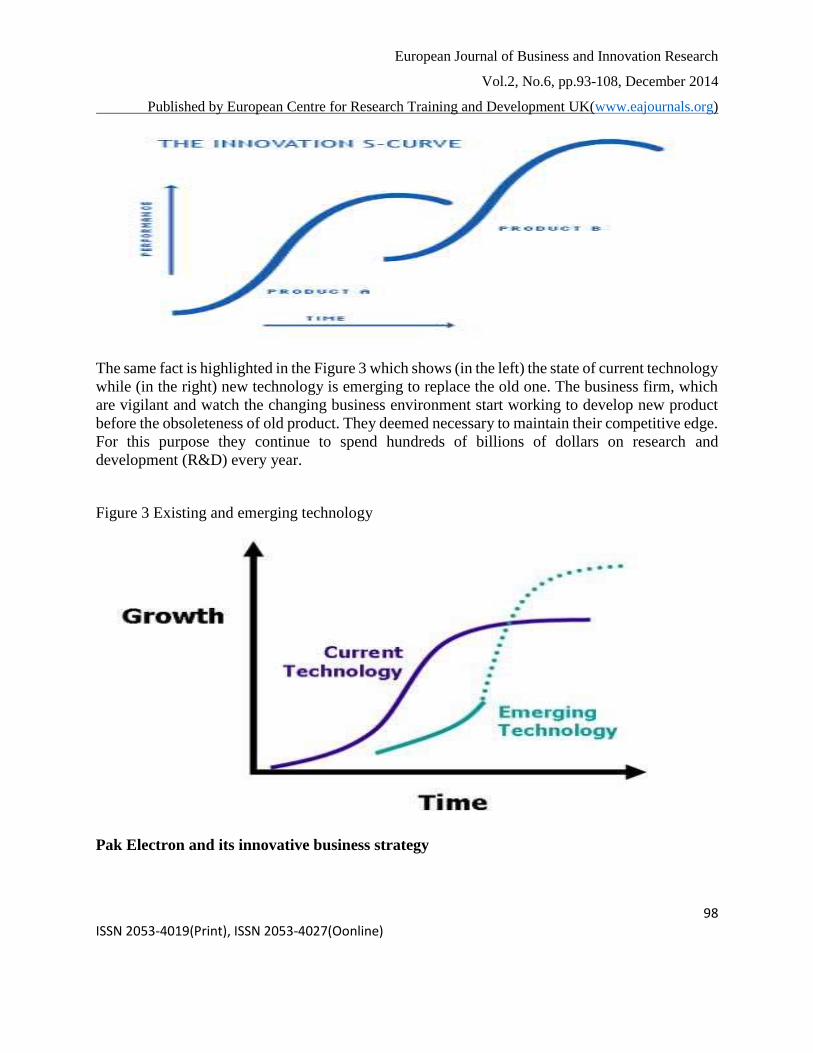
The same fact is highlighted in the Figure 3 which shows (in the left) the state of current technology
while (in the right) new technology is emerging to replace the old one. The business firm, which
are vigilant and watch the changing business environment start working to develop new product
before the obsoleteness of old product. They deemed necessary to maintain their competitive edge.
For this purpose they continue to spend hundreds of billions of dollars on research and
development (R&D) every year.
Figure 3 Existing and emerging technology
Pak Electron and its innovative business strategy
European Journal of Business and Innovation Research
Vol.2, No.6, pp.93-108, December 2014
Published by European Centre for Research Training and Development UK(www.eajournals.org)
99 ISSN 2053-4019(Print), ISSN 2053-4027(Oonline)
Pak Electron Limited (PEL) is the pioneer manufacturer of electrical goods and appliances in
Pakistan. It is a highly innovative, customer driven, leading Engineering organization of Pakistan
involved in the manufacturing of Power & Distribution Transformers, Medium and Low Voltage
Switchgears and construction of High Voltage & EHV Substations as well as a wide range of
Domestic Appliances with in-house design and development facilities in the Appliances Division.
Since its inception, the company has always been contributing towards the advancement and
development of the engineering sector in Pakistan by introducing a range of quality electrical
equipment’s and home appliances and by producing hundreds of engineers, skilled workers and
technicians through its apprenticeship schemes and training programs.
Innovation in PEL PEL’s focus is on developing up the abilities in item technological innovation, design
advancement, obtaining know-how, providing functional and cost effectiveness and upgrading a
reliable understanding and developing up our certification, social media and developing consortia
with international technology management. The goal is to prepare ourselves in the stage being set
where massive investment strategies have to be made in developing power generation, transmitting
and submission systems regionally as well as in other regional areas. Their product mix is most
powerful than ever, the advancement direction is growing and the brand is successful at the various
places.
1. Pak Electron Ltd was incorporated in 1956 in Pakistan in 1958 it started commercial production
and distribution of electric transformers and switch gears.
2 in 1981 it started manufacturing of air conditioner.
3. In 1987 it initiated the production of refrigerators & Deep Freezers.
4. It acquired License to manufacture VCBs from Hitachi Japan.
5. In 1992 PEL had taken initiative to manufacture electric meters.
6. In 1997 it acquired technology form carrier, US to manufacture air Conditioners.
7. In 2004 it started production of power transformers.
8. It set up a separate production line for production and distribution of transformers.
9. In 2009 it started export of power transformers.
10. In 2010 it initiated the manufacturing of LV switch Gears.
11.In 2010 it Prequalified with Saudi Electrical Co.
12. In 2013 it successfully started commissioning of 220KV 618 Shalimar grid station
Application of S-Curve Model on PEL If we apply typical S-curve model we find that Pakistan Electron Ltd.’s competitive advantage and
its growth in volume of sales and profitability is due to its continuous introduction of new and
innovative products in Pakistani market. It has not only develop new indigenous products but also
collaborated with world renowned electronic companies like Samsung, LG, Sonny, Seimen, etc
and in this way induct new technology in the company’s production line and to widen range of its
products. It has enabled Pak Electron to not only compete with its competitors but also maintain
European Journal of Business and Innovation Research
Vol.2, No.6, pp.93-108, December 2014
Published by European Centre for Research Training and Development UK(www.eajournals.org)
100 ISSN 2053-4019(Print), ISSN 2053-4027(Oonline)
its leading position in the market. PEL’s collaborative strategy is very successful because it has
lessen competition with international electronic companies and enabled to launch latest high-tech
electronic products. It saved its cost on research and development (R&D) as well as introduction
of new brands. It seems very easy for it to sell renowned brand through its established sales outlets.
Similarly, it has also benefited foreign companies to save money which is needed to be spent on
the development of market by opening sales outlets in major cities. It has reduced their risk of loss
because they are enjoying an established sale network of Pakistan Electron Limited. They need
not to spend money on the advertisement or publicity of their products in Pakistani market. They
are selling their products in a big customer market which is expanding rapidly due to increase in
the income of people. In this market, the customers prefer to purchase best quality and renowned
brands to upgrade their living standards. Figure 4 on next page shows how S-Curve denotes the
innovations of PEL and its impact on its business growth and sustainability in the market.
European Journal of Business and Innovation Research
Vol.2, No.6, pp.93-108, December 2014
Published by European Centre for Research Training and Development UK(www.eajournals.org)
101 ISSN 2053-4019(Print), ISSN 2053-4027(Oonline)
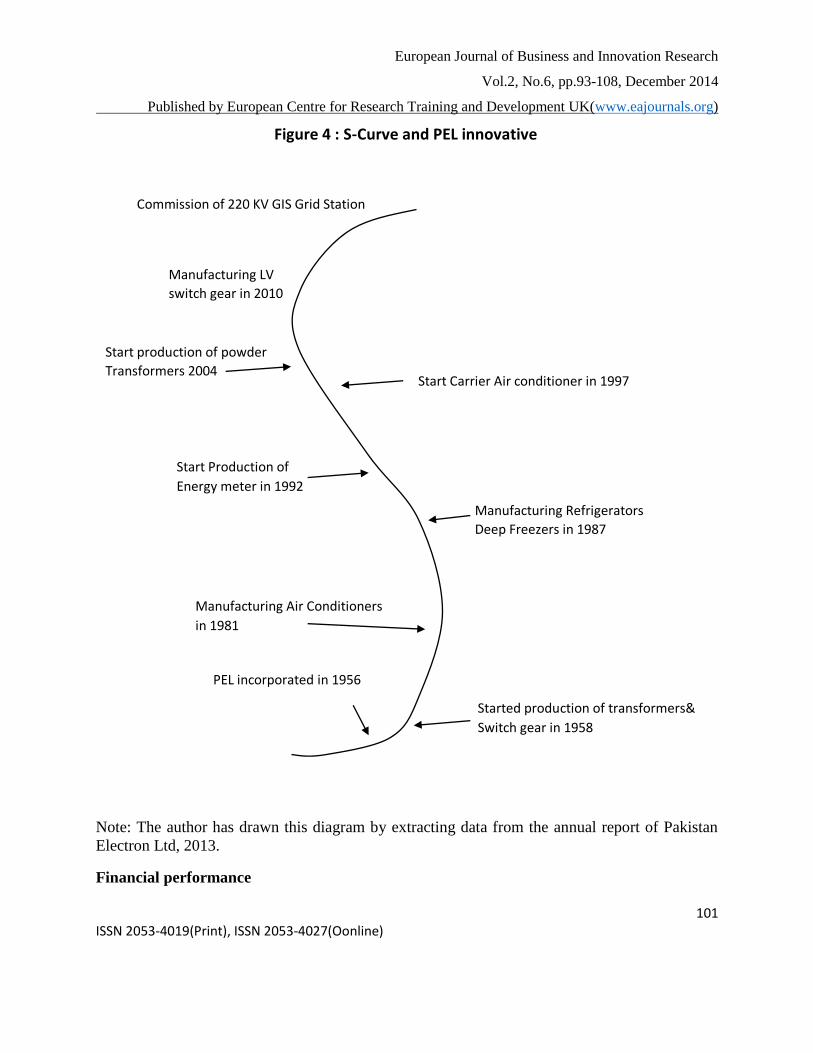
Figure 4 : S-Curve and PEL innovative
Commission of 220 KV GIS Grid Station
Manufacturing LV
switch gear in 2010
Start production of powder
Transformers 2004 Start Carrier Air conditioner in 1997
Start Production of
Energy meter in 1992
Manufacturing Refrigerators
Deep Freezers in 1987
Manufacturing Air Conditioners
in 1981
Started production of transformers&
Switch gear in 1958
PEL incorporated in 1956
Note: The author has drawn this diagram by extracting data from the annual report of Pakistan
Electron Ltd, 2013.
Financial performance
European Journal of Business and Innovation Research
Vol.2, No.6, pp.93-108, December 2014
Published by European Centre for Research Training and Development UK(www.eajournals.org)
102 ISSN 2053-4019(Print), ISSN 2053-4027(Oonline)
The impact of innovations of any organization can be measured in its financial performance. We
have used ratio analysis to measure the financial performance of Pak Electron Limited. Table 1
shows assets, gross sales, gross profits, share capital, shareholders equity and net profit of the
company during the period 2008-2013 which shows all around improvement and growth.
Table :1 PEL’s innovations and impact on its business performance ( in Rs. Millions).
2008 2013 Percentage
Total Assets 16,293, 27,143 60.02%
Gross Sales 13,927 20,294 68.60%
Gross Profit 2,837 40,055 69.87%
Share Capital 970 2,681 361%
Shareholder Equity 3,677 6,545 77.98%
Net Profit 452 607 34.29%
Source: Financial Statement of PEL, 2013.
The Data given in the above table show substantial impact of innovations on its business
performance. For example, total assets of the company were increased form Rs. 16.29 billion in
2008 to Rs. 27.14 billion, an increase of about 60% during a short period of 5 years, 2008-2013.
Gross sales were increased from Rs. 13.92 billion to Rs. 20,29 billion, and increase of around 68%
while gross profit was jumped form Rs. 2.83 billion to Rs. 4.05 billon, an increase of 69.87%. the
share capital of the company was short up from Rs. 0.97 billion to Rs. 2.68 billion, and exorbitant
increase of 361%. The shareholders equity was increase by 77.98% from Rs. 3.6 billion to Rs. 6.5
billion. Net profit was scaled up from Rs. 452 million to Rs. 607 million, an increase of 34.29%
during the study period of 2008-2013. The Figure 5 show tremendous all growth in the financial
indicators of PEL Appliances due to continuance innovations in its product lines.
European Journal of Business and Innovation Research
Vol.2, No.6, pp.93-108, December 2014
Published by European Centre for Research Training and Development UK(www.eajournals.org)
103 ISSN 2053-4019(Print), ISSN 2053-4027(Oonline)
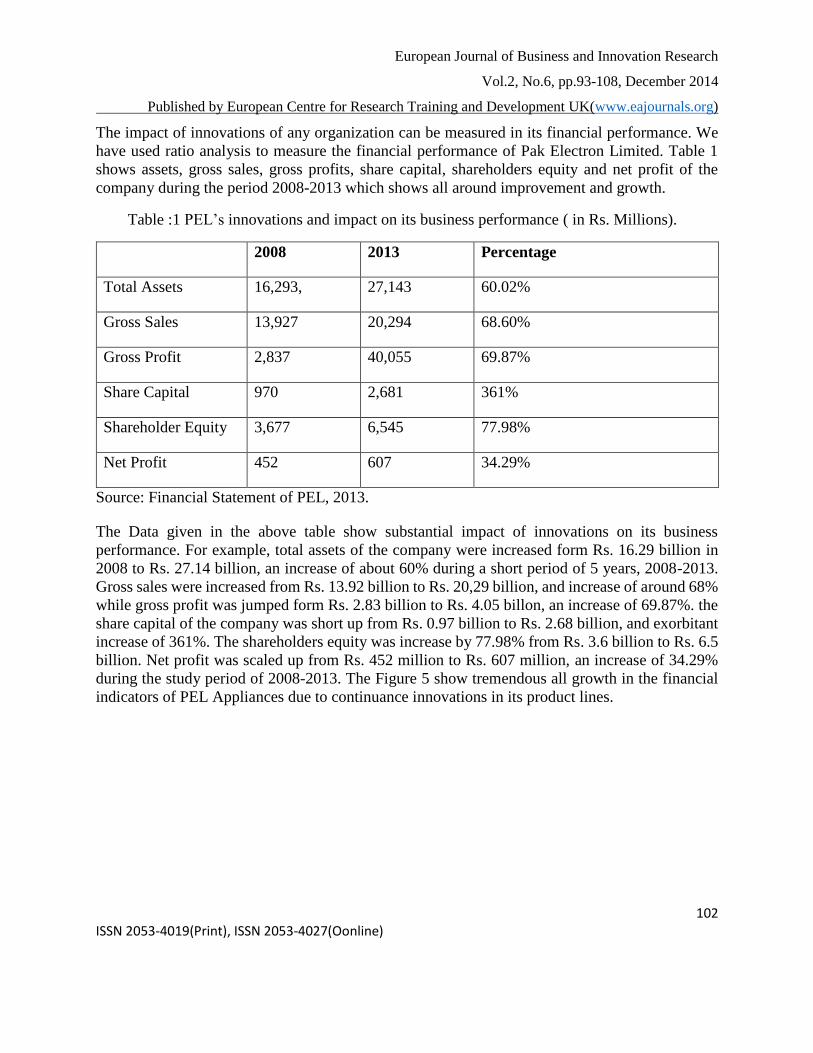
Figure 5 Annual gross sales of appliances (in Pak Rupee)
Figure 5 shows that Annual Performance of the PEL, that since 2006 to 2010 the sale was
increasing at a higher rate. There was a decline in 2011 but again rising trend has been in 2012. So
the innovation is supported by the consumer behavior of purchasing the items as they are according
to their need and fulfilling the demand.
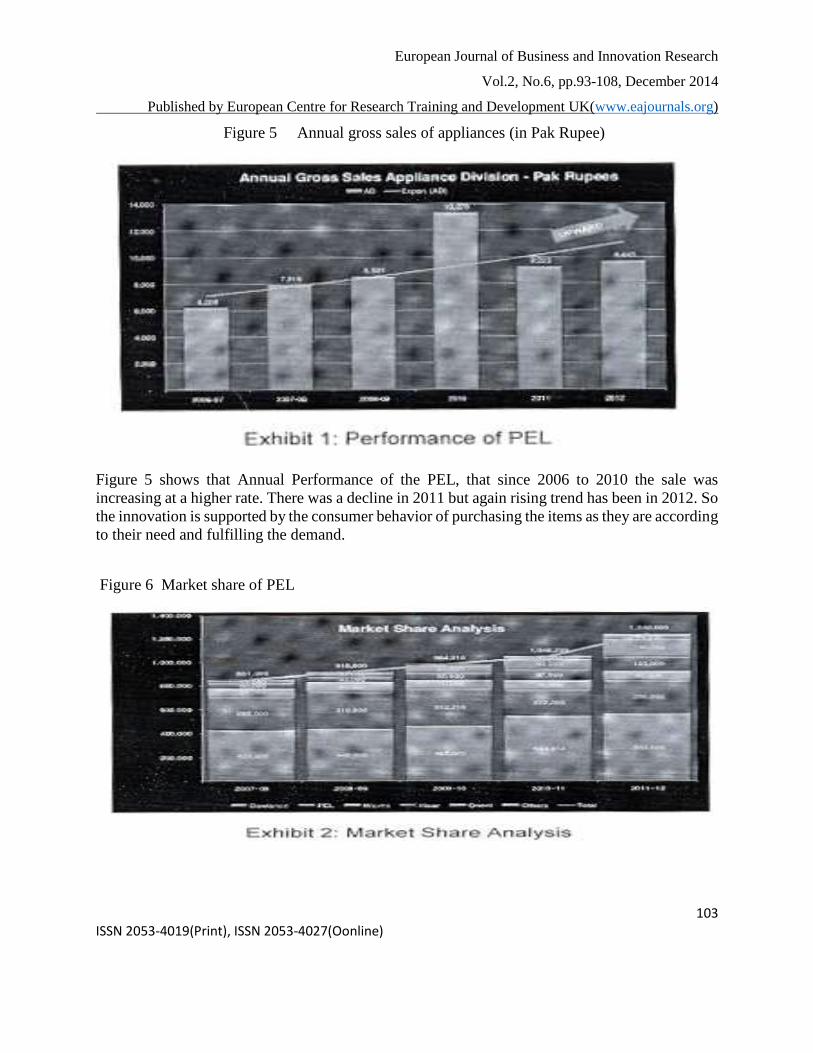
Figure 6 Market share of PEL
European Journal of Business and Innovation Research
Vol.2, No.6, pp.93-108, December 2014
Published by European Centre for Research Training and Development UK(www.eajournals.org)
104 ISSN 2053-4019(Print), ISSN 2053-4027(Oonline)
As far as Market Share is concerned (Figure 6) PEL has a constantly rising market share due to
the continuous development of the innovative products. When the products are developed or
reformed then the consumer behavior towards the products as well as the company is positive.
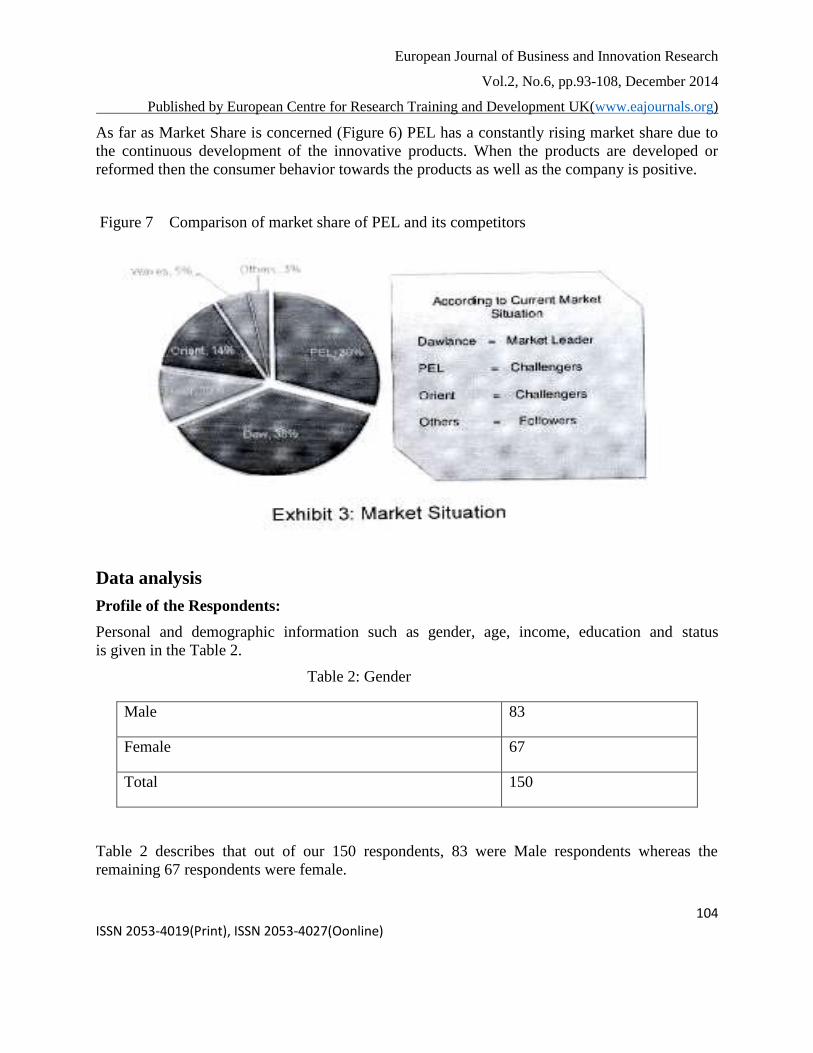
Figure 7 Comparison of market share of PEL and its competitors
Data analysis
Profile of the Respondents:
Personal and demographic information such as gender, age, income, education and status
is given in the Table 2.
Table 2: Gender
Male 83
Female 67
Total 150
Table 2 describes that out of our 150 respondents, 83 were Male respondents whereas the
remaining 67 respondents were female.
European Journal of Business and Innovation Research
Vol.2, No.6, pp.93-108, December 2014
Published by European Centre for Research Training and Development UK(www.eajournals.org)
105 ISSN 2053-4019(Print), ISSN 2053-4027(Oonline)
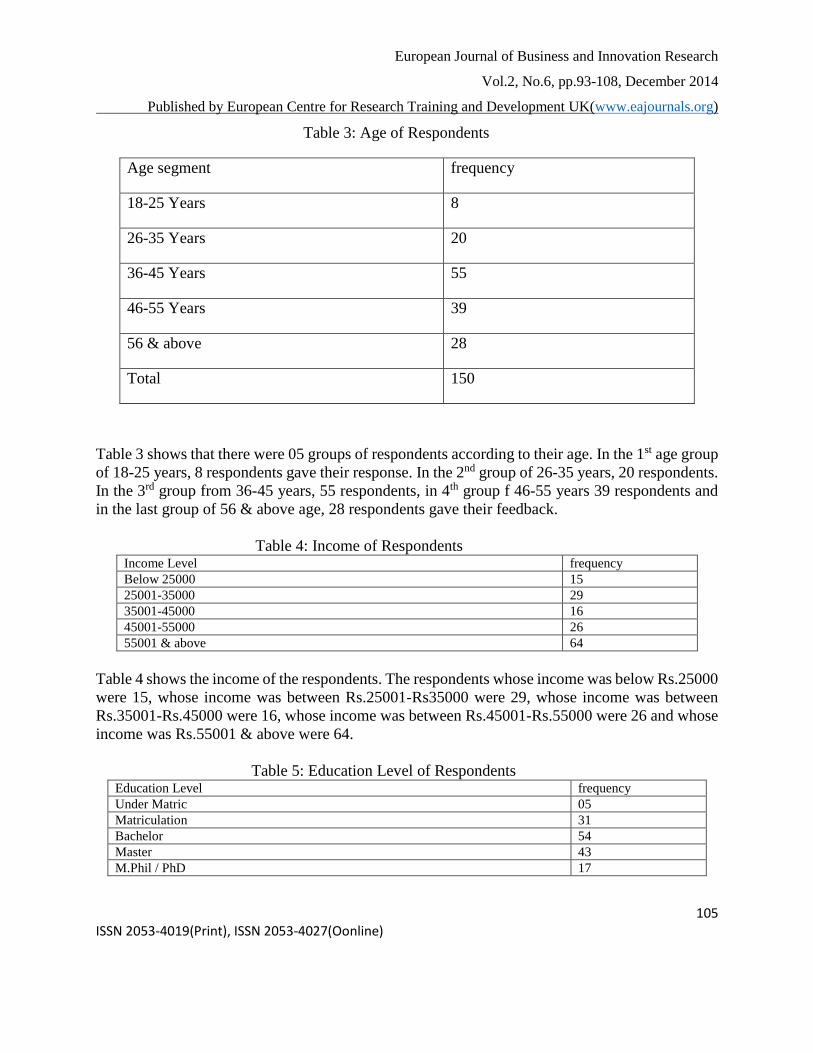
Table 3: Age of Respondents
Age segment frequency
18-25 Years 8
26-35 Years 20
36-45 Years 55
46-55 Years 39
56 & above 28
Total 150
Table 3 shows that there were 05 groups of respondents according to their age. In the 1st age group
of 18-25 years, 8 respondents gave their response. In the 2nd group of 26-35 years, 20 respondents.
In the 3rd group from 36-45 years, 55 respondents, in 4th group f 46-55 years 39 respondents and
in the last group of 56 & above age, 28 respondents gave their feedback.
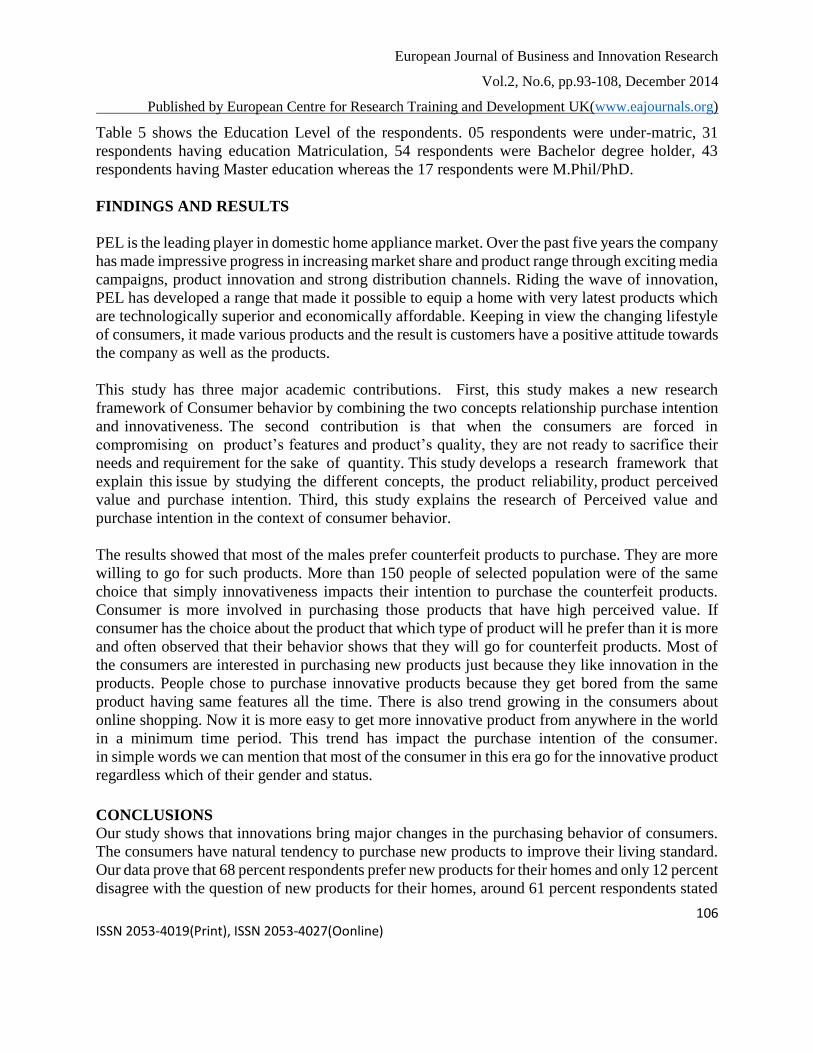
Table 4: Income of Respondents Income Level frequency
Below 25000 15
25001-35000 29
35001-45000 16
45001-55000 26
55001 & above 64
Table 4 shows the income of the respondents. The respondents whose income was below Rs.25000
were 15, whose income was between Rs.25001-Rs35000 were 29, whose income was between
Rs.35001-Rs.45000 were 16, whose income was between Rs.45001-Rs.55000 were 26 and whose
income was Rs.55001 & above were 64.
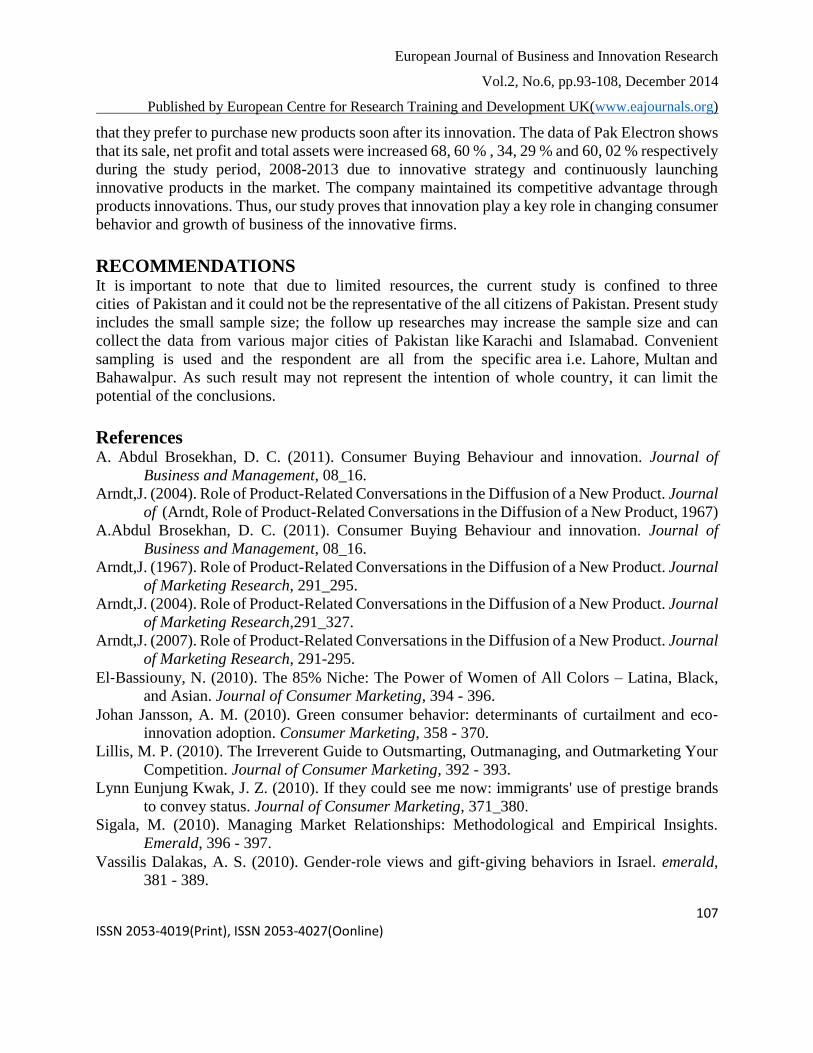
Table 5: Education Level of Respondents Education Level frequency
Under Matric 05
Matriculation 31
Bachelor 54
Master 43
M.Phil / PhD 17
European Journal of Business and Innovation Research
Vol.2, No.6, pp.93-108, December 2014
Published by European Centre for Research Training and Development UK(www.eajournals.org)
106 ISSN 2053-4019(Print), ISSN 2053-4027(Oonline)
Table 5 shows the Education Level of the respondents. 05 respondents were under-matric, 31
respondents having education Matriculation, 54 respondents were Bachelor degree holder, 43
respondents having Master education whereas the 17 respondents were M.Phil/PhD.
FINDINGS AND RESULTS
PEL is the leading player in domestic home appliance market. Over the past five years the company
has made impressive progress in increasing market share and product range through exciting media
campaigns, product innovation and strong distribution channels. Riding the wave of innovation,
PEL has developed a range that made it possible to equip a home with very latest products which
are technologically superior and economically affordable. Keeping in view the changing lifestyle
of consumers, it made various products and the result is customers have a positive attitude towards
the company as well as the products.
This study has three major academic contributions. First, this study makes a new research
framework of Consumer behavior by combining the two concepts relationship purchase intention
and innovativeness. The second contribution is that when the consumers are forced in
compromising on product’s features and product’s quality, they are not ready to sacrifice their
needs and requirement for the sake of quantity. This study develops a research framework that
explain this issue by studying the different concepts, the product reliability, product perceived
value and purchase intention. Third, this study explains the research of Perceived value and
purchase intention in the context of consumer behavior.
The results showed that most of the males prefer counterfeit products to purchase. They are more
willing to go for such products. More than 150 people of selected population were of the same
choice that simply innovativeness impacts their intention to purchase the counterfeit products.
Consumer is more involved in purchasing those products that have high perceived value. If
consumer has the choice about the product that which type of product will he prefer than it is more
and often observed that their behavior shows that they will go for counterfeit products. Most of
the consumers are interested in purchasing new products just because they like innovation in the
products. People chose to purchase innovative products because they get bored from the same
product having same features all the time. There is also trend growing in the consumers about
online shopping. Now it is more easy to get more innovative product from anywhere in the world
in a minimum time period. This trend has impact the purchase intention of the consumer.
in simple words we can mention that most of the consumer in this era go for the innovative product
regardless which of their gender and status.
CONCLUSIONS
Our study shows that innovations bring major changes in the purchasing behavior of consumers.
The consumers have natural tendency to purchase new products to improve their living standard.
Our data prove that 68 percent respondents prefer new products for their homes and only 12 percent
disagree with the question of new products for their homes, around 61 percent respondents stated
European Journal of Business and Innovation Research
Vol.2, No.6, pp.93-108, December 2014
Published by European Centre for Research Training and Development UK(www.eajournals.org)
107 ISSN 2053-4019(Print), ISSN 2053-4027(Oonline)
that they prefer to purchase new products soon after its innovation. The data of Pak Electron shows
that its sale, net profit and total assets were increased 68, 60 % , 34, 29 % and 60, 02 % respectively
during the study period, 2008-2013 due to innovative strategy and continuously launching
innovative products in the market. The company maintained its competitive advantage through
products innovations. Thus, our study proves that innovation play a key role in changing consumer
behavior and growth of business of the innovative firms.
RECOMMENDATIONS It is important to note that due to limited resources, the current study is confined to three
cities of Pakistan and it could not be the representative of the all citizens of Pakistan. Present study
includes the small sample size; the follow up researches may increase the sample size and can
collect the data from various major cities of Pakistan like Karachi and Islamabad. Convenient
sampling is used and the respondent are all from the specific area i.e. Lahore, Multan and
Bahawalpur. As such result may not represent the intention of whole country, it can limit the
potential of the conclusions.
References A. Abdul Brosekhan, D. C. (2011). Consumer Buying Behaviour and innovation. Journal of
Business and Management, 08_16.
Arndt,J. (2004). Role of Product-Related Conversations in the Diffusion of a New Product. Journal
of (Arndt, Role of Product-Related Conversations in the Diffusion of a New Product, 1967)
A.Abdul Brosekhan, D. C. (2011). Consumer Buying Behaviour and innovation. Journal of
Business and Management, 08_16.
Arndt,J. (1967). Role of Product-Related Conversations in the Diffusion of a New Product. Journal
of Marketing Research, 291_295.
Arndt,J. (2004). Role of Product-Related Conversations in the Diffusion of a New Product. Journal
of Marketing Research,291_327.
Arndt,J. (2007). Role of Product-Related Conversations in the Diffusion of a New Product. Journal
of Marketing Research, 291-295.
El‐Bassiouny, N. (2010). The 85% Niche: The Power of Women of All Colors – Latina, Black,
and Asian. Journal of Consumer Marketing, 394 - 396.
Johan Jansson, A. M. (2010). Green consumer behavior: determinants of curtailment and eco‐innovation adoption. Consumer Marketing, 358 - 370.
Lillis, M. P. (2010). The Irreverent Guide to Outsmarting, Outmanaging, and Outmarketing Your
Competition. Journal of Consumer Marketing, 392 - 393.
Lynn Eunjung Kwak, J. Z. (2010). If they could see me now: immigrants' use of prestige brands
to convey status. Journal of Consumer Marketing, 371_380.
Sigala, M. (2010). Managing Market Relationships: Methodological and Empirical Insights.
Emerald, 396 - 397.
Vassilis Dalakas, A. S. (2010). Gender‐role views and gift‐giving behaviors in Israel. emerald,
381 - 389.
European Journal of Business and Innovation Research
Vol.2, No.6, pp.93-108, December 2014
Published by European Centre for Research Training and Development UK(www.eajournals.org)
108 ISSN 2053-4019(Print), ISSN 2053-4027(Oonline)
Viorel Cornescua, C.-R. A. (2013). The Consumer Resistance Behavior towards Innovation.
Procedia Economics and Finance, 457 – 465.
Wood, N. T. (2010). Ad Women: How They Impact What We Need, Want, and Buy. Journal of
Consumer Marketing, 393 - 394.
Assink, M. (2006) The inhibitors of disruptive innovation capability: a conceptual
model,.European Journal of Innovation Management, Vol. 9,No.2, p. 215-233.
Blackler, F., & Brown, C, (1985), Evaluation and the impact of information technologies on people
in organizations, Human Relations, Vol.38,No. 3, p.213 - 231 .
Bredahl, L. (2001), Determinants Of Consumers Attitudes And Purchase Intentions With Regards
To Genetically Modified Foods Results Of ACross-National Survey, Journal of Consumer
Policy, No. 24, p. 23-61.
Cooper R.G. (1990) Winning at New Products, Accelerating the process from idea to launch, 2nd
edition, Perseus, p. 9.
Crawford, C. M. & Di Benedetto A.(2008)New products management, ,Edition -IX, New York,
McGraw-Hill/Irwin.
Czepiel, John A (1974) Word-of-Mouth Processes in the Diffusion of a Major Technological
Innovation, Journal of Marketing Research, No.11,May, p. 172-180.
Danneels, E. (2003) Tight-loose coupling with customers: The enactment of customer orientation,
Strategic Management Journal, No. 24, p. 559-576.
Ellen, P.S.; Wiener, J.L. & Cobb-Walgren, C (1991) The role of perceived consumer effectiveness
in motivating environmentally conscious behaviours, Journal of Public Policy and
Marketing, October, p. 102-117.
Ellen,P.S.; Bearden,W. O. &Sharma,S. (1991) Resistance to technological innovations: an
experimental examination of the role of self-efficacy and performance satisfaction, Journal
of The Academy of Marketing Science, No. 19, April, p. 297 307.
Fortin, D. R., & Renton, M. S. (2003) Consumer acceptance of genetically modified foods in New
Zealand, British Food Journal, No. 105, p.42 58.
Garcia, R. &Atkin, T. (2002) Coo-petition for the diffusion of resistant innovations: A case study
in the global wine industry, Institute for Global Innovation Management Working Paper,
May, p. 1-22.
Heiskanen, E.;Hodson, M.; Raven, R.;Feenstra, Y. et all (2007) Factors influencing the societal
acceptance of new energy technologies: metaanalysis of recent European projects, Work
Package 2 report of the Create Acceptance Project.
Herbig, P. &Dunphy, S. (1995) Acceptance of Innovation: The Customer is the Key, The Journal
of High Technology Management Research, No. 6, February, p. 193-209.
Khan K. & Hyunwoo K. (1992) Factors affecting consumer resistance to innovation, Jonkoping
International Business School.
Lapointe, L., Lamothe, L. & Fortin, J. (2002) The Dynamics of IT adoption in a major change
process in healthcare delivery, System Sciences, HICSS. Proceedings of the 35th Annual
Hawaii International Conference on, p. 918-926.
Belk, R.W. (1974), “An Exploratory Assessment of Situational Effects in Buyer Behaviour”,
Journal of Marketing Research, 11, May, pp. 156-163.
European Journal of Business and Innovation Research
Vol.2, No.6, pp.93-108, December 2014
Published by European Centre for Research Training and Development UK(www.eajournals.org)
109 ISSN 2053-4019(Print), ISSN 2053-4027(Oonline)
[11]. Belk, R. W. (1988), “Possessions and the Extended Self”, Journal of Consumer Research,
15, September, pp. 139-168.
Parker, Philip M. (1994). Aggregate diffusion forecasting models in marketing: A critical review.
International Journal of Forecasting, 10 (2), 353-380.
Rogers, E. M. (1995). Diffusion of Innovations. (4th Ed.). New York: The Free Press.
Silk, Alvin J. (1966). Overlap Among Self-Designated Opinion Leaders: A Study of Selected
Dental Products and Services. Journal of Marketing Research, 3 (August), 255-259.
Sultan, F., Farley, J. U. and Lehmann, D. R. (1990). A Meta-Analysis of Applications of Diffusion
Models. Journal of Marketing Research, 27(1), 70-77.
Wolfram, S.(1983). Statistical Mechanics of Cellular Automata. Reviews of Modern Physics, 55
(3), 601-644.
Wolfram, S.(1984). Cellular automata as models of Complexity. Nature, 311(4), 419-424.