a comparison of saponin and tween 80 on the …
TRANSCRIPT

Clemson UniversityTigerPrints
All Theses Theses
8-2014
A COMPARISON OF SAPONIN ANDTWEEN 80 ON THE SOLUBILITY AND THEDEGRADATION ENHANCEMENT OFFLUORANTHENE AND THE INFLUENCEOF LACCASE ON FLUORANTHENEDEGRADATIONStacia BallewClemson University, [email protected]
Follow this and additional works at: https://tigerprints.clemson.edu/all_theses
Part of the Microbiology Commons
This Thesis is brought to you for free and open access by the Theses at TigerPrints. It has been accepted for inclusion in All Theses by an authorizedadministrator of TigerPrints. For more information, please contact [email protected].
Recommended CitationBallew, Stacia, "A COMPARISON OF SAPONIN AND TWEEN 80 ON THE SOLUBILITY AND THE DEGRADATIONENHANCEMENT OF FLUORANTHENE AND THE INFLUENCE OF LACCASE ON FLUORANTHENE DEGRADATION"(2014). All Theses. 1850.https://tigerprints.clemson.edu/all_theses/1850

A COMPARISON OF SAPONIN AND TWEEN 80 ON THE SOLUBILITY AND THE DEGRADATION ENHANCEMENT
OF FLUORANTHENE AND THE INFLUENCE OF LACCASE ON FLUORANTHENE
DEGRADATION
A Thesis Presented to
the Graduate School of Clemson University
In Partial Fulfillment of the Requirements for the Degree
Master of Science Microbiology
by Stacia Michelle Ballew
August 2014
Accepted by: Dr. Thomas Hughes, Committee Chair
Dr. Min Cao Dr. Harry Kurtz, Jr.

ABSTRACT
The ubiquitous contamination of polycyclic aromatic hydrocarbons (PAHs)
in the environment require an economical approach as well as effective
remediation techniques in the removal of these contaminants. Through the use of
more eco-friendly and economically available biosurfactants, such as saponin,
there is a possibility they could prove to be more useful surfactants than
conventional synthetic surfactants for the solubilization of fluoranthene (FLA).
Enhanced solubility would potentially facilitate the increased degradation by S.
paucimobilis EPA505. The addition of laccase produced by Pleurotus ostreatus,
a white rot fungus that produces enzymes known to facilitate or assist in the
degradation of fluoranthene (FLA), could also be a promising addition to
bioremediation efforts.
Tween 80 was shown to be a more effective surfactant over saponin;
however, with appropriate concentrations of saponin close to its critical micelle
concentration (CMC) and under appropriate conditions, saponin could be a viable
alternative as a more biodegradable and eco-friendly surfactant. Laccase did not
appear to have a significant effect on FLA degradation over a 48-hour period;
however, further studies need to be conducted to rule out potential interferences
of Tween 80 on laccase activity. These additional studies could help conclusively
determine the potential benefit of laccase for use in bioremediation in FLA
degradation.
ii

ACKNOWLEDGMENTS
I would like to thank my advisor, Dr. Thomas Hughes, and my committee
members, Dr. Min Cao and Dr. Harry Kurtz, Jr., for the support in completing my
research and thesis. I am especially thankful to Dr. Kurtz, Jr. for the invaluable
advice and guidance with the technical aspects of my research.
I would also like to thank various people who have provided me with
instrumentation and supplies for which I would not be able to complete this
research. John Abercrombie provided much needed supplies and equipment for
which I am very grateful. Drs. Campbell and Cao allowed me the use of their lab
equipment to help complete various testing and media preparation. Dr. Kurtz, Jr.
graciously allowed me the use of his HPLC instrumentation as well as numerous
reagents and supplies.
Lastly, I could not have completed my degree here at Clemson without the
support and patience from my husband, Chris, and various friends here at
Clemson and off campus that helped make my time here at Clemson a more
enjoyable and rewarding experience.
iii

TABLE OF CONTENTS
Page
TITLE PAGE ....................................................................................................... i ABSTRACT ........................................................................................................ ii ACKNOWLEDGMENTS ................................................................................... iii LIST OF TABLES ............................................................................................... v LIST OF FIGURES ........................................................................................... vi ABBREVIATIONS .......................................................................................... viii CHAPTER I. INTRODUCTION ............................................................................... 1 II. LITERATURE REVIEW ..................................................................... 3 Bioremediation ............................................................................. 3 Microorganisms used for Bioremediation ..................................... 5 Surfactants ................................................................................... 7 Laccase from Pleurotus ostreatus .............................................. 12 Research Objectives .................................................................. 15 III. MATERIALS AND METHODS ......................................................... 16 IV. RESULTS ........................................................................................ 22 V. DISCUSSION .................................................................................. 45 REFERENCES ................................................................................................ 51
iv

LIST OF TABLES
Table Page
3.1 SL-6: Trace Element Solution .......................................................... 18 3.2 SL-4: Trace Element Solution .......................................................... 18 3.3 Final Mineral Medium (MM) Preparation .......................................... 19 4.1 Summary of HPLC Results for Tween 80 ........................................ 39 4.2 Summary of HPLC Results for Saponin ........................................... 39 4.3 FLA Removal with Tween 80 with and without the addition of laccase ...................................................................... 42 4.4 Degradation of Tween 80 over 48 hours .......................................... 44 4.5 Degradation of saponin over 48 hours ............................................. 44 4.6 Degradation of laccase over 48 hours ............................................. 44
v

LIST OF FIGURES Figure Page 2.1 Tween 80 structure .......................................................................... 10 2.2 Quillaja saponin structure ................................................................ 11 4.1 EPA505 growth curves utilizing various concentrations of Tween 80 with no carbon source ............................................................................. 23 4.2 EPA505 growth curves utilizing various concentrations of saponin with no carbon source ............................................................................. 23 4.3 Tween 80 at various concentrations with glucose as the carbon source .................................................................. 24 4.4 Saponin at various concentrations with glucose as the carbon source .................................................................. 25 4.5 EPA505 growth curves utilizing 250 and 500 mg/L of Tween 80 for FLA solubility .................................................... 26
4.6 EPA505 growth curves utilizing 1000 and 2000 mg/L of Tween 80 for FLA solubility .................................. 26
4.7 Protein concentrations for Tween 80 at various
concentrations ............................................................................ 27 4.8 EPA505 growth curves utilizing 250 and 500 mg/L
of saponin for FLA solubility ....................................................... 28 4.9 EPA505 growth curves utilizing 1000 and
2000 mg/L of saponin for FLA solubility ...................................... 28 4.10 Protein concentrations for saponin at various
concentrations ............................................................................ 29
vi

LIST OF FIGURES (CONTINUED)
Figure Page
4.11 EPA505/Tween 80 without laccase ................................................. 30 4.12 EPA505/Tween 80 with laccase ...................................................... 30
4.13 FLA standard ................................................................................... 31
4.14 FLA degradation without surfactant with the addition of EPA505 ..................................................................... 32 4.15 Degradation of FLA utilizing no surfactant ....................................... 33 4.16 Degradation of FLA utilizing 250 mg/L Tween 80 ............................ 34
4.17 Degradation of FLA utilizing 500 mg/L Tween 80 ............................ 34 4.18 Degradation of FLA utilizing 1000 mg/L Tween 80 .......................... 35
4.19 Degradation of FLA utilizing 2000 mg/L Tween 80 .......................... 35 4.20 Degradation of FLA utilizing 250 mg/L saponin ............................... 36 4.21 Degradation of FLA utilizing 500 mg/L saponin ............................... 37
4.22 Degradation of FLA utilizing 1000 mg/L saponin ............................. 37
4.23 Degradation of FLA utilizing 2000 mg/L saponin ............................. 38
4.24 500 mg/L Tween 80 with (pink) and without (black) laccase ............................................................... 43 4.25 1000 mg/L Tween 80 with (pink) and without (black) laccase ............................................................... 43 4.26 2000 mg/L Tween 80 with (pink) and without (black) laccase ............................................................... 44 4.27 Average FLA intensity at 48 hours for of all runs with and without laccase ............................................................. 57
vii

LIST OF ABBREVIATIONS
BCA Bicinchoninic acid CMC Critical micelle concentration FLA Fluoranthene MM Mineral Medium OD Optical density SL-4 Trace element solution SL-6 Trace element solution
viii

CHAPTER ONE
INTRODUCTION
With the ubiquitous contamination of polycyclic aromatic hydrocarbons
(PAHs) in the environment, measures to remove these contaminants require an
economical approach as well as effective remediation techniques. Since there is
no perfect remediation solution, a combination of procedures is generally
employed to remedy the contamination at these sites [1]. Despite the fact
microorganisms have been used in bioremediation techniques for decades, their
slow degradation process has made them a suboptimal choice employed on their
own [2]. There are several techniques that can be used to enhance the
degradation process with the use of microorganisms, one of which is the use of
surfactants. There are many examples where synthetic surfactants have been
used for bioremediation with and without microorganisms [1, 3, 4, 5], however,
these synthetic surfactants can pose a toxicity risk [6] and sometimes are slow to
degrade as well [7]. The use of biosurfactants has become a more desirable
option as they generally have lower toxicity and are generally more
biodegradable [6]. The drawback with biosurfactants is the difficulty in producing
the large amounts needed for large bioremediation efforts and the cost of
production makes their use currently impractical [5]. Saponins, on the other hand,
are easy to manufacture, are abundant in the environment, and are shown to be
safe for human consumption [8]. Saponins are also a cheaper biosurfactant [9,
1

10] that can potentially perform similarly to current synthetic surfactants, which
could make them a desirable option for bioremediation projects.
In addition to the use of biosurfactants, enzymes produced by certain
organisms can assist in the degradation of many pollutants in the environment,
particularly PAHs [11]. The fungus, Pleurotus ostreatus, is capable of producing
several enzymes, particularly laccases, which are capable of oxidizing PAHs
[12]. This oxidation could make PAHs more readily available for microorganisms
to break down.
It is possible that the combination of laccases and saponins could have a
synergistic effect and increase the degradation process of various PAHs even
further. In addition, both could be beneficial for the removal of heavy metals as
well as other contaminants. Saponins and laccases have the potential to be
produced economically and utilized for bioremediation in various contaminated
sites with minimal environmental impact.
This study was done to determine if the use of a more eco-friendly
biosurfactant could be a more capable or comparable surfactant to conventional
synthetic surfactants for the solubility enhancement of fluoranthene (FLA). This
enhanced solubility will conceivably facilitate the increased degradation by S.
paucimobilis EPA505. This study could help further bioremediation efforts with
the use of less toxic surfactants in sites contaminated with PAHs.
2

CHAPTER TWO
LITERATURE REVIEW
Polycyclic Aromatic Hydrocarbons
PAHs are toxic to people and the environment. The ability to break down
these organic compounds into harmless metabolites in a more efficient and
accelerated rate would be advantageous to the cleanup of superfund sites as
well as smaller areas of contamination. The low solubility of PAHs makes them
generally unavailable for degradation by most microorganisms. Surfactants
decrease the surface tension of hydrophobic compounds such as PAHs, which
would enable the degradation of these PAHs by PAH-degrading microorganisms.
While the use of surfactants is not a new concept for enhancing the degradation
of these contaminants by microorganisms, the main challenge is identifying the
proper conditions that will substantially facilitate this process without introducing
any inhibitory effects.
Bioremediation
The use of soil microorganisms capable of degrading PAHs is a viable alternative
as a sole bioremediation technique or as a complementary option with other
conventional methods. Many conventional extraction methods require an
additional step of degradation with disposal of PAHs after extraction [1]. Through
the incorporation of bioremediation techniques, PAHs can be broken down into
less toxic compounds, which are less of a hazard to human health or the
ecosystem. Other methods, such as solidification/stabilization, involve leaving the
3

contaminants in the soil and using a binding material to prevent or limit
mobilization of the contaminants. One disadvantage of this method is the need
for monitoring periodically for leakage. Typically in the treatment of superfund
sites, several methods are used for the most efficient breakdown of the complex
mixtures of toxic compounds [1].
Bioremediation is a technique that can be used to facilitate the
degradation of PAHs by using microorganisms that can utilize PAHs as carbon
and/or energy sources. The choice of microorganism for this process is based on
environmental conditions as well as the ability of the microbe to adapt to this
environment if not indigenous [13, 14, 15]. For example, mycobacteria have the
ability to degrade high molecular weight PAHs, however, they require certain
environmental enrichments, such as pyrene, to help facilitate its degradation of
these PAHs and mycobacteria are not easily isolated which makes it difficult for
consistent application in bioremediation [2].
Bioremediation of heavy metals and other components of soil via soil
microorganisms have had variable results [16, 17]. Bioremediation is considered
environmentally safe and economical, however, the process can be exceedingly
slow and there is the possibility of toxic intermediate metabolites accumulation or
incomplete breakdown of the parent compound [3, 18], which in some cases can
be more toxic than the original compound [4, 19]. It is hoped that the use of
surfactants will decrease the amount of time it takes to breakdown these PAHs
with minimal accumulation of intermediate compounds.
4

PAH utilization by EPA505 uses many different pathways for the
degradation of each potential compound. Oxidation of the parent compound via
dioxygenases is typically the initial step, which results in the production of cis-
dihydrodiols [20, 21]. There is variability in where this oxidation can take place on
the PAH molecule, so the hydroxyl groups can be in various locations, creating
various degradation products. Other enzymes that contribute to degradation
further down the pathway include dehydrogenases to form catechols, which are
then typically degraded through oxidization by 1,2-catechol dioxygenases or 2,3-
catechol dioxygenases, depending on which enzyme is produced by the
microorganism [21]. There are microorganisms that produce enzymes that are
specific to a particular substrate, such as the aldolase hydratase enzymes from
EPA505 that target certain PAHs. One form of aldolase hydratase is produced for
the catabolism of FLA, while another form of this enzyme is produced for the
catabolic pathway of naphthalene, anthracene, and phenanthrene. Substrate-
dependent enzyme production for a particular microorganism [22] demonstrates
the complexity of how these microorganisms break down PAHs and the
involvement of many potential pathways and degradation products.
Microorganisms used for Bioremediation
The utilization of microorganisms for bioremediation is well established as
a viable cleanup process for the removal of PAHs from the environment. A few
examples of bacterial genera capable of degrading PAHs include mycobacteria,
Sphingomonas, Pseudomonas, Rhodococcus, and Bacillus [2]. All have
5

advantages and disadvantages, with some disadvantages including slow
degradation rates, specific environmental requirements, and specificity for lower
molecular weight PAHs instead of the more recalcitrant high molecular weight
PAHs [4]. The main advantage is their ability to degrade PAHs. Most of these
microorganisms can break down the lower molecular weight PAHs, while some
are able to degrade high molecular weight compounds to varying degrees
depending on the enzymes they produce, their optimal environmental
requirements, and their metabolism in general [2]. Generally, several organisms,
such as bacteria, fungi, and plants, will be involved in the degradation process.
The variability and concentration of contaminants at a particular site necessitate
a diverse treatment approach in order to degrade all of these compounds.
Sphingomonas paucimobilis EPA505, a soil microbe discovered in an
abandoned wood-preserving site in Florida [23, 24], is a Gram-negative rod,
which is known to utilize several PAHs [22]. Its production of a non-specific
dioxygenase [25] helps it utilize several PAHs of both high and low molecular
weight, which results in the production of initial dihydrodiol metabolites [21].
Although EPA505 is slow growing, it is easy to grow in the lab which makes it
easier to culture under various conditions.
6

Surfactants
Surfactants are amphipathic compounds that vary in hydrophobicity
depending on the ionic strength of a solution as well as temperature and other
factors. For this reason, environmental conditions need to be taken into
consideration in surfactant utilization [26]. In bioremediation, surfactants are used
to decrease the surface tension and facilitate greater contact between PAH-
degrading microorganisms and the PAH so they are able to degrade them.
Biosurfactants are becoming a more popular alternative because they are
environmentally safe in that they are biodegradable, generally have less toxic
properties, and exhibit higher selectivity towards contaminants [5, 27]. Typically,
they are versatile in that they are stable at extreme temperatures, pH, and
salinity [5] with some exceptions [28]. They can also be manufactured by using
the byproducts or waste of other processes, which is economically advantageous
[5]. Another advantage is their inability to form true micelles, which could inhibit
the degradation process [6]. With the use of any surfactant, the need to
determine its toxicity on the microorganism within its environment is still
necessary.
In high enough concentration, most surfactants form micelles, which are
clusters of surfactant molecules that have aggregated according to their
amphipathic properties to form spherical structures, with other structural shapes,
such as cylindrical, hemispherical, and lamellar, also possible [26]. There are
conflicting hypotheses on the role of micelles in the interaction between
7

microorganisms and PAHs. One hypothesis is that synthetic surfactants form
micelles and incorporate hydrophobic compounds, such as PAHs, toward the
hydrophobic inner core, which decreases the surface area between the
compound and the solution, allowing the possible interaction with degrading
microorganisms [27]. One scenario depicts the contaminant being drawn into the
micelle toward the hydrophobic center with the hydrophilic component of the
micelle facilitating availability for degradation by microorganisms [6, 29]. Another
possibility could involve the micelle solubilizing the PAH from an adsorbed
surface, thus making it available to the microorganism [6]. Another possibility is
the surfactant forming a lamellar formation, which can be considered a micelle
formation. With this scenario, the surfactant solubilizes the surface-adsorbed
PAH, making it available for degradation with the surfactant as the transition
point between the PAH and the microorganism, facilitating direct up-take. The
last scenario is typically how biosurfactants are theorized to work, involving no
micelle formation but facilitating the solubilization of the PAH from an adsorbed
surface. This results in free PAH available for the direct up-take by the
microorganism [6]. In addition to these four possible processes of surfactant
interaction with microorganisms and PAHs, there is also debate over the
possibility that micelle formation may sequester the PAH or contaminant, making
it unavailable for degradation. This could further complicate contamination issues
by lowering bacterial activity due to a lack of carbon source from the PAH as well
as the possibility that micellar PAHs could be further mobilized into the
8

groundwater [6]. This is a potential problem that has been observed with
synthetic surfactants [30] and gives an advantage for the use of biosurfactants,
which generally do not form true micelles [6].
Tween 80
Tween 80 is a commonly used non-ionic synthetic surfactant and has
many applications, including use in bioremediation, as it has been shown to be
effective in solubilizing PAHs for degradation by microorganisms [6]. Derived
from polyethoxylated sorbitan and oleic acid, it has been used as an emulsifier in
food, as well as in beauty products such as soaps and cosmetics [31]. Medical
uses include parenteral medication stabilization (aqueous solutions) and is also a
component of certain vaccines such as the influenza [32] and tetanus vaccines
[33]. Though considered a biodegradable surfactant, it is possible that the
degradation of Tween 80 may be hindered by the partial breakdown of the
polyethoxy groups of the molecule under certain conditions [34].
9

Figure 2.1. Tween 80 structure [48].
Saponin
Saponins have many benefits for their use in bioremediation, with the one
of the most important being their abundance in nature. This makes mass
production for large-scale bioremediation a possibility where the use of microbial
biosurfactants is limited due to the difficulty in large-scale production. The
extraction process and low cost of production also makes them an attractive
option.
Saponins are glycoside biosurfactants produced by many plant species as
well as some marine species and are relatively new to the bioremediation field.
They are diverse in structure and properties, which makes them useful in many
applications. Saponins have a common steroid aglycone backbone, called
sapogenin, with various glycosylation patterns that create a wide variety of
different compounds. This glycosylation determines the stability and function of a
given compound [28]. One of the more common sources is from Quillaja
10

saponaria, which has a distinct chemical composition that contributes to its
diverse functional capabilities [35].
Figure 2.2. Quillaja saponin structure [28].
Saponins are included in many products that are used on a daily basis by
many people. They have been approved as additives for foods such as sodas
and in food processing for removal of cholesterol from dairy products [28, 35].
Their emulsification properties have also made them effective cleansing agents
in personal care products such as shampoos and toothpastes [28]. Saponins are
also potential antiviral agents (adjuvants) in the treatment of certain infections
11

and production of vaccines [10] as well as other health benefits, including
cholesterol lowering and anticancer properties [28]. Benefits of saponins include
the low cost and ease of extraction [8, 9, 10], which results in easier mass-
production [8] and a more attractive option for use in bioremediation as many
bacterial biosurfactants are difficult to obtain in large quantities due to the nature
of their production. They have been found to bind to heavy metals such as
cadmium [11], lead, copper [36], and nickel so their multiple functions, potential
for reuse, and economical extraction process from plants makes them a valuable
option in terms of cost [37]. Saponins have been shown to be safe enough for
addition into products used daily by people as well as possible medical
treatments, so the use of saponins in bioremediation should not pose a safety
issue.
Laccase from Pleurotus ostreatus
Pleurotus ostreatus is a white rot fungus that is known to facilitate or assist
in the degradation of PAHs, notably FLA and phenanthrene, through its
production of enzymes [12]. The enzymes produced, laccase, lignin peroxidase,
and manganese peroxidase, break down lignin and humic acids, both byproducts
of deteriorating plant material. Manganese and lignin peroxidase require peroxide
to enable substrate oxidation, whereas laccase, specifically, is able to degrade
toxic or recalcitrant phenolic compounds [38] without the aid of peroxides [38,
39]. The nonspecific activity of laccase oxidation tends to result in modification
and detoxification rather than utilization of pollutants as carbon sources [40].
12

The laccase enzyme from P. ostreatus is active at 20 – 34°C, which is
also the optimal temperature for soil bacteria to degrade PAHs, and has been
shown to be active as low as 8°C [41]. The addition of or presence of P.
ostreatus in contaminated sites containing various PAHs could assist existing soil
bacteria in degrading these compounds. Optimal growth conditions – pH,
temperature, and humidity – are important for the growth of this fungus. They are
able to utilize a wide range of inorganic and organic substrates [11] and are able
to oxidize many environmental pollutants, including several PAHs and
polyphenols [38].
In addition to being produced by P. ostreatus, laccases are also produced
by higher order plants, fungi, and some bacteria and initiate the oxidation of
PAHs, aromatic amines, phenols, and dyes. This gives the possibility of several
alternative sources for obtaining the enzyme. Laccase is a blue copper
polyphenol oxidase, which only attacks the phenolic subunits of lignins, with and
without the use of mediator compounds [11]. Mediators are used to assist
laccases in delignification, but are not required in some cases for oxidation to
take place [39]. Oxygen is necessary for laccase activity, with the oxygen
activating the enzyme, and the enzyme, in turn, oxidizes the mediator, or
intermediate substrate, for the breakdown of the targeted compound [11].
Mediators speed up these enzymatic reactions by forming highly reactive cation
radicals that initiate the oxidation of compounds so that laccase is able to oxidize
non-phenolic compounds [42]. ABTS [2,2’ azinobis-(3-ethylbenzenthiazoline-6-
13

sulphonic acid)] is typically one of the most common synthetic mediators used
with laccase, however, the optimal pH for oxidation by laccase is below 4. A
more appropriate mediator for laccase for the bioremediation of soils would be
syringaldazine, a natural mediator, because of its optimal pH range between 4
and 7 [38]. Also, another potential mediator, p-coumaric acid, has been shown to
have a higher oxidation capacity by laccase and to assist in the degradation
certain PAHs [43].
Laccases have a broad-spectrum specificity, which makes them flexible
for use in many different applications from food additives [42, 44] to
bioremediation of pollutants such as textile dyes and various hydrocarbons,
including PAHs [11, 39, 40, 44]. It has been suggested that the variable
glycosylation patterns and isoforms of laccase help protect laccase from
proteolytic degradation [38]. These differences in glycosylation are possibly what
determine the function of a particular laccase.
There are a few substances that seem to act as laccase inhibitors that need
to be taken into account when testing for enzyme activity. These substances are
not inhibitors of laccase itself, but of the substrate or the assay that is performed
to assess laccase activity. These inhibiting substances include sulfhydryl organic
compounds (dithiothreitol, thioglycolic acid, cysteine, and diethyldithiocarbamic
acid) with sodium azide as one substance that is a true inhibitor of laccase [45].
The compounds that increase the activity of laccases’ degradation abilities of
PAHs are vanillin, acetovanillone, 2,4,6-trimethylphenol, and especially p-
14

coumaric acid. Additionally, copper is essential for enzyme function and it has
been show to increase laccase activity with increasing concentrations in the
millimolar range [46].
Research Objectives
The purpose of this study was to determine if the addition of saponin at
various concentrations would be comparable or better than Tween 80, a common
synthetic surfactant, at assisting the degradation of FLA by Sphingomonas
paucimobilis EPA505. Employing a more eco-friendly biosurfactant would be
advantageous due to the lower toxicity and less environmental impact as other
synthetic surfactants may pose. Finding less toxic and more biodegradable
surfactants to aid the bioremediation effort will help remove these recalcitrant
PAHs from the environment more efficiently and effectively. Additionally, laccase,
an enzyme produced by the fungus Pleurotus ostreatus, was used to determine
its effect on the degradation process of FLA by EPA505 with the addition of
Tween 80. Since laccase is known to degrade certain PAHs, its addition may
enhance the degradation process of FLA by EPA505. With laccase oxidizing
parent compounds of certain PAHs to dihydrodiols, the potential to facilitate the
degradation of these metabolites by EPA505 and decrease the time for complete
degradation of these toxic compounds in the bioremediation process is greater.
15

CHAPTER THREE
MATERIALS AND METHODS
Surfactants purchased for the following experiments include saponin
(Amresco, product #0163) and Tween 80 (Amresco, product #M126). Saponin
stock at a concentration of 20 g/L was prepared by mixing 1 gram of saponin in
50 mL deionized water over low heat and filtered through a sterile 0.45 μm filter.
Tween 80 stock at a concentration of 20 g/L was prepared by mixing 1 gram of
Tween 80 in 50 mL deionized water and filtered with a 0.2 μm filter. Glucose
stock at a concentration of 20 g/L was prepared by mixing 1 gram of sucrose in
50 mL deionized water and filtered with a 0.2 μm filter. The glucose solution was
used for the control cultures. Fluoranthene (FLA) was purchased from Sigma
Aldrich and appropriate concentrations of stock solution were prepared with
acetone at the time of use. A Pierce® BCA Protein Assay Kit (product #23225)
was purchased to determine the potential growth of EPA505 in FLA cultures.
Commercial laccase produced by Pleurotus ostreatus was purchased from
Sigma Aldrich (product #75117, stored at -20°C) to determine its effect on FLA
degradation. Laccase working solution was prepared by adding 2 mg of laccase
to 4 mL of cold 50 mM sodium citrate buffer. 300 μL of the laccase working
solution was added to each flask for the laccase experiment. Sodium citrate
buffer at a concentration of 50 mM was prepared by mixing 2.5 mL 1 M citric acid
stock with 40 mL deionized water. Solution was adjusted to pH 4.5 and brought
to a volume of 50 mL. A catechol solution for the laccase control was prepared
16

by adding 137.5 mg catechol (Sigma, product #C9510) to 12.5 mL 50 mM
sodium citrate buffer. One milliliter of the catechol solution was pipetted into a
cuvette for the blank and 1 mL pipetted into another cuvette for the sample. The
addition of 50 μL of 50 mM sodium citrate buffer was added to the blank while 50
μL of the laccase working solution was added to the sample. Time increments
over approximately 20 minutes were taken to determine the activity level of the
laccase solution. FLA solution was prepared at appropriate concentrations with
acetone at the time of use.
Tryptic Soy Broth (TSB) (EMD, product #1.05459) was used for cultivation
of EPA505 cultures and was prepared by adding 30 grams of dry medium to 1 L
of deionized water, then autoclaved for 20 minutes at 121°C at 15 psi. Tryptic
Soy Agar (EMD, product #1.05458) was also used in the cultivation of EPA505
and prepared by adding 40 g of dry medium to 1 L of deionized water, then
autoclaved for 20 minutes at 121°C at 15 psi. Stock culture of S. paucimobilis
EPA505 was prepared in a glycerol-based medium (15% v/v glycerol and 85%
Tryptic Soy Broth culture) and stored at -80°C. Stock culture was streaked onto a
TSA plate and incubated at 37°C for 2 days. An isolated colony was inoculated
into 5 mL TSB and incubated for 2 days at 30°C and ~250 rpm in an incubating
shaker (G24 Environmental Incubator Shaker, New Brunswick Scientific Co.).
Aliquots were taken of the 2 day TSB culture and washed twice with sterile
0.85% saline. The pellets were then inoculated into the appropriate 50 mL flasks
containing MM. Mineral Medium preparation consisted of three components
17

(Tables 3.1 – 3.3). Each component of both trace element solutions (SL-4 and
SL-6) was added to a volume of 100 mL deionized water until dissolved and then
each solution was brought to a volume of 1L with deionized water. The
components of the final mineral medium solution were added to 100 mL
deionized water until dissolved and then brought to a volume of 1L with deionized
water. This solution was autoclaved for 20 minutes at 121°C at 15 psi [47].
Table 3.1. SL-6: Trace Element Solution
Concentration Component 0.5 g MnCl24H2O 0.3 g H3BO3 0.2 g CoCl26H2O 0.1 g ZnSO47H2O
0.03 g Na2MoO42H2O 0.02 g NiCl26H2O 0.01 g CuCl22H2O
Table 3.2. SL-4: Trace Element Solution
Concentration Component 0.5 g EDTA 0.2 g FeSO47H2O
100.0 mL SL-6: Trace Element Solution
18

Table 3.3. Final Mineral Medium (MM) Preparation
Concentration Component 2.79 g Na2HPO42H2O 1.0 g KH2PO4 0.5 g (NH4)2SO4 0.1 g MgCl26H2O
0.05 g Ca(NO3)24H2O 1.0 mL SL-4: Trace Element Solution
Growth curves for EPA505 without the addition of a carbon source were
done using 50 mL cultures and with the addition of saponin or Tween 80 at 250,
500, 1000, and 2000 mg/L concentrations (Critical micelle concentrations for
Saponin: 500-800 mg/L [44] and Tween 80: ~15 mg/L) as well as a glucose
control without the addition of surfactant. The flasks were incubated at 30°C with
shaking at ~250 rpm. Time points were taken at approximately every 24 h for 4-5
d and read spectrophotometrically at 600 nm.
Growth curves for EPA505 were done with the addition of glucose as a
sole carbon source and was done using 50 mL cultures and with the addition of
saponin or Tween 80 at 250, 500, 1000, and 2000 mg/L of saponin as well as a
glucose control without the addition of surfactant. The flasks were incubated at
30°C with shaking at ~250 rpm. Time points were taken at approximately every
24 h for 4-5 d and read spectrophotometrically at 600 nm.
Growth curves for EPA505 were done with the addition of FLA. This was
done using 50 mL cultures and with the addition of saponin or Tween 80 at 250,
500, 1000, and 2000 mg/L of surfactant as well as a glucose and FLA control
19

without the addition of surfactant. The flasks were incubated at 30°C and ~250
rpm on an incubated rotary shaker. Time points were taken at approximately
every 24 h for 4-5 d and read spectrophotometrically at 600 nm. Additionally,
aliquots were extracted with a 1:3 dilution of ethyl acetate for HPLC analysis.
Protein concentration was determined from cells harvested by centrifugation
(washed twice with a sterile normal saline solution) with the Pierce® BCA Protein
Assay Kit to confirm the presence of growth in the cultures containing FLA.
Increasing protein concentration over time indicated the growth of EPA505 in the
FLA cultures. The protein assay was performed utilizing a microtiter plate
method. The samples were diluted 1:8 with BCA Working Reagent and incubated
at 37°C for 30 minutes before reading on a plate reader (Synergy H1 Hybrid
Microplate Reader, Biotek Instruments) at 562 nm. The results were calculated
from a standard curve.
Cultures for the laccase study consisted of 12 mL of MM with the addition
of Tween 80 at concentrations of 500, 1000, and 2000 mg/L. A final FLA
concentration of 0.25 mg/L was prepared in each 12 mL MM flask (FLA solubility
in water = 0.265 mg/L). These surfactant concentrations were done in duplicate,
with no laccase added to one set to act as a control. Once the MM/surfactant
solutions were prepared, aliquots of EPA505, washed twice with sterile 0.85%
saline, were inoculated into the flasks. A laccase solution of 300 μL was added to
each flask for the second set of flasks. Time points were taken at 0, 4, 8, 12, 16,
20, 24, and approximately 48 hours, with an aliquot taken for extraction for HPLC
20

analysis and another to assess the degradation of FLA by reading
spectrophotometrically at 288 nm. A negative control with 0.25 mg/L FLA and
Tween 80 with no EPA505 or laccase was also incubated, with aliquots taken at
each time point. The blank consisted of MM only.
The HPLC analysis was performed on ethyl acetate extracts of each
sample. Once the ethyl acetate was added to each aliquot for a 1:3 extraction,
the extractions were vortexed. The supernatant was then removed with a glass
Pasteur pipette and pipetted into a glass amber crimp cap vial for HPLC analysis.
These extracts were frozen at -80°C and analyzed in batches. Reverse-phase
High Performance Liquid Chromatography (HPLC) with Shimadzu
instrumentation was used for separation of FLA peaks. Progressive FLA
degradation at specific time points was assessed with UV detection at 254 nm.
The Supelcosil™ LC-PAH column 3 μm, 5 cm x 4.6 mm was used with the
Supelcosil™ LC-18 Supelguard 5 μm, 2 cm x 4.0 mm guard column. The mobile
phase was 85:15 methanol: 8 mM phosphoric acid for 0.8 mL/min over 10
minutes for the analysis of FLA.
21

CHAPTER FOUR
RESULTS
Saponin was used as the biosurfactant for the surfactant study, with
Tween 80 as a reference synthetic surfactant. The ability of saponin to enhance
the degradation by EPA505 of FLA was compared to Tween 80. Growth curves
were used to assess the enhancement of FLA degradation, with control growth
curves to determine how EPA505 responded under optimal conditions with each
surfactant with glucose and to determine if EPA505 would utilize the surfactant
as a carbon source. Growth curves were also used to assess the role laccase
would have on the degradation of FLA. HPLC was used to determine FLA
degradation at the 5.2-minute peak.
Growth curves were implemented without the addition of a carbon source
to determine if EPA505 was able to grow on surfactant alone. The growth
attained on surfactant alone was taken into account when assessing the
22

Figure 4.1. EPA505 growth curves utilizing various concentrations of Tween 80 with no carbon source.
Figure 4.2. EPA505 growth curves utilizing various concentrations of saponin with no carbon source.
23

performance of both surfactants. The Tween 80 growth curves indicated no
growth of EPA505 (Figure 4.1), while saponin showed a slight increase in growth
with 1000 and 2000 mg/L saponin (Figure 4.2).
Under optimal conditions with glucose as the carbon source, the growth of
EPA505 increased slightly with higher concentrations of Tween 80, while the
lower concentrations showed lesser growth (Figure 4.3). EPA505 was able to
grow faster than the glucose control with increasing levels of saponin increasing
this growth (Figure 4.4). Concentrations at 250, 500, and 1000 mg/L
demonstrated similar growth during stationary phase. Concentration of 2000
mg/L of saponin had an increase in growth above the other concentrations.
Figure 4.3. Tween 80 at various concentrations with glucose as the carbon source.
24

Figure 4.4. Saponin at various concentrations with glucose as the carbon source.
With the addition of Tween 80 to the FLA experiments, growth was
enhanced with increasing concentrations of surfactant (Figures 4.5 and 4.6).
Among the four concentrations, enhancement was negligible at the peak of the
growth curve (OD600 ~0.16 - 0.22). The protein levels showed a gradual
increase in concentration from ~30 – 45 μg/L (Figure 4.7).
25

Figure 4.5. EPA505 growth curves utilizing 250 and 500 mg/L of Tween 80 for FLA solubility.
Figure 4.6. EPA505 growth curves utilizing 1000 and 2000 mg/L of Tween 80 for FLA solubility.
26

Figure 4.7. Protein concentrations for Tween 80 at various concentrations.
For the saponin experiments, there were no discernible difference in
growth between the 250 and 500 mg/L concentrations of saponin (OD600 ~0.18)
(Figure 4.8), however, the 1000 and 2000 mg/L concentrations showed a
considerable increase in optical density (OD600 ~0.3 – 0.4) (Figure 4.9). The
protein levels show a moderate increase in concentration for the 500, 1000, and
2000 mg/L saponin concentrations, with the 2000 mg/L showing the greatest
increase (~20 – 170 μg/L). The 250 mg/L concentration showed a more modest
increase (~20 – 46 μg/L), while the 500 and 1000 mg/L showed a moderate
increase (~50 – 80 μg/L, ~28 – 80 μg/L, respectively) (Figure 4.10).
27

Figure 4.8. EPA505 growth curves utilizing 250 and 500 mg/L of saponin for FLA solubility.
Figure 4.9. EPA505 growth curves utilizing 1000 and 2000 mg/L of saponin for FLA solubility.
28

Figure 4.10. Protein concentrations for saponin at various concentrations.
Since FLA is fluorescent, optical density at 288 nm was analyzed for the
laccase samples to determine the degradation of FLA. The EPA505/Tween 80
run without laccase demonstrated a decline in optical density at 288 nm with the
exception of 1000 and 2000 mg/L showing a gradual increase at 16 and 20
hours, respectively (Figure 4.11). The run with the laccase addition showed a
gradual increase in intensity at 16 hours while a dramatic increase in intensity
was observed at 24 hours (Figure 4.12). The negative control (FLA-only) showed
minimal changes in intensity through the 48-hour incubation (Figures 4.11 and
4.12).
29

Figure 4.11. EPA505/Tween 80 without laccase.
Figure 4.12. EPA505/Tween 80 with laccase.
30
31
0.01.0
2.03.0
4.05.0
6.07.0
8.09.0
min0
250000
500000
750000
1000000
1250000 uV
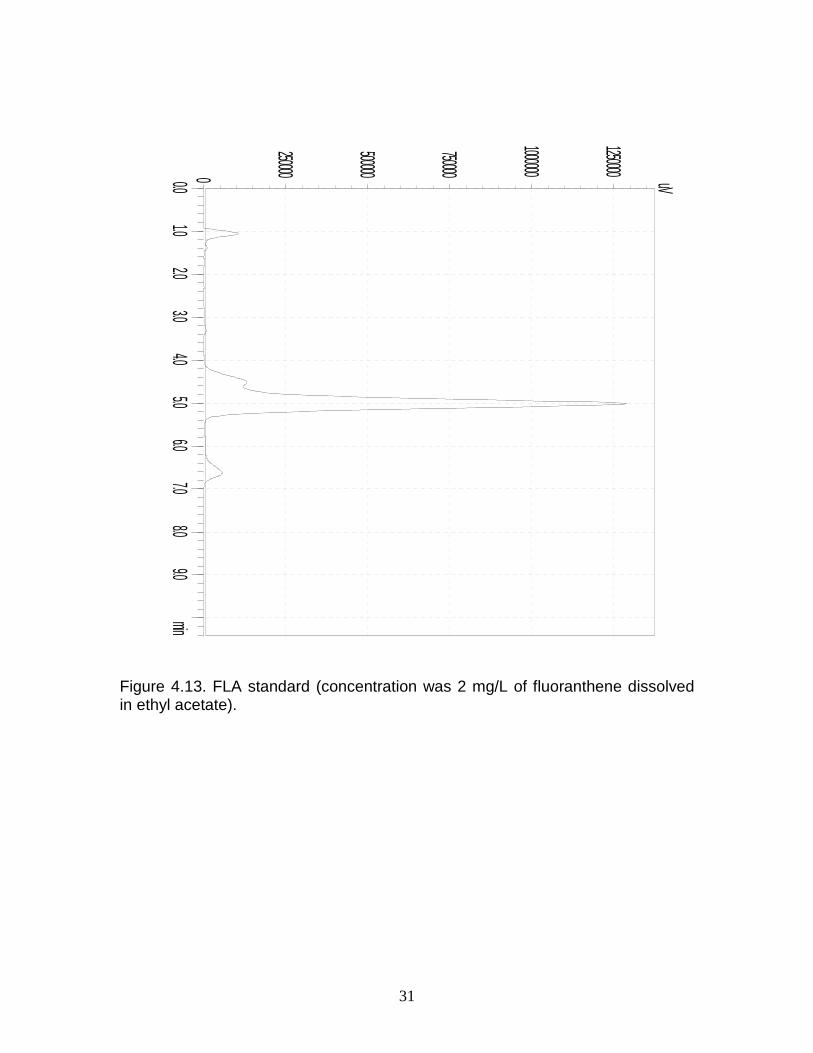
Figure 4.13. FLA standard (concentration was 2 mg/L of fluoranthene dissolved in ethyl acetate).

32
Figure 4.14. FLA degradation without surfactant with the addition of EPA505.
0.01.0
2.03.0
4.05.0
6.07.0
8.0min
0
2500
5000
7500
10000
12500
15000 uV

33
Figure 4.15. Degradation of FLA utilizing no surfactant.
The utilization of Tween 80 with EPA505 showed a marked decrease in
the level of FLA over 97 hours. The solubilization of FLA was increased with the
500 mg/L concentration compared to the other concentrations. Overall, FLA
showed significant degradation over the 97-hour incubation for all Tween 80
concentrations (Figures 4.16, 4.17, 4.18, and 4.19).

34
Figure 4.16. Degradation of FLA utilizing 250 mg/L Tween 80.
Figure 4.17. Degradation of FLA utilizing 500 mg/L Tween 80.

35
Figure 4.18. Degradation of FLA utilizing 1000 mg/L Tween 80.
Figure 4.19. Degradation of FLA utilizing 2000 mg/L Tween 80.

36
Saponin demonstrated an initial increase in intensity during the first 20
hours, then increased FLA degradation over the incubation period. The 250 mg/L
did not show complete degradation after 139 hours (Figure 4.20), while the other
concentrations appeared to show complete degradation (Figures 4.21, 4,22, and
4.23). The 2000 mg/L concentration of saponin showed an increase in intensity
from 120 hours after appearing to reach complete degradation of FLA at
approximately 114 hours (Figure 4.23).
Figure 4.20. Degradation of FLA utilizing 250 mg/L saponin.

37
Figure 4.21. Degradation of FLA utilizing 500 mg/L saponin.
Figure 4.22. Degradation of FLA utilizing 1000 mg/L saponin.

38
Figure 4.23. Degradation of FLA utilizing 2000 mg/L saponin.
The percent degradation of FLA utilizing Tween 80 at 250, 500, 1000, and
2000 mg/L concentrations was 97.0, 99.2, 99.5, and 99.5%, respectively (Table
4.1). The percent degradation of FLA utilizing saponin at 250, 500, 1000, and
2000 mg/L concentrations was 63.5, 97.9, 98.1, and 90.4, respectively (Table
4.2).
For the laccase experiments, the peak intensity at 5.2 minutes was
analyzed by HPLC. The comparison between the two samples for each
concentration of Tween 80, with and without laccase, showed degradation of FLA
at the 5.2-minute peak. There was an increasing intensity of a peak at ~7.0
minutes for all three concentrations of Tween 80 with the addition of laccase
(Figures 4.24, 4.25, and 4.26).

39
Table. 4.1. Summary of HPLC results for Tween 80.
Tim
e (h
ou
rs)
Tween 80 Concentration 250 mg/L 500 mg/L 1000 mg/L 2000 mg/L
Inte
nsi
ty
(uV
)
%
Deg
rad
atio
n
Inte
nsi
ty
(uV
)
%
Deg
rad
atio
n
Inte
nsi
ty
(uV
)
%
Deg
rad
atio
n
Inte
nsi
ty
(uV
)
%
Deg
rad
atio
n
0 25.463 - 95.002 - 135.835 - 118.665 -
24 24.373 4.3 22.349 76.5 30.621 77.5 40.377 66.0
57 0.937 96.3 1.134 98.8 2.984 97.8 0.845 99.3
74 0.940 96.3 0.805 99.2 1.026 99.2 0.906 99.2
97 0.776 97.0 0.645 99.3 0.533 99.6 0.823 99.3
120 - - 0.716 99.2 0.635 99.5 0.603 99.5
Table. 4.2. Summary of HPLC results for saponin.
Tim
e (h
ou
rs)
Saponin Concentration 250 mg/L 500 mg/L 1000 mg/L 2000 mg/L
Inte
nsi
ty
(uV
)
%
Deg
rad
atio
n
Inte
nsi
ty
(uV
)
%
Deg
rad
atio
n
Inte
nsi
ty
(uV
)
%
Deg
rad
atio
n
Inte
nsi
ty
(uV
)
%
Deg
rad
atio
n
0 50.279 - 56.310 - 68.353 - 39.772 -
14 93.465 -85.9 113.471 -101.5 81.391 -19.1 113.888 -186.4
27 82.356 -63.8 63.730 -13.2 54.123 20.8 83.780 -110.7
44 67.994 -35.2 35.945 36.2 16.097 76.5 30.769 22.6
65 39.449 21.5 18.266 67.6 21.134 69.1 16.035 59.7
90 24.114 52.0 10.620 81.1 6.693 90.2 5.486 86.2
114 25.332 49.6 3.885 93.1 1.444 97.9 1.249 96.9
139 18.332 63.5 1.175 97.9 1.319 98.1 3.837 90.4

40
The comparison between the samples with and without laccase at 48
hours showed minimal degradation for the 5.2-minute peak with 500 mg/L Tween
80, but with an increase of a peak at ~7.0 minutes (~1100 uV) for the laccase
addition (Figure 4.24). The samples with 1000 mg/L Tween 80 showed
degradation of FLA at the 5.2-minute peak and a higher intensity of the ~7.0-
minute peak (~1500 uV) for the laccase addition than the 500 mg/L Tween 80
sample (Figure 4.25). The samples with the 2000 mg/L Tween 80 showed similar
degradation of FLA at the 5.2-minute peak with a lesser intensity of the peak at
~7.0 minutes (~1200 uV) than the 1000 mg/L Tween 80 concentration (Figure
4.26).
For the Tween 80 concentrations of 500, 1000, and 2000 mg/L, the
average FLA degradation after 48 hours by EPA505 without the addition of
laccase was 82.3%, 92.5%, and 79.7%, respectively. The average FLA
degradation after 48 hours by EPA505 with the addition of laccase under these
same conditions was 76.6%, 91.1%, and 82.1%, respectively (Table 4.3). The
runs with and without laccase were consistent with regard to the OD288
measurements; however, the intensities at the 5.2-minute peak were variable at
the 48-hour time point. Figure 4.27 shows the average of all three runs with and
without the addition of laccase.

41
0.0 1.0 2.0 3.0 4.0 5.0 6.0 7.0 8.0 min0
500
1000
1500
2000
2500
uV
Figure 4.24. 500 mg/L Tween 80 with (pink) and without (black) laccase.
Comparison 48 h.
0.0 1.0 2.0 3.0 4.0 5.0 6.0 7.0 8.0 9.0 10.0 min0
500
1000
1500
2000
2500
uV
Figure 4.25. 1000 mg/L Tween 80 with (pink) and without (black) laccase.

42
0.0 1.0 2.0 3.0 4.0 5.0 6.0 7.0 8.0 min0
500
1000
1500
2000
2500
uV
Figure 4.26. 2000 mg/L Tween 80 with (pink) and without (black) laccase.
Table 4.3. FLA removal with Tween 80 with and without the addition of laccase.
500 mg/L without laccase
1000 mg/L without laccase
2000 mg/L without laccase
% Avg FLA removal 82.3 92.5 79.7
SD 24.890 1.414 22.203
Standard error 17.6 1.0 15.7
500 mg/L with laccase 1000 mg/L with laccase 2000 mg/L with laccase
% Avg FLA removal 76.6 91.1 82.1
SD 17.324 12.304 18.526
Standard error 12.3 8.7 13.1

43
Figure 4.27. Average FLA intensity at 48 hours for of all runs with and without laccase.
The controls runs for Tween 80, saponin, and laccase were run without
the addition of FLA. All the time points for the 5.2-minute peak were averaged
and calculated for standard deviation and standard error. The average surfactant
for Tween 80 at 500, 1000, and 2000 mg/L concentrations was 1.658, 1.131, and
0.852, respectively. The standard error for each Tween 80 concentration was
0.4, 0.0, and 0.1, respectively (Table 4.4). The average surfactant for saponin at
500, 1000, and 2000 mg/L concentrations was 0.845, 0.375, 0.860, respectively.
The standard error for each saponin concentration was 0.2, 0.0, 0.1, respectively
(Table 4.5). The control run with only laccase and EPA505 showed that the
average laccase intensity at 5.2 minutes was 0.868 with a standard deviation of
0.290 and standard error of 0.1% (Table 4.6).

44
Table 4.4. Degradation of Tween 80 over 48 hours.
500 mg/L Tween 80 1000 mg/L Tween 80 2000 mg/L Tween 80 Average Intensity 1.658 1.131 0.852
SD 0.952 0.122 0.247
Standard error 0.4 0.0 0.1
Table 4.5. Degradation of saponin over 48 hours.
500 mg/L saponin 1000 mg/L saponin 2000 mg/L saponin
Average Intensity 0.845 0.375 0.860
SD 0.572 0.036 0.358
Standard error 0.2 0.0 0.1
Table 4.6. Degradation of laccase over 48 hours.
Average laccase intensity 0.868
SD 0.290
Standard error 0.1

45
CHAPTER FIVE
DISCUSSION
The saponin experiments with surfactant as the carbon source did show
some growth toward the end of the incubation time with the higher concentrations
of saponin (1000 and 2000 mg/L). It is possible EPA505 was utilizing saponin as
a carbon source at these higher concentrations, as it is known for
microorganisms to utilize some surfactants as carbon sources in certain
situations. There was no significant elevation in growth over the time period,
which would indicate minimal interference in assessing the degradation of FLA
with the addition of saponin. Tween 80 did not show any detectable growth so
interference of potential growth with FLA would not be a factor.
For the experiments including glucose, the samples with saponin showed
a pronounced growth response with increasing concentrations of surfactant
compared to Tween 80. One possibility for this increased growth could be that
the addition of glucose with the saponin enhanced the growth response of
EPA505, which would account for the increase in optical density readings at
higher concentrations. Another situation that could be occurring is the
development of aggregation with higher concentrations. With the potential
increase formation of micelles above the CMC (500 – 800 mg/L), micelles may
aggregate and form large particulates in the culture, which may interfere with OD
readings. With only a slight increase in OD readings, the interference is minimal

46
overall. The Tween 80 glucose experiments were very close to the glucose
control with the exception of the 1000 and 2000 mg/L concentrations being
slightly greater in growth response. Consequently, interference due to Tween 80
being utilized as a carbon source would not likely be a factor in assessing the
degradation of FLA in subsequent experiments.
Protein concentration was assessed to determine the potential increase in
growth of EPA505. For the FLA experiments, protein concentrations increased
with both Tween 80 and saponin as the incubation time increased which
indicated growth of EPA505 from the utilization of FLA. Since the experiments for
each surfactant utilizing no carbon source indicated minimal or no growth, the
growth of EPA505 on FLA seemed conclusive for the utilization of FLA alone as
opposed to the utilization of either surfactant. EPA505 is known to utilize FLA
even without the use of surfactant and these experiments show that both
surfactants were able to sufficiently solubilize FLA to facilitate further degradation
by EPA505 to a significant degree.
The use of Tween 80 did not show enhanced growth with increasing
concentrations of surfactant, possibly due to all concentrations inducing similar
saturation levels of FLA. This could be the reason why increasing concentrations
of Tween 80 did not appear to enhance the degradation of FLA. With each
concentration of Tween 80, degradation of FLA was consistently above 99%.
Solubility did appear to be enhanced at the 500 mg/L concentration; however, all

47
concentrations demonstrated virtually complete degradation of FLA around the
same time.
Saponin was not as effective at degrading FLA completely at the 250 mg/L
concentration even after 139 hours; however, it was able to degrade FLA around
98% at the 500 and 1000 mg/L concentrations. At 2000 mg/L, the removal of
FLA dropped to 90%. It appeared that saponin created an interference effect at
higher concentrations. With the CMC around 800 mg/L, anything above that level
appeared to create aggregation of micelles, which interfere with the potential
degradation of FLA. In addition, the micelle aggregation hypothesis includes the
possibility that these micelles sequester the FLA, which prevents contact with
EPA505, inhibiting potential degradation. With the HPLC data, saponin as high
as 1000 mg/L was still effective in degradation of FLA greater than 98%;
however, it showed a decrease in degradation at the 2000 mg/L, which is
consistent with this hypothesis. The decrease in the FLA at the 5.2-minute peak
for HPLC determined that saponin does facilitate the degradation of FLA even at
the higher concentrations, so in spite of the possibility of the aggregation of
micelles, saponin is still able to solubilize FLA to enable degradation by EPA505.
Though saponin shows the potential for the degradation of FLA, this aggregation
issue would necessitate the use of lower concentrations around the CMC for the
adequate removal of FLA. With these results, Tween 80 is shown to be the more
effective surfactant, but with appropriate concentrations of saponin close to its

48
CMC and under appropriate conditions, saponin could be a viable option as an
alternative for a more biodegradable and eco-friendly surfactant.
Laccase did not appear to have a significant effect on FLA degradation
over a 48-hour period. The optical density readings at 288 nm did show a
decrease with the laccase negative samples, which may indicate the potential
degradation of FLA over time; however, with the increase in optical density for
the laccase positive samples, there is a possibility of FLA degradation byproducts
being formed that emit fluorescence at 288 nm. Both sets of samples, negative
and positive for laccase, exhibited this increase, however it is more pronounced
with the laccase-positive samples. The variability among concentrations of FLA
at the initial time point at 288 nm for both runs with and without laccase was
possibly due to the influences of the surfactant for this particular run. The trend of
each concentration throughout the incubation period was still discernable despite
this variation. The FLA control showed minimal fluctuations throughout the
incubation, which would indicate FLA is not being degraded on its own, but that
EPA505 is causing this degradation with the help of Tween 80. With the HPLC
data, the 5.2-minute peak does show a loss in intensity over time for both sets of
samples; however, the presence of an additional peak at 7.0 minutes with the
laccase addition indicates a potential degradation product of FLA not seen under
normal conditions without the addition of laccase.
With the difference in intensities between the 0-hour and 48-hour time
points at the 5.2-minute peak, it appeared that the 1000 mg/L concentration of

49
Tween 80 showed the greatest potential degradation of FLA. The addition of
laccase did not appear to contribute significantly to this degradation process. It is
possible that there could be interference between the Tween 80 and laccase with
the higher concentration of Tween 80, which could attribute the lower
degradation of FLA at 2000 mg/L Tween 80.
The control runs with only surfactant showed a concentration of each
surfactant at 5.2 minutes on the HPLC chromatogram, however, the intensities
were negligible and were determined to not be an interference in the
determination of FLA degradation. Since both surfactants exhibit a peak at 5.2
minutes, this could make determining complete degradation of FLA difficult
without implementing mass spectroscopy for confirmation. Additionally, future
experiments with saponin and Tween 80 could involve a combination of these
two surfactants to determine a possible synergistic effect, increasing the potential
for FLA degradation.
Potential interferences that need to be ruled out include baseline
intensities of Tween 80 and laccase that would need to be determined through
mass spectroscopy. The identification of the 7.0-minute peak by mass
spectroscopy as a FLA degradation byproduct is important in determining the
ability of FLA degradation by EPA505 with the addition of laccase. Since the data
appeared to be inconclusive as to whether laccase had a positive effect on FLA
degradation, additional testing needs to be performed to make definitive

50
conclusions about the FLA degradation at the 5.2-minute peak and the potential
benefit of laccase in this degradation process.

51
REFERENCES
1. Superfund Remedy Report (EPA), 13th Edition, September 2010. 2. Lu, Xiao-Ying; Zhang, Tong; Fang, Herbert Han-Ping. “Bacteria-mediated
PAH degradation in soil and sediment.” Appl Microbiol Biotechnol 89 (2011): 1357–1371.
3. Moscoso, F.; Teijiz, I.; Deive, F.J.; Sanromán, M.A. “Efficient PAHs
biodegradation by a bacterial consortium at flask and bioreactor scale.” Bioresource Technology 119 (2012): 270–276.
4. Wilson, Susan C.; Jones, Kevin C. “Bioremediation of Soil Contaminated
with Polynuclear Aromatic Hydrocarbons (PAHs): A Review.” Environmental Pollution 81 (1993): 229-249.Wilso
5. Pacwa-Płociniczak, Magdalena; Płaza, Graz�yna A.; Piotrowska-Seget,
Zofia; Cameotra, Swaranjit Singh. “Environmental Applications of Biosurfactants: Recent Advances.” Int. J. Mol. Sci. 12 (2011) 633-654.
6. Makkar, Randhir S.; Rockne, Karl J. ”Comparison of Synthetic Surfactants
and Biosurfactants in Enhancing Biodegradation of Polycyclic Aromatic Hydrocarbons.” Environmental Toxicology and Chemistry 22(10) (2003): 2280–2292.
7. Franzetti, Andrea; Gandolfi, Isabella; Bestetti, Giuseppina; Banat, Ibrahim
M. “(Bio)surfactant and Bioremediation, Successes and Failures.” Trends in Bioremediation and Phytoremediation (2010): 145-156.
8. METHOD FOR EXTRACTING SUBSTANCES FROM SOAPBERRY
FRUIT AND ITS SEEDS, US Patent Application 20130130329, 05/23/2013.
9. Modified saponins isolated from Quillaja saponaria, Patent US 5443829 A,
Aug 22, 1995. 10. Roner, Michael R.; Sprayberry, Jennifer; Spinks, Matthew; Dhanji, Salima.
“Antiviral activity obtained from aqueous extracts of the Chilean soapbark tree (Quillaja saponaria Molina)”. Journal of General Virology 88 (2007): 275–285.
11. Madhavi, Vernekar; Lele, S. S. “Laccase: Properties and Applications.”
BioResources 4 (2009): 1694-1717.

52
12. Schützendübel, Andres; Majcherczyk, Andrzej; Christian, Johannes; Hüttermann, Aloys. “Degradation of fluorene, anthracene, phenanthrene, fluoranthene, and pyrene lacks connection to the production of extracellular enzymes by Pleurotus ostreatus and Bjerkandera adusta”. International Biodeterioration & Biodegradation 43 (1999): 93-100.
13. Johnsen, Anders R.; Wick, Lukas Y.; Harms, Hauke. “Principles of
microbial PAH-degradation in soil.” Environmental Pollution 133 (2005): 71-84.
14. Kästner, Matthias; Breuer-Jammali, Maren; Mahro, Bernd. “Impact of
Inoculation Protocols, Salinity, and pH on the Degradation of Polycyclic Aromatic Hydrocarbons (PAHs) and Survival of PAH-Degrading Bacteria Introduced into Soil.” Appl. Environ. Microbiol. 64(1) (1998): 359-362.
15. Allard, Ann-Sofie; Remberger, Mikael; Neilson, Alasdair H. “The negative
impact of aging on the loss of PAH components in a creosote-contaminated soil.” International Biodeterioration & Biodegradation 46 (2000): 43-49.
16. Shen, Guoqing; Lu, Yitong; Zhou, Qixing; Hong, Jingbo. “Interaction of
polycyclic aromatic hydrocarbons and heavy metals on soil enzyme.” Chemosphere 61 (2005): 1175–1182.
17. Maliszewska-Kordybach, Barbara; Smreczak, BoŜena. “Habitat function of
agricultural soils as affected by heavy metals and polycyclic aromatic hydrocarbons contamination.” Environment International 28 (2003): 719–728.
18. Park, Kap S.; Sims, Ronald C.; Doucette, William J.; Matthews, John E.
“Biological transformation and detoxification of 7,12 dimethylbenz(a)anthracene of in soil systems.” Journal (Water Pollution Control Federation) 60(10) (1988): 1822- 1825.
19. Ye, Dingyi; Siddiqi, M. Akmal; Maccubbin, Alexander E.; Kumar, Subodh;
Sikka, Harish C. “Degradation of Polynuclear Aromatic Hydrocarbons by Sphingomonas paucimobilis.” Environ. Sci. Technol. 30 (1996): 136-142.
20. Kunihiro, Marie; Ozeki, Yasuhiro; Nogi, Yuichi; Hamamura, Natsuko;
Kanaly, Robert A. “Benz[a]anthracene Biotransformation and Production of Ring Fission Products by Sphingobium sp. Strain KK22.” Appl. Environ. Microbiol. 2013, 79 (14): 4410-4420.

53
21. Husain, Saleha. “Literature Overview: Microbial Metabolism of High Molecular Weight Polycyclic Aromatic Hydrocarbons”. Remediation 18 (2) 2008: 131-161.
22. Story, SP; Parker, SH; Hayasaka, SS; Riley, MB; Kline, EL. “Convergent
and divergent points in catabolic pathways involved in utilization of fluoranthene, naphthalene, anthracene, and phenanthrene by Sphingomonas paucimobilis var. EPA505”. Journal of Industrial Microbiology & Biotechnology 26 (2001): 369–382.
23. Mueller, James G.; Chapman, Peter J.; Blattmann, Beat O.; Pritchard, P.
Hap. “Isolation and Characterization of a Fluoranthene-Utilizing Strain of Pseudomonas paucimobilis.” Appl. Environ. Microbiol. 56 (1990): 1079-1086.
24. Mueller, J.G.; Devereux, R.; Santavy, D.L.; Lantz, S.E.; Willis, S.G.;
Pritchard, P.H. “Phylogenetic and physiological comparisons of PAH-degrading bacteria from geographically diverse soils.” Antonie van Leeuwenhoek 71 (1997): 329-343.
25. Talley, Jeffrey W.; Bajpai, Rakesh; Conway, Richard; Averett, Daniel E.;
Davis, Jeffrey L.; Felt, Deborah R.; Nestler, Catherine C., editors. “Federal Integrated Biotreatment Research Consortium (FIBRC): Flask to Field Initiative”. U.S. Army Corps of Engineers, Engineer Research and Development Center. October 2002.
26. Rosen, Milton J. “Micelle Formation by Surfactants.” Surfactants and
Interfacial Phenomena 3rd Edition (2004): 109. 27. Xu, Qingyi; Mitsutoshi Nakajima; Zengshe Liu; Takeo Shiina.
“Biosurfactants for Microbubble Preparation and Application.” Int. J. Mol. Sci. 12 (2011) 462-475.
28. Güçlü-üstündağ, Özlem; Giuseppe Mazza. “Saponins: Properties,
Applications and Processing.” Critical Reviews in Food Science and Nutrition 47 (2007): 231–258.
29. Megharaj, Mallavarapu; Ramakrishnan, Balasubramanian; Venkateswarlu,
Kadiyala; Sethunathan, Nambrattil; Naidu, Ravi. “Bioremediation approaches for organic pollutants: A critical perspective.” Environment International 37 (2011): 1362-1375.

54
30. Volkering, Frank; Breure, Anton M.; Van Andel, Johan G.; Rulkens, Wim H. “Influence of Nonionic Surfactants on Bioavailability and Biodegradation of Polycyclic Aromatic Hydrocarbons". Appl. Environ. Microbiol. 61(5) 1995: 1699–1705.
31. http://toxnet.nlm.nih.gov/cgi-
bin/sis/search/a?dbs+hsdb:@term+@DOCNO+4359, revised10/15/2010. 32. www.vaccinesafety.edu/components-Influenza-Afluria-Flublok.htm,
revised 02/12/2014. 33. www.vaccinesafety.edu/components-DTaP-Hib.htm, revised 6/2013. 34. Lee, Kenneth. “Degradation of Dispersants and Dispersed Oil”. Centre for
Offshore Oil, Gas, and Energy Research, Fisheries and Oceans Canada. 35. Resnik, Silvia. Quillaia Extracts Type 1 and Type 2. Chemical and
Technical Assessment (CTA). FAO, 61st JECFA (2004). 36. Maity, Jyoti Prakash; Huang, Yuh Ming; Hsu, Chun-Mei; Wu, Ching-I;
Chen, Chien-Cheng; Li, Chun-Yi; Jean, Jiin-Shuh; Chang, Young-Fo; Chen, Chen-Yen. “Removal of Cu, Pb and Zn by foam fractionation and a soil washing process from contaminated industrial soils using soapberry-derived saponin: A comparative effectiveness assessment”. Chemosphere 92 (2013): 1286–1293.
37. Chen, Wen-Jang; Hsiao, Lai-Chun; Chen, Karen Kai-Yun. “Metal
desorption from copper(II)/nickel(II)-spiked kaolin as a soil component using plant-derived saponin biosurfactant”. Process Biochemistry 43(5) 2008: 488–498.
38. Strong, P. J.; Claus, H. “Laccase: A Review of Its Past and Its Future in
Bioremediation”. Critical Reviews in Environmental Science and Technology 411 (2011): 373--434.
39. Cañas, Ana I.; Alcalde, Miguel; Plou, Francisco; Jesús Martínez, Maria;
Martínez, Ángel T.; Camarero, Susana. ”Transformation of Polycyclic Aromatic Hydrocarbons by Laccase Is Strongly Enhanced by Phenolic Compounds Present in Soil”. Environ. Sci. Technol. 41(2007): 2964-2971.
40. Cerniglia, CE. “Fungal metabolism of polycyclic aromatic hydrocarbons:
past, present and future applications in bioremediation.” Journal of Industrial Microbiology & Biotechnology 19 (1997): 324–333.

55
41. Eggen, Trine; Sveum, Per. “Decontamination of aged creosote polluted soil: the influence of temperature, white rot fungus Pleurotus ostreatus, and pre- treatment”. International Biodeterioration & Biodegradation 43 (1999): 125-133.
42. Brijwani, Khushal; Rigdon, Anne; Vadlani, Praveen V. “Fungal Laccases:
Production, Function, and Applications in Food Processing.” Enzyme Research 2010: 1-10.
43. Camarero, Susana; Cañas, Ana I.; Nousiainen, Paula; Record, Eric;
Lomascolo, Anne; Jesús Martínez, María; Martínez, Ángel T. “p-Hydroxycinnamic Acids as Natural Mediators for Laccase Oxidation of Recalcitrant Compounds”. Environ. Sci. Technol. 42 (2008): 6703–6709.
44. Osma, Johann F.; Toca-Herrera, José L.; Rodríguez-Couto, Susana.
“Uses of Laccases in the Food Industry”. Enzyme Research 2010: 1-8. 45. Johannes, Christian; Majcherczyk, Andrzej. “Laccase activity tests and
laccase inhibitors”. Journal of Biotechnology 78 (2000): 193–199. 46. Chen, Shicheng; Ma, Dengbo; Ge, Wei; Buswell, John A. “Induction of
laccase activity in the edible straw mushroom, Volvariella volvacea. FEMS Microbiology Letters 218 (2003): 143-148.
47. Atlas, Ronald; Parks, Lawrence. “Mineral Medium, pH 7.25”. Handbook of
Microbiological Media (3rd ed). Boca Raton: CRC, 2004, p. 1165. 48. http://www.labome.com/method/Detergents-Triton-X-100-Tween-20-and-
More.html. Revision 02/03/2014.