antimicrobial activities of saponin-rich guar meal …
TRANSCRIPT

ANTIMICROBIAL ACTIVITIES OF SAPONIN-RICH GUAR MEAL EXTRACT
A Dissertation
by
SHERIF MOHAMED HASSAN
Submitted to the Office of Graduate Studies of
Texas A&M University in partial fulfillment of the requirements for the degree of
DOCTOR OF PHILOSOPHY
May 2008
Major Subject: Poultry Science

ANTIMICROBIAL ACTIVITIES OF SAPONIN-RICH GUAR MEAL EXTRACT
A Dissertation
by
SHERIF MOHAMED HASSAN
Submitted to the Office of Graduate Studies of Texas A&M University
in partial fulfillment of the requirements for the degree of
DOCTOR OF PHILOSOPHY
Approved by: Chair of Committee, Aubrey L. Cartwright Committee Members, Christopher A. Bailey
James A. Byrd Michael E. Hume
Head of Department, John B. Carey
May 2008
Major Subject: Poultry Science

iii
ABSTRACT
Antimicrobial Activities of Saponin-Rich Guar Meal Extract. (May 2008)
Sherif Mohamed Hassan, B.S.; M.S., Suez Canal University
Chair of Advisory Committee: Dr. Aubrey Lee Cartwright
Three saponin-rich extracts (20, 60, 100% methanol), four 100% methanol sub-
fractions and seven independently acquired fractions (A-G) from guar meal, Cyamopsis
tetragonoloba L. (syn. C. psoraloides), were evaluated for antimicrobial and hemolytic
activities. These activities were compared against quillaja bark (Quillaja saponaria),
yucca (Yucca schidigera), and soybean (Glycine max) saponins in 96-well plates using
eight concentrations (0.01 to 1.0 and 0.1 to 12.5 mg extract/mL). Initial guar meal
butanol extract was 4.8 ± 0.6% of the weight of original material dry matter (DM).
Butanol extract was purified by preparative reverse-phase C-18 chromatography. Two
fractions eluted with 20, and one each with 60, and 100% methanol with average yields
of 1.72 ± 0.47, 0.88 ± 0.16, 0.91 ± 0.16 and 1.55 ± 0.15% of DM, respectively. Further
purification of the 100% methanol fraction using normal-phase silica gel preparatory
high pressure liquid chromatography eluted 4 peaks at 16, 39, 44 and 46 min. Only the
100% methanol fraction, its 16 min peak, F and G fractions, and quillaja saponin,
exhibited both hemolytic and antibacterial activities against Staphylococcus aureus,
Salmonella Typhimurium and E. coli, but 20 and 60% methanol fractions stimulated
Lactobacillus spp. growth. Guar meal (0 or 5%) was added to diets fed to chicks from 1

iv
to 21 days of age. Chicks fed both diets were unchallenged or challenged with 5 x 10³
Eimeria tenella sporulated oocysts at 10 days. Guar meal diets reduced oocysts shed per
gram of feces, body weight, and feed efficiency. Adding 2.5% guar meal, 1% guar gum,
or 0.125% saponin-rich guar meal extract to diets fed to chicks to 21 days of age showed
that guar meal increased the cfu concentrations of digesta more than controls following a
challenge with 107 cfu of Clostridium perfringens at 14 days. Body weights of chicks fed
guar meal and saponin-rich extract were significantly lower than control body weights at
21 days of age, whereas the weekly feed to gain ratio of chicks fed saponin-rich extract
was higher than controls. Guar meal reduced severity of Eimeria tenella infection and
guar saponin-rich extract exhibited antimicrobial activity against several common
poultry pathogens.

v
DEDICATION
My love and gratitude is expressed to my parents, my wife and my entire family
for their continued encouragement, support, and sacrifices throughout my educational
pursuits and daily life.

vi
ACKNOWLEDGEMENTS
My sincere appreciation is expressed to: Dr. A. L. Cartwright and Dr.
Christopher A. Bailey for their many hours of counsel, guidance, advice, support,
endless encouragement, time and instruction throughout the course of this research.
Their shared wisdom and insight concerning education and life are greatly appreciated.
Gratitude and appreciation are extended to Dr. James A. Byrd, Dr. Michael E.
Hume and Dr. Jack L. McReynolds for their assistance, suggestions and comments
during experiments and the preparation of this dissertation.
Thanks also go to my colleagues, department faculty and staff for making my
time at Texas A&M University a great experience. I also want to extend my gratitude to
Dr. Akram Haq for his help in isolation and purification and Dr. Mark Berhow for his
help in the identification of the guar saponin.
Special thanks and sincere appreciation are extended for the hard work and
assistance of Mr. Omar Gutierrez, Mrs. Denise Caldwell and Mrs. Elizabeth M.
Hirsschler and the entire staff of the Texas A&M Poultry Research Center. Their
assistance, suggestions, and advice were indispensible. The friendships I made while at
Texas A&M University are cherished.
Most importantly, I express my love and gratitude to my parents, my wife, my
children and the entire family for their patience, love, continual encouragement, support,
sacrifices and prayers throughout my educational pursuits and daily life.

vii
TABLE OF CONTENTS
Page
ABSTRACT .............................................................................................................. iii
DEDICATION .......................................................................................................... v
ACKNOWLEDGEMENTS ...................................................................................... vi
TABLE OF CONTENTS .......................................................................................... vii
LIST OF FIGURES ................................................................................................... ix
LIST OF TABLES .................................................................................................... x
CHAPTER
I INTRODUCTION ............................................................................... 1
II LITERATURE REVIEW ..................................................................... 4
Pathogenic Bacterial and Coccidial Diseases ................................. 4 Antibiotic Resistance Is a Growing Problem ................................. 15 Saponin as an Antibiotic Alternative ............................................. 19 Guar Meal Is a Saponin-Rich Legume ........................................... 43 Research Description ...................................................................... 50
III ANTIMICROBIAL AND HEMOLYTIC ACTIVITIES OF SAPONIN-RICH EXTRACTS FROM GUAR MEAL .......................................... 53
Introduction .................................................................................... 53 Materials and Methods ................................................................... 55 Results and Discussion ................................................................... 64 Summary and Conclusions ............................................................. 82 IV ANTIMICROBIAL AND HEMOLYTIC ACTIVITIES DIFFER AMONG SAPONIN-RICH EXTRACTS FROM GUAR, QUILLAJA,
YUCCA AND SOYBEAN .................................................................. 84 Introduction .................................................................................... 84
viii
CHAPTER Page
Materials and Methods ................................................................... 86 Results and Discussion ................................................................... 88 Summary and Conclusions ............................................................. 100
V GUAR MEAL AMELIORATES EFFECTS OF EIMERIA TENELLA CHALLENGE IN BROILER CHICKS ............................................... 101
Introduction .................................................................................... 101 Materials and Methods ................................................................... 103 Results and Discussion ................................................................... 106 Summary and Conclusions ............................................................. 114
VI ANTIBACTERIAL ACTIVITIES OF GUAR MEAL, GUAR GUM AND SAPONIN-RICH GUAR MEAL EXTRACTS AGAINST CLOSTRIDIUM PERFRINGENS IN CHICKENS .............................. 115
Introduction .................................................................................... 115 Materials and Methods ................................................................... 118 Results and Discussion ................................................................... 123 Summary and Conclusions ............................................................. 132
IV SUMMARY AND CONCLUSIONS ................................................... 134
REFERENCES .......................................................................................................... 137
VITA ......................................................................................................................... 179
ix
LIST OF FIGURES
FIGURE Page
1 Skeletal types of aglycone found in the three principal classes of saponin 20 2 Steroid saponins differ in sugar side chain structure and position (R1 and R2) on the aglycone nucleus .......................................................... 27 3 Triterpenoid saponins differ in sugar side chain structure and position (R1 to R5) on the aglycone nucleus ............................................................. 28 4 Example elution profile of reverse-phase C-18 flash chromatography of
saponin-rich guar meal n-butanol extract. Fractions eluted at 20%, 60% and 100% methanol, respectively ............................................................... 57
5 Example analytical HPLC chromatography of guar fraction (F) from Dr. Mark Berhow .............................................................................................. 71

x
LIST OF TABLES
TABLE Page 1 Hemolytic activity of saponin-rich guar meal extract separated into 20, 60 and 100% methanol fractions following reverse-phase C-18
chromatography .......................................................................................... 67 2 Hemolytic activity of four sub-fractions following normal-phase preparative HPLC of the 100% methanol fraction ..................................... 68 3 Hemolytic activity of seven fractions of guar meal eluted by flash
reverse-phase C-18 chromatography .......................................................... 70 4 Minimal inhibitory concentration (MIC) of antibacterial activity of
reverse-phase 20, 60 and 100% methanol saponin-rich guar meal extracts against Staphylococcus aureus, Lactobacillus spp., Escherichia coli and Salmonella Typhimurium ......................................................................... 73
5 Antimicrobial activity against Staphylococcus aureus of reverse-phase 20, 60 and 100% methanol saponin-rich guar meal extracts ...................... 74
6 Antimicrobial activity against Lactobacillus spp. of reverse-phase 20, 60 and 100% methanol saponin-rich guar meal extracts ................................. 75 7 Antimicrobial activity against Escherichia coli of reverse-phase 20, 60 and 100% methanol saponin-rich guar meal extracts ....................................... 76
8 Antimicrobial activity against Salmonella Typhimurium of reverse-phase 20, 60 and 100% methanol saponin-rich guar meal extracts ...................... 77 9 Antimicrobial activity against Staphylococcus aureus of normal-phase 16,
39, 44 and 46 min sub-fractions of 100% methanol saponin-rich guar meal extract ......................................................................................................... 78
10 Antimicrobial activity against Salmonella Typhimurium of normal-phase
16, 39, 44 and 46 min sub-fractions of 100% methanol saponin-rich guar meal extract ................................................................................................ 79
11 Antimicrobial activity against Escherichia coli of normal-phase 16,
39, 44 and 46 min sub-fractions of 100% methanol saponin-rich guar meal extract ................................................................................................ 80

xi
TABLE Page 12 Hemolytic activities of reverse-phase 100% methanol saponin-rich guar
meal extract and solutions of saponins prepared from commercial extracts of quillaja, yucca and soybean ................................................................... 90
13 Minimal inhibitory concentration (MIC) of antibacterial activity of reverse-
phase 100% methanol guar meal extract and solutions of saponins prepared from commercial extracts of quillaja, yucca and Demographics soybean on Staphylococcus aureus, Salmonella Typhimurium and Escherichia coli cultures ....................................................................................................... 94
14 Antimicrobial activities against Staphylococcus aureus of reverse-phase
100% methanol guar meal extract and solutions of saponins prepared from commercial extracts of quillaja, yucca and soybean ......................... 95
15 Antimicrobial activities against Salmonella Typhimurium of reverse-
phase100% methanol guar meal extract and solutions of saponins prepared from commercial extracts of quillaja, yucca and soybean ......................... 96
16 Antimicrobial activities against Escherichia coli of reverse-phase 100%
methanol guar meal extract and solutions of saponins prepared from commercial extracts of quillaja, yucca and soybean .................................. 97
17 Composition of broiler chicken starter diets containing either 0 or 5%
guar meal Growth of Bilingual Students Experimental Group .................. 104 18 Effects of guar meal diet on oocyst per gram of feces shed from chickens
challenged with Eimeria tenella at 10 d of age .......................................... 107
19 Bloody feces score recorded from 4 to 7 d post challenge in chicks unchallenged and challenged with Eimeria tenella and fed either a 0 or 5% guar meal diet ............................................................................................. 108
20 Weekly body weights, body weight gains, feed conversion ratio and mortality of chicks unchallenged or challenged with Eimeria tenella and fed either a 0 or 5% guar meal diet until 3 wk of age ................................ 110
21 Composition of a control (C) starter broiler chicken diet and diets containing either 2.5% guar meal (GM), 1.0% guar gum (GG), or 0.125% saponin-rich guar meal extract (GS) .................................................................................. 120

xii
TABLE Page
22 Duodenal lesion scores and colony forming units (cfu) of duodenal contents from chicks unchallenged (NC) or challenged with Clostridium perfringens and fed a positive control (PC), 2.5% guar meal (GM), 1% guar gum (GG), or 0.125% saponin-rich guar meal extract (GS) diet .......... 126
23 Feed intake, feed conversion ratio and mortality rate for chicks
unchallenged (NC) or challenged with Clostridium perfringens and fed a positive control (PC), 2.5% guar meal (GM), 1% guar gum (GG), or 0.125% saponin-rich guar meal extract (GS) diet .................................. 127
24 Weekly body weight and body weight gain for chicks unchallenged (NC) or
challenged with Clostridium perfringens and fed a positive control (PC), 2.5% guar meal (GM), 1% guar gum (GG), or 0.125% saponin-rich guar
meal extract (GS) diet ................................................................................ 128

1
CHAPTER I
INTRODUCTION
Antibiotics have been used extensively in animal feed to stimulate growth rate
and to inhibit growth of intestinal pathogens. However, continued feeding of antibiotics
at sub-therapeutic levels has created concerns about the development of drug resistant
bacteria, reduced ability to cure bacterial infections in humans, and antibiotic residue in
food (Jensen, 1998). Antibiotics used in animal production are no longer desirable
because of concerns about increasing antibiotic resistant pathogenic microorganisms in
both veterinary and human medicine (Nawaz et al., 2000; Bertolatti et al., 2003;
Wallace, 2004).
Increased awareness of potential problems associated with the use of antibiotics
as feed additives stimulated research efforts to identify alternatives to their use. Some
antibiotic alternative products such as probiotics, prebiotics (Murry et al., 2004), organic
acids (Van Immerseel et al., 2006) and medicinal herbs (Wink, 1999; Gordon and David,
2001; Du and Hu, 2004; Arab et al., 2006) have been used to treat or prevent diseases.
Original candidate chemical structures for many pharmaceutical compounds used to
promote human health originated from chemicals found in plant extracts (Du and Hu,
2004; Arab et al., 2006). Among these plant compounds are saponins from quillaja and
yucca which have several beneficial effects on animal health (Sen et al, 1998b; Avato et
__________________ This dissertation follows the style of Poultry Science.
2
al., 2006). Saponins are glycoside compounds distributed in many plants (Price et al.,
1987; Mahato et al., 1988; Shimoyamada et al., 1990), lower marine animals and some
bacteria (Riguera, 1997). The chemical structures of saponins consist of a fat-soluble
nucleus (aglycone) that is either a triterpenoid (C-30) or steroid (C-27) attached with one
or more sugar side chains (glycone) at different carbon sites of the aglycone. Saponins
have many biological properties, among them are hemolytic (Fukuda et al., 1985; Khalil
and El-Adawy, 1994; Woldemichael and Wink, 2001), antibacterial (Mahato et al.,
1982; Sen et al., 1998b; Avato et al., 2006; Hassan et al., 2007) and antiprotozoal
activities (Mshvildadze et al., 2000).
Guar (Gyamopsis tetragonoloba) is saponin-rich plant that contains 5-13%
saponin by weight of dry matter (Curl et al., 1986; Hassan et al., 2007). Guar is a
drought tolerant annual legume mainly grown for the guar gum (galactomannan
polysaccharide) that has many industrial and food processing applications. Guar meal is
a combination of hull and germ fractions that is produced as a by-product of guar gum
manufacture. In addition, guar meal contains 33-47.5% crude protein (Ambegaokar et
al., 1969) that makes it potentially useful as an ingredient for poultry feed (Lee et al.,
2003a, b; 2005). Guar meal also contains 13-18% residual galactomannan gum (Bakshi
et al., 1964; Lee et al., 2004). Guar meal has characteristics of a useful feeding
ingredient that could also have antimicrobial activity because of galactomannan and
saponin content. Guar seed contains both saponin and galactomannan polysaccharides
which could be of use as natural antibacterial compounds (Hussain and Cheeke, 1995;
Tanaka et al., 1996; Sen et al., 1998b; Van Nevel et al., 2005).

3
The most predominant pathogenic bacterial and protozoal groups in chickens
include Staphylococcus aureus (Huys et al., 2005a, b), Escherichia coli (Turtura et al.,
1990), Salmonella Typhimurium (Foley et al., 2007), Clostridium perfringens (Van
Immerseel et al., 2004), and Eimeria tenella (Shirley, 1986; Williams, 1998, 1999;
2005). The treatment and prevention of bacterial and protozoal diseases are costly to the
poultry industry. Shane and Van der Sluis (2002) estimated that the cost of control
methods of all infectious disease in poultry in the USA could amount to almost $3
billion per annum. Research has evaluated neither the hemolytic nor antimicrobial
activities of saponin-rich guar meal extracts. Therefore, the objectives of this research
were to isolate saponin-rich extract from guar meal to determine in vitro antibacterial
activities against relevant gram-positive bacteria (Staphylococcus aureus, Clostridium
perfringens and Lactobacillus spp.) and gram-negative bacteria (Salmonella
Typhimurium and Escherichia coli) in a dose dependent manner. Also, anticoccidial and
anti-Colstridium perfringens activities were evaluated in vivo by adding guar meal,
purified guar gum or saponin-rich extracts to feed of chicks challenged with the disease
organisms.

4
CHAPTER II
LITERATURE REVIEW
Pathogenic Bacterial and Coccidial Diseases
Bacterial and protozoal diseases cause significant economic loses in the poultry
industry. Shane and Van der Sluis (2002) estimated that the cost of control methods for
infectious disease in poultry in the USA could amount to almost $3 billion per annum.
Smith (1965) reported that the first organisms to colonize the alimentary tract of most
animals, including the chick, are Escherichia coli, Salmonella spp., Clostridium
perfringens, and Streptococci. These bacteria are also major food borne pathogens
associated with processed poultry that cause severe illness and even death in humans
(Tauxe, 1991).
This dissertation is focused on the most predominant pathogenic bacterial and
protozoal groups that include Staphylococcus aureus (Huys et al., 2005a, b), Salmonella
Typhimurium (Foley et al., 2007), Escherichia coli (Turtura et al., 1990), Clostridium
perfringens (Van Immerseel et al., 2004) Eimeria tenella (Shirley, 1986; Williams,
1998; 1999; 2005) and one beneficial bacterium (Lactobacillus spp.).
Staphylococcus aureus
Staphylococcus aureus is a gram-positive facultative anaerobe and opportunistic
pathogen. Enterotoxin-producing Staphylococcus aureus is the most common cause of
food-borne human illness throughout the world (Do Carmo et al., 2004; Le Loir et al.,

5
2003). Staphylococcus aureus produces hyaluronidase that destroys tissues and also
produces coagulase enzyme that causes clot formation (Ryan and Ray, 2004) and can
cause bumblefoot in chickens. Staphylococcus aureus infections can be spread through
contact with pus from an infected wound, skin-to-skin contact and contact with objects
such as towels, sheets, clothing, or athletic equipment. Staphylococcus aureus frequently
resides on the skin, in the nose, and in bone, joint and endovascular wound infections.
Approximately 20–37.2% of the general human population is Staphylococcus carriers
(Kluytmans et al., 1997; Heyman, 2004).
Staphylococcus aureus causes disease problems such as septicaemia and skeletal
infections in commercial broiler chickens (Jordan and Pattison, 1996). Bacterial
chondronecrosis of the proximal end of the femur and/or tibiotarsus, associated mainly
with Staphylococcus aureus, was identified as the predominant cause of lameness in two
commercial broiler chicken flocks (McNamee et al., 1998). It is a significant cause of
avian disease and may thus contaminate carcasses processed for food (Mead and Dodd,
1990).
While Staphylococci commonly occur on the skin and nasopharynx of healthy
poultry (Mead and Dodd, 1990), it is primarily Staphylococcus aureus which can
survive, colonize, and persist at various processing stages in commercial poultry
processing plants due to the expression of various key properties, including adhesion
(Chaffey and Waites, 1987; Mead et al., 1995) and chlorine resistance (Dodd et al.,
1988; Huys et al., 2005a, b). The poultry processing plants are favorable environments
for the survival and transmission of various commensal, spoilage, and potentially
6
pathogenic bacteria in the human food chain (Huys et al., 2005a, b). Staphylococci are
one of the most predominant bacterial species encountered during poultry slaughter and
processing. They have been recovered from air samples (Ellerbroek, 1997), neck skin of
chicken carcasses (Geornaras et al., 1995; Olivier et al., 1996), and equipment and
machinery surfaces (Geornaras et al., 1995; Huys et al., 2005a, b).
The foods that most frequently cause Staphylococcus aureus food poisoning are
red meat and poultry and their products (Balaban and Rasooly, 2000; Genigeorgis, 1989;
Kitai et al., 2005; Wieneke et al., 1993). In the UK, 53% of the staphylococcal food
poisoning cases reported between 1969 and 1990 were due to meat products and meat-
based dishes, and 22% of the cases were due to poultry and poultry-based meals (Le Loir
et al., 2003; Wieneke et al., 1993).
Salmonella spp.
Salmonella is a gram-negative facultative rod-shaped bacterium in the same
family as Escherichia coli (Enterobacteriaceae or enteric bacteria) that live in the
intestinal tracts of warm and cold blooded animals. Since Daniel E. Salmon discovered
the first strain of Salmonella (Salmonella choleraesuis) in 1885 (Salmon and Smith,
1886), the number of strains technically termed serotypes or serovars of Salmonella
known to cause salmonellosis has increased to over 2,300. Currently, genus Salmonella
infections rank second to genus Campylobacter as the major causes of food-borne
infections. Salmonellosis is the most frequent disease caused by Salmonella in the USA,
and is the second most common food-borne illness in humans worldwide (Feng, 1992;

7
Aabo et al., 1995; Tietjen and Fung, 1995; Whyte et al., 2002). The predominance of this
genus has caused increased public awareness and consumer apprehension when
purchasing poultry products.
Salmonella can be found in virtually every part of the world and carried by an
extremely wide variety of hosts including humans and other mammals, birds, reptiles,
and insects (Austin and Wilkins, 1998; Gast, 1997; Kusters et al., 1993; Sato et al.,
1999). Salmonella are responsible for a variety of acute and chronic diseases in both
poultry and humans. In humans, Salmonella are the cause of two diseases called
salmonellosis: 1) enteric fever (Salmonella Typhimurium is the strain that causes
typhoid fever) resulting from bacterial invasion of the bloodstream, and 2) acute
gastroenteritis, resulting from a food-borne infection/intoxication. Salmonella spp.
infections continue to plague the poultry industry and cause substantial losses in
productivity. Infected poultry products are among important sources for food-borne
outbreaks in humans. Salmonella spp., among them Salmonella Typhimurium, have long
been major causative agents of food-borne infection and has been a concern of the
poultry industry. Salmonella spp. has been focus of numerous scientific investigations
aimed at eliminating the bacterium (Slutsker et al., 1998).
Although the Salmonella serotypes most significant in human disease are not
pathogenic to poultry. These serotypes remain important as a contaminant of poultry as
food. A 1991 survey of poultry in the Netherlands reported that fecal samples from 94%
of meat-type broilers, 86% of 406 layer houses and 47% of egg-type layer flocks were
Salmonella positive (Edel, 1994; Van de Giessen et al., 1991). Similarly, in 1994, 53%

8
of flocks tested from either fecal or egg belt sampling in Canada were positive for
Salmonella spp. (Poppe et al., 1991). In studies of pooled cecal samples from egg-layers
in southern USA detected Salmonella in 100% of the flocks (Waltman et al., 1992; Ebel
et al., 1992).
According to the Centers for Disease Control and Prevention, Salmonella affects
about 1.4 million people each year with about 20,000 hospitalizations and 500 deaths
annually in the USA (Mead et al., 1999). In 1996, the United States Department of
Agriculture, Economic Research Service estimated that the total costs for medical care
and lost productivity, resulting from food-borne Salmonella infections of humans was
between 0.6–3.5 billion dollars annually (USDA, 1996). The USA annual salmonellosis
burden was estimated to be about 1.5 million cases (including over 580 deaths), 95% of
these cases were attributed to food-borne infection (Mead et al., 1999). Other costs
associated with Salmonella include various direct expenses producers face as a
consequence of Salmonella infection in their flocks. Moreover, Salmonella
contamination of food products can significantly reduce consumer demand and affect
producer profits (Myint, 2004).
The prevalence of Salmonella spp. in poultry has prompted implementation of
antibiotic regimens designed to eliminate Salmonella with antibiotics often being
administered in the feed as growth promoters (Moellering, 1998; Cruchaga et al., 2001;
Kramer et al., 2001). These practices have evolved bacterial strains exhibiting antibiotic
resistance to all known antibiotics (Rubin and Weinstein, 1977; Levy et al., 1987;
Aarestrup, 1999; Witte et al., 2000). The growing global concern over antibiotic

9
resistance and the stigma of Salmonella spp. associated with poultry has resulted in
increased research efforts designed to eliminate Salmonella spp. infections.
Escherichia coli
Escherichia coli bacteria were discovered in the human colon in 1885 by German
bacteriologist Dr. Theodor Escherich who demonstrated that certain strains of bacteria
were responsible for infant diarrhea and gastroenteritis (Feng et al., 2002). Escherichia
coli are gram-negative, facultative bacteria which grow either aerobically or anerobically
(Abrams, 1983; Mason and Richardson, 1981; Furth and Guiot, 1989; Neidhardt et al.,
1990), and are commonly found in the lower intestine of warm-blooded animals such as
chickens, deer, sheep, and pigs (Vogt and Dippold, 2005).
Enteritis caused by Escherichia coli (colibacilliosis) is an important disease in
the poultry industry because of increased mortality and decreased performance (Barnes
et al., 2003). Escherichia coli is able to produce Shiga-like toxins, or verotoxins that
inhibit protein synthesis in eukaryotic cells, and play a role in hemorrhagic colitis and
hemolytic uremic syndrome by causing damage to endothelial cells in the kidneys,
pancreas, brain, and other organs (Griffin and Tauxe, 1991).
Escherichia coli were first recognized as a food-borne pathogen associated with
consumption of hamburgers from a fast food chain restaurant (Riley et al., 1983). In the
ten years that followed, approximately thirty Escherichia coli outbreaks were recorded
in the USA. The Centers for Disease Control and Prevention (CDC) based on a 1999
estimated 73,000 cases of Escherichia coli infections occur annually in the USA (CDC,

10
2006). Every year, 2,100 Americans are hospitalized, and 61 people die as a direct result
of Escherichia coli infections.
The majority of food-borne illness outbreaks associated with Escherichia coli
have involved ground beef, unpasteurized apple and orange juice (Cody et al., 1999),
unpasteurized milk, alfalfa sprouts, lettuce, and contaminated water (Friedman et al.,
1999). A study on the prevalence of Escherichia coli in livestock at 29 county and 3
large state agricultural fairs in the USA found that Escherichia coli could be isolated
from 13.8% of beef cattle, 5.9% of dairy cattle, 3.6% of pigs, 5.2% of sheep, and 2.8%
of goats (Keen et al., 2003). The estimated annual cost of Escherichia coli illnesses are
$405 million (Frenzen et al., 2005). Costs contributing to this estimate included $370
million for premature deaths, $30 million for medical care, and $5 million for lost
productivity.
Escherichia coli resistance against many known antibiotics has been reported
(Gupta et al., 2001; Pitout et al., 2005; Garau et al., 1999; Johnson et al., 2006). One
suspected source of drug-resistant Escherichia coli in humans is the use of antimicrobial
drugs in agriculture food production (Linton, 1977; Jones and Schaffner, 2005;
Collignon and Angulo, 2006). Supporting this hypothesis is the high prevalence of
antimicrobial drug–resistant Escherichia coli in retail meat products, especially poultry
(Johnson et al., 2003; Johnson et al., 2005a, b; Schroeder et al., 2003).

11
Clostridium perfringens
Clostridium perfringens is a gram-positive, spore-forming anaerobic bacterium
that is ubiquitous in the environment, including water, soil, workers clothing and boots
(Willis, 1977). Clostridium perfringens is often found in relatively small numbers (< 104
cfu) in the gastrointestinal tract (GIT) of most bird species (Johansson and Sarles, 1948;
Shapiro and Sarles, 1949; Gazdzinski and Julian, 1992; Branton et al., 1997; Asaoka et
al., 2004) as a normal inhabitant of gut microflora of many animals (Smith, 1965).
Clostridium perfringens may be found in the crop, gizzard, small intestine and ceca. The
presence of Clostridium perfringens does not lead directly to necrotic enteritis (NE)
disease. Although 75-95% of birds are colonized by Clostridium perfringens, only a
small proportion of these ever show symptoms of NE disease.
Necrotic enteritis in poultry is associated with α-and β-toxin producing
Clostridium perfringens strains type A or C (Van Immerseel et al., 2004). All strain
types (A-E) of Clostridium perfringens bacterium contain the α-toxin (McDonel, 1986;
Songer, 1996; Petit et al., 2001). Clostridial β-toxin induces hemorrhagic necrosis of the
intestinal mucosa (Baba et al., 1992). Necrotic enteritis affects a variety of bird species
(Cowen et al., 1987) such as chickens (Broussard et al., 1986), turkeys (Gazdzinski and
Julian, 1992; Droual et al., 1995) and quail (Berkhoff, 1985).
Necrotic enteritis was first reported in a flock of 6-7 week-old cockerels in
England (Parish, 1961). Chickens from 2-24 weeks of age are affected (Schwartz, 1988;
Ficken, 1991) with the most common incidence at 2.5-3 weeks of age between July to
October (Long, 1973; Ross, 1999). Many factors are attributed to NE induction such as

12
diet composition (Smith, 1965; Nairn and Bamford, 1967), high levels of fish meal
(Johnson and Pinedo, 1971; Truscott and Al-Sheikhly, 1977) or wheat (Branton et al.,
1987; 1997).
The first indications that birds may be suffering from NE are huddling, ruffled
feathers, depression in growth rate, and diarrhea followed by an increase in mortality
rates (Porter, 1998). Necrotic enteritis symptoms can be divided into sub-clinical and
clinical categories. Sub-clinical symptoms include depression in appetite, feed efficiency
and growth rate (Kaldhusdal and Hofshagen, 1992; Porter, 1998; Lovland and
Kaldhusdal, 2001). Clinical symptoms include inappatence, diarrhea and severe necrosis
of the intestinal tract that ultimately can lead to mortality (Ficken and Wages, 1997).
Upon examination of the gastrointestinal tract and associated organs of affected
birds, gross lesions usually are found in the jejunum and ileum. The proximate small
intestine and ceca show less evidence of lesions, but may be distended by gas and
bloody fluids (Frame and Bickford, 1986). The intestinal mucosa may be covered with a
layer of fibrino-necrotic material (Porter, 1998).
Necrotic enteritis has high economic and animal welfare costs. The disease has
become increasingly prevalent in the European Union due to factors such as the use of
diets often containing wheat, and the removal of antibiotic growth promoters and animal
by-products from diet formulations. Necrotic enteritis costs producers as much as 5 cents
per bird in the USA (Van der Sluis, 2000). Estimates of NE incidence vary from 1-40%
of commercial broiler flocks in North America and the European Union (Kaldhusdal and

13
Skjerve, 1996; Kaldhusdal and Lovland, 2000; Annett et al., 2002). New preventatives
and treatments for NE are needed.
Eimeria tenella
Avian coccidiosis (genus Eimeria) is a disease with an estimated $800 million
worldwide cost for treatments employed to prevent the disease in poultry industry
(Williams, 1998). The economic impact is much higher due to its negative effects of
coccidiosis on the productive performance of poultry. Although, seven species of
Eimeria (Eimeria acervulina, Eimeria brunetti, Eimeria maxima, Eimeria mitis, Eimeria
necatrix, Eimeria praecox, and Eimeria tenella) infect chickens, Eimeria tenella is the
most prevalent species found in the USA poultry operations. Eimeria tenella causes high
incidence and high mortality (50-70%) coccidiosis in poultry leading to significant
economic losses (Williams, 1999). This protozoan parasite exists and is spread as a
highly resistant oocyst in litter (Shirley, 1986). Currently, antiprotozoal chemical feed
additives are the most widely used means of controlling Eimeria in chickens (Pogonka et
al., 2003). While effective for avian coccidiosis, continuous use and misuse of
anticoccidial drugs have led to the emergence of drug resistant strains (Long, 1982).
Drug resistance in coccidial populations is a constant threat to the continued success of
prophylactic chemotherapy.

14
Lactobacillus spp.
Lactobacillus spp. are gram-positive, non-spore-forming, rods that produce lactic
acid (Ayres et al., 1980). The genus Lactobacillus is the largest of the lactic acid
producing bacteria or LAB genera. Lactobacilli are the most acid-tolerant of the LAB
which produce antimicrobial concentrations of lactic acid. They can grow well under
both microaerophic to anaerobic conditions (Neidhardt et al., 1990). They produce lactic
acid as the major end product during fermentation of carbohydrates (Brock et al., 1994).
Bacteriocins, which inhibit growth of other bacteria, are proteinaceous compounds
produced by a large and diverse group of Lactobacillus spp. Bacteriocins inhibit
potential food-borne pathogens (Barefoot and Klaenhammer, 1983). The antibacterial
effects of Lactobacillus spp. are due to their production of not only bacteriocins, but also
organic acids. Blom and Mortvedt (1991) reported that acetic acid produced by
Lactobacillus spp. has inhibitory effects on yeasts, molds, and other bacteria. A mixture
of lactic and acetic acids suppresses the growth rate of Salmonella Typhimurium more
than either acid alone (Rubin, 1978). Lactobacillus spp. are the most prominent members
of mammalian microflora found in the oral cavity, gastrointestinal tract, and vagina of
animals (Sharpe, 1981; Kandler and Weiss, 1986).
Dietary incorporation of probiotics and organic acids has gained attention as a
viable growth promoting option in the poultry industry. Probiotics are defined as viable
microorganisms, that when ingested, exhibit a beneficial effect on the health of the host
by improving its intestinal microbial balance and reducing or controlling food-borne
pathogens such as Salmonella, Escherichia coli, Staphylococcus aureus infections

15
thereby improving performance (Hentges, 1992). The genus Lactobacillus is classified
as a probiotic (Lee and Salminen, 1995). Probiotic supplements are associated with a
number of health claims that include diarrhea prevention (Yolken et al., 1994),
antitumorigenic effects (Takano et al., 1985), and cholesterol reduction (Tahri et al.,
1995).
Antibiotic Resistance Is a Growing Problem
Antibiotics had their origins in 1928 when Alexander Flemming discovered that
a substance produced by the fungus Penicillium notatum (penicillin) effectively inhibited
the growth of Staphylococcus aureus on agar plates. Approximately 13 years later,
penicillin was purified and successfully used as a treatment (Witte, 2000). Following the
development of penicillin, numerous other antibiotics such as streptomycin in 1943 and
cephalosporins in 1953 were developed (Witte, 2000). Today, approximately 5000
different antibiotics are known and about 100 of these are in use (Witte, 2000).
Penicillin was introduced into the USA in the 1940’s and was recognized as a
wonder drug due to its ability to eliminate pathogenic diseases. Antibiotics are defined
as natural (produced by microorganisms as a defense mechanism) or synthetic
compounds that are capable of inhibiting proliferation or destroying microorganisms
(Levy, 1998).
An increase in resistance to antibiotics by many microbes has been observed
within the last decade to the extent that microbes resistant to every known antibiotic
have been identified. The problem of antibiotic resistance is not a new. The first reported

16
treatment failure occurred in 1936 when normally reliable sulphonamides failed to treat
gonorrhea infections (Witte, 2000). Three years later, Staphylococcus aureus had
developed penicillinase, capable of neutralizing the antibiotic (Neu, 1992b).
Additionally, the use of benzyl penicillin to treat staphylococcal infections
became increasingly unsuccessful during the 1940’s (Witte, 2000). Staphylococcus
aureus was the first pathogen resistant to multiple antibiotics such as penicillin,
streptomycin, oxytetracycline, and erythromycin in the 1950’s (Witte, 2000). This
incident led to development of the first semisynthetic anti-staphylococcal antibiotic,
methicillin (Witte, 2000). However, a methicillin-resistant Staphylococcus aureus had
been isolated even before methicillin was in the market (Barber, 1961; Witte, 2000). By
the 1980’s, methicillin resistant Staphylococcus aureus (MRSA) was a problem in the
USA (Lyon and Skurray, 1987; Chambers, 1988; Neu, 1992b). By 1992, approximately
95% of Staphylococcus aureus were resistant to not only to penicillin, but also to
ampicillin and antipseudomonas penicillins (Lyon and Skurray, 1987; Neu, 1992b). Over
2000 serovars of Salmonella spp. possess some degree of antibiotic resistance (O’Brien,
1987; Tenover, 1991; Neu, 1992a, b; Low et al., 1997; Glynn et al., 1998). In the
Netherlands the observed increase in Salmonella spp. resistance to tetracycline between
1959 and 1974 resulted in the ban of tetracycline use as a growth promoter in animal
feed (Aarestrup et al., 2000).
Bacteria resist antibiotics through four basic mechanisms. The antibiotic can be
destroyed by altering antibiotic structure. This mechanism is illustrated by the natural
resistance of gram-negative bacteria to vancomycin and nafcillin, as well as, the
17
resistance of Enterococci bacteria (Clostridia, Staphylococci, Lactobacilli spp.) to
aminoglycosides (Murray, 1991). The second mechanism utilizes an enzyme to alter a
single amino acid in enzymes that affect the target site’s affinity for some antibiotics as
for β-lactamases (Neu, 1992b). The third mechanism acts by expelling the antibiotic
from the bacterium such as β-lactamases, aminoglcosides, and tetracyclines (Neu,
1992b). The fourth mode of action decreases cell wall permeability to the antibiotic
(Murray, 1991; Livermore, 2000; Witte, 2000).
Increased incidence of antibiotic resistance arises from a number of practices.
Chief among them are continuous feeding, inappropriate application, feeding of low
doses for extended periods, and overuse of antibiotics in the agricultural and medical
sectors (Aarestrup, 1999). Antibiotics are used as growth promoters in livestock and
poultry production, as well as, in crop production and fish farming (Levy 1998;
Aarestrup, 1999; Witte et al., 2000). Estimates indicate that approximately 40% of the 50
million pounds of antibiotics produced annually are administered to animals (Levy,
1998). Some of this represents legitimate use to treat infections; however, a large
proportion is used for growth promotion in the swine and poultry industries. In 1954,
two million pounds of antibiotics were produced while today more than 50 million
pounds are produced (Levy, 1998). In 1988, 80,000 tons of antibiotics were used for
agricultural purposes in the USA (Khatachatourians, 1998; Ungemach, 2000).
Antibiotic resistance negatively impacts the economy in the USA and other
countries as a result of prolonged illness, increased mortality, and more frequent and
prolonged hospitalization (Holmberg et al., 1987; Williams, 2000). Treatment costs also
18
increase as the use of newer more expensive antibiotics are required to replace older
antibiotics. Unfortunately, these newer more expensive antibiotics are often unavailable
in some countries (Levy, 1998; Williams, 2000).
Awareness of potential problems associated with antimicrobial resistance
evolving from the use of antibiotics as feed additives has focused research efforts to
identify alternatives for controlling infections and increasing performance in animal
production (Vicente et al., 2007). Recent experience indicates that development of new
drugs may be a losing battle since bacteria develop resistance at faster rates than new
drug discovery.
Researchers worldwide are working to develop antibiotic alternative products
such as probiotics, prebiotics (Drake et al., 2003; Patterson and Burkholder, 2003; Murry
et al., 2004; Higgins et al., 2005b; 2007; Tellez et al., 2006), organic acids (Van
Immerseel et al., 2006) and medicinal herbs (Wink, 1999; Gordon and David, 2001; Du
and Hu, 2004; Arab et al., 2006). Non-traditional chemicals (Moore et al., 2006) and
bacteriophages (Higgins et al., 2005a; Vicente et al., 2005) have been used in the last
decade to treat and prevent pathogenic diseases, and improve poultry performance.
Original candidate chemical structures for many pharmaceutical compounds used to
promote human health originated from chemicals found in plant extracts (Du and Hu,
2004; Arab et al., 2006). Among these plant compounds are saponins from quillaja, and
yucca which have several beneficial effects such as antibacterial and antiprotozoal
activities (Sen et al, 1998b; Avato et al., 2006).

19
Saponin as an Antibiotic Alternative
Characteristics of Saponins
Saponins acquired their name from the soapwort plant (Saponaria root) which
was used as soap. Saponins are generally identified by their bitter taste, throat irritation,
form foam in aqueous solutions (Mahato et al., 1988; Cheeke, 1998), fish toxicity
(Mahato et al., 1988) and ability to lyse erythrocytes. However, an example of
exceptions is, ginsenoside saponins do not lyse erythrocytes (Gogelein and Huby, 1984;
McManus et al., 1993; Takechi and Tanaka, 1995a, b). Some saponins even have been
used as flavor enhancers and sweeteners in foods and cigarettes. For example, the flavor
enhancer, licorice root extract is rich in the saponin glycyrrhizin, and saponins from the
roots of Glycyrrhiza glabra and leaves of Abrus precatorius (Oleszek et al., 1992;
Tanaka et al., 1996) are 941-fold as sweet as sucrose and 60 times sweeter than cane
sugar (Mizutani, 1994).
Chemical Nature of Saponins
Saponins are synthesized by a common metabolic pathway starting from acetyl
coenzyme A. Mevalonic acid and then squalene are the intermediary products for both
triterpenoidal and steroidal saponins. In general, synthesis of cholesterol, other steroids,
and saponins proceed through a common synthetic pathway.
Saponins are glycoside compounds (Tanaka et al., 2000; Oleszek et al., 2001a, b)
whose chemical structures (Figure 1) are composed of a fat-soluble nucleus called the

20
7 6
O
O
C D
E
F 27 26
25
242322
21
20 19
18
17
161514
10 9
8
5 4 3
2 1
A B
11 12
13
HO
7 6
O C D
E
F 27
25
24 2322
20 19
18
17
161514
10 9
8
5 4 3
2 1
A B
11 12
13
NH 2621
HO
Saponin Distribution in Plants
1 2
3
4
5 7
6
8
9 10
11
12 13
14
15
16
17
18
19
20
21
22
23
24
25 26
27
28
29
30
A
B
C
D
E
HO
Steroid Alkaloid Class
Triterpenoid Class
Steroid Neutral Class
Figure 1. Skeletal types of aglycone found in the three principal classes of saponin.

21
aglycone that is a either triterpenoid (C-30), or neutral or alkaloid steroids (C-27) (Price
et al., 1987; Hostettmann et al., 1991). One or more sugar side chains called glycones
can be linked through ether and ester linkages to the aglycone nucleus at glycosylation
sites (Cheeke, 1998). Triterpenoid saponins naturally occur as saponin or free aglycone
forms, while steroid saponins occur only as saponins and never in the free aglycone
form. The molecular weights of saponins range from 1000 to 1500 Daltons (Dorsaz and
Hostettmann, 1986).
Saponin Distribution
Saponins are distributed in both wild and cultivated plants (Price et al., 1987;
Mahato et al., 1988; Shimoyamada et al., 1990), in lower marine animals and in some
bacteria (Riguera, 1997), but are uncommon in higher animals (Hashimoto, 1979).
Triterpenoid saponins are widely distributed in the plant kingdom and have been
identified in over 500 plant species such as soybean, alfalfa, quillaja, peas, tea, spinach,
sugar beet, quinoa, liquorices, sunflower, horse chestnut, ginseng, and guar (Basu and
Rastogi, 1967; Fenwick et al., 1991). Steroid saponins occur predominantly in 85 species
of the genera Agave, Discorea and Yucca and 56 other genera such as tomato, asparagus,
ginseng, and oats (Fenwick et al., 1991). In legumes, saponins are associated with
protein and therefore are concentrated in protein-rich fractions (Fenwick and Oakenfull,
1981; Curl et al., 1986). Two major commercial sources of saponins are yucca (Yucca
schidigera) and quillaja (Quillaja saponaria). Yucca is grown in the arid Mexican desert
and southwestern USA, and quillaja is a tree grown in arid areas of Chile.

22
Types and numbers of saponin differ in their distribution among plants according
to many factors such as the part, species, and age of the plant. More than one kind of
saponin may occur in the same species. Alfalfa saponins containing zanhic acid aglycone
(trisdesmoside alfalfa saponin containing three sugar side chains attached to aglycone)
and its γ-lacton (lucernic acid or glucuronic acid) are found in leaves but not in roots
(Massiot et al., 1988). Medicagenic acid aglycones saponin (bisdesmoside alfalfa
saponin containing two sugar side chains attached to aglycone) is found in the roots and
is absent in the plant leaves (Oleszek, 1996) and hederagnin saponins (monodesmoside
alfalfa saponin containing one sugar side chain attached to aglycone) are identified in
both roots and leaves of alfalfa (Jurzysta, 1982; Tava et al., 1993). Soybeans have at
least four different saponins (Berhow et al., 2006). The saponins in the mature soybean
are divided into group A and group B soyasaponins on the basis of their aglycone
structures. Group B soyasaponins appear to exist in the intact plant tissue as a conjugate
of 2, 3-dihydro-2, 5-dihydroxy-6-methyl-4H-pyran-4-one (DDMP) at the 22 hydroxy
position (Shiraiwa et al., 1991a; Kuduo et al., 1993). Group A soyasaponins are
bisdesmosidic with alternate sugar compositions in both sets of oligosaccharides
attached to the aglycone at the 3- and 21-hydroxyl positions (Shiraiwa et al., 1991b).
Group A saponins are found only in soybean hypocotyls, while group B saponins are
widely distributed in legume seeds in both hypocotyls (germ) and cotyledons (Shiraiwa
et al., 1991a).

23
Saponin Concentrations
Saponin concentrations differ among plants as a function of plant species, plant
variety (Shiraiwa et al., 1991a, b), cuttings of the same plant (Ng et al., 1994), plant part,
degree of maturity, growing environment (sunlight intensity, rain, disease and insect
attack, etc.), agronomic factors (climate and soil), cultivation year, location grown and
season.
As a percentage of dry matter, guar meal contains 5-13% saponin (Curl et al.,
1986; Hassan et al., 2007) while soybean seed (Glycine max, Leguminosae Merrill)
contains 0.5-6.5% (Ireland et al., 1986; Berhow et al., 2006), yucca contains 8-12%
(Kaneda et al., 1987), quillaja contains 8-10% (Hostettmann and Marston, 1995), alfalfa
contains 0.5-9.5% (Nowacka and Oleszek, 1992; Oleszek, 1996), licorice root contains
more than 3% (Tanaka et al., 1996), fenugreek seed contains 5-6% (Sauvaire et al.,
1996) and the aerial part of Medicago arborea contains 1.9-3.4% saponins of dry matter
(Nowacka and Oleszek, 1994).
Saponin concentration tends to be lower in the outer parts than the inner parts of
the oat kernel, but is the converse in quinoa seeds (Onning and Asp, 1995). Alfalfa roots
contain 2.41% while alfalfa leaves contain 1.53% of dry matter as saponin (Gestetner et
al., 1971). Alfafla (Medicago sativa L.) roots and leaves contain saponins ranging from
2.6-3.8 and 0.3-2.4% of dry matter, respectively. Quinoa saponins are 0.9% and 2.3% of
dry matter in the whole seed and the bran, respectively (Ruales and Nair, 1993).
Saponin concentration of a plant during germination is higher than in a mature
plant of the same species (Pedersen, 1975). For example, alfalfa saponin concentration in

24
sprouts increases from 2 mg/g at the beginning of germination (soyasaponin I) up to 6-8
mg/g (0.6-0.8% of dry matter) at 8-16 d of age. Although saponin contents increase with
sprouting in some plants such as soybean, lucerne, mung beans, and peas, they decrease
in others plants such as moth beans (Yoshiki et al., 1998).
Planting season affects saponin content. Alfalfa saponin content is lower in
spring and fall than content in midsummer (Burda et al., 1994). Zanhic acid saponin
(aglycone is zanhic acid) is the highest late in the season when the level of medicagenic
acid saponin (the precursor of zanhic acid) drops dramatically (Oleszek, 1996).
Hederagenin saponins in alfalfa leaves ranged from 0.1-0.4% of the total aglycosides
(Jurzysta, 1982) or 0.03 mg/g of dry matter (Tava et al., 1993) versus 0.82-1.32 mg/g in
alfalfa root. Also, concentrations of saponin types A, B and E of alfalfa leaves are 10-
15.5, 15-30, and 1%, respectively (Jurzysta, 1982).
Extraction procedure also plays a role in reported net saponin concentrations. For
example, oat saponin content ranges between 0.011 and 0.029% of dry matter as
determined by high pressure liquid chromatography (HPLC) (Onning et al., 1993).
However, avenacoside A oat saponin was 0.04% of dry matter (Tschesche et al., 1969)
and avenacoside B was 1% of dry matter (Fenwick and Oakenfull, 1983) as determined
by thin layer chromatography (TLC).
Saponin Extractions
Although most saponins lack a chromophore, which makes the task of isolating
saponins from plant material complicated, many methods are available for saponin

25
extraction from different plants (Marston et al., 2000; Muir et al., 2000; Schopke, 2000;
Berhow et al., 2006). Saponins have been extracted by refluxing in several organic
solvent systems such as pure methanol (Shany et al., 1970; Gestetner et al., 1971;
Massiot et al., 1988; 1991; Oleszek et al., 1992), different ratios of methanol:water, 4:1
(v:v) (Massiot et al., 1991), 3:7 (v:v) (Oleszek et al., 1992), ethanol:water, 4:1 (v:v)
(Levy et al., 1989; Oleszek et al., 1990; Oleszek and Bialy, 2006), or even pure water
(Massiot et al., 1991). After the evaporation of initial solvent, the extract is usually
redissolved in water and saponins partitioned in n-butanol (Massiot et al., 1991; 1992).
Extracting saponin in butanol works well for monodesmosidic (one sugar side
chain attached to aglycone) and short sugar side chain bisdesmosidic (two sugar side
chains attached to aglycone) saponins. However, extraction may not be complete since
bisdesmosidic saponins with several sugar units (long sugar side chain) do not readily
dissolve into butanol (Oleszek, 1996), and trisdesmoside saponins like alfalfa zanhic
acid cannot be extracted into butanol and are totally lost using this procedure. Oleszek
(1988) reported a simple method to isolate different individual alfalfa saponins using C-
18 chromatography sequentially eluted with aqueous methanol:water (1:1, 3:2, or 7:3;
v:v) (Oleszek et al., 1990; 1992; Oleszek and Bialy, 2006). Eluants up to 40% methanol
resulted in removal of carbohydrate and some phenolic compounds, while eluants
containing 50-60% methanol removed only bisdesmoside saponins (two sugar side
chains attached to the aglycone) such as medicagenic acid saponin. Eluants with 70-80%
methanol eluted monodesmosides such as hederagenin and soyasapogenol saponins.

26
Separation of individual saponins from crude saponin extracts were achieved in a
one-step procedure by Massiot et al. (1991) using thin layer chromatography on silica
gel with different ratios of chloroform:methanol:water (65:35:8, 65:23:4, 60:40:3,
12:8:1, 10:10:1, 5:5:1, or 7:3:1; v:v:v). Massiot et al. (1991) also developed a procedure
for separation of individual saponins based on acetylation of crude saponin mixtures
followed by separation of derivatized saponins on silica gel. Chloroform:methanol, 99:1
(v:v) or combinations of chloroform:hexane:methanol (9:1:0 or 1:0:1; v:v:v) were used
as solvent systems. This procedure is useful for isolation of saponins for structural work,
but cannot provide pure compounds for biological assays, because the procedure cleaves
some ester-linked sugars by alkaline hydrolysis prior to chromatography. Individual or
pure saponins also can be isolated from saponin mixtures using HPLC on both normal-
and reverse-phase columns using various solvent systems and UV detection
(Kesselmeier and Strack, 1981).
Biological Activities of Saponins
Several biological activity assays for saponins are reported in the literature
(Jackson and Shaw, 1959; Van Atta et al., 1961; Coulson and Davis, 1962). The
biological effects of saponins depend on their chemical structure (Figures 2 and 3).
Structural variability occurs in aglycone type, carbon number, position and chemical
composition (number, shape, sequence and type of monosccharides) of sugar side
chains, type and number of functional groups attached to the aglycone nucleus (Potter et
al., 1993).

27
Saponin Source R1 R2 Reference
Monondesmoside yucca + - Kaneda et al. (1987)
Bisdesmoside yucca + + Kaneda et al. (1987)
Monondesmoside avenacin oat + - Tschesche et al. (1969)
Bisdesmoside Avenacoside A, B oat + + Tschesche et al. (1969)
Monondesmoside α tomatine + - Haralampidis et al. (2002)
Figure 2. Steroid saponins differ in sugar side chain structure and position (R1 and R2) on the aglycone nucleus. + or – indicates the presence or absence of a sugar side chain, respectively.

28
Saponin Source R1 R2 R3 R4 R5 Reference
Bisdesmoside guar + - - - + Curl et al. ( 1986)
Bisdesmoside quillaja + - - + - Higuchi et al. (1987)
Monondesmoside soybean - + - - - Shirawa et al. (1991a)
Bisdesmoside soybean + + - - - Shirawa et al. (1991b)
Monondesmoside alfalfa + - - - - Massiot et al. (1988)
Bisdesmoside alfalfa + - - + - Oleszek (1996)
Monondesmoside alfalfa - - - + - Oleszek (1996)
Monondesmoside alfalfa + - - - - Oleszek (1996)
Figure 3. Triterpenoid saponins differ in sugar side chain structure and position (R1 to R5) on the aglycone nucleus. + or – indicates the presence or absence of a sugar side chain, respectively.

29
Guar, alfalfa, soybean and quillaja are triterpenoid saponins while yucca, oat and
α tomatine are steroid saponins. The predominant guar saponins have two sugar side
chains, one attached at C-3 and another at C-29 (Curl et al., 1986). The predominant
quillaja saponin (Higuchi et al., 1987; 1988) and alfalfa saponins (Massiot et al., 1988;
Oleszek, 1996) have two sugar side chains at C-3 and C-28. Yucca saponins (Kaneda et
al., 1987; Cheeke et al., 2006), avenacoside A and B oat saponins (Tschesche et al.,
1969; Grunweller and Kesselmeier, 1985; Osbourn, 2003), and soybean saponin (Kuduo
et al., 1992) have two sugar side chains at C-3 and C-21. Oat saponin avenacin A-1
(Osbourn, 2003), a second yucca saponin (Kaneda et al., 1987; Cheeke et al., 2006), α
tomatine in tomato (Haralampidis et al., 2002), and soyasaponin representing about 93%
of the total soybean saponin (Kuduo et al., 1992) have only one sugar side chain at C-3.
Hederagenin alfalfa saponin has only one sugar side chain at C-22 (Oleszek, 1996).
While saponins may share similar sugar attachment sites, the sugar side chains
themselves vary in type, number, sequence, and chain length (Figures 2 and 3). Quillaja
saponin contains quillaic acid as the central aglycone attached with glucuronic acid,
rhamnose, hexose and a fatty acyl chain in varying ratios (Higuchi et al., 1987). Alfalfa
contains medicagenic acid as the aglycone with at least one free carboxyl group, and
soyasaponin I has a carboxylic group on glucuronic acid (Oleszek, 1996). Alfalfa zanhic
acid saponins contain glucose attached with glucuronic acid at C-3 (Massiot et al.,
1988). Avenacoside A and B (oat saponins) contain glucose and rhamnose and
avenacoside B contains one more glucose unit than avenaside A (Tschesche et al., 1969).

30
Hemolytic Activity
Hemolytic activity has been used by researchers to follow the isolation of
saponins. It is the simplest and the fastest bioassay employed to detect and quantify
some saponins in plant material (Authi et al., 1988; El Izzi et al., 1992; Khalil and EI-
Adawy, 1994; Onning and Asp, 1995; Oleszek, 1996; Onning et al., 1996; Choi et al.,
2001; Menin et al., 2001; Plock et al., 2001). Alfalfa (Lindahl et al., 1957; Vacek and
Sedlak, 1962; Shany et al., 1970; Gestetner et al., 1971; Oleszek, 1996), soybean (Birk et
al., 1963), oat (Onning et al., 1996; Pillion et al., 1996; Steurer et al., 1999), quillaja
(Jenkins and Atwal, 1994), and synthetic triterpenoid or steroid saponins (Takechi et al.,
1999) have hemolytic activity. Several factors determine the hemolytic activity of
saponins such as aglycone type, glycone, aglycone:sugar ratio, glycone position and
number of sugar side chains attached to the aglycone.
Not all saponins have hemolytic activity. For example, ginsenosides saponins
hemagglutinate human, rabbit, and sheep erythrocytes, but are not hemolytic (Gogelein
and Huby, 1984; McManus et al., 1993; Takechi and Tanaka, 1995a, b). Where saponins
tend to have low hemolytic activity on human erythrocytes; they have high hemolytic
activity on sheep cells (Schmidt-Thome and Prediger, 1950). Saponin from peas showed
lower hemolytic activity than soybeans (Birk and Peri, 1980) and alfalfa root extracts are
more hemolytic than those from alfalfa leaves (Shany et al., 1970).
Hemolytic activity of saponins is attributed to the affinity of their aglycone
moiety to sterols within membranes, particularly cholesterol (Schmidt-Thome and
Prediger, 1950; Bangham et al., 1962; Glauert et al., 1962; Joos and Ruyssen, 1967; Gee

31
et al., 1998; Attele et al., 1999). Other research reports that hemolytic activity decreases
by removing the glycone moiety of the saponin (Santos et al., 1997). Still other
researchers report that a high aglycone:sugar ratio increases hemolytic activity (Shany
etal., 1970; Gestetner et al., 1971). Saponins possessing two or more sugar side chains
show less hemolytic activity than saponins containing one sugar side chain (Fukuda et
al., 1985; Mahato et al., 1988; Woldemichael and Wink, 2001). Takechi and Tanaka
(1995b) noted that the hemolytic rates of steroid saponins are greater than the hemolytic
rates of triterpenoid saponins. Santos et al. (1997) also report that steroid saponins have
higher hemolytic activity than triterpenoid saponins. Monodesmoside saponins with
glucose attached at C-3 shows higher hemolytic activity than monodesmoside saponins
with glucuronic acid at the same position (Oleszek, 1996). As the number of
monosaccharide units attached to the hydroxyl group at C-3 on the aglycone (Mahato et
al., 1988) increases up to four to six sugar units (Anisimov et al., 1980; Kuznetzova et
al., 1982) hemolytic activity increases. The stereochemistry of the saponin as related to
side chain composition and length appear to be very important in conferring activity on
the saponin molecule (Gee et al., 1998).
Hemolytic activity of saponins increases with decreasing numbers of polar
groups on the aglycone moiety (Namba et al., 1973). Saponins with the highest retention
factor (Rf) on silica gel showed the strongest hemolytic activity. The active groups on
the aglycone and the acylation of saponins affect hemolytic activity. The neutral and
acidic triterpenoids along with the acyl saponins are less hemolytic than the ester
saponins (Gee et al., 1998; Attele et al., 1999; Oda et al., 2000). Laurence et al. (2005)

32
noted that the ethanol acylated triterpenoid saponins isolated from the stem bark of
Harpullia austro-caledonica showed 100% hemolytic activity of a 10% suspension of
sheep erythrocytes while, deacylated quillaja saponins, which differ only in the absence
of one glucose residue decreased hemolytic activity (Pillion et al., 1996). No close and
direct relationships between hemolytic activity and other biological activities of saponin
were reported. For example, avenacoside oat saponins showed hemolytic activity, but
did not affect the cell membrane permeability and the active transport of glucose (Abe et
al., 1978a; Onning et al., 1996; Pillion et al., 1996; Steurer et al., 1999). This is a very
unusual observation given hemolysis is the result of a ruptured red blood cell membrane
which allows hemoglobin to escape the cell. A trisdesmoside zahnic acid saponin was
only weakly hemolytic and neither inhibited fungal growth nor formed insoluble
complexes with cholesterol (Gee et al., 1996). However, it was the most active
compound affecting cell membrane permeability and active transport of glucose, giving
further evidence of the complexity of the interactions between saponins and membranes
(Gee et al., 1996). Synthetic steroid saponins show both antifungal and hemolytic
activity, but in many cases hemolytic triterpenoid saponins show little antifungal activity
(Takechi et al., 1999).
Antibacterial and Antiprotozoal Activities
As with hemolytic activity, the antibacterial activity of saponins is affected by
factors such as the aglycone, number, position and chemical structure of sugar side
chains (Rakhimov et al., 1996). Many saponins are antimicrobial and considered as a

33
part of plants’ defense systems. Plants known to have antimicrobial activity include
yucca (Hussain and Cheeke, 1995; Tanaka et al., 1996), quillaja (Sen et al., 1998b),
ginseng (Mahato et al., 1988), and triterpenoid saponins from Holothuroidea class of
marine echinoderm animals (Samoilov and Girshovich, 1980). Not all saponins have
antibacterial activity. For example, medicagenic and zanhic acid saponins isolated from
alfalfa plants do not show activities against Escherichia coli, Staphylococcus aureus,
Bacillus subtitles, Pseudomonas aeruginosa and Mycobacterium intracellulare (Oleszek
and Jurzysta, 1992). Yucca saponin show moderate antibacterial activity against gram-
positive bacteria such as Staphylococcus aureus and Lactobacillus plantarum but are
without antibacterial activity against gram-negative bacteria such as Escherichia coli
(Tanaka et al., 1996).
Antibacterial activities of saponins differ according to type of the bacteria. Some
saponins such as ivy saponin (Cioaca et al., 1978), spirostanol saponin (Okunji et al.,
1990), asterosaponin from starfish (Andersson et al., 1987; 1989), and yucca saponin
(Cheeke, 1998; Cheeke and Otero, 2005) show more antimicrobial activity against gram-
positive bacteria (Staphylococcus aureus) than gram-negative bacteria (Escherichia coli)
at the same concentration. Wang et al. (2000a, b) note that saponin-rich yucca extracts in
ruminant diets decreased cellulolytic bacteria while not affecting amylolytic bacteria.
Quillaja saponin (Quillaja saponaria) and yucca saponin (Yucca schidigera)
obtained from different commercial companies exhibited antibacterial activity against
Escherichia coli K-12 with different efficiencies, suggesting that saponins from various
sources differ in their biological activity due to their different chemical structures and

34
extraction procedure (Sen et al., 1998b). Extraction methods and fat content have
important effects on the antibacterial activity of the resultant plant extracts. For example,
fat free extracts from Bauhinia variegata L. bark were more active than high fat extracts
against gram-positive bacterial strains such as Staphylococcus aureus (Rakhimov et al.,
1996). However, fat free extracts exhibited either similar or less antibacterial activity
than high fat extracts against gram-negative bacterial strains such as Escherichia coli.
Many saponins have antiprotozoal activity (Lu and Jorgensen, 1987; Wallace et
al., 1994; Newbold et al., 1997; Cheeke et al., 2006) as a result of binding with sterols
present on the protozoal surface, which are absent on bacterial membranes (Hussain and
Cheeke, 1995). The sugar side chain attached to the hydroxyl group on C-3 has an
important effect on the antiprotozoal activity of many saponins. The antiprotozoal
property of saponins is lost upon deglycosylation (Wang et al., 2000a).
Effect of Saponin on Cell Membrane Permeability
Saponins differ in their effects on cell membrane permeability. Many reports
suggest negative effects on cell membrane permeability by blocking membrane ion
channels (Segal et al., 1974; Abe et al., 1978b; Matsuda et al., 1997; Santos et al., 1997)
and irritating membranes of the mouth and the digestive tract (Oleszek and Jurzysta,
1992; Oleszek et al., 1994). Other research reports that saponins increase cell membrane
permeability (Price et al., 1987; Gee et al., 1989; Brain et al., 1990) by insertion of the
aglycone into the lipid bilayer (Hu et al., 1996), forming pores of 40 to 50A° in diameter
in human erythrocyte membranes (Seeman et al., 1973; Seeman, 1974; Authi et al.,

35
1988; El Izzi et al., 1992; Choi et al., 2001; Menin et al., 2001; Plock et al., 2001).
Saponins also have stimulated sodium–calcium exchange activity as in canine cardiac
sarco-lemmal vesicles (Yamasaki et al., 1987; Choi et al., 2001) and induce an isotropic
action through membrane calcium channels (Enomoto et al., 1986). Saponins change the
function of proteins or glycoproteins in plasma membranes (Abe et al., 1978b; Rao and
Sung, 1995), and form a saponin–cholesterol complexes therby altering the organization
of membrane phospholipids, form phospholipid breakdown products such as
phosphatidic acid (Yamasaki et al., 1987; Choi et al., 2001). ATPases enzyme activity of
membranes also is altered thereby affecting ion transport (Ma and Xiao, 1998).
In general, saponin action on cell permeability is dependent on concentration
and the number of sugar side chains on the aglycone. High concentrations of saponin
may literally poke holes in cell membranes while lower concentrations may interact with
membranes in other ways without actually rupturing them. The permeability activity of
avenacin A-1 is completely abolished after one, two, or all three sugar side chains are
hydrolyzed to yield monodeglucosyl, bisdeglucosyl and aglycone derivatives,
respectively (Armah et al., 1999).
Other Biological Activities of Saponins
In addition to the previously mentioned biological activities of saponins, they are
also reported to have anti-arthritic (Cheeke et al., 2006), anthelmintic (Julien et al., 1985;
Tanaka et al., 1996), diuretic (Sood et al., 1985), molluscicidal (Lemma, 1965),
insecticidal (Applebaum et al., 1965; 1969), hypolipidaemic and hypocholesterolemic

36
(Malinow et al., 1977; Malinow, 1984; Al-Habori and Raman, 1998). Other studies
reported several anticancerous biological activities of saponins (Ma et al., 2007).
Saponins also can induce diarrhea (Lalitha et al., 1990), mollify ulcers (Muto et al.,
1987), relieve analgesia (Lei et al., 1984; Oshima et al., 1984) and fever (Gan and Chen,
1982), as well as having sedative properties (Wagner et al., 1983; Choi and Woo, 1987).
Other report antidiabetic (Kamel et al., 1991; Al-Habori and Raman, 1998), antifungal
(Shimoyamada et al., 1990; Takechi et al., 1999; Lee et al., 2000; Yang et al., 2006),
antiyeast (Kasai and Yamasaki, 2000; Tanaka et al., 2000) and antimold (Morrissey and
Osbourn, 1999) activities. Saponins exhibited anti-inflammatory (Chevillard et al., 1965;
Haridas et al., 2001a, b; Cheeke et al., 2006; Jigna et al., 2006), spermicidal and
contraceptive (Elbary and Nour, 1979; Bhargava, 1998a, b), antioxidant (Monder et al.,
1989; Pawar et al., 2001; Hu et al., 2002) and antiviral (Sindambiwe et al., 1998; Apers
et al., 2001) activities.
Many of the biological activities mentioned above can be mediated by interaction
of saponins with cell surface proteins and receptors, secondarily affecting enzymes.
Many saponins affect inhibit enzyme activities such as urease (Lyons, 1989), sodium-
potassium ATPase, calcium–magnesium ATPase in rabbit red blood cell membranes
(Kang and Koh, 1974; Choi et al., 2001) and mucosal enzyme activity in the small
intestine (Olli et al., 1994).
Saponins also affect hormone activity. For example, saponins exhibit strong
stimulation effects on both adrenocorticotropic hormone (ACTH) and corticosterone
hormone (Kim et al., 1999). They show mineralocorticoid-like activity by transforming

37
biologically active steroid cortisol hormone into its inactive metabolite, cortisone
(Monder et al., 1989). Glucocorticoid hormones that act through glucocorticoid receptors
(Gagliardo et al., 2001) and plasma insulin hormone concentrations (Petit et al., 1993),
while, other saponins showed inhibitory effects on insulin hormone (Akhtar and Perry,
1975).
They also stimulate uterine growth, block the estrous cycle (Benie et al., 1990),
improve the copulatory performance of sexually sluggish or impotent rats by increasing
central noradrenergic, dopaminergic tone and oxytocinergic transmission (Arletti et al.,
1999), compete strongly with estradiol for estrogen- and progesterone-binding sites in
the human myometrial cytosol on uterine receptors (Punnonen and Lukola, 1980; Benie
et al., 1990). Other effects include stimulating binding of progesterone to bovine luteal
membrane by forming complexes with membrane sterols (Menzies et al., 1999),
inhibiting the activity androgen receptors by binding to androgen receptors (Liu et al.,
2000), prolonging the period of diestrous (Tamura et al., 1997), inhibiting the genes
responsible for steroidogenesis and suppressing the proliferation of follicle-stimulating
hormone-modulated granulosa cells in the ovarian follicle through a similar mechanism
as saponin-induced proliferation of tumor cells (Tamura et al., 1997).
Toxicity of Saponin
Many saponins exhibit toxic effects at high doses over long periods of time
causing problems such as excessive salivation, vomiting, diarrhea, loss of appetite and
manifestations of paralysis (Spinks and Fenwick, 1990). Oral toxicity of saponins to

38
warm-blooded animals is relatively low (George, 1965) and LD50 (lethal dose, 50%)
values are in the range 50-1000 mg/kg (Oakenfull, 1981). However, they are highly
toxic when given intravenously (Makkar and Becker, 1996). The toxic effects of many
saponins are neutralized by saliva of animals such as sheep (Odenyo et al., 1997;
Teferedegne, 2000), intestinal bacteria (Price et al., 1987; Newbold et al., 1997; Odenyo
et al., 1997; Wakabayashi et al., 1998; Bae et al., 2000; Park et al., 2001), and rumen
bacteria (Newbold et al., 1997; Flaoyen et al., 2001). Cooking or heat processing can
also detoxify saponins. For example, cooking decreases saponin content by 7-17% in
chick peas, 40% in faba bean seeds (Sharma and Sehgal, 1992) and 72% in quinoa (Gee
et al., 1993). Not all saponins are degraded at the same conditions and temperature. For
example, oat saponins are not affected (Kataria et al., 1989) until heated to 140oC for 3
h. Degradation increases as the pH decreases from 7 to 4 in avenacoside A (Onning and
Asp, 1995). Saponin degradation sometimes induces activity of enzymes such as β-
glycosidase that occur naturally in oat leaves. Removing the C-26-bound glucose moiety
(Grunweller and Kesselmeier, 1985) results in forming a monodesmosidic saponin with
the highest antifungal activity. Also, avenacosides saponin A and B in oats are activated
by the plant’s enzymes in response to tissue damage or pathogen attack by fungi (Gus-
Mayer et al., 1994; Hostettmann and Marston, 1995; Sauvaire et al., 1996). Saponins can
also be hydrolyzed by cleaving the ester-linked sugars to yield carbohydrates and
aglycones (Oleszek et al., 1990; 1992; Levy et al., 1989; Oleszek and Bialy, 2006).

39
Effect of Saponins on Intestinal Activity, Nnutrient Digestion and Aabsorption
Saponins reduce intestinal motility (Klita et al., 1996), increase the transit time of
ingesta (Ueda et al., 1996), inhibit gastric emptying (Matsuda et al., 1999a, b;
Yoshikawa et al., 2001). Saponins can cause intestinal lesions (Bangham et al., 1962;
Seeman, 1974), damage the intestinal villi (Story et al., 1984; Gee and Johnson, 1988;
Gee et al., 1993; Bureau et al., 1998) and alter intestinal morphology in the lower
intestine (Baker et al., 1988).
Many saponins decrease digestion by changing the site and the extent of nutrient
digestion in ruminants and altering rumen fermentation (Lu and Jorgensen, 1987; Lu et
al., 1987; Killeen et al., 1998). Total volatile fatty acid and microbial protein synthesis
can be reduced (Lu et al., 1987). Digestive coefficients of some organic matterials such
as hemicelluloses and cellulose are reduced and digestibility of some nutrients such as
protein are also reduced perhaps potentianted by damage to the intestinal membranes
(Freeland et al., 1985; Potter et al., 1993; Shimoyamada et al., 1998).
Although, saponins remain within the gastrointestinal tract and are not absorbed
into the blood stream (Birk, 1969; Yoshikoshi et al., 1995; Cheeke, 1996), perhaps
because of their binding to the intestinal mucosa (Gee and Johnson, 1988), many
saponins inhibit the absorption of several nutrients (Johnson et al., 1986) such as
vitamins A and E (Jenkins and Atwal, 1994). On the other hand, many saponins have
been reported to increase the absorption of certain substances (Freeland et al., 1985)
such as calcium, iron salts, glucose, acetylsalicylic acid, magnesium, sodium, sodium

40
ampicillin and other β-lactams in rat and pig intestine (West, 1979; Kimata et al., 1983;
Lower, 1984; Freeland et al., 1985; Yata et al., 1985; Southon et al., 1988b).
Effect of Dietary Saponins on Poutry and Animal Performance
Some saponins showed beneficial effects on the productive performance of
poultry and animals. For example, yucca and quillaja saponins are classified as generally
recognized as safe (GRAS) for food use in the USA (Fenwick et al., 1992). Yucca
saponins are active over a wide pH range (3.0-6.3), without toxic effects, safe for human
food, tasteless, odorless, soluble in water, and stable upon heating (Tanaka et al., 1996).
Adding yucca saponin to diets might be beneficial to both ruminants and chickens fed
high-grain diets by reducing the emission of ammonia from animal excreta (Lyons,
1989; Wang et al., 2000a, b; Cheeke and Otero, 2005). Also, quillaja saponins increase
the efficiency of rumen-microbial protein synthesis in vitro (Makkar and Becker, 1996).
Saponins reduce the toxicity of some toxins such as tannins by binding them in the gut
(Freeland et al., 1985).
The beneficial effects of some saponins on productive performance include
improving egg production in laying hens, enhancing viability, increasing growth rate and
feed efficiency in broilers and pigs (Johnston et al., 1980; 1981; 1982; Mader and
Brumm, 1987; Al-Bar et al., 1993; Anthony et al., 1994; Killeen et al., 1998), increasing
feed and water intake (Podgorski and Majewski, 2002), reducing O2 consumption thus
improving metabolic rate and nutrient utilization (Francis et al., 2001a, b; 2002a, b).
Other researchers report reducing NH3 concentration in the rumen and plasma (Hussain

41
and Cheeke, 1995; Cheeke and Otero, 2005), stimulating the appetite (Petit et al., 1993;
Sauvaire et al., 1996) and inducing fattening of lambs and steers (Hale et al., 1961;
Goodall et al., 1982). Saponin effects in lambs are sex-dependent. Bosler et al. (1997)
found that both male and female lambs fed up to 40 mg quillaja saponin/kg increased
average daily weight gains, but that the difference in weight gain was lower in the
females than males. Beneficial effects of saponins were more pronounced when they
were directly administered into the rumen rather than added to the feed (Odenyo et al.,
1997).
Many saponins have harmful effects on productive performance of monogastric
and ruminant animals. Alfalfa saponins are of limited use, especially in monogastric
animals such as swine, fish and poultry for their anti-nutritional effects (Newman et al.,
1958; Sim et al., 1984; Terapunduwat and Tasaki, 1986; Price et al., 1987; Mahato et al.,
1988; Shimoyamada et al., 1990; Potter et al., 1993; Jenkins and Atwal, 1994; Olli et al.,
1994; Makkar and Becker, 1996; Forhne, 1999; Francis et al., 2001a, b) partially
because of decreased palatability. Decreased feed intake, growth rate (Cheeke, 1983;
1996; Ueda and Ohshima, 1987; Makkar and Becker, 1996), increased mortality rate
(Lalitha et al., 1990), and depressed egg production in poultry and fish result (Sim et al.,
1984; Terapunduwat and Tasaki, 1986; Potter et al., 1993; Jenkins and Atwal, 1994;
Francis et al., 2001a, b). They also are reported to irritate mucous membranes of the
mouth, digestive and respiratory tracts (Forhne, 1999).
Some saponins also exert harm to animal reproductive performance (Tewary et
al., 1973; Stolzenberg and Parkhurst, 1976) by causing abortion or death in rabbits, goats

42
and cows (Dollahite et al., 1962), preventing pregnancy (Tewary et al., 1973; Mahato et
al., 1982; Quin and Xu, 1998) and inducing proliferative changes in both the vagina and
uterus (Chou et al., 1971; Tewary et al., 1973; Stolzenberg and Parkhurst, 1976).
On the other hand, some saponins are harmful, but many of them are beneficial
(Wallace et al., 1994; Hussain and Cheeke, 1995). For example, alfalfa and soybean
saponins have both beneficial and adverse effects in many animals (Sen et al., 1998a, b).
Saponins even affect animal species differently. Various avian species show an aversion
to alfalfa meal (Cheeke, 1983) and sheep appear less sensitive than cattle to saponins’
bitter taste (Cheeke, 1994). Specific tissues also are affected by saponins. The weights
of some internal organs such as the adrenal glands are increased while other saponins
decrease the weight of the thymus in rats (Hiai and Yokoyama, 1986; Hiai et al., 1987).
Some ginseng saponins increase motility and progression of sperm (Chen et al., 2001),
while Sesbania sesban saponins are spermicidal in vitro (Dorsaz et al., 1988).
Effect of Saponin on Feeding Behavior
Saponins can affect the circadian rhythm of feeding behavior (Petit et al., 1995).
Rats fed steroid saponin-rich fenugreek seed extract ate continuously during 24 h rather
than only at night. Normally, rats consume 80-90% of their nutritional intake at night, a
consumption pattern which was stable throughout the saponin treatment. In contrast,
food intake increased two-fold during the daylight phase with the steroid saponin
treatment (Petit et al., 1995).

43
Other studies reported no adverse effects of adding saponin in the diet of
monogastric animals (Ishaaya et al., 1969; Mahato and Nandy, 1991; Wu et al., 1994).
Steroid saponins from yucca or triterpenoid saponins from soybean did not affect growth
rate at concentrations as much as five times the concentration of saponin from soybean-
supplemented diets of chicks, rats and mice. Quillaja saponin did not show significant
toxic effects in short-term feeding studies in rats (Gaunt et al., 1974) or long term
toxicity studies in mice (Philips et al., 1979).
Guar Meal Is a Saponin-Rich Legume
Guar, Cyamopsis tetragonoloba L. (syn. C. psoraloides) or cluster bean is a
drought-tolerant summer annual legume native to India and Pakistan where it is
cultivated as a feed crop for human and livestock consumption (Rahman and Shafivr,
1967). Guar was initially introduced by the USDA in 1903 as a feed crop appropriate for
arid areas of the USA. Currently guar is produced in India, Pakistan, and the USA with
smaller quantities of production in Australalia and South Africa (Udersander et al.,
1997). Its production is centralized in northern Texas and southwestern Oklahoma,
because of suitable climate and soil type (Rahman and Shafivr, 1967; Whistler and
Hymowitz, 1979).
Guar plant’s growth characteristics make it beneficial for arid production areas.
Guar is drought resistant, does not require irrigation, and adapts to many soil types. It is
a legume commensal with nitrogen fixing bacteria within guar root nodules. Therefore,
guar is a good rotation plant with cotton and other crops. When plowed under, guar

44
increases crop yield due to the improved nitrogen availability in soil (Whistler and
Hymowitz, 1979; Undersander et al., 1997).
Refinement and Separation Processes of Guar Beans
The guar bean is divided into three fractions, endosperm, hull and germ that
compose 35-42, 14-17 and 43-47% of the whole bean, respectively. Mechanical
refinement of the guar bean is initiated by pouring whole raw guar beans into a set of
attrition mills to crack the beans. Broken beans are conveyed through a set of 14 mesh
sieves. At this point, the guar germ fraction is removed as it is the only particle size
small enough to pass through the screen. This portion is now termed ″14 mesh guar
meal.″ The remaining fraction now termed crude cracks, are then passed through a rotary
furnace between 93.3 and 105oC. Heat helps to separate guar endosperm and hull
fractions. Crude cracks are passed through a second set of mills known as micro mills
where the endosperm remains a large particle and the hull is shattered. These products
are passed over 18 mesh sieves. At this point, the guar endosperm and the hull fractions
are separated. The guar hull fraction is termed ″18 mesh guar meal″ and the guar
endosperm fraction is termed ″splits″. Endosperm fractions, splits, are stored for further
processing of guar gum. Guar gum production yields guar germ and hull fractions as by-
products. The 18 mesh guar meal (guar hull fraction) is combined with 14 mesh guar
meal (guar germ fraction) to form guar meal.

45
Dietary Guar Gum and Guar Meal Effects on Animal and Poultry Performance
Guar Gum
Currently, guar bean is mainly produced for the guar gum, a galactomannan
polysaccharide that is contained in the endosperm. Guar gum is about 13-18% of the
original weight of the guar bean (Bakshi et al., 1964, Lee et al., 2004). Chemically, guar
gum is a linear chain of D-mannose units connected by β-1-4 glycoside bonds. Every
other D-mannose unit bonds a D-galactose unit by α-1-6 glycoside linkage. Commercial
guar gum is composed of approximately 8-14% moisture, 75-85% galactomannan, 5-6%
crude protein, 2-3% crude fiber and 0.5-1.0% ash (Maier et al., 1993). It is utilized as a
thickening agent in paint, cosmetics, and pharmaceuticals. Guar gum also is utilized in
oil well drilling mud, cloth and paper, explosives, ore flotation, as well as a variety of
other industrial uses (Undersander et al., 1997). Guar gum can be used to control water
loss, viscosity, flocculation, suspension, and mobility (Whisler and Hymowitz, 1979).
Guar gum has a variety of uses in food products as a binder or thickening agent.
A typical analysis of food grade guar gum includes 2.5% crude fiber, 1-5% crude
protein, and 0.5-0.8% ash (Whisler and Hymowitz, 1979). Guar gum can be found in
food products such as candy, ice cream, canned meats, pasta, instant puddings, colas,
and as a stabilizer for cheeses. Guar gum improves texture and enhances food flavor by
controlling moisture distribution and migration (Whisler and Hymowitz, 1979). Guar
gum is useful in frozen foods, such as ice cream as a stabilizer and water-binder. It is

46
also useful as a stabilizer in baking and in high-temperature, short-term processing of
bread (Whisler and Hymowitz, 1979).
High concentration of guar gum in poultry diets lowers absorption of amino acids
through the intestinal wall (Katoch et al., 1971). The growth depressing properties of
guar gum can be mitigated by treatment with enzymes capable of hydrolyzing guar gum.
Pectinase, cellulase or a preparation from sprouted guar beans have been used to digest
guar gum in poultry (Vohra and Kratzer, 1964; 1965) and pig diets (Chesson, 1987).
Guar gum can dramatically alter the ecological properties of the contents of the
gastro-intestinal tract resulting in significant physiological effects. High viscosity is
generally observed with delayed gastric emptying and increased small intestinal transit
time, hence inhibiting the nutrient absorption (Blackburn and Johnson, 1981). However,
high viscosity guar gum may contribute to beneficial physiological functions in human
health by decreasing plasma cholesterol (Favier et al., 1998; 1997; Dario Frias and
Sgarbieri, 1998; Moriceau et al., 2000; Yamamoto et al., 2000) and decreasing serum
glucose (Groop et al., 1993; Fairchild et al., 1996; Ou et al., 2001; Russo et al., 2003).
Guar gum also has putative protective effects against colonization by pathogenic
bacteria. Pathogenic bacterial proliferation and the resultant diarrhea can be ameliorated
by saponins. The polar lipid effect prevents microbial translocation within the gastro-
intestinal tract (Bengmark, 1998). Guar gum is readily fermented by human fecal
microbes (Okubo et al., 1994), which may partially contribute to a prebiotic function.
Duncan et al. (2002) successfully isolated a high-molecular-weight galactomannan
similar to guar gum from the edible mushroom Morchella esculenta that enhances

47
macrophage activation thus exhibiting immunostimulatory activity. Guar gum could also
have such effects.
A series of feeding experiments conducted by Vohra and Kratzer (1964)
demonstrated that as little as 1% guar gum in broiler chicken diets causes a depression of
growth. When the diet contained 2% guar gum, relative growth of broiler chickens was
61-67% of controls. Residual gum was throught to be chiefly responsible for the adverse
effects on chicks, not trypsin inhibitor (Anderson and Warnick, 1964; Vohra and
Kratzer, 1964) which was shown to be insignificant (Conner, 2002). Lee et al. (2003a)
also supported that residual gum was at least partially responsible for the negative
growth effects seen when guar meal was fed.
Guar Meal
Estimates of total world production of guar meal in 1975 were between 400 and
500 million pounds as animal feed (Whisler and Hymowitz, 1979). India, the major
producer of guar that accounts for 80% of the total guar produced in the world produced
betwwen 200 to 600 thousand tons of seed and between 400 to 500 thousand tons of
guar splits in 2007. The world market for guar gum is estimated to be around 150,000
tons/year, 70% of which is produced by India and Pakistan (Rediff India Abroad, Sep,
2007). Guar meal contains about 33-47.5% crude protein on a dry matter basis (Bakshi,
1966; Ambegaokar et al., 1969). This protein source is valuable as poultry and animal
feed. However, guar meal’s use in poultry and pig rations historically was limited by its
adverse effects on feed intake and growth (Thakur and Pradhan, 1975a, b). Guar meal

48
primarily has been used in ruminant feeds, particularly for beef cattle in feedlots in
northern Texas and southwest Oklahoma. Guar meal has not been used extensively with
monogastric animals because of perceived growth retarding characteristics of the meal.
Guar meal at high concentrations has deleterious effects on growth rate and feed
efficiency of broiler chicks (Brocher and Ackerson, 1950; Saxena and Pradhan, 1974).
Guar meal is sticky in nature and reduces nitrogen retention, energy utilization, fat
absorption from the gut, depresses growth rate and increases mortality rate in broilers
(Anderson and Warnick, 1964). Despite these deleterious effects, the low cost of guar
meal make it a potentially good source of essential amino acids (Ramakrishnan, 1957).
The current market value of guar meal is approximately 7.5-10 cents per pound
(West Guar-Tex and Rhodia Companies). Other feed ingredients such as cottonseed
meal, canola meal and soybean meal containing comparable crude protein values have
current market values between 16.0-18.8 cents per pound (USDA Market News, Feb.,
2008).
Verma and McNab (1984a, b) reported that protein in guar meal is rich in
arginine, but methionine and lysine concentrations were inadequate for optimum rat
growth and comparatively lower than concentrations typically found in soybean meal
(Van Etten et al., 1961). Ambegaokar et al. (1969) suggested that tryptophan, methionine
and threonine were the first three deficient amino acids of guar meal when compared to
whole egg protein. Excessive concentrations of guar meal in poultry diets cause diarrhea,
depresses growth rate and increases mortality of broilers (Sathe and Bose, 1962; Couch
et al., 1967a; Thakur and Pradhan, 1975b; Verma and McNab, 1982; Patel and

49
McGinnis, 1985; Conner, 2002) and decreases feed efficiency of laying hens (Bakshi et
al., 1964; Nagra et al., 1985; Patel and McGinnis, 1985; Nagra and Virk, 1986).
Guar meal can be safely fed to laying hens at concentrations up to 5% without
adverse effects on feed efficiency (Cheng, 2004). He reported also that feeding 10% guar
meal depressed feed consumption and increased body weight loss. Reduced feed intake
produces a molting effect when used at 20% of the diet and can thus be considered an
alternative molting strategy that does not require complete removal of feed. Bakshi et al.
(1964) proposed that guar meal contains two deleterious factors: trypsin inhibitor and
guar gum residue. The trypsin inhibitor was listed as a deleterious factor because the
chicks fed guar meal had been reported to present pancreatic hypertrophy (Couch et al.,
1966; 1967b) which can also be found in chickens fed un-heated soybean meal.
However, the trypsin inhibitor is not universally accepted as a primary factor for the
deleterious effects of feeding guar product to poultry (Anderson and Warnick, 1964;
Vohra and Kratzer, 1964). Verma and McNab (1982) reported that neither heating the
guar meal directly nor steam pelleting diets containing guar meal had much effect on the
performance of the broiler chicks, which was in agreement with the findings of Nagpal
et al. (1971) who reported autoclaving guar meal did not improve its gross protein value
for chicks. The trypsin inhibitor activity in guar meal was reported to be significantly
lower than in soybean meal commonly used in poultry feed (Verma and McNab, 1982;
Conner, 2002), which indicates that the harmful effects on performance of poultry when
fed diets containing guar meal are not likely due to excessive trypsin inhibitor activity.

50
Guar meal contains 5-13% triterpenoid saponin of dry matter (Curl et al., 1986;
Hassan et al., 2007). The predominant guar saponins have two sugar side chains, one
attached at C-3 and another at C-29 (Curl et al., 1986). Guar meal also contains guar
gum whose impact on intestinal viscosity affects growth and feed efficiency (Lee et al.,
2003a, b; 2004; 2005).
Research Description
The previous information reviewed indices that new antibiotic and coccidiostats
must be continually developed to overcome increasing resistance to chemical drugs in
bacteria and parasites (Chapman, 1993; 1998; Yadav and Gupta, 2001). Drug resistance
and the high costs of developing novel drugs make discovery of alternative control
methods essential (Chapman, 1997). Antibiotics have been used extensively in animal
feed to stimulate animal growth rate and to inhibit growth of intestinal pathogens.
However, continued feeding of antibiotics at sub-therapeutic levels has created concerns
about the extent to which usage increases antibiotic residue in food, develops drug
resistant bacteria, and reduces the ability to cure bacterial infections in humans (Jensen,
1998). Antibiotic use in animal production is no longer desirable because of concerns
about increasing antibiotic resistant pathogenic microorganisms in both veterinary and
human medicine (Nawaz et al., 2000; Bertolatti et al., 2003; Wallace, 2004).
Increased awareness of potential problems associated with the use of antibiotics
has stimulated research efforts to identify alternatives to antibiotics used as feed
additives. Novel approaches to the development of antimicrobial compounds and

51
materials are probiotics, prebiotics (Murry et al., 2004), organic acids (Van Immerseel et
al., 2006), medical herbs (Wink, 1999; Gordon and David, 2001; Du and Hu, 2004; Arab
et al., 2006) and plant extracts. Many potential antibacterial compounds (Sen et al.,
1998b; Avato et al., 2006) have not been surveyed adequately for effectiveness.
The intent of this study is to determine the anticoccidial, anticlostridial and
growth effects of guar meal and its saponin-rich extracts on biological activities
evaluated by using hemolytic and antibacterial assays. To date, no research has
evaluated the biological activities of saponin-rich guar meal extract. In this study, the
biological activity of the guar meal and its saponin-rich extracts focused on four
pathogenic gram-negative and gram-positive bacteria (Staphylococcus aureus,
Salmonella Typhimurium, Escherichia coli, and Clostridium perfringens), one
pathogenic protozoan (Eimeria tenella) and one beneficial gram-positive bacterium
(Lactobacillus spp.). Four experimental studies were conducted. Therefore, the first
study was conducted to isolate several fractions of saponin-rich guar meal extract and
evaluate these extracts for hemolytic and antibacterial activities against Staphylococcus
aureus, Lactobucillus spp., Escherichia coli and Salmonella Typhimurium in a dose
dependent manner. The second study was conducted to evaluate the hemolytic and
antibacterial activities of saponin-rich guar meal against Staphylococcus aureus,
Escherichia coli and Salmonella Typhimurium in comparison to three common
commercial saponin sources (yucca, quillaja and soybean) in a dose dependent manner.
The third study was conducted to determine the anticoccidial effect of adding 5% guar
meal in a corn-soy based broiler starter diet in chicks challenged by Eimeria tenella.

52
Body weight, feed conversion ratio, mortality rate, duodenal pH, cecal lesion
score, and number of oocysts per gram of feces were measured. The fourth study was
conducted to determine whether addition of either 2.5% guar meal, 1% guar gum or
0.125% saponin-rich guar meal extract in 55% wheat-corn-based broiler starter diets
would ameliorate lesions of necrotic enteritis in broiler chickens challenged with
Clostridium perfringens.
53
CHAPTER III
ANTIMICROBIAL AND HEMOLYTIC ACTIVITIES OF SAPONIN-RICH
EXTRACTS FROM GUAR MEAL
Introduction
Antibiotics used in animal production are no longer desirable because of
concerns about bacterial resistance (Wallace, 2004). Increased awareness of the potential
problems associated with the use of antibiotics stimulates research efforts to identify
alternatives to their use as feed additives. Novel approaches to the development of new
antimicrobial like compounds to treat diseases or to improve poultry growth include
dietary use of probiotics, prebiotics (Drake et al., 2003; Patterson and Burkholder, 2003;
Murry et al., 2004; Higgins et al., 2005b; 2007; Tellez et al., 2006), organic acids (Van
Immerseel et al., 2006), medicinal herbs (Wink, 1999; Gordon and David, 2001; Du and
Hu, 2004; Arab et al., 2006), non-traditional chemicals (Moore et al., 2006) and
bacteriophages that are bacteria-killing viruses (Higgins et al., 2005a; Vicente et al.,
2005).
Original candidate chemical structures for many pharmaceutical compounds that
promote human health originated from chemicals found in plant extracts (Du and Hu,
2004; Arab et al., 2006). Among these plant compounds are saponins from quillaja and
yucca which have beneficial effects on animal health (Sen et al., 1998b; Avato et al.,
2006). Saponins are glycoside compounds whose chemical structures are composed of a
fat-soluble nucleus (aglycone) that is either a triterpenoid (C-30) or neutral or alkaloid

54
steroid (C-27) attached to one or more side chains of water-soluble sugars (glycone)
through ester linkages to the aglycone nucleus at different carbon sites. Triterpenoid
saponins predominate in soybean, alfalfa, quillaja and guar while steroid saponins
predominant in yucca, tomato and oats (Tschesche et al., 1969; Kaneda et al., 1987;
Haralampidis et al., 2002).
Among the various biological effects of saponins are hemolytic activity
(Schmidt-Thome and Prediger, 1950; Joos and Ruyssen, 1967; Seeman et al., 1973;
Fukuda et al., 1985; Khalil and El-Adawy, 1994; Woldemichael and Wink, 2001) and
antibacterial activity (Mahato et al., 1982; Sen et al., 1998a, b). Some saponins are
suspected to be beneficial while others are considered hazardous to animals. Biological
activities of saponins are affected by factors such as the saponin nucleus type, number of
sugar side chains and type of functional groups (Cheeke, 1998; Osbourn, 2003).
Guar, Cyamopsis tetragonoloba L. (syn. C. psoraloides) or cluster bean is a
drought tolerant annual legume grown primary for the guar gum (galactomannan
polysaccharide) that has many industrial and food processing applications. Guar meal is
a combination of hull and germ fractions that is produced as a by-product of guar gum
manufacture. Guar is used in some parts of the world, primarily India and Pakistan, as a
human and animal food. Guar also contains 5-13% crude saponin by weight of dry
matter (Curl et al., 1986; Hassan et al., 2007) and thus contains potentially useful
bioactive compounds. No research has evaluated the biological activities of guar
saponin. Therefore, this study reports isolation of saponin-rich guar meal extract and
evaluates these extracts for hemolytic and antibacterial activities against two gram-

55
positive bacteria (Lactobacillus spp. and Staphylococcus aureus) and two gram-negative
bacteria (Escherichia coli and Salmonella Typhimurium) in a dose dependent manner.
Materials and Methods
Isolation of Saponin-Rich Guar Extract
Guar meal (Rhodia Inc., Vernon, TX) was ground in a commericial coffee mill to
form a fine powder and subsequently extracted by refluxing 25 g of guar meal with 250
mL of ethanol:water, 1:1 (v:v) for 3 h in a simple reflux apparatus according to the
method of Livingston et al. (1977) and Khalil and El-Adawy (1994). Refluxed extracts
were cooled and filtered through 150-µm (Watman No. 2) then 125-µm pore size
(Watman No. 114) filter papers. Ethanol was removed from the filtered extract by
evaporating under reduced pressure in a roto-evaporator (Buchi, Rinco Instrument Co.,
Inc., Greenville, IL, Switzerland, model 310391) until two-thirds of the initial volume
was removed. The remaining aqueous extract was partitioned with n-butanol, 1:1 (v: v)
overnight at room temperature using a separatory funnel. The upper n-butanol extract
was collected in a glass flask and the lower aqueous extract was collected and further
partitioned with n-butanol two more times to increase the yield of crude saponin. The
butanol extracts were pooled and evaporated to dryness using the roto-evaporator
procedure described above. A minimum volume of water was added to the dry n-butanol

56
extract and the resulting material was freeze-dried, weighed and stored at room
temperature until used in further studies.
Preparative Chromatography of Guar Saponin
A 40 mm x 150 mm inner diameter flash chromatography column was packed
using 30 g of 230-400 mesh C-18 media (EMD Chemicals Inc.) in 100% iso-propanol.
The column was incorporated into a Bio Rad Biologic chromatography workstation
with a model 2128 fraction collactor and equilibrated with isopropanol for 5 min at a
flow rate of 30 mL/min. Freeze-dried n-butanol extract was dissolved into distilled water
and injected onto the preparative reverse-phase column and developed with a step
gradient of methanol:water (20:80, 60:40 and 100:0, (v:v), respectively over a 96 min
run time at a flow rate of 4 mL/min. The 20% methanol mobile-phase eluted a yellow
and orange peak, presumably rich in flavanoids. The 60% and 100% mobile-phase
eluted two colorless peaks (Figure 4). Peaks eluting with 20, 60, and 100% MeOH were
pooled separately into 3 fractions designated 20% MeOH, 60% MeOH and 100% MeOH
and evaporated to dryness using the roto-evaporator. A minimum volume of water was
added to each dry methanol extract and the resulting material was freeze-dried,
separately weighed and stored at room temperature until needed. The procedure was
repeated to obtain sufficient pooled semi-purified material.

57
Time (min)
Figure 4. Example elution profile of reverse-phase C-18 flash chromatography of saponin-rich guar meal n-butanol extract. Fractions eluted at 20%, 60% and 100% methanol, respectively.
Abs
orba
nce
(254
nm
)

58
Isolation of 100% Methanol Sub-fractions
The 100% methanol extract was further separated into sub-fractions using
preparative normal-phase high pressure liquid chromatography (Waters, model 510). In
a small test tube 15 mg of freeze-dried the 100% methanol extract was dissolved in 1 mL
of acetonitrile and 50-250 µl of the resultant solution was injected onto a silica gel
preparative HPLC column (Waters, RCM 25 x 10). The column was preequilibrated and
developed with isocratic acetonitrile:water (H2O) + 0.025% trichloroacetic acid (TCA)
(50:50, v:v) at a 4 mL/min flow rate using an isocratic mobile-phase over a 50 min run
time. Four major peaks were detected at 254 nm (Waters 994, programmable photodiode
array detector) and collected with a fraction collector (Gilson model 203) at 16, 39, 44,
and 46 min retention times. This procedure was repeated to obtain sufficient purified
material. Pooled material was evaporated under reduced pressure to remove the last
traces of acetonitrile. A minimum volume of water was added to the dry fractions and
the resulting material was freeze-dried, weighed and stored at room temperature until
used in further studies.
An additional seven fractions of guar meal extracts were prepared by Dr. Mark
Berhow (Agriculture Research Service, USDA, Peoria, IL). Guar meal was extracted
nine times with methanol at 100oC under 15, 000 psi in a Dionex ASE 300 automatic
solvent extractor. The pooled extract was allowed to stand overnight and the residue was
filtered and the extract dried at room temperature over several days. The dry extract was
resuspended in water and partitioned with n-butanol and water, 1:1 (v: v) to collect n-
butanol and aqueous solutions. The aqueous portion was partitioned with n-butanol two

59
more times to increase the yield of crude saponin in the n-butanol fraction. The pooled
n-butanol extract was dried with a roto-evaporator. The dry n-butanol extract was
resuspended in a mixture of water and methanol and loaded onto a C-18 stationary-phase
flash chromatography column and eluted with an isocratic and then linear gradient of
30% to 80% acetonitrile against 0.2% acetic acid in water. Seven fractions (A, B, C, D,
E, F and G) were detected by absorbance peaks at 210 nm and collected. A minimum
volume of water was added and the fractions were freeze-dried until used in further
studies.
Hemolytic Activity Assay
Chicken blood was collected from three mature roosters using 20 mL syringes
with 18 gauge needles. Syringes were prefilled with 10 mL of phosphate buffered saline
(PBS) supplemented with sodium citrate as anticoagulant (15.1 mg/mL PBS, 1:1, v/v).
Blood samples were decanted into test tubes and placed in an ice bath. Red blood cells
were separated by centrifugation (1,000 x g for 5 min) and resuspended with PBS. This
procedure was repeated three additional times until the supernatant was colorless. A final
2% cell suspension of red blood cells was prepared by suspending 200 µL of red blood
cells with 800 µL of PBS. Fresh cell suspensions were prepared daily.
Stock solutions of 2 mg of 20, 60, and 100% methanol saponin-rich guar meal
extracts, four sub-fractions of the 100% methanol extract (16, 39, 43 and 46 min
retention time) and seven fractions prepared by Dr. Mark Berhow were dissolved in 1
mL of PBS and filtered using 0.2-μm filters. The hemolytic assay was conducted in 96-

60
well flat bottom microtitre plates (eight rows by twelve columns) with low evaporation
lids (MicrotestTM, Becton Dickinson, USA). One hundred microliters of PBS were added
to all wells of the plate except the wells in the first two columns in which 100 μL of
distilled water were added. Then, 100 μL of each 20, 60, and 100% methanol extract
stock solutions were pipetted into the first row of columns 3 to 11 with three columns for
each extract. The contents of the first row of wells in columns 3 to 11 were serially
diluted through row 8 by aspirating and redispensing 3 times then transferring 100 µL to
the next row. This procedure was repeated until 100 µL were discarded from each
column after the last dilution. One hundred microliters of the 2% blood cell suspension
were added to all wells of the plate. This procedure resulted in 8 dilutions ranging from
0.01-1.0 mg methanol extract/mL of PBS. The first two columns containing distilled
water with blood were 100% hemolysis positive control wells, while column 12
containing PBS and blood alone served as the 0% hemolysis negative control wells.
Each plate included three wells for each concentration of 20, 60, and 100% methanol
extracts with two plates per replicate with three replicate plates per experiment.
The same procedure was used to assay the hemolytic activity of the four sub-
fractions of the 100% methanol extract (16, 39, 43 and 46 min retention time), but with
two microtiter columns for each sub-fraction and two columns for negative and positive
controls. Each plate included two wells for each concentration of each fraction with two
plates per replicate with three replicate plates per experiment.
Also, the same procedure was performed to assay the hemolytic activity of the
seven fractions prepared by Dr. Mark Berhow using 50 µL rather than 100 µL of the 2%
61
blood cell suspension. Guar extract concentrations ranged from 0.005-0.666 mg/mL of
PBS and each plate included one replicate for each concentration with two plates per
replicate with three replicate plates per experiment.
Each plate was sealed with Parafilm (Pechiney Plastic Package, Neenah, WI) and
covered with a polystyrene plate lid. Plates were incubated for 3 h at room temperature.
Preliminary scanning of hemolysis in culture plate wells at wavelengths 405, 455, 520
and 650 nm showed that 650 nm was most efficient. The 650 nm wavelength allowed for
optimum readings of blood cell lysis with little interference. Turbidity was measured by
reading well optical density at 650 nm using a multi-well plate Bio-Rad® ELISA reader
and observing a decrease in optical density associated with cell lysis.
Antibacterial Activity Assay
Minimum inhibitory concentration values (MIC) were used as a measure of
antibacterial activity of 20, 60, and the 100% methanol saponin-rich guar meal extracts
using two gram-positive bacteria, Staphylococcus aureus (ATCC 49525) and
Lactobucillus spp. and two gram-negative bacteria, Salmonella Typhimurium (NCIM
2719) and Escherichia coli (ATCC 933). Average concentration of each bacterium was
1.90 x 10⁶, 7.20 x 10⁷, 5.74 x10⁵ and 3.88 x 10⁶ colony forming units/mL (cfu/mL),
respectively. Antibacterial activity of the four sub-fractions (16, 39, 43, and 46 min) of
the 100% methanol extract were evaluated using one gram-positive bacterium,
Staphylococcus aureus (ATCC 49525) and two gram-negative bacteria, Salmonella
Typhimurium (NCIM 2719) and Escherichia coli (ATCC 933). Average concentration

62
of each bacterium was 1.90 x 10⁶, 7.20 x 10⁷ and 5.74 x10⁵ colony forming units/mL
(cfu/mL), respectively. The cfu/mL density of cultures was confirmed after distribution
into assay plates by the following procedure. All bacterial stock solutions were serially
diluted 10-fold and plated by inoculating 100 µL onto tryptic soy agar (TSA) (DifcoTM,
Becton Dickinson, USA) plates. The plates were incubated for 24 h at 37oC. Colonies
were counted to calculate the cfu/mL of the stock bacteria solutions. Dr. Berhow’s 7
guar fractions were not evaluated for antibacterial activity due to insuffient quantity of
guar extract.
Stock solutions of growing bacteria and standard stock concentrations of each
extract were prepared. A stock solution of each bacterium was prepared by inoculating
100 µL of overnight cultures of each bacterium into 10 mL of sterile tryptic soy broth
(TSB) (BactoTM, Becton Dickinson, USA) and incubating overnight at 37oC. Prior to
use, all bacterial stock solutions were passed to new TSB every 8 h three times over a 24
h period to reach log phase growth for use in the study. A stock solution of each extract
was prepared by dissolving 25 mg of each extract/mL of TSB and filtering solutions
through 0.2-μm filters before use in 96-well plates. A stock solution of ampicillin was
prepared at a concentration of 2 mg/mL of TSB as a positive control.
Minimum inhibitory concentration assays were conducted in 96-well flat bottom
microtiter plates (eight rows by twelve columns) with low evaporation lids. One hundred
microliters of TSB were added to all wells except the wells in the first column where
200-μL aliquots of TSB were added. The first column contained only TBS to assure
absence of TSB contamination. Column 2 contained ampicillin as a positive control to

63
show minimal growth (0% bacterial growth) while columns 3-11 contained guar meal
extracts with three columns for each extract. TSB with bacteria alone in column 12
served as a negative control for maximal growth (100% bacterial growth). This
procedure resulted in eight serially 2-fold concentration dilutions ranging from 0.10-12.5
mg of each extract/mL of TSB, and 0.01-1.0 mg of ampicillin/mL of TSB as described
previously. Each plate included three replicates of each extract at each concentration
with two plates per replicate and three replicate plates per experiment.
The same procedure was used to assay the antibacterial activity of the four sub-
fractions of the 100% methanol extract (16, 39, 43 and 46 min retention time), by adding
50 µL of each bacterium to each well. Methanol extract concentrations ranged from
0.005-0.666 mg/mL of TSB. Each plate included two wells for each concentration of
guar fraction with two plates per replicate with three replicate plates per experiment.
Preliminary scanning of bacterial growth in culture plate wells at wavelengths 405, 455,
520 and 650 nm showed that 650 nm was most efficient. The 650 nm wavelength
allowed for optimum readings of bacterial growth with little interference in absorption
by saponin extract solutions. Turbidity (growth or inhibition of the bacterial growth) was
examined at 0 h and after 24 h of incubation using a Spectra Max 190 plate reader and
Soft Max Pro. 3.0 Software (Molecular Devices Corp., Sunnyvale, CA). Bacterial
growth was determined by comparison with negative controls in which 100% bacterial
growth was recorded.

64
Statistical Analysis
Each treatment group resulted from 18 individual values (n = 3 replicates, two
plates per replicate with 3 wells per plate) of 20, 60, 100% methanol saponin-rich guar
meal extracts and 12 individual values (n = 3 replicates, two plates per replicate with 3
wells per plate) of four sub-fractions of the 100% methanol extract for the hemolytic and
antibacterial activities, respectively. Dr. Berhow’s seven fractions resulted in 6
individual values (n = 3 replicates, two plates per replicate with one well per plate) for
hemolytic activity. Means of guar saponin fractions at each concentration were
compared to the negative control group in order to establish significant differences
among treatment groups in hemolytic and antibacterial activities. The MIC for each
treatment was recorded at the lowest concentration which inhibited growth compared to
the negative control group. Data obtained were subjected to one-way ANOVA and were
expressed as mean ± standard error of mean (SEM) using the GLM program of statistical
software (SPSS 14.0, SPSS Inc., Chicago, IL). Treatment means were separated (P ≤
0.05) using Duncan’s multiple range test (Duncan, 1955).
Results and Discussion
Initial guar meal ethanol extracts were subsequently partitioned by n-butanol and
subjected to reverse-phase flash chromatography. This extract separated into a yellow
and orange peak eluting with 20%, and 1 peak each with 60 and 100% methanol (Figure
4). Yields averaged 1.72 ± 0.47, 0.88 ± 0.16, 0.91 ± 0.16 and 1.55 ± 0.15% by weight of
the original material, respectively. Further purification of the 100% methanol extract

65
using preparative normal-phase HPLC resulted in eluting 4 peaks at 16, 39, 44 and 46
min.
Saponins frequently are isolated by boiling in methanol (Massiot et al., 1991;
Oleszek et al., 1992), ethanol (Levy et al., 1989; Oleszek et al., 1990) and n-butanol
(Massiot et al., 1991; 1992). In this experiment, guar meal was extracted by
ethanol:water (1:1, v:v) and the resultant extract was partionated with n-butanol (1:1,
v:v) to elute crude guar saponin. Khalil and El-Adawy (1994) extracted saponins from
peas, beans and soybean seeds by refluxing seed samples using four different methods.
They extracted with ethanol:water (1:1) for 2.5 h in a water bath at 95oC, pure methanol
in a Soxhlet apparatus for 50 h, pure distilled water for 5 h in a boiling water bath, and
phosphate buffered saline at pH 7.3 while shaking for 2 h. They found that the
ethanol:water (1:1) extract showed the highest toxicity as assayed by hemolytic activity
and fish mortality. Extraction with n-butanol efficiently isolates monodesmosidic and
short-sugar-chain bisdesmosidic saponins, but results in partial or total loss of long-chain
bisdesmosidic and trisdesmoside saponins (Oleszek, 1996).
Oleszek (1988) noted that saponin-rich plant extract purified using graded
methanol concentrations showed that eluants up to 40% methanol remove carbohydrates
and some phenolics. Eluants containing 50-60% methanol remove only the bisdesmoside
saponins, while 70-80% methanol removes monondesmoside saponins. This phenomina
may explain the antibacterial and hemolytic properties of the presumed saponin
structures isolated by the 100% methanol solution rather than 20 and 60% methanol
solutions reported later in this study. Curl et al. (1986) mentioned that the predominant

66
guar saponins have two sugar side chains, one attached at C-3 and another at C-29. It is
not known whether the saponins isolated in the 100% methanol and 16-min sub-fractions
are bidesmoside or monodesmoside saponins.
Further purification was performed using a 3-step methanol gradient in
combination with a reverse-phase C-18 column and three methanol extracts (20, 60 and
100%) were eluted. Pure saponins can not usually be obtained by reverse-phase C-18
chromatography alone (Oleszek et al., 1990; 1992). Individual saponins can be
selectively isolated from n-butanol extract subjected to reverse-phase C-18
chromatography followed by normal-phase HPLC silica gel column with water:
acetonitrile solvent systems (Kesselmeier and Strack, 1981). In this experiment, further
saponin purification was performed by subjecting the 100% methanol extract to normal-
phase silica gel column, and four sub-fraction peaks were eluted at different retention
times (16, 39, 43 and 46 min).
The 20 and 60% methanol extracts were not hemolytic at any concentration
tested (Table 1). The water positive control (100% hemolysis) and PBS negative control
(0% hemolysis) were used as standard references. The 100% methanol extract was
hemolytic until diluted to less than 0.25 mg extract/mL. Further fractionation of the
100% methanol peak by HPLC yielded four retention time sub-fractions. The 16-min
peak retention time was the only sub-fraction of the 100% methanol extract with
hemolytic activity (Table 2). This fraction was hemolytic until diluted to less than 0.06
mg extract/mL of PBS concentration. Evaluation of the hemolytic activity of seven guar
67
Table 1. Hemolytic activity of saponin-rich guar meal extract separated into 20, 60 and 100% methanol fractions following reverse-phase C-18 chromatography
a-cMeans (± SEM, n = 3) within a row that do not share a common superscript are significantly different (P ≤ 0.05). 1Water replaced saponin solutions as a positive control since this treatment results in 100% hemolysis 2Phosphate buffered saline replaced saponin solutions as a negative control since this treatment results in 0% hemolysis. 3Lower values are associated with increased cell lysis.
Saponin Extract
Methanol Extracts Positive Control1
Negative Control2
20% 60% 100%
mg/mL Optical Density (OD3) 1.00 0.16 ± 0.01c 0.86 ± 0.05a 0.74 ± 0.01a 0.72 ± 0.01a 0.39 ± 0.04b 0.50 0.17 ± 0.01c 0.81 ± 0.03a 0.78 ± 0.01a 0.77 ± 0.01a 0.44 ± 0.04b 0.25 0.15 ± 0.01c 0.87 ± 0.04a 0.78 ± 0.02a 0.78 ± 0.02a 0.54 ± 0.04b 0.13 0.16 ± 0.02b 0.84 ± 0.03a 0.78 ± 0.01a 0.79 ± 0.01a 0.88 ± 0.02a 0.06 0.18 ± 0.02b 083 ± 0.08a 0.79 ± 0.01a 0.81 ± 0.02a 0.86 ± 0.02a 0.03 0.16 ± 0.01b 0.85 ± 0.05a 0.76 ± 0.01a 0.80 ± 0.02a 0.81 ± 0.01a 0.02 0.16 ± 0.01b 0.82 ± 0.01a 0.77 ± 0.01a 0.79 ± 0.01a 0.81 ± 0.01a 0.01 0.16 ± 0.01b 0.85 ± 0.04a 0.77 ± 0.01a 0.76 ± 0.01a 0.76 ± 0.01a

68
Table 2. Hemolytic activity of four sub-fractions following normal-phase preparative HPLC of the 100% methanol fraction
Saponin Extract
Peak Retention Times (min) Positive Control1
Negative Control2
16 39 44 46
mg/mL Optical Density (OD3)
1.00 0.30 ± 0.01b 0.77 ± 0.05a 0.31 ± 0.01b 0.87 ± 0.01a 0.81 ± 0.01a 0.84 ± 0.04a 0.50 0.30 ± 0.01b 0.77 ± 0.05a 0.30 ± 0.01b 0.82 ± 0.01a 0.80 ± 0.01a 0.81 ± 0.04a 0.25 0.30 ± 0.01b 0.77 ± 0.05a 0.33 ± 0.01b 0.80 ± 0.02a 0.80 ± 0.02a 0.79 ± 0.04a
0.13 0.30 ± 0.01b 0.77 ± 0.05a 0.36 ± 0.01b 0.80 ± 0.01a 0.80 ± 0.01a 0.82 ± 0.02a 0.06 0.30 ± 0.01b 0.77 ± 0.05a 0.41 ± 0.01b 0.79 ± 0.01a 0.81 ± 0.02a 0.83 ± 0.02a 0.03 0.30 ± 0.01b 0.77 ± 0.05a 0.67 ± 0.01a 0.77 ± 0.01a 0.78 ± 0.02a 0.81 ± 0.01a
0.02 0.30 ± 0.01b 0.77 ± 0.05a 0.75 ± 0.01a 0.78 ± 0.01a 0.77 ± 0.01a 0.80 ± 0.01a 0.01 0.30 ± 0.01b 0.77 ± 0.05a 0.75 ± 0.01a 0.78 ± 0.01a 0.77 ± 0.01a 0.80 ± 0.01a
a-bMeans (± SEM, n = 3) within a row that do not share a common superscript are significantly different (P ≤ 0.05). 1Water replaced saponin solutions as a positive control since this treatment results in 100% hemolysis 2Phosphate buffered saline replaced saponin solutions as a negative control since this treatment results in 0% hemolysis. 3Lower values are associated with increased cell lysis.

69
fractions prepared by Dr. Mark Berhow using reverse-phase C-18 chromatography
indicated that the F and G fractions were the only two fractions having hemolytic activity
until diluted to less than 0.042 and 0.666 mg extract/mL, respectively (Table 3). The F
and G fractions were roughly equivalent to the 100% methanol extract eluted by our
Texas A&M flash chromatography system. Fraction F was subjected to analytical HPLC
(Figure 5) and at least 4 major peaks eluted with retention times between 30 and 40 min.
Lindahl et al. (1957) reported that hemolysis can be used to identify the presence of
saponins in plant extracts. However, hemolytic activity is not an attribute of all saponins.
While quillaja saponins exhibit hemolytic activity (Jenkins and Atwal, 1994), other
saponins from soybeans which are a mixture of soyasapogenol glycosides are not
hemolytic (Gestetner et al., 1968). Also, not all saponins extracted from the same plant
have the same hemolytic activity. Shany et al. (1970) showed that alfalfa root extracts are
more hemolytic than those from alfalfa tops.
Some authors suggest that aglycone:glycone ratios (Segal et al., 1966; 1974),
number of polar groups (Namba et al., 1973) and carbohydrate side chain length are the
determinant features in hemolytic activity (Kuznetzova et al., 1982). Hemolytic activity is
generally thought to be due to effects on cell membrane permeability by forming pores in
membranes (Authi et al., 1988; El Izzi et al., 1992; Choi et al., 2001; Menin et al., 2001;
Plock et al., 2001), altering the sodium–potassium and calcium–magnesium ATPase
activities (Choi et al., 2001), or insertion of the hydrophobic saponin nucleus into the
lipid bilayer (Brain et al., 1990; Hu et al., 1996). Although we do not know the precise

70
Table 3. Hemolytic activity of seven fractions of guar meal eluted by flash reverse-phase C-18 chromatography
Saponin Extract
Fractions
Positive Control1
Negative Control2
A B C D E F G
mg/mL Optical Density (OD3)
0.666 0.42 ± 0.01c 1.01 ± 0.05a 0.99 ± 0.01a 0.99 ± 0.01a 1.00 ± 0.01a 1.01 ± 0.01a 1.01 ± 0.01a 0.43 ± 0.01c 0.65 ± 0.01b
0.333 0.42 ± 0.01c 1.01 ± 0.05a 0.99 ± 0.01a 1.00 ± 0.01a 1.01 ± 0.01a 1.01 ± 0.01a 1.01 ± 0.01a 0.46 ± 0.01b 1.00 ± 0.01a
0.167 0.42 ± 0.01b 1.01 ± 0.05a 1.00 ± 0.01a 1.01 ± 0.02a 1.01 ± 0.02a 1.01 ± 0.01a 1.01 ± 0.01a 0.50 ± 0.01b 1.00 ± 0.01a
0.083 0.42 ± 0.01c 1.01 ± 0.05a 1.01 ± 0.01a 1.01 ± 0.01a 1.01 ± 0.01a 1.01 ± 0.01a 1.01 ± 0.01a 0.78 ± 0.01b 1.01 ± 0.01a
0.042 0.42 ± 0.01b 1.01 ± 0.05a 1.03 ± 0.01a 1.01 ± 0.01a 1.01 ± 0.02a 1.01 ± 0.01a 1.02 ± 0.01a 0.99 ± 0.01a 1.01 ± 0.01a
0.021 0.42 ± 0.01b 1.01 ± 0.05a 1.03 ± 0.01a 1.02 ± 0.01a 1.02 ± 0.02a 1.02 ± 0.01a 1.01 ± 0.01a 1.00 ± 0.01a 1.02 ± 0.01a
0.011 0.42 ± 0.01b 1.01 ± 0.05a 1.02 ± 0.01a 1.01 ± 0.01a 1.01 ± 0.01a 1.01 ± 0.01a 1.00 ± 0.01a 1.02 ± 0.01a 1.01 ± 0.01a
0.005 0.42 ± 0.01b 1.01 ± 0.05a 1.02 ± 0.01a 1.02 ± 0.01a 1.01 ± 0.01a 1.01 ± 0.01a 1.01 ± 0.01a 1.02 ± 0.01a 1.02 ± 0.01a
a-cMeans (± SEM, n = 3) within a row that do not share a common superscript are significantly different (P ≤ 0.05). 1Water replaced saponin solutions as a positive control since this treatment results in 100% hemolysis. 2Phosphate buffered saline replaced saponin solutions as a negative control since this treatment results in 0% hemolysis. 3Lower values are associated with increased cell lysis.

71
Retention time (min)
Figure 5. Example analytical HPLC chromatography of guar fraction (F) from Dr. Mark Berhow.

72
structure of the guar hemolytic fractions isolated in this study, researchers mention that
the higher the Rf of saponins isolated, the higher the hemolytic activity using thin layer
chromatography on silicia gel (Gestetner, 1971; Gestetner et al., 1971; Khalil and El-
Adawy, 1994). High retention factors (Rf) are characteristics of less polar compounds as
they travel with the solute as the mobile-phase on silicia gel plate or column (solid-phase
or stationary-phase). These observations agree with the results obtained in this study
where the 16-min peak had the highest Rf and the highest hemolytic activity among all
sub-fractions of the 100% methanol extract.
The minimum inhibitory concentration (MIC) is the lowest concentration of
antibiotic or, in this case, saponin-rich extract that can inhibit growth of a bacterium. The
100% methanol extract was more effective than either 20 or 60% methanol extracts
against Staphylococcus aureus, Lactobacillus spp., Escherichia coli and Salmonella
Typhimurium (Table 4).
It is of interest that the 20 and 60% methanol extracts showed a mild prebiotic
effect with Lactobacillus spp. at concentrations ≥ 0.39 mg extract/mL. Minimum
inhibitory concentrations were 3.13 and 0.78 mg extract/mL for 100% methanol
saponin-rich guar meal extracts against gram-positive Staphylococcus aureus (Table 5)
and Lactobacillus spp. (Table 6) respectively. A similar MIC was observed for the 100%
extract exposed to the gram-negative Escherichia coli (Table 7) and Salmonella
Typhimurium (Table 8) at 1.56 and 0.78 mg extract/mL, respectively.
The 16 min sub-fraction of the 100% methanol extract was the only effective
fraction against Staphylococcus aureus at concentrations equal to or above than 0.333

73
mg extract/mL (Table 9). None of the sub-fractions of 100% methanol exhibited any
antibacterial activity against both two gram-negative bacteria (Escherichia coli and
Salmonella Typhimurium) at the concentrations tested in this study (Tables 10 and 11).
The normal-phase sub-fractions were not tested against Lactobacillus spp. The results
suggested some antibacterial activity was lost during the sub-fractioning of the reverse-
phase 100% MeOH extraction.
Table 4. Minimal inhibitory concentration (MIC1) of antibacterial activity of reverse- phase 20, 60 and 100% methanol saponin-rich guar meal extracts against Staphylococcus aureus, Lactobacillus spp., Escherichia coli and Salmonella Typhimurium
Bacterium
Methanol Extract
100% 60% 20%
MIC (mg/mL)
Staphylococcus aureus 3.13 12.5 12.5
Lactobacillus spp. 0.78 PB2 PB
Escherichia coli 1.56 12.5 ND3
Salmonella Typhimurium 0.78 12.5 12.5
Means of MIC values of each saponin source against different bacteria show in the same column. 1MIC, the lowest concentration of antibiotic or saponin that inhibits growth of a microbe. 2PB, prebiotic effect detected as indicated by microbial growth stimulation at ≥ 0.39 mg/mL saponin extract.
3ND, MIC assay did not show antibacterial activity at the concentrations tested.
In general, many saponins are considered natural antimicrobial compounds
making up a plant’s defense systems (Mahato et al., 1982; Hussain and Cheeke, 1995;

74
Table 5. Antimicrobial activity against Staphylococcus aureus of reverse-phase 20, 60 and 100% methanol saponin-rich guar meal extracts
a-dMeans (± SEM, n = 3) within a row that do not share a common superscript are significantly different (P ≤ 0.05). 1Positive control, contained only ampicillin at 0.01 to 1.0 mg/mL. 2Negative control, contained neither ampicillin nor saponin. 3Lower values of optical density were indicative of decreased bacterial growth and increased antibacterial activity.
Saponin Extract
Methanol Extracts Positive Control1
Negative Control2
100% 60% 20%
Mg/mL Optical Density (OD3) 12.50 0.25 ± 0.05d 1.14 ± 0.012a 0.52 ± 0.01c 0.93 ± 0.03b 1.02 ± 0.03b 6.25 0.51 ± 0.01c 1.14 ± 0.012a 0.69 ± 0.02b 1.07 ± 0.04a 1.17 ± 0.02a 3.13 0.54 ± 0.12c 1.14 ± 0.012a 1.00 ± 0.03b 1.05 ± 0.04a 1.14 ± 0.02a 1.56 0.56 ± 0.13b 1.14 ± 0.012a 1.13 ± 0.02a 1.10 ± 0.04a 1.14 ± 0.03a 0.78 0.57 ± 0.13b 1.14 ± 0.012a 1.16 ± 0.02a 1.14 ± 0.03a 1.13 ± 0.02a 0.39 0.56 ± 0.13b 1.14 ± 0.012a 1.18 ± 0.01a 1.12 ± 0.03a 1.12 ± 0.02a 0.20 0.72 ± 0.08b 1.14 ± 0.012a 1.21 ± 0.02a 1.13 ± 0.02a 1.12 ± 0.02a 0.10 0.86 ± 0.04a 1.14 ± 0.012a 1.14 ± 0.01a 1.09 ± 0.02a 1.09 ± 0.02a
75
Table 6. Antimicrobial activity against Lactobacillus spp. of reverse-phase 20, 60 and 100% methanol saponin-rich guar meal extracts
Saponin Extract
Methanol Extracts Positive Control1
Negative Control2
100% 60% 20%
mg/mL Optical Density (OD3) 12.50 0.05 ± 0.01e 1.25 ± 0.03c 0.30 ± 0.03d 1.42 ± 0.02a 1.31 ± 0.01b 6.25 0.05 ± 0.01e 1.25 ± 0.03c 0.77 ± 0.05d 1.39 ± 0.01a 1.35 ± 0.02b 3.13 0.05 ± 0.01d 1.25 ± 0.03b 1.11 ± 0.01c 1.32 ± 0.02a 1.30 ± 0.02a 1.56 0.05 ± 0.01d 1.25 ± 0.03b 1.07 ± 0.01c 1.33 ± 0.02a 1.31 ± 0.02a 0.78 0.05 ± 0.01d 1.25 ± 0.03b 1.13 ± 0.02c 1.34 ± 0.02a 1.33 ± 0.02a 0.39 0.26 ± 0.05c 1.25 ± 0.03b 1.23 ± 0.01b 1.35 ± 0.03a 1.30 ± 0.03a 0.20 0.43 ± 0.07c 1.25 ± 0.03b 1.24 ± 0.01b 1.34 ± 0.03a 1.32 ± 0.02a 0.10 0.70 ± 0.03b 1.25 ± 0.03a 1.20 ± 0.03a 1.29 ± 0.04a 1.25 ± 0.04a
a-eMeans (± SEM, n = 3) within a row that do not share a common superscript are significantly different (P ≤ 0.05). 1Positive control, contained only ampicillin at 0.01 to 1.0 mg/mL. 2Negative control, contained neither ampicillin nor saponin. 3Lower values of optical density were indicative of decreased bacterial growth and increased antibacterial activity.

76
Table 7. Antimicrobial activity against Escherichia coli of reverse-phase 20, 60 and 100% methanol saponin-rich guar meal extracts
Saponin Extract
Methanol Extracts Positive Control1
Negative Control2
100% 60% 20%
mg/mL Optical Density (OD3) 12.50 0.05 ± 0.00d 1.11 ± 0.02a 0.43 ± 0.03c 0.83 ± 0.04b 1.14 ± 0.00a 6.25 0.05 ± 0.01c 1.11 ± 0.02a 0.57 ± 0.02b 1.14 ± 0.01a 1.15 ± 0.01a 3.13 0.06 ± 0.01c 1.11 ± 0.02a 0.82 ± 0.02b 1.14 ± 0.02a 1.13 ± 0.02a 1.56 0.16 ± 0.01c 1.11 ± 0.02a 0.93 ± 0.01b 1.14 ± 0.01a 1.14 ± 0.01a 0.78 0.38 ± 0.04b 1.11 ± 0.02a 1.00 ± 0.01a 1.15 ± 0.01a 1.11 ± 0.01a 0.39 0.64 ± 0.03b 1.11 ± 0.02a 1.03 ± 0.01a 1.13 ± 0.01a 1.12 ± 0.01a 0.20 0.81 ± 0.01b 1.11 ± 0.02a 1.06 ± 0.01a 1.12 ± 0.01a 1.11 ± 0.00a 0.10 0.80 ± 0.01b 1.11 ± 0.02a 1.08 ± 0.03a 1.16 ± 0.02a 1.13 ± 0.00a
a-dMeans (± SEM, n = 3) within a row that do not share a common superscript are significantly different (P ≤ 0.05). 1Positive control, contained only ampicillin at 0.01 to 1.0 mg/mL. 2Negative control, contained neither ampicillin nor saponin. 3Lower values of optical density were indicative of decreased bacterial growth and increased antibacterial activity.

77
Table 8. Antimicrobial activity against Salmonella Typhimurium of reverse-phase 20, 60 and 100% methanol saponin-rich guar meal extracts
Saponin Extract
Methanol Extracts Positive Control1
Negative Control2
100% 60% 20%
mg/mL Optical Density (OD3) 12.50 0.05 ± 0.00e 1.20 ± 0.02a 0.53 ± 0.02d 0.94 ± 0.00c 1.10 ± 0.01b 6.25 0.05 ± 0.00c 1.20 ± 0.02a 0.67 ± 0.02b 1.18 ± 0.00a 1.21 ± 0.01a 3.13 0.05 ± 0.01c 1.20 ± 0.02a 0.96 ± 0.02b 1.16 ± 0.01a 1.16 ± 0.01a 1.56 0.06 ± 0.00c 1.20 ± 0.02a 1.04 ± 0.01b 1.16 ± 0.01a 1.15 ± 0.01a 0.78 0.06 ± 0.00c 1.20 ± 0.02a 1.09 ± 0.01b 1.19 ± 0.01a 1.14 ± 0.00a 0.39 0.15 ± 0.05b 1.20 ± 0.02a 1.10 ± 0.01a 1.12 ± 0.02a 1.13 ± 0.01a 0.20 0.44 ± 0.07b 1.20 ± 0.02a 1.09 ± 0.01a 1.14 ± 0.01a 1.09 ± 0.04a 0.10 1.18 ± 0.03a 1.20 ± 0.02a 1.10 ± 0.02a 1.11 ± 0.02a 1.12 ± 0.01a
a-eMeans (± SEM, n = 3) within a row that do not share a common superscript are significantly different (P ≤ 0.05). 1Positive control, contained only ampicillin at 0.01 to 1.0 mg/mL. 2Negative control, contained neither ampicillin nor saponin. 3Lower values of optical density were indicative of decreased bacterial growth and increased antibacterial activity.
78
Table 9. Antimicrobial activity against Staphylococcus aureus of normal-phase 16, 39, 44 and 46 min sub-fractions of 100% methanol saponin-rich guar meal extract
Saponin Extract
Peak Retention Times (min) Positive Control1
Negative Control2
16 39 44 46
mg/mL Optical Density (OD3)
0.666 0.05 ± 0.01c 0.51 ± 0.05a 0.23 ± 0.01b 0.54 ± 0.01a 0.55 ± 0.01a 0.55 ± 0.04a 0.333 0.05 ± 0.01c 0.51 ± 0.05a 0.33 ± 0.01b 0.46 ± 0.01a 0.41 ± 0.01a 0.42 ± 0.04a 0.167 0.05 ± 0.01b 0.51 ± 0.05a 0.43 ± 0.01a 0.43 ± 0.02a 0.38 ± 0.02a 0.38 ± 0.04a
0.083 0.47 ± 0.01a 0.51 ± 0.05a 0.49 ± 0.01a 0.42 ± 0.01a 0.40 ± 0.01a 0.40 ± 0.02a 0.042 0.48 ± 0.01a 0.51 ± 0.05a 0.55 ± 0.01a 0.38 ± 0.01a 0.39 ± 0.02a 0.40 ± 0.02a 0.021 0.47 ± 0.01a 0.51 ± 0.05a 0.51 ± 0.01a 0.40 ± 0.01a 0.39 ± 0.02a 0.39 ± 0.01a
0.011 0.47 ± 0.01a 0.51 ± 0.05a 0.49 ± 0.01a 0.40 ± 0.01a 0.40 ± 0.01a 0.41 ± 0.01a 0.005 0.52 ± 0.01a 0.51 ± 0.05a 0.55 ± 0.01a 0.46 ± 0.01a 0.45 ± 0.01a 0.45 ± 0.01a
a-cMeans (±SEM, n = 3) within a row that do not share a common superscript are significantly different (P ≤ 0.05). 1Positive control, contained only ampicillin at 0.005 to 0.666 mg/mL. 2Negative control, contained neither ampicillin nor saponin. 3Lower values of optical density were indicative of decreased bacterial growth and increased antibacterial activity.

79
Table 10. Antimicrobial activity against Salmonella Typhimurium of normal-phase 16, 39, 44 and 46 min sub-fractions of 100% methanol saponin-rich guar meal extract
Saponin Extract
Peak Retention Times (min) Positive Control1
Negative Control2
16 39 44 46
mg/mL Optical Density (OD3)
0.666 0.05 ± 0.01b 1.01 ± 0.05a 1.01 ± 0.01a 1.02 ± 0.01a 1.00 ± 0.01a 1.00 ± 0.01a 0.333 0.05 ± 0.01b 1.01 ± 0.05a 1.01 ± 0.01a 1.01 ± 0.01a 1.01 ± 0.01a 1.00 ± 0.01a 0.167 0.05 ± 0.01b 1.01 ± 0.05a 1.02 ± 0.01a 1.00 ± 0.01a 1.02 ± 0.01a 1.01 ± 0.01a
0.083 0.06 ± 0.01b 1.01 ± 0.05a 1.00 ± 0.01a 1.01 ± 0.01a 1.01 ± 0.01a 1.01 ± 0.01a 0.042 0.09 ± 0.01b 1.01 ± 0.05a 1.01 ± 0.01a 1.02 ± 0.01a 1.01 ± 0.01a 1.02 ± 0.01a 0.021 0.28 ± 0.01b 1.01 ± 0.05a 1.02 ± 0.01a 1.01 ± 0.01a 1.02 ± 0.01a 1.01 ± 0.01a
0.011 0.55 ± 0.01b 1.01 ± 0.05a 1.01 ± 0.01a 1.00 ± 0.01a 1.01 ± 0.01a 1.01 ± 0.01a 0.005 0.83 ± 0.01b 1.01 ± 0.05a 1.01 ± 0.01a 1.01 ± 0.01a 1.01 ± 0.01a 1.02 ± 0.01a
a-cMeans (± SEM, n = 3) within a row that do not share a common superscript are significantly different (P ≤ 0.05). 1Positive control, contained only ampicillin at 0.005 to 0.666 mg/mL. 2Negative control, contained neither ampicillin nor saponin. 3Lower values of optical density were indicative of decreased bacterial growth and increased antibacterial activity.

80
Table 11. Antimicrobial activity against Escherichia coli of normal-phase 16, 39, 44 and 46 min sub-fractions of 100% methanol saponin-rich guar meal extract
Saponin Extract
Peak Retention Times (min) Positive Control1
Negative Control2
16 39 44 46
mg/mL Optical Density (OD3)
0.666 0.05 ± 0.01b 0.72 ± 0.01a 0.70 ± 0.01a 0.71 ± 0.01a 0.70 ± 0.01a 0.71 ± 0.01a 0.333 0.05 ± 0.01b 0.72 ± 0.01a 0.70 ± 0.01a 0.71 ± 0.01a 0.70 ± 0.01a 0.71 ± 0.01a 0.167 0.05 ± 0.01b 0.72 ± 0.01a 0.70 ± 0.01a 0.71 ± 0.02a 0.70 ± 0.02a 0.71 ± 0.01a
0.083 0.05 ± 0.01b 0.72 ± 0.01a 0.70 ± 0.01a 0.70 ± 0.01a 0.70 ± 0.01a 0.70 ± 0.02a 0.042 0.11 ± 0.01b 0.72 ± 0.01a 0.70 ± 0.01a 0.70 ± 0.01a 0.71 ± 0.02a 0.70 ± 0.02a 0.021 0.29 ± 0.01b 0.72 ± 0.01a 0.70 ± 0.01a 0.71 ± 0.01a 0.71 ± 0.02a 0.71 ± 0.01a
0.011 0.40 ± 0.01b 0.72 ± 0.01a 0.70 ± 0.01a 0.70 ± 0.01a 0.72 ± 0.01a 0.71 ± 0.01a 0.005 0.53 ± 0.01b 0.72 ± 0.01a 0.70 ± 0.01a 0.70 ± 0.01a 0.71 ± 0.01a 0.71 ± 0.01a
a-bMeans (± SEM, n = 3) within a row that do not share a common superscript are significantly different (P ≤ 0.05). 1Positive control, contained only ampicillin at 0.005 to 0.666 mg/mL. 2Negative control, contained neither ampicillin nor saponin. 3Lower values of optical density were indicative of decreased bacterial growth and increased antibacterial activity.

81
Morrissey and Osbourn, 1999). Some studies reported antibacterial activity of dietary
saponins in ruminant animals. For example, adding yucca extracts to the ruminant
animal diet negatively affected cellulolytic bacteria without any effect on amylolytic
bacteria (Wang et al., 2000a, b). In another study adding saponin-rich yucca powder or
extract to ruminant animal diets inhibited gram-positive bacteria (Wallace et al., 1994;
Cheeke, 1998; Cheeke and Otero, 2005). Also, some studies noted that quillaja saponin
(Quillaja saponaria) and yucca saponin (Yucca schidigera) commercially produced by
different companies showed different antibacterial activity against Escherichia coli,
suggesting that saponins from various sources with different extraction procedures differ
in their biological activities most likely due to different chemical structures (Sen et al.,
1998b).
Kuete et al. (2006) reported significant antibacterial effects of saponin-rich
methanolic extracts from the stem bark of Tridesmostemon omphalocarpoides
(Sapotaceae). These observations agree with the results obtained from this study were
the 100% methanol saponin-rich extract of guar meal exhibited antibacterial activity
against all bacteria tested. Many saponins show a dose response effect on bacterial
activity such as saponins isolated from Bauhinia variegata L. bark that exhibited more
sensitivity for gram-negative bacteria than gram-positive bacteria at concentrations
ranging from 2.5 to 10 mg/mL (Morrissey and Osbourn, 1999).
In contrast, our results showed that the saponin-rich extract from guar meal was
more active against gram-positive bacteria than gram negative bacteria. These findings
agree with the results obtained by several studies reporting that saponin showed

82
antibacterial activity against gram-positive bacteria more than gram-negative bacteria
(Cioaca et al., 1978; Cheeke, 1998; Wallace et al., 1994; Cheeke and Otero, 2005; Avato
et al., 2006). These differences may be due to the degradation of these saponins by some
glucosidase enzymes produced by gram-negative bacteria. Variability of saponin
glycone side chains in terms of number, chemical composition specific point of
attachment to the steroid or triterpenoid nucleus is critical to the saponins biological
effects (Cheeke, 1998; Osbourn, 2003).
The mode of action of antibacterial activity of saponins against both gram-
negative and gram-positive bacteria is not yet clear. Avato et al. (2006) noted that the
aglycone part of the saponin is the antibacterial determinant suggesting that the sugar
moiety is not important for the antimicrobial efficacy while another study reported that
saponins hydrolyzed by bacterial enzymes to its corresponding aglycone resulted in
decreased antibacterial activity (Mandal et al., 2005).
Summary and Conclusions
Butanol extracts from guar meal yielded 4.8 ± 0.6% crude saponin by weight of
the original material. Butanol extract purified by reverse-phase C-18 flash
chromatography resulted in 2 peaks eluting with 20% methanol, and 1 peak each with
60, and 100% methanol to yield averages of 2.60 ± 0.32, 0.91 ± 0.16 and 1.55 ± 0.15%
crude saponin by weight of the original material, respectively. Further normal-phase
HPLC purification of the100% methanol saponin-rich guar meal extract eluted 4 peaks
with 16, 39, 44 and 46 min retention times. Hemolytic activity was observed only in the

83
100 % methanol guar meal extract and 16 min sub-fraction of the methanol extract.
Fractions F and G prepared by Dr. Mark Berhow also exhibited hemolytic activity.
Antimicrobial activity of the 100% MeOH extract was most effective against
Staphylococcus aureus and Escherichia coli bacteria. Only the 100% methanol extract
exhibited both hemolytic and antibacterial activities against Staphylococcus aureus,
Lactobacillus spp., Salmonella Typhimurium and Escherichia coli. The 20 and 60%
methanol extracts were neither hemolytic nor antibacterially active, but stimulated
Lactobacillus spp. Growth at concentrations more than or equal 0.39 mg/mL. Although
one can presume the saponins are interacting in some way with the bacterial cell walls.
The specific mode of action is not yet clear. So, more research is required to describe the
mode of action of saponins against both gram-positive and gram-negative bacteria.

84
CHAPTER IV
ANTIMICROBIAL AND HEMOLYTIC ACTIVITIES DIFFER AMONG
SAPONIN-RICH EXTRACTS FROM GUAR, QUILLAJA, YUCCA AND
SOYBEAN
Introduction
Development of antimicrobial compounds remains an interesting and important
area of research due to recent bans of a wide range of prophylactic antibiotics used in
animal feed (Wallace, 2004). Concerns about bacterial resistance to antibiotics and
subsequent restricted use of antibiotics for animal production applications have made
development of the compounds a necessity. In the last decade, several antimicrobial like
compounds have been suggested as antibiotic alternatives for prevention and treatment
of pathogenic diseases, and to improve animal and poultry performance. These
alternatives include dietary use of probiotics, prebiotics (Drake et al., 2003; Patterson
and Burkholder, 2003; Murry et al., 2004; Higgins et al., 2005b; 2007; Tellez et al.,
2006), organic acids (Van Immerseel et al., 2006), and medicinal herbs (Wink, 1999;
Gordon and David, 2001; Du and Hu, 2004; Arab et al., 2006). Non-traditional
treatments such as chlorate (Moore et al., 2006) and bacteriophages (Higgins et al.,
2005a; Vicente et al., 2005) also have been recently evaluated. Most of the chemical
structures of pharmaceutical compounds used today are structurally similar if not
identical to compounds isolated from plant extracts (Du and Hu, 2004; Arab et al.,
2006).

85
Among these original candidate chemical structures compounds are originating
from plants such as quillaja, yucca, and soybean. So, these plants produce saponins
which have several beneficial effects on animal health (Sen et al., 1998b; Avato et al.,
2006). Guar, Cyamopsis tetragonoloba L. (syn. C. psoraloides) or cluster bean is a
drought tolerant annual legume grown primarily for guar gum (galactomannan
polysaccharide) that has many industrial and food processing applications. Guar meal is
a combination of hull and germ fractions that is produced as a by-product of guar gum
manufacture. Guar is also reported to contain between 5 and 13% curd triterpenoid
saponin by weight of dry matter (Curl et al., 1986; Hassan et al., 2007) and thus contains
potentially useful bioactive compounds.
Saponins are glycoside compounds composed of a fat-soluble nucleus (aglycone)
that is either a triterpenoid (C-30) as in soybean, alfalfa, quillaja and guar, or alkaloid
steroid (C-27) as in yucca, tomato and oats. One or more side chains of water-soluble
sugars (glycone) are attached through ester linkages to the aglycone nucleus at different
carbon sites (Tschesche et al., 1969; Kaneda et al., 1987; Haralampidis et al., 2002).
Saponins have several biological effects, among them antibacterial (Mahato et al., 1982;
Sen et al., 1998a, b), hemolytic (Schmidt-Thome and Prediger, 1950; Joos and Ruyssen,
1967; Seeman et al., 1973; Fukuda et al., 1985; Khalil and El-Adawy, 1994;
Woldemichael and Wink, 2001) and anticancer (Ma et al., 2007) activities. Not all
saponins have the same biological activities. While some saponins are beneficial, others
are considered harmful to animal performance.
No research has evaluated the antibacterial and hemolytic activities of guar
86
saponin nor compared its biological activities with different saponin sources in a dose
dependent manner. Therefore, this study was conducted to isolate saponin-rich guar meal
extracts and to evaluate these extracts for hemolytic and antibacterial activities. A
minimal inhibitory concentration (MIC) assay compared antibacterial activity of guar
saponin extracts with three common commercial saponin sources (quillaja, yucca, and
soybean) in a dose dependent manner.
Materials and Methods
Saponins
Commercial preparations of yucca extract containing 30% steroid saponin (Ultra
Bio-Logic Inc. Rigadu, Quebec, Canada), quillaja extract containing 8.0-10%
triterpenoid saponin (Sigma®, Saint Louis, MO, USA) and soybean extract containing
95% triterpenoid saponin (Organic Technologies, Coshocton, OH, USA) were
purchased. Saponin-rich guar meal 100% MeOH extracts were prepared by refluxing
guar meal with ethanol:water, 1:1 (v:v) then the resultant extract was partitioned with n-
butanol:water, 1:1 (v:v). The n-butanol layer was freeze-drieded. Freeze-dried n-butanol
extract was dissolved into distilled water and injected onto a preparative reverse-phase
C-18 column and developed with a step gradient methanol:water (20:80, 60:40 and
100:0.00 (v:v), respectively) to elute three fractions (20, 60 and 100% methanol extracts)
as previously described in chapter III.

87
Hemolytic Activity Assay
Hemolytic activity assays were performed as previously described in chapter III
with some exceptions. A cell suspension of 1% chicken red blood cells was used and
each treatment group resulted from 12 individual values (3 replicates of two plates per
replicate with 2 columns per plate).
Antibacterial Activity Assay
Minimum inhibitory concentration (MIC) assays were used as a measure of
antibacterial activity of saponin sources as previously described in chapter III with some
exceptions. A single gram-positive bacterium (Staphylococcus aureus ATCC 49525)
and two gram-negative bacteria (Salmonella Typhimurium, NCIM 2719; Escherichia
coli, ATCC 933) were used. A stock solution of each saponin was prepared by
dissolving 25 mg of saponin/mL of TSB and each treatment group resulted from 18
individual values (3 replicates of three plates per replicate with 2 columns per plate).
Statistical Analysis
Each treatment group resulted from 12 individual values (n = 3, three replicates
of two plates per replicate with two wells per plate) for hemolytic activity and from 18
individual values (n = 3, three replicates of three plates per replicate with two wells per
plate) for the antibacterial activity assay. The mean of a saponin fraction at each
concentration was compared to the negative control group within a row to establish
88
significant differences among treatment groups in hemolytic and antibacterial activities.
The MIC for each treatment was recorded at the lowest concentration which inhibited
growth compared to the negative control group. Data obtained were subjected to one-
way ANOVA and were expressed as mean ± standard error of mean (SEM) using the
general linear model (GLM) program (SPSS 14.0, SPSS Inc., Chicago, IL). Treatment
means were separated (P ≤ 0.05) using Duncan’s multiple range test (Duncan, 1955).
Results and Discussion
The 100% methanol extract yielded approximately 1.55 ± 0.15% by weight of
the original guar meal extracted as described in chapter III. In this study the hemolytic
and antibacterial activities of the 100% methanol extract were compared with three other
common commercial saponin sources (quillaja, yucca, and soybean) in a dose dependent
manner. The 20 and 60% methanol extracts were not tested as they were neither
hemolytic nor antimicrobial as shown in chapter III. Oleszek (1988) noted that saponin-
rich plant extract purified by graded methanol concentrations showed that eluants up to
40% methanol removed carbohydrates and some phenolics, eluants containing 50-60%
methanol removed only the bisdesmoside saponins, while 70-80% methanol removed
monondesmoside saponins. This phenomina may contribute to the antibacterial and
hemolytic properties of the presumed saponin structures isolated by the 100% methanol
extract rather than 20 and 60% methanol extracts reported in chapter III.
This study agrees with Choi et al. (2001), Menin et al. (2001) and Plock et al.
(2001) who reported that not all saponins have hemolytic activity. The 100% methanol

89
saponin-rich guar meal extract and commericial quillaja saponin exhibited significantly
higher hemolytic activity than both commericial yucca and soybean saponins at the same
concentrations tested (Table 12). Commericial quillaja saponins were 100% hemolytic
with substantial hemolysis occurring even at the lowest dose (0.01 mg/mL). The 100%
methanol saponin-rich guar meal extract exhibited similar hemolytic activity until
concentrations were ≤ 0.031 mg/mL. Yucca and soybean saponins showed hemolysis
only at the highest concentration (1.0 mg/mL).
Hemolytic activity has been used by researchers to follow the isolation of
saponins. It is the simplest and the fastest bioassay employed to detect and quantify
some saponins in plant material (Authi et al., 1988; El Izzi et al., 1992; Khalil and EI-
Adawy, 1994; Onning and Asp, 1995; Oleszek, 1996, Onning et al., 1996; Choi et al.,
2001; Menin et al., 2001; Plock et al., 2001).
Our results were in disagreement with Birk et al. (1963) and Birk and Peri (1980)
who reported hemolytic activity of soybean saponins. Takechi and Tanaka (1995b) noted
hemolytic rates of the steroid saponins were greater than the hemolytic rates of the
triterpenoid saponins and Santos et al. (1997) reported that steroid saponins had higher
hemolytic activity than triterpenoid saponins. On the other hand, our results agree with
Jenkins and Atwal (1994) who reported hemolytic activity of quillaja, and Gestetner et
al. (1968) who reported that soybean saponins, which are a mixture of soyasapogenol
glycosides, were not hemolytic.

90
Table 12. Hemolytic activities of reverse-phase 100% methanol saponin-rich guar meal extract and solutions of saponins prepared from commercial extracts of quillaja, yucca and soybean
Saponin Extract
Positive Control1
Negative Control2
Saponin Extract Source Guar Meal Quillaja Yucca Soybean
mg/mL Optical Density (OD3) 1.000 0.42 ± 0.01c 1.05 ± 0.02 a 0.52 ± 0.02c 0.38 ± 0.04c 0.65 ± 0.07 b 0.65 ± 0.02 b 0.500 0.42 ± 0.01b 1.05 ± 0.02 a 0.48 ± 0.01b 0.39 ± 0.05b 1.00 ± 0.02a 1.00 ± 0.01a 0.250 0.42 ± 0.01b 1.05 ± 0.02 a 0.48 ± 0.01b 0.39 ± 0.06b 1.00 ± 0.02 a 1.00 ± 0.03a 0.125 0.42 ± 0.01b 1.05 ± 0.02 a 0.47 ± 0.01b 0.41 ± 0.06 b 1.02 ± 0.03 a 1.00 ± 0.03 a 0.062 0.42 ± 0.01b 1.05 ± 0.02 a 0.47 ± 0.01b 0.41 ± 0.06 b 1.03 ± 0.03 a 1.02 ± 0.03 a 0.031 0.42 ± 0.01b 1.05 ± 0.02 a 0.54 ± 0.01b 0.41 ± 0.07 b 1.03 ± 0.03 a 1.03 ± 0.03 a 0.016 0.42 ± 0.01b 1.05 ± 0.02 a 1.01 ± 0.01a 0.46 ± 0.07 b 1.04 ± 0.03 a 1.03 ± 0.04a 0.008 0.42 ± 0.01c 1.05 ± 0.02 a 1.01 ± 0.02a 0.68 ± 0.07 b 1.04 ± 0.04 a 1.04 ± 0.03 a
a-cMeans (± SEM, n = 3) within a row that do not share a common superscript are significantly different (P ≤ 0.05). 1Water replaced saponin solution to serve as a positive control since this treatment results in 100% hemolysis.
2Phosphate buffered saline replaced saponin solution to serve as a negative control since this treatment results in 0% hemolysis. 3Lower values are associated with increased cell lysis.

91
Some research reported that hemolytic activity of saponins is attributed to the
affinity of their aglycone moiety to sterols within membranes, particularly cholesterol
(Schmidt-Thome and Prediger, 1950; Bangham et al., 1962; Glauert et al., 1962; Joosand
Ruyssen 1967; Gee et al., 1998; Attele et al., 1999). Other research reported that
hemolytic activity is decreased by removing the glycone moiety of the saponin (Santos
et al., 1997), which is inconsistent with reports that the higher the hemolytic activity, the
higher the ratio of aglycone:sugar (Shany et al., 1970; Gestetner et al., 1971).
Saponins possessing two or more sugar side chains show less hemolytic activity
than saponins containing one sugar side chain (Fukuda et al., 1985; Mahato et al., 1988;
Woldemichael and Wink, 2001). The monodesmoside saponins with glucose attached at
C-3 show higher hemolytic activity than monodesmoside saponins with glucuronic acid
at the same position (Oleszek, 1996).
The guar saponins tested in this study were not pure and their molecular
structures are unknown at this time. Curl et al. (1986) reported that the primary saponin
in guar was a bisdesmoside triterpenoid with a molecular weight of 1452. The
stereochemistry of the saponin related to chain composition and length appears to be
very important in conferring activity on the saponin molecule (Gee et al., 1998). As
number of the monosaccharide units attached to the hydroxyl group at C-3 on the
aglycone (Mahato et al., 1988) increases up to four to six sugar units, hemolytic activity
increases (Anisimov et al., 1980; Kuznetzova et al., 1982). Also, hemolytic activity of
saponins increases with decreasing numbers of polar groups on the aglycone moiety
(Namba et al., 1973).

92
Gestetner et al. (1971) noted that alfalfa saponin, with the highest Rf value on
silica gel showed the strongest hemolytic activity. The active groups on the aglycone and
acylation of saponins also affect hemolytic activity. Neutral and acidic triterpenoids
along with the acyl saponins are less hemolytic than the ester saponins (Gee et al., 1998;
Attele et al., 1999; Oda et al., 2000). Laurence et al. (2005) noted that ethanol acylated
triterpenoid saponins isolated from stem bark of Harpullia austro-caledonica showed
100% hemolysis of a 10% suspension of sheep erythrocytes. Deacylated quillaja
saponins, which differ only in the absence of one glucose residue, showed decreased
hemolytic activity (Pillion et al., 1996).
Some studies report that hemolytic activity is the result of saponin’s effects
on cell membrane permeability by either forming pores in membranes (Authi et al.,
1988; El Izzi et al., 1992; Choi et al., 2001; Menin et al., 2001; Plock et al., 2001),
altering sodium–potassium, and calcium–magnesium ATPase activity (Choi et al., 2001),
or insertion of the hydrophobic saponin nucleus into the lipid bilayer (Brain et al., 1990;
Hu et al., 1996). Another study observed no direct relationship between the hemolysis
and cell membrane permeability (Abe et al., 1978a). This is an unusual observation
given hemolysis results in hemoglobin released from red blood cells.
The minimum inhibitory concentration (MIC) is the lowest concentration of
antibiotic or saponin that can inhibit growth of a microbe. A general summary of MIC
values for saponin extract solutions against Staphylococcus aureus, Escherichia coli,
Salmonella Typhimurium (Table 13) are compiled from more detailed data presented in
Tables 14, 15, and 16. The 100% methanol guar meal extract and commericial quillaja

93
saponins were more effective than commericial yucca and soybean saponins which
showed very weak or no antibacterial activity against any bacteria at the concentrations
tested (Tables 13, 14, 15 and 16).
Minimum inhibitory concentrations against Staphylococcus aureus were 3.13,
0.10 and 12.5 mg/mL for the 100% methanol guar meal extract, commericial quillaja
and yucca saponins, respectively (Tables 13 and 14). The MIC concentrations against
Salmonella Typhimurium were 0.78 and 0.10 mg/mL for the 100% methanol guar meal
extract and commercial quillaja saponins, respectively (Tables 13 and 15) and 1.56 and
0.10 mg/mL for the 100% methanol guar meal extract and commericial quillaja saponin
against Escherichia coli, respectively (Tables 13 and 16). Commericial soybean saponin
did not show antibacterial activity against Staphylococcus aureus, Salmonella
Typhimurium and Escherichia coli while commericial yucca saponin did not show
antibacterial activity against either Salmonella Typhimurium or Escherichia coli at any
concentration tested in this study.
In general, many saponins are considered natural antimicrobial compounds that
function as part of plant defense systems (Mahato et al., 1982; Hussain and Cheeke,
1995; Morrissey and Osbourn, 1999). Several studies reported antibacterial activity of
dietary saponins in ruminant animals at different levels against different types of
bacteria. For example, adding yucca extracts to a ruminant animal’s diet negatively
affected cellulolytic bacteria without any effect on amylolytic bacteria (Wang et al.,
2000a, b). Also, yucca extract showed little or no antibacterial activity against gram-
positive Staphylococcus aureus and Lactobacillus spp., and gram-negative Escherichia

94
coli (Tanaka et al., 1996). In another study (Cheeke, 1998; Cheeke and Otero, 2005)
adding saponin-rich yucca powder or extract to ruminant animals’ diets showed more
antimicrobial activity against gram-positive bacteria (Staphylococcus aureus) than gram-
negative bacteria (Escherichia coli).
Table 13. Minimal inhibitory concentration (MIC1) of antibacterial activity of reverse-phase 100% methanol guar meal extract and solutions of saponins prepared from commericial extracts of quillaja, yucca and soybean on Staphylococcus aureus, Salmonella Typhimurium and Escherichia coli cultures Bacterium Saponin Extract Source
Guar Meal Quillaja Yucca Soybean MIC (mg/mL)
Staphylococcus aureus 3.13 0.10 12.5 ND2
Salmonella Typhimurium 0.78 0.10 ND ND
Escherichia coli 1.56 0.10 ND ND
Means of MIC values of each saponin source against different bacteria show in the same column. 1MIC, the lowest concentration of antibiotic or saponin inhibits growth of a microbe. 2ND, MIC assay did not show antibacterial activity at the concentrations tested.
Some saponins exhibit antimicrobial activity against gram-positive bacteria and
no activity against gram-negative bacteria as in the yucca saponin tested in this study.
The same observation was reported by Tanaka et al. (1996) who noted that the saponin
fraction isolated from Soapnut pericarps (Sapindus mukurossi, which grows abundantly
in China and Japan) showed moderate antibacterial activity against gram-positive
bacteria, while no activity was observed against gram-negative bacteria. Conversely,

95
Table 14. Antimicrobial activities against Staphylococcus aureus of reverse-phase100% methanol guar meal extract and solutions of saponins prepared from commercial extracts of quillaja, yucca and soybean
Saponin Extract
Positive Control1
Negative Control2
Saponin Extract Source Meal Guar Quillaja Yucca Soybean
mg/mL Optical Density (OD3) 12.5 0.25 ± 0.08d 1.14 ± 0.01a 0.51 ± 0.02c 0.87 ± 0.05b 0.88 ± 0.01b 1.05 ± 0.04a 6.25 0.51 ± 0.17e 1.14 ± 0.01ab 0.68 ± 0.03d 0.97 ± 0.04c 1.08 ± 0.01bc 1.23 ± 0.02a 3.13 0.54 ± 0.18c 1.14 ± 0.01a 0.98 ± 0.03b 0.96 ± 0.05b 1.11 ± 0.02ab 1.19 ± 0.02a 1.56 0.56 ± 0.19c 1.14 ± 0.01a 1.12 ± .03a 0.97 ± 0.05 b 1.15 ± 0.02a 1.17 ± 0.02a 0.78 0.57 ± 0.19c 1.14 ± 0.01a 1.15 ± 0.02a 0.95 ± 0.05 b 1.15 ± 0.02a 1.15 ± 0.02a 0.39 0.56 ± 0.19c 1.14 ± 0.01a 1.18 ± 0.02a 0.93 ± 0.05 b 1.13 ± 0.02a 1.12 ± 0.02a 0.20 0.72 ± 0.11c 1.14 ± 0.01a 1.21 ± 0.02a 0.94 ± 0.05 b 1.14 ± 0.02a 1.13 ± 0.02a 0.10 0.86 ± 0.07b 1.14 ± 0.01a 1.13 ± 0.01a 0.91 ± 0.05 b 1.11 ± 0.01a 1.08 ± 0.02a
a-e Means (± SEM, n = 3) within a row that do not share a common superscript are significantly different (P ≤ 0.05). 1Positive control, contained only ampicillin at 0.01 to 1.0 mg/mL. 2Negative control, contained neither ampicillin nor saponin. 3Lower values of optical density were indicative of decreased bacterial growth and increased antibacterial activity.

96
Table 15. Antimicrobial activities against Salmonella Typhimurium of reverse-phase 100% methanol guar meal extract and solutions of saponins prepared from commercial extracts of quillaja, yucca and soybean
Saponin Extract
Positive Control1
Negative Control2
Saponin Extract Source Guar Meal Quillaja Yucca Soybean
mg/mL Optical Density (OD3) 12.5 0.05 ± 0.01d 1.22 ± 0.02 a 0.54 ± 0.02c 0.93 ± 0.01b 0.92 ± 0.01b 1.15 ± 0.02a 6.25 0.05 ± 0.01d 1.22 ± 0.02 a 0.68 ± 0.01c 1.07 ± 0.02b 1.10 ± 0.03b 1.28 ± 0.01a 3.13 0.05 ± 0.01d 1.22 ± 0.02 a 0.98 ± 0.03c 1.00 ± 0.01c 1.10 ± 0.01b 1.23 ± 0.01a 1.56 0.06 ± 0.01d 1.22 ± 0.02 a 1.05 ± 0.01c 0.99 ± 0.02c 1.15 ± 0.01b 1.21 ± 0.01ab 0.78 0.06 ± 0.01e 1.22 ± 0.02 a 1.09 ± 0.01c 1.00 ± 0.02d 1.15 ± 0.01b 1.18 ± 0.01ab 0.39 0.15 ± 0.05c 1.22 ± 0.02 a 1.10 ± 0.01a 0.98 ± 0.02b 1.15 ± 0.01a 1.16 ± 0.01a 0.20 0.44 ± 0.07 c 1.22 ± 0.02 a 1.10 ± 0.01ab 0.97 ± 0.01b 1.14 ± 0.01ab 1.14 ± 0.01ab 0.10 0.80 ± 0.03c 1.22 ± 0.02 a 1.14 ± 0.02a 0.94 ± 0.03b 1.21 ± 0.02a 1.18 ± 0.02a
a-eMeans (± SEM, n = 3) within a row that do not share a common superscript are significantly different (P ≤ 0.05). 1Positive control, growth contained only ampicillin at 0.01 to 1.0 mg/mL. 2Negative control, growth contained neither ampicillin nor saponin. 3Lower values of optical density were indicative of decreased bacterial growth and increased antibacterial activity.

97
Table 16. Antimicrobial activities against Escherichia coli of reverse-phase 100% methanol guar meal extract and solutions of saponins prepared from commercial extracts of quillaja, yucca and soybean
Saponin Extract
Positive Control1
Negative Control2
Saponin Extract Source Guar Meal Quillaja Yucca Soybean
mg/mL Optical Density (OD3) 12.5 0.05 ± 0.01d 1.11 ± 0.02 a 0.43 ± 0.03c 0.97 ± 0.04b 1.03 ± 0.02ab 1.06 ± 0.02 ab 6.25 0.05 ± 0.01d 1.11 ± 0.02 a 0.57 ± 0.02c 1.04± 0.02b 1.14 ± 0.01a 1.14 ± 0.01a 3.13 0.06 ± 0.01d 1.11 ± 0.02 a 0.82 ± 0.02c 0.94 ± 0.01b 1.14 ± 0.01a 1.13 ± 0.00a 1.56 0.16 ± 0.02 c 1.11 ± 0.02 a 0.93 ± 0.01b 0.92 ± 0.01 b 1.14 ± 0.01a 1.12 ± 0.01a 0.78 0.38 ± 0.04 c 1.11 ± 0.02 a 1.00 ± 0.01ab 0.89 ± 0.01b 1.12 ± 0.01a 1.12 ± 0.01a 0.39 0.64 ± 0.03 c 1.11 ± 0.02 a 1.03 ± 0.01a 0.91 ± 0.02b 1.09 ± 0.02a 1.11 ± 0.01a 0.20 0.81 ± 0.01c 1.11 ± 0.02 a 1.06 ± 0.01a 0.90 ± 0.02 b 1.08 ± 0.01a 1.11 ± 0.01a 0.10 0.80 ± 0.01b 1.11 ± 0.02 a 1.08 ± 0.03a 0.88 ± 0.01b 1.04 ± 0.01a 1.06 ± 0.01a
a-dMeans (± SEM, n = 3) within a row that do not share a common superscript are significantly different (P ≤ 0.05). 1Positive control, contained only ampicillin at 0.01 to 1.0 mg/mL. 2Negative control, contained neither ampicillin nor saponin. 3Lower values of optical density were indicative of decreased bacterial growth and increased antibacterial activity.

98
saponins isolated from orchid tree (Bauhinia variegata L.) bark exhibited greater
antibacterial activity for gram-negative bacteria than gram-positive bacteria at
concentrations ranging from 2.5 to 10 mg/mL (Morrissey and Osbourn, 1999). Kuete et
al. (2006) reported significant antibacterial effects of saponin-rich methanolic extracts
from the stem bark of African Tridesmostemon omphalocarpoides locally known as
“Babama”.
Sen et al. (1998b) reported that commercially produced quillaja (Quillaja
saponaria) and yucca (Yucca schidigera) saponins showed different antibacterial
activities against Escherichia coli, suggesting that saponins from various commercial
sources differ in their biological activities. This is most likely due to different extraction
procedures which produce saponins with different chemical structures. In this study
commercial quillaja and yucca saponins exhibited antibacterial activity against
Staphylococcus aureus and Escherichia coli at different concentrations. We did not
evaluate different commercial sources of the same saponin however.
Saponin extraction procedures undoubtedly affect the antibacterial activity of the
isolated saponins. Rakhimov et al. (1996) and Morrissey and Osbourn (1999) noted that
fat free content extracts from the Hong Kong orchid tree (Bauhinia variegata L.) bark
were more active than high fat extracts against gram-positive bacterial strains such as
Staphylococcus aureus. Against gram-negative bacterial strains such as Escherichia coli,
the fat free extracts exhibited either similar or less activity than the high fat extracts.
Results obtained in this study showed that the saponin-rich extract from guar
meal was more active against gram-positive Staphylococcus aureus than gram-negative

99
Escherichia coli and Salmonella Typhimurium. These findings agree with the results
obtained by several studies reporting that saponins showed antibacterial activity against
gram-positive bacteria more than gram-negative bacteria (Cioaca et al., 1978; Cheeke,
1998; Wallace et al., 1994; Cheeke and Otero, 2005; Avato et al., 2006). This may be
due to the degradation of saponins by glucosidase enzymes produced in higher
concentrations by gram-negative bacteria than by gram-positive bacteria.
The MIC values of the 100% methanol extract were exactly the same as reported
in chapter III against Staphylococcus aureus, Escherichia coli and Salmonella
Typhimurium. The specific mode of action for the antibacterial activity of saponins
against both gram-negative and gram-positive bacteria is not yet clear. One report
suggests that the aglycone moiety of the saponin is the antibacterial determinant (Avato
et al., 2006) and suggesting that the sugar moiety is not critical for antimicrobial efficacy
while another study (Mandal et al., 2005) reported that saponins hydrolyzed by bacterial
enzymes to its corresponding aglycone resulted in decreased antibacterial activity. As
with hemolytic activity, the antibacterial activity of saponins likely is affected by many
factors such as the aglycone, number, position and chemical structure of sugar side
chains (Potter et al., 1993; Rakhimov et al., 1996). Guar, soybean and quillaja saponins
are triterpenoid while yucca is a steroid saponin. The predominant guar saponin has two
sugar side chains, one attached at C-3 and another at C-29 (Curl et al., 1986), while the
predominant quillaja saponin (Higuchi et al., 1987; 1988) has two sugar side chains at C-
3 and C-28. Yucca (Kaneda, et al., 1987; Cheeke et al., 2006) and soybean saponins
(Kuduo et al., 1992) have two sugar side chains at C-3 and C-21. Yucca (Kaneda, et al.,

100
1987; Cheeke et at., 2006) and soyasaponin saponin (representing about 93% of the total
soybean saponin) (Kuduo et al., 1992) have only one sugar side chain at C-3. While
saponins may share similar sugar attachment sites, the sugar side chains themselves vary
in type, number, sequence, and chain length. Quillaja saponin contains quillaic acid as
the central aglycone attached with glucuronic acid, rhamnose, hexose and a fatty acyl
chain in varying ratios (Higuchi et al., 1987), while soyasaponin I has a carboxylic group
on the glucuronic acid aglycone (Oleszek, 1996).
Summary and Conclusions
The 100% methanol guar meal extract yielded approximately 1.55 ± 0.15% crude
saponin by weight of the original guar meal dry matter. Saponin-rich extracts from
different plant sources have different antibacterial and hemolytic activities. The 100%
methanol guar meal extract and commericial quillaja saponins were significantly higher
in both hemolytic and antibacterial activities against all bacteria tested than commercial
yucca and soybean saponins at the same saponin concentration. Soybean saponin had no
antibacterial activity against any of the bacteria at the saponin concentrations tested
while yucca saponin had no antibacterial activity against the gram-negative bacteria at
the concentrations tested. Hemolytic activity can be a predictor of antibacterial activity
with different levels of some saponin-rich plant extracts such as guar and quillaja
saponins while not for other saponins such as soybean and yucca saponins.

101
CHAPTER V
GUAR MEAL AMELIORATES EFFECTS OF EIMERIA TENELLA
CHALLENGE IN BROILER CHICKS
Introduction
Avian coccidiosis (genus Eimeria) is a disease with an estimated $800 million
worldwide economic impact for the poultry industry (Williams, 1998). Seven species of
Eimeria infect chickens (Eimeria acervulina, Eimeria brunetti, Eimeria maxima,
Eimeria mitis, Eimeria necatrix, Eimeria praecox and Eimeria tenella). Although all
species are found in the USA poultry operations, Eimeria acervulina, Eimeria maxima,
and Eimeria tenella are the most prevalent species. The incidence of detectable
coccidiosis is as high as 50 to 70% on some poultry farms. This protozoan parasite exists
in the form of a highly resistant oocyst in litter (Shirley, 1986).
Antiprotozoal chemical feed additives are the most widely used means of
controlling genus Eimeria in chickens (Pogonka et al., 2003). While antiprotozoal
“coccidiostats” effectively control avian coccidiosis, continuous use and misuse of
anticoccidial drugs have led to the emergence of drug resistant strains (Long, 1982).
Drug resistance in coccidial populations constantly threatens the continued usefulness of
prophylactic chemotherapy. New coccidiostats must be continually developed to
overcome increasing resistance to chemical drugs by the parasites (Chapman, 1993;

102
1998; Yadav and Gupta, 2001). Drug resistance and the high costs of developing novel
drugs make discovery of alternative control methods beneficial (Chapman, 1997).
New products and husbandry strategies are needed to replace antibiotics or
anticoccidial agents in poultry feeds. Antibiotic- or anticoccidia-resistant organisms have
alarmed public health officials to possible loss of effective human disease treatments. In
response, antibiotics or some anticoccidial agents used as growth promoters in poultry
and animal feeds are banned or discouraged in many world markets (Nawaz et al., 2000;
Bertolatti et al., 2003; Wallace, 2004). As this trend accelerates the search for plant-
based antibacterial and anticoccidial compounds increases (Wink, 1999; Gordon and
David, 2001; Murry et al., 2004; Van Immerseel et al., 2006). Traditional medicinal
herbs sometimes are used to treat animal diseases (Du and Hu, 2004) and evidence
toward protection of birds by using anticoccidial plant extracts (Arab et al., 2006) can be
found.
Guar (Gyamopsis tetragonoloba) is a drought tolerant legume most prominently
produced in India and Pakistan. The plant is grown for the guar bean’s gum that has
many industrial and food processing applications. Isolation of the galactomannan gum
yields a high protein by-product containing guar hull, germ and residual gum. Guar meal
also contains chemical compounds called saponins. Saponins are being currently
investigated for antibacterial (Avato et al., 2006; Hassan et al., 2007), antiprotozoal
(Mshvildadze et al., 2000), and antifungal (Yang et al., 2006) activities. Since both
saponins and protein are concentrated in the hull and germ fractions of the guar bean,
guar meal (Bakshi, 1966; Ambegaokar et al., 1969) may be useful as a practical

103
ingredient for poultry feed (Lee et al., 2003; a, b; 2005) which exhibit antiprotozoal
activity against Eimeria tenella.
This study investigated the anticoccidial effects of guar meal in diets fed to
chicks challenged with Eimeria tenella. Body weight, feed conversion ratio, mortality
rate, duodenal pH, oocyst shedding per gram of feces, bloody diarrhea, and cecal lesion
scores were measured.
Materials and Methods
A 2 x 2 factorial experimental design including 6 replicates of 5 chicks
investigated the impact of 0 or 5% guar meal in corn-soy starter diets on chicks either
unchallenged or challenged with Eimeria tenella. One hundred twenty, 1-d-old broiler
chicks (Ross x Cobb) of mixed sex were obtained from a commercial hatchery and
randomly distributed into wire battery cages. Diet formulas contained no anticoccidial
feed additives (Table 17). Chicks were offered feed and water ad libitum, and were
exposed to continuous light. Pooled feces were examined and collected from each
replication. Oocyst shed, bloody feces score and cecal lesion score were determined.
Isolation, Sporulation and Counting of Oocysts
Sporulated oocysts of Eimeria tenella were obtained from Dr. David Caldwell’s
Laboratory, Departments of Poultry Science and Veterinary Pathobiology at College
Station, Texas, USA. Infected chicks were challenged by 5,000 sporulated oocysts of
Eimeria tenella in 0.5 mL of distilled water using crop gavage at 10 d of age.

104
Table 17. Composition1 of broiler chicken starter diets containing either 0 or 5% guar meal
Ingredients Guar Meal (%)
0 5 (%) Corn 55.63 53.52 Guar meal2 0.00 5.00 Dehulled soybean meal 36.61 33.08 DL-Methionine 0.21 0.22 L-Lysine HCl 1.23 0.01 Fat (animal-vegetable blend) 3.81 4.43 Limestone 1.43 1.43 Mono-dicalcium PO4 1.55 1.55 Salt 0.46 0.46 Trace minerals3 0.05 0.05 Vitamins4 0.25 0.25
1 Calculated analysis of the diets was as follows: CP, 22.61%; ME, 3,100 kcal/kg; Ca, 0.90%; non-phytin P, 0.45%; methionine, 0.55%; lysine, 1.20%; threonine, 0.84%; and tryptophan, 0.27%. 2 The nutrient matrix used was CP, 38.3%; ME, 2,033 kcal/kg Ca, 0.16% non-phytin P, 0.16% methionine, 0.45% lysine, 1.64% arginine, 4.90% threonine, 1.04% and tryptophan, 0.43%. Amino acid profile was by courtesy of Degussa Huls Corp., Allendale, NJ, 07401. 3 Trace minerals premix added at this rate yields: 150 mg Mn, 16.80 mg Fe, 1.70 mg Cu, 125.50 mg Zn, 0.25 mg Se, 1.05 mg I, 0.84 mg Mo per kg diet. 4 Vitamin premix added at this rate yields: 11,023 IU vitamin A, 46 IU vitamin E, 3,850 IU vitamin D3, 1.47 mg vitamin k, 2.94 mg thiamine, 5.85 mg riboflavin, 20.21 mg pantothenic acid, 0.55 mg biotin, 1.75 mg folic acid, 477.67 mg choline, 16.50 µg vitamin B12, 45.93 mg niacin, and 7.17 mg pyridoxine per kg diet.

105
Efficacy of guar meal against Eimeria tenella infection was evaluated by body
weight, feed conversion ratio, mortality rate, duodenal pH, bloody diarrhea, oocysts shed
per gram of feces, and cecal lesion score. Body weight and feed consumption were
recorded weekly to determine feed conversion ratio in each treatment group from 0-3 wk
of age. Mortality rate was calculated from the number of surviving chicks divided by the
initial number of chicks. Degree of bloody diarrhea of each replication was assigned to
one of five scores. Zero was normal status, and 1, 2, 3 and 4 corresponded to 1-25, 26-
50, 51-75, or more than 75% of total feces containing blood, respectively (Youn and
Noh, 2001).
Pooled fecal samples were collected daily from 6-10 d post challenge from each
cage of the treatment groups. Progression of Eimeria tenella infections were monitored
by the number of fecal oocysts shed per gram of feces using the McMaster counting
technique (Dunn, 1969) as modified by Arslan et al. (2002). Chicks were euthanatized
by cervical dislocation at 11 d post challenge (3 wk of age) to measure coccidial cecal
lesion scores. Lesion scores were assigned to one of five ranks based on the epithelial
color, fluid accumulation and the overall general appearance of the intestine (serosal
thickness, mucosal erosion, dilation and similar factors) according to the method of
Johnson and Reid (1970).

106
Statistical Analysis
Data obtained were subjected to one-way ANOVA and were expressed as mean
± standard error of mean (SEM) (SPSS 14.0, SPSS Inc., Chicago, IL). Treatment means
were separated (P ≤ 0.05) using Duncan’s multiple range test (Duncan, 1955).
Results and Discussion
Chicks challenged with Eimeria tenella shed oocysts in their feces (Table 18)
while unchallenged chicks did not shed Eimeria tenella oocysts (data not shown). Feces
containing coccidia oocysts is a route of reinnoculation and transmission between birds
reared on the floor. In this study, challenged chicks were reared in batteries with wire
flooring which limited rechallenge with Eimeria tenella sporulated oocysts.
Challenged chicks that were feed 5% guar meal significantly reduced the number
of oocysts per gram shed in feces at 7 d and shed oocysts averaged over the entire 6-10 d
post challenge collection period (Table 18). Oocyst output from challenged chicks
decreased from 58.2 x 10⁴ to 2.7 x 10⁴ versus 5.52 x 10⁴ to 0.5 x 10⁴ from 7 to 10 d post
challenge in those chicks fed 0 and 5% guar meal, respectively. Peak excretion of
oocysts in challenged chicks fed 5% guar meal was delayed 1 d relative to challenged
chicks fed 0% guar meal. Results of this study agree with Du and Hu (2004) who
reported that peak extraction of fecal oocysts occurred at 7 and 8 d post infection. This
result may be due to the antiprotozoal activity of guar meal saponin as reported in
ruminant animals (Lu and Jorgensen, 1987; Wallace et al., 1994; Newbold et al., 1997;
Cheeke et al., 2006). Presumably saponins exert antiprotozoal activity by binding with
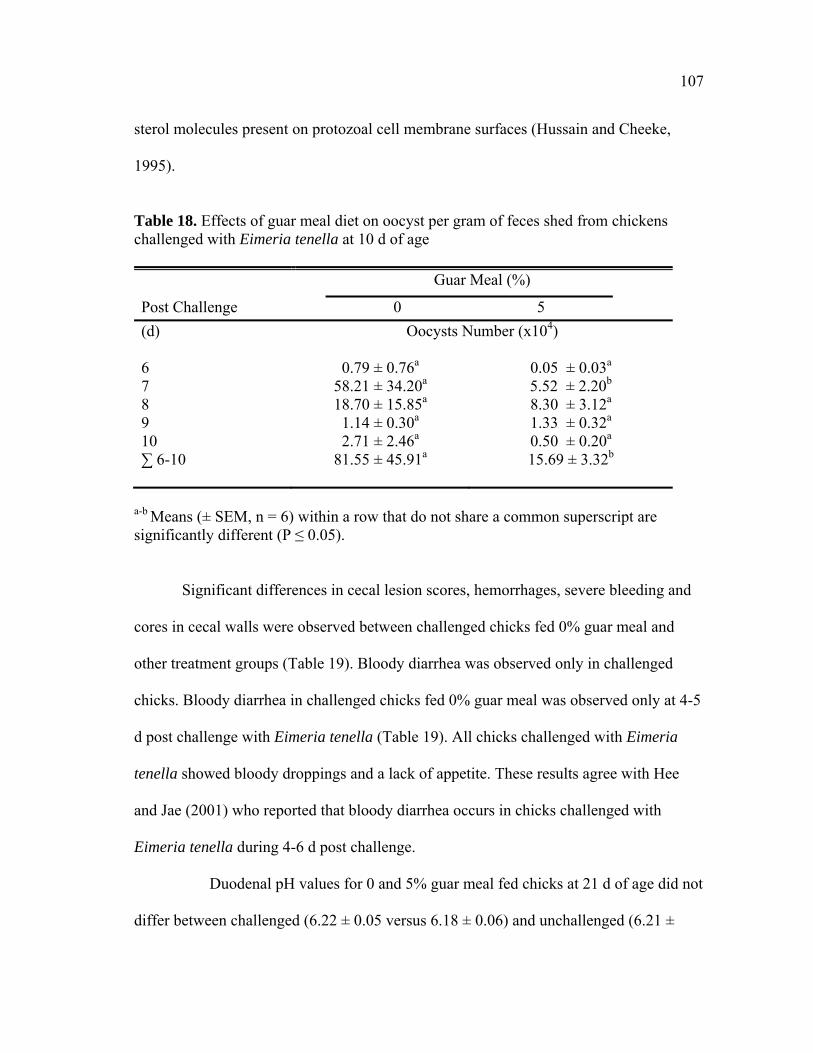
107
sterol molecules present on protozoal cell membrane surfaces (Hussain and Cheeke,
1995).
Table 18. Effects of guar meal diet on oocyst per gram of feces shed from chickens challenged with Eimeria tenella at 10 d of age Guar Meal (%)
Post Challenge 0 5 (d) Oocysts Number (x104) 6 0.79 ± 0.76a 0.05 ± 0.03a 7 58.21 ± 34.20a 5.52 ± 2.20b 8 18.70 ± 15.85a 8.30 ± 3.12a 9 1.14 ± 0.30a 1.33 ± 0.32a 10 2.71 ± 2.46a 0.50 ± 0.20a ∑ 6-10 81.55 ± 45.91a 15.69 ± 3.32b
a-b Means (± SEM, n = 6) within a row that do not share a common superscript are significantly different (P ≤ 0.05).
Significant differences in cecal lesion scores, hemorrhages, severe bleeding and
cores in cecal walls were observed between challenged chicks fed 0% guar meal and
other treatment groups (Table 19). Bloody diarrhea was observed only in challenged
chicks. Bloody diarrhea in challenged chicks fed 0% guar meal was observed only at 4-5
d post challenge with Eimeria tenella (Table 19). All chicks challenged with Eimeria
tenella showed bloody droppings and a lack of appetite. These results agree with Hee
and Jae (2001) who reported that bloody diarrhea occurs in chicks challenged with
Eimeria tenella during 4-6 d post challenge.
Duodenal pH values for 0 and 5% guar meal fed chicks at 21 d of age did not
differ between challenged (6.22 ± 0.05 versus 6.18 ± 0.06) and unchallenged (6.21 ±

108
0.84 versus 6.27 ± 0.09) treatments, respectively. No significant interaction was
observed between the effects of Eimeria tenella challenge and body weight, body weight
gain or feed conversion ratio. However, diet did significantly affect body weight, body
weight gains and feed conversion ratio. No significant differences were observed in
initial body weight among treatment groups (Table 20). Body weight and body weight
gains of diet treatments were not significantly different at the start of the study and at 1
wk of age. At 2 wk of age, body weight and body weight gains of both challenged and
unchallenged chicks fed 0% guar meal were significantly higher than those fed 5% guar
meal. By 3 wk of age, body weight of challenged and unchallenged chicks fed 5% guar
meal was lower than unchallenged chicks fed 0% guar meal. However, no significant
Table 19. Bloody feces score1 recorded from 4 to 7 d post challenge in chicks unchallenged and challenged with Eimeria tenella and fed either a 0 or 5% guar meal diet Post challenge
Unchallenged Challenged
Guar Meal (%) Guar Meal (%) 0 5 0 5
(d) 4 0 0 2 0 5 0 0 3 0 6 0 0 0 0 7 0 0 0 0
1 Results are expressed as pooled bloody feces where zero was normal status, and 1, 2, 3 and 4 corresponded to 1-25, 26-50, 51-75, or more than 75% of total feces containing blood, respectively (Youn and Noh, 2001). There were 30 chicks in each treatment group with 6 replicates of 5 chicks each.

109
differences in body weight between challenged chicks fed 0% guar meal and other
treatment groups at 3 wk of age were observed. By 3 wk of age, body weight gains were
not significantly different. The total of body weight gain over the entire experiment 1-3
wk of age of challenged and unchallenged chicks that were fed 5% guar meal was lower
than unchallenged chicks fed 0% guar meal. However, no significant differences in body
weight gain between challenged chicks fed 0% guar meal and other treatment groups at
3 wk of age (Table 20).
Unchallenged chicks that were fed either 0 or 5% guar meal showed
significantly lower feed conversion ratio than challenged chicks that were fed 5% guar
meal, but there were no significant differences between challenged chicks that were fed
0% guar meal and other treatment groups at 1 wk of age. Unchallenged chicks fed 0%
guar meal showed significantly lower feed conversion ratio than unchallenged chicks fed
5% guar meal, but there were no significant differences in feed conversion ratio between
challenged chicks fed either 0 or 5% guar meal and other treatment groups at two wk of
age. No significant differences in feed conversion ratios among all treatment groups
were observed at 3 wk of age. Cumulative feed conversion ratio over the entire
experiment was significantly lower in unchallenged chicks fed 0% guar meal than
unchallenged chicks that were fed 5% guar meal (Table 20). Mortality rate did not differ
significantly among treatment groups. The amount of Eimeria tenella oocysts inoculated
into chicks may have induced only a moderate challenge of Eimeria tenella that was of
insufficient severity to cause mortality (Table 20). In the field, mortality caused by

110
Table 20. Weekly body weights, body weight gains, feed conversion ratio and mortality rate of chicks unchallenged or challenged with Eimeria tenella and fed either a 0 or 5% guar meal diet until 3 wk of age
a-b Means (± SEM, n = 6) within a row that do not share a common superscript are significantly different (P ≤ 0.05). No significant difference of mortality was observed among treatment groups (P ≤ 0.05).
Age
Unchallenged Challenged Guar Meal (%) Guar Meal (%) 0 5 0 5
(wk) Body weight (g) 0 44.2 ± 0.8a 43.8 ± 0.5a 43.3 ± 0.7a 42.8 ± 0.7a 1 137.8 ± 6.6a 134.1 ± 2.9a 138.4 ± 4.0a 124.9 ± 5.0a 2 424.3 ± 8.2a 371.1 ± 14.0b 426.7 ± 9.4a 383.4 ± 5.8b 3 820.9 ± 14.4a 709.2 ± 28.7b 774.7 ± 19.4ab 746.3 ± 20.8b Body weight gains (g) 1 93.63 ± 7.14a 90.25 ± 3.28a 95.07 ± 4.20a 82.08 ± 4.63a 2 286.46 ± 6.20a 237.07 ± 11.76b 288.33 ± 7.68a 258.59 ± 8.39b 3 396.63 ± 9.40a 338.09 ± 35.22a 347.93 ± 15.15a 362.90 ± 18.82a ∑ 0-3 776.72 ± 4.90a 665.42 ± 28.40b 731.33 ± 9.11ab 703.58 ± 21.06b Feed conversion ratio (g feed/g body gain) 1 1.07 ± 0.07 b 1.02 ± 0.07 b 1.18 ± 0.03ab 1.28 ± 0.05a 2 1.24 ± 0.02b 1.34 ± 0.04a 1.27 ± 0.01ab 1.31 ± 0.03ab 3 1.52 ± 0.02a 1.83 ± 0.26a 1.69 ± 0.04a 1.62 ± 0.02a ∑ 0-3 1.36 ± 0.01b 1.50 ± 0.08a 1.46 ± 0.02ab 1.46 ± 0.01ab Mortality rate (%) 1 0/30 1/30 1/30 1/30 2 0/30 0/29 0/29 1/29 3 0/30 0/29 0/29 0/28 ∑ 0-3 0/30 1/30 1/30 2/30

111
Eimeria tenella can be as high as 50 % in poultry causing severe economic burdens
(Williams, 1999).
These results agree with those of Kamran et al. (2002) who reported that adding
5% guar meal in chicken diets reduced body weight, feed efficiency and increased
intestinal content viscosity. It appears the maximum percentage of guar meal appropriate
for poultry diets is dependent on the bird’s age. Some studies reported that there were no
negative impacts on productive performance after adding guar meal without enzyme to
diets at concentrations up to 2.5% in broiler chicks (Lee et al., 2003a, b) or 5% in laying
hen diets (Gutierrez et al., 2007). Lee et al. (2005) reported that guar meal can be used
at up to 5% with β-mannanase enzyme in broilers. High viscosity generally is coincident
with delayed gastric emptying, increased small intestinal transit time, and inhibition of
nutrient absorption (Blackburn and Johnson, 1981). Increased intestinal viscosity was
proposed to result from residual guar gum present in guar meal. Guar meal used in
poultry, pig and cattle rations is limited because of its adverse effects on feed intake,
growth rate and feed efficiency (Brocher and Ackerson 1950; Saxena and Pradhan 1974;
Thakur and Pradhan, 1975a, b). Growth is impacted by reduced nitrogen retention,
slowed absorption of amino acids, reduced energy utilization and fat absorption
(Anderson and Warnick, 1964; Katoch et al., 1971). Verma and McNab (1984a, b)
reported that protein in guar meal was rich in arginine, but methionine and lysine
concentrations were comparatively lower than concentrations typically found in soybean
meal, and inadequate for optimum rat growth (Van Etten et al., 1961). Ambegaokar et al.

112
(1969) suggested that tryptophan, methionine and threonine were the first three deficient
amino acids of guar meal when compared to whole egg protein.
Negative effects of adding 5% guar meal on body weight and feed conversion
ratio in this study may be attributed to the presence of anti-nutrient compounds in guar
meal such as trypsin inhibitor, excessive guar gum, saponin or some other unknown
toxic substances. Conner (2002) proved that trypsin inhibitor activity in the raw guar
meal was lower than trypsin inhibitor levels found in heat-treated soybean meal.
Therefore, trypsin inhibitor is not likely the primary anti-nutritive factor in guar. A series
of feeding experiments conducted by Vohra and Kratzer (1964) demonstrated that as
little as 1% guar gum in broiler chicken diets causes a depression of growth. When the
diet contained 2% guar gum, the relative growth of broiler chickens was 61-67% of
controls. Lee et al. (2003a) also supported the idea that residual guar gum was at least
partially responsible for the effects seen when guar meal was fed.
The growth depressing properties of guar gum may be overcome by treating the
feed with enzymes capable of hydrolyzing it, namely pectinase, cellulose, a preparation
from sprouted guar beans (Vohra and Kratzer, 1964) or β-mannanase (Vohra and
Kratzer, 1964; 1965; Chesson, 1987; Lee et al., 2003a, b). It is thought that feed
containing exogenous enzymes with guar meal reduced intestinal viscosity and
alleviated the deleterious effects associated with residual guar gum.
Guar meal also is rich in saponins (Curl et al., 1986; Hassan et al., 2007) which
have antinutritional properties (Price et al., 1987; Mahato et al., 1988; Shimoyamada et
al., 1990). Saponins can be harmful for monogastric animals such as swine, fish and

113
poultry (Newman et al., 1958; Sim et al., 1984; Terapunduwat and Tasaki, 1986; Potter
et al., 1993; Jenkins and Atwal, 1994; Olli et al., 1994; Francis et al., 2001a, b). They
tend to have a bitter taste, irritate the membranes of the mouth and the digestive tract
(Oleszek and Jurzysta, 1992; Oleszek et al., 1994), reduce intestinal motility (Klita et al.,
1996), change ingesta transit time (Ueda et al., 1996), inhibit gastric emptying (Matsuda
et al., 1999a, b; Yoshikawa et al., 2001) and decrease growth rate (Ueda and Ohshima,
1987; Cheeke, 1983; 1996; Makkar and Becker, 1996). They also lower digestion rate
(Freeland et al., 1985; Lu and Jorgensen, 1987; Lu et al., 1987; Killeen et al., 1998),
reduce protein digestibility (Potter et al., 1993; Shimoyamada et al., 1998), depress
mucosal enzyme activity in the lower intestine (Olli et al., 1994), perhaps as a stressor
stimulate ACTH and corticosterone levels (Kim et al., 1999), inhibit the absorption of
vitamins A and E in chicks and iron in the rat (Johnson et al., 1986; Southon et al.,
1988a; Jenkins and Atwal, 1994). Interestingly they have been reported to increase
mineral excretion of sodium, iron, magnesium and zinc (West, 1979; Freeland et al.,
1985; Southon et al., 1988b), as well as change the circadian rhythm of feeding behavior
(Petit et al., 1995).
On the other hand, other studies reported no adverse effect on growth after
feeding fenugreek seeds containing steroid saponins (Ishaaya et al., 1969) and soybean
triterpenoid saponins (Petit et al., 1995) at concentrations as much as five times the
concentration in a normal soybean-supplemented diet of chicks, rats and mice. Yucca
and quillaja saponins are classified as generally recognized as safe (GRAS) and are
approved for food use in the USA (Fenwick et al., 1992). It was not clear which specific

114
compounds in guar meal contributes to the anticoccidial or growth inhibitory effects.
The most likely candidates are residual guar gum and triterpenoid saponins however.
Summary and Conclusions
Chicks were successfully challenged with Eimeria tenella and a mild infection
was created as determined by fecal shedding of oocysts and bloody feces. The infection
was mild and resulted in no increased mortality perhaps because of the low initial dose
of Eimeria tenella and the fact that the chicks were grown on wire floors that avoids
reinfection. Addition of 5% guar meal in the diet decreased the severity and perhaps
delayed the Eimeria tenella infection since oocyst’s shed in the feces were greatly
reduced and the peak day of shedding was delayed. Results indicated that adding 5%
guar meal to the diet of chicks challenged with Eimeria tenella reduced infection as
measured by oocyst output in the feces and bloody diarrhea. Further research is needed
to differentiate whether the anticoccicdiosis effect of guar meal was due to residual guar
gum (glacactomannans), saponin, or some unknown component of guar meal.

115
CHAPTER VI
ANTIBACTERIAL ACTIVITIES OF GUAR MEAL, GUAR GUM AND
SAPONIN-RICH GUAR MEAL EXTRACTS AGAINST CLOSTRIDIUM
PERFRINGENS IN CHICKENS
Introduction
Clostridium perfringens is a gram-positive, spore-forming anaerobic bacterium
that is a normal inhabitant of the gut microflora and may be found in the crop, gizzard,
small intestine and ceca of many animals including chickens (Johansson and Sarles,
1948; Shapiro and Sarles, 1949; Smith, 1965; Willis, 1977; Komnenov et al., 1981;
Gazdzinski and Julian, 1992; Branton et al., 1997). Processed poultry meat also has
relatively high numbers of Clostridium perfringens (Craven et al., 2001b) with
transmission to humans through the consumption of poultry products (Craven et al.,
2001a, b). Clostridium perfringens also occurs widely in the environment, including
water, soil, and workers clothing and boots (Willis, 1977). However, the presence of
Clostridium perfringens per se, does not lead directly to disease. Although 75-95% of
birds are colonized by Clostridium perfringens, only a small proportion of these birds
ever show symptoms of the disease (Miwa et al., 1997; Craven et al., 2001a, b).
Clostridium perfringens produces many extracellular enzymes and toxins including
alpha (α), theta (τ) and kappa (κ) toxins (Rood, 1998) in addition to epsilon (ε)
endotoxin which is activated upon exposure to trypsin and chymotrypsin, and is
associated with B and D strains of clostridia (Petit et al., 2001). All strain types (A-E) of

116
the bacterium contain the α-toxin gene (McDonel, 1986; Songer, 1996; Petit et al.,
2001).
Clostridium perfringens, the causative organism of necrotic enteritis is often
found in relatively small numbers, usually less than 104 colony forming units (cfu) in the
gastrointestinal tract of most bird species (Asaoka et al., 2004). Necrotic enteritis is an
enteric disease that affects a variety of bird species and increases mortality rate in broiler
chickens (Cowen et al., 1987), laying hens (Broussard et al., 1986), turkeys (Gazdzinski
and Julian, 1992; Droual et al., 1995) and quail (Berkhoff, 1985). Necrotic enteritis in
poultry is associated with α and β-toxin producing Clostridium perfringens strains type
A or C (Van Immerseel et al., 2004). The clostridial β-toxin induces hemorrhagic
necrosis of the intestinal mucosa (Baba et al., 1992). Necrotic enteritis is an acute,
infectious and non contagious disease (Schwartz, 1988) affecting chickens 2-24 wk of
age (Long, 1973; Ficken, 1991; Ross, 1999). Upon examination of the gastrointestinal
tract and associated organs of affected birds, gross lesions are found, usually in the
jejunum and ileum. The proximate small intestine and ceca show less evidence of
lesions, but may be distended by gas and bloody fluids (Frame and Bickford, 1986). The
intestinal mucosa may be covered with a layer of fibrino-necrotic material (Porter,
1998).
Necrotic enteritis disease also can be divided into clinical and subclinical
necrotic enteritis categories. Clinical signs of necrotic enteritis include depression,
decreased appetite, decreased digestion, diarrhea, and severe necrosis of the intestinal
tract leading ultimately to mortality (Kaldhusdal and Hofshagen, 1992; Ficken and

117
Wages, 1997; Porter 1998; Kaldhusdal and Lovland, 2000; Lovland and Kaldhusdal,
2001). The subclinical form of the disease causes a decrease in overall performance of
birds and has been associated with hepatic lesions (Lovland and Kaldhusdal, 1999). The
incidence of necrotic enteritis varies from 1-40% of commercial broiler flocks in North
America and the European Union (Kaldhusdal and Skjerve, 1996; Kaldhusdal and
Lovland, 2000; Annett et al., 2002). Necrotic enteritis is a disease in poultry that can
have high economic and animal welfare costs which have become increasingly prevalent
in the European Union due to factors such as the removal of antibiotic growth promoters
and the animal by-products from diet formulations. In 2000, the subclinical form of
necrotic enteritis cost producers as much as five cents per bird due to decreased
performance in the USA (Van der Sluis, 2000). Cost of this disease, including clinical
and subclinical infections, was close to $2 billion dollars worldwide.
Reducing the effects of Clostridium perfringens in experimental settings has been
evaluated with a variety of management tools, including use of antibiotics, vaccines, and
competitive exclusion cultures (Hofacre et al., 1998; Williams et al., 2003; Lovland et
al., 2004). Currently, antibiotic growth promoters predominantly are used in the
commercial poultry settings and improve the health and performance of poultry
(Bedford, 2000). Clostridium perfringens is a bacterium specifically targeted by
antibiotic growth promoters. Many of these products, such as avoparcin, adriamycin,
bacitracin, virginiamycin, and tylosin, have been removed from production practices in
the European Union (Van Immerseel et al., 2004).

118
There are many plant containing antibacterial compounds, among them guar
saponins (Livingston et al., 1977; Avato et al., 2006; Hassan et al., 2007). Guar meal is a
by-product produced by isolating the guar gum from guar bean (Gyamopsis
tetragonoloba). Guar meal contains 33-47.5% crude protein (Bakshi, 1966; Ambegaokar
et al., 1969) and can be used at low concentrations in poultry feeds (Lee et al., 2003a, b;
Lee et al., 2005). The meal contains 13-18% guar gum (Bakshi et al., 1964; Lee et al.,
2004) and 5-13% crude saponin by weight of the dry matter (Curl et al., 1986; Hassan et
al., 2007). This study was conducted to investigate whether addition of either 2.5% guar
meal, or 1% guar gum or 0.125% saponin-rich guar meal extract in a 55% wheat
corn/soy based starter broiler diet would ameliorate lesions of necrotic enteritis in broiler
chicks challenged with Clostridium perfringens.
Materials and Methods
Isolation of Saponin-Rich Guar Extract
Guar meal (Rhodia Inc., Vernon, TX) was ground in a commericial coffee mill to
form a fine powder and subsequently extracted by refluxing 25 g with 250 mL of
ethanol:water, 1:1 (v:v) for 3 h in a simple reflux apparatus. Refluxed extracts were
cooled and filtered through 150-µm (Watman No. 2) then 125-µm pore size (Watman
No. 114) filter papers. Ethanol was removed from the filtrate by evaporating under
reduced pressure in a roto-evaporator (Buchi, Rinco Instrument Co., Inc., Greenville, IL,
Switzerland, model 310391) until two-thirds of the initial volume was removed. The

119
remaining aqueous extract was partitioned with n-butanol, 1:1 (v: v) overnight at room
temperature using a separatory funnel. The upper n-butanol extract was collected in a
glass flask and the lower aqueous extract was further partitioned with n-butanol two
more times to increase the yield of crude saponin. The butanol extracts were pooled and
evaporated to dryness using the roto-evaporator procedure described above. A minimum
volume of water was added to the dry n-butanol extract and the resulting crude saponin
was freeze-dried, weighed and stored at room temperature until used in further studies.
Experimental Chicks
Three hundred one-d-old unsexed Ross x Cobb broiler chicks were purchased
from a local commercial hatchery and placed on clean pine shaving litter. Birds were
reared in 2.4 x 1.2 m pens, allowing 0.12 m2 of pen space per bird. Water and feed were
provided ad libitum with 22 light:2 dark h schedules throughout the study. All treatment
groups were fed isocalloric and nitrogenous diets containing 3050 metabolizable energy
and 22.6% CP (Table 21).
Experimental Design
Chicks were randomly distributed among five treatments with three replicates of
20 chicks per replicate. Birds were assigned to one of the following treatments: 1)
negative control (NC), chicks fed broiler starter diet containing 55% wheat but
unchallenged with Clostridium perfringens type A, 2) positive control, chicks fed broiler

120
Table 21. Composition of a control1 (C) starter broiler chicken diet and diets containing either 2.5% guar meal2
(GM), 1.0% guar gum (GG), or 0.125% saponin-rich guar meal extract (GS)
Ingredients (%) Dietary Treatments
C GM GG GS Corn 5.35 5.00 5.00 5.09 Wheat, Hard 55.00 55.00 55.00 55.00 Saponin-rich guar meal extract 0.00 0.00 0.00 1.25 Guar gum 0.00 0.00 1.00 0.00 Guar meal2 0.00 2.50 0.00 0.00 Soybean meal (48.5%, CP) 28.80 26.14 27.05 28.85 DL-Methionine 0.25 0.27 0.28 0.25 L-Lysine HCl 0.29 0.68 1.20 0.29 Fat (animal-vegetable blend) 6.26 6.34 6.39 6.34 Limestone 1.63 1.63 1.63 1.63 Mono-dicalcium PO4 1.72 1.73 1.74 1.72 Salt 0.41 0.41 0.41 0.41 Trace minerals3 0.05 0.05 0.05 0.05 Vitamins4 0.25 0.25 0.25 0.25 1Calculated analysis of the diets was as follows: CP, 22.6%; ME, 3,050 kcal/kg; Ca, 1.00%; non-phytin P, 0.50%; methionine, 0.57%; lysine, 1.30%; threonine, 0.77%; tryptophan, 0.28%. 2The nutrient matrix used was CP, 38.3%; ME, 2,030 kcal/kg; Ca, 0.16%; non-phytin P, 0.16%; methionine, 0.45%; lysine, 1.64%; arginine, 4.90%; threonine, 1.04%; and tryptophan 0.43%. Amino acid profile was by courtesy of Degussa Huls Corp., Allendale, NJ, 07401. 3Trace minerals premix added at this rate yields: 150 mg Mn, 16.80 mg Fe, 1.70 mg Cu, 125.50 mg Zn, 0.25 mg Se, 1.05 mg I, 0.84 mg Mo per kg diet. 4Vitamin premix added at this rate yields: 11, 02 IU vitamin A, 46 IU vitamin E, 3, 85 IU vitamin D3, 1.47 mg Vitamin k, 2.94 mg thiamine, 5.85 mg riboflavin, 20.21 mg pantothenic acid, 0.55 mg biotin, 1.75 mg folic acid, 477.67 mg choline, 16.50 µg vitamin B12, 45.93 mg niacin, and 7.17 mg pyridoxine per kg diet.

121
starter diet containing 55% wheat and challenged with Clostridium perfringens type A,
3) chicks fed broiler starter diet containing 55% wheat and 2.5% guar meal and
challenged with Clostridium perfringens type A, 4) chicks fed broiler starter diet
containing 55% wheat and 1% guar gum and challenged with Clostridium perfringens
type A, and 5) chicks fed broiler starter diet containing 55% wheat and 0.125% saponin-
rich guar meal extract and challenged with Clostridium perfringens type A.
Preparation and Administration of Clostridium perfringens
Four field isolates of Clostridium perfringens (type A) from different
geographical locations (1 isolate each from Texas and Virginia, and 2 isolates from
Georgia) were cultured separately then combined and provided to the appropriate
treatment groups as described by McReynolds et al. (2004). For challenge, the isolates
were grown in thioglycollate broth media in an anaerobic chamber for 12 h at 37oC.
Chicks were challenged by oral crop gavage with 107 cfu of Clostridium perfringens/0.5
mL once daily for 3 consecutive d starting at d 14. Weekly body weight, feed intake and
mortality rate were recorded from 0-21 d of age. The weak or unhealthy chicks were
weighted and excluded before chicks were challenged at 14 d of age to avoid any other
interaction factors. At 21 d of age, necropsies were performed and intestinal lesions were
scored for each chick of all the treatment groups.

122
Necrotic Enteritis Lesion Scores
The jejunum and ileum of the small intestine were examined to evaluate gross
lesions associated with necrotic enteritis. All chickens were euthanatized by cervical
dislocation and necropsied at the termination of the experiment (21d of age). The
intestine of each chicken was excised cut longitudinally about 15-20 cm in length from
the pars pyloris gastris (below the gizzard) to Meckel’s diverticulum was removed to
determine the lesion scores. A sample of gastrointestinal contents was collected for
determination of Clostridium perfringens numbers in digesta. Lesion scores were
recorded using the following criteria: 0 = no gross lesions, normal intestinal appearance;
1 = thin-walled or friable, gray appearance; 2 = thin-walled, focal necrosis, gray
appearance, small amounts of gas production; 3 = thin-walled, sizable patches of
necrosis, gas-filled intestine, small flecks of blood; and 4 = severe extensive necrosis,
marked hemorrhage, much gas in intestine according to Prescott (1979).
Colony Forming Unit (cfu) Concentrations
To quantitatively measure populations of Clostridium perfringens the sample of
gastrointestinal contents collected from excised intestines was diluted and plated in an
anaerobic hood. The gastrointestinal contents (1g) from excised small intestines of each
chick were placed into 10 mL of anaerobic thioglycollate broth media and stomached for
30 s. Half a mL of the resultant gut contents was removed from the stomached material,
placed into an anaerobic vial containing 4.5 mL of anaerobic thioglycollate broth media
placed into an anaerobic chamber and incubated for 18 h at 40°C. Next, ten-fold 6 serial

123
dilutions were applied and 100 μL of each dilution was inoculated on Shahidi-Ferguson-
perfringens (SFP) agar plates and anaerobically incubated at 40°C for 18 h. The plates
were examined for the presence of Clostridium perfringens and the colony forming units
(cfu) exhibiting Clostridium perfringens morphology are counted.
Statistical Analysis
The attempt to induce necrotic enteritis in the experiment was unsuccessful as
evidenced by absence of disease lesions and absence of difference between negative and
positive controls. Therefore, the data obtained were subjected to one-way ANOVA and
were expressed as mean ± standard error of mean (SEM) using the GLM procedure of a
statistical software package (SPSS 14.0, SPSS Inc., Chicago, IL). Treatment means were
separated (P ≤ 0.05) using Duncan’s multiple range test (Duncan, 1955).
Results and Disscusion
Challenge by Clostridium perfringens in this study was unsuccessful and did not
result in necrotic enteritis as evidenced by the absence of significant differences between
the negative and positive control groups in lesion score or Clostridium perfringens
digesta colony forming units (Table 22). Feed intake, feed conversion ratio, mortality
rate (Table 23), body weight and body weight gain (Table 24) also were not different
between these two treatments.
Several factors are thought to induce necrotic enteritis such as diet composition
(Smith, 1965; Nairn and Bamford, 1967), high dietary levels of fish meal (Johnson and

124
Pinedo, 1971; Truscott and Al-Sheikhly, 1977; Branton et al., 1987; Kaldhusdal and
Hofshagen, 1992; Riddell and Kong, 1992; Kocher et al., 2003), high dietary levels of
wheat and barley (Branton et al., 1987; Riddell and Kong, 1992), increased stocking
density and poor litter quality (Al-Sheikhly and Truscott, 1977), previous diseases such
as Eimeria tenella (Frame and Bickford, 1986), birds’ age (Long, 1973; Ficken, 1991;
Ross, 1999), season (Kaldhusdal and Skjerve, 1996) and increased digesta viscosity
(Kocher et al., 2003).
In this study we used diets containing a high percentage of wheat (55%) and oral
doses of Clostridium perfringens to induce the necrotic enteritis according to Branton et
al. (1997) and McReynolds et al. (2004). They reported that necrotic enteritis lesion
scores were lower for chicks challenged with Clostridium perfringens and fed corn-
based diets than those chicks challenged with Clostridium perfringens and fed wheat-
corn-based diets. Perhaps necrotic enteritis was not observed among treatments because
only one dose of Clostridium perfringens was innoculated (107 cfu/mL once daily for 3
consecutive days starting on d 14). McReynolds et al. (2004) observed necrotic enteritis
lesions after challenging chicks with Clostridium perfringens with 107 cfu/mL twice
daily for 3 consecutive days starting on d 17. Helmboldt and Bryant (1971) noted that
low challenge dose of the Clostridium perfringens is non-pathogenic.
The positive control treatment and the guar meal, guar gum and saponin-rich
guar meal extract dietary treatments were all given oral doses of Clostridium
perfringens. Since no differences were observed between positive and negative controls,

125
the only meaningful comparisons for the effects of guar component dietary treatments
are with the positive control.
The number of Clostridium perfringens colony forming units of chicks fed 1%
guar gum was significantly higher than positive control chicks. However, cfu number of
guar meal and saponin-rich extract dietary treatments were not different than the cfu
counts of the guar gum dietary treatment (Table 22).
Although Lalitha et al. (1990) reported increased mortality after orally using 300
mg of yucca steroid saponin/kg body weight in rats, no mortality differences were
observed in our study. Not even differences in feed intake were observed among the
dietary treatments (Table 23). There are many incidents of feed intake suppression by
alfalfa triterpenoid saponins (Sim et al., 1984; Terapunduwat and Tasaki, 1986; Potter et
al., 1993; Jenkins and Atwal, 1994). Conversely, the feed intake and appetite of Wister
rats improved when they were fed 10 and 100 mg/300 g body weight of saponin-rich
extract from fenugreek seed which contains steroid saponins (Petit et al., 1993). Results
also disagree with studies that report reduced feed intake in poultry, pig and cattle fed
rations containing guar meal (Brocher and Ackerson 1950; Saxena and Pradhan 1974;
Thakur and Pradhan, 1975a, b). These differences may be attributed to different
chemical structures and concentrations of the saponins fed, and the concentrations of
guar meal and gum formulated in the diets.
Diet significantly affected feed conversion ratio (Table 23), body weight and
body weight gain (Table 24) however. Significant differences in the feed conversion

126
Table 22. Duodenal lesion scores1 and colony forming units (cfu) of duodenal contents from chicks unchallenged (NC) or challenged with Clostridium perfringens and fed a positive control (PC), 2.5% guar meal GM), 1% guar gum (GG), or 0.125% saponin-rich guar meal extract (GS) diet
Parameters Treatments
NC2 PC3 GM4 GG5 GS6 Lesion Score 1.3 ± 0.1a 1.3 ± 0.1a 1.6 ± 0.1 a 1.3 ± 0.1a 1.5 ± 0.1a (n) (36) (32) (38) (38) (41) Colony Forming Units (cfu/mL x 10-4)
8.2 ± 5.1b 25.3 ± 13.0b 42.8 ± 32.9ab 125.1 ± 37.0a 90.2 ± 44.3ab
(n) (15) (15) (15) (15) (15)
a-bMeans (± SEM) within a row that do not share a common superscript are significantly different (≤ 0.05). 1Lesion scores were recorded using the following criteria (Prescott, 1979): 0 = no gross lesions, normal intestinal appearance; 1 = thin-walled or friable, gray appearance; 2 = thin-walled, focal necrosis, gray appearance, small amounts of gas production; 3 = thin-walled, sizable patches of necrosis, gas-filled intestine, small flecks of blood; and 4 = severe extensive necrosis, marked hemorrhage, much gas in intestine. 2NC, 55% wheat-corn-based starter broiler diet unchallenged with Clostridium perfringens.
3PC, 55% wheat-corn-based starter broiler diet challenged with Clostridium perfringens. 4GM, 2.5% added to 55% wheat-corn-based starter broiler challenged with Clostridium perfringens. 5GG, 1.0% added to 55% wheat-corn-based starter broiler diet challenged with Clostridium perfringens.
6GS, 0.125% added to 55% wheat-corn-based starter broiler diet challenged with Clostridium perfringens.

127
Table 23. Feed intake, feed conversion ratio and mortality rate for chicks unchallenged (NC) or challenged with Clostridium perfringens and fed a positive control (PC), 2.5% guar meal (GM), 1% guar gum (GG), or 0.125% saponin-rich guar meal extract (GS) diet
a-bMeans (± SEM) within a row that do not share a common superscript are significantly different (P ≤ 0.05). 1NC, 55% wheat-corn-based starter broiler diet unchallenged with Clostridium perfringens. 2PC, 55% wheat-corn-based starter broiler diet challenged with Clostridium perfringens. 3GM, 2.5% added to 55% wheat-corn-based starter broiler diet challenged with Clostridium perfringens. 4GG, 1.0% added to 55% wheat-corn-based starter broiler diet challenged with Clostridium perfringens.
5GS, 0.125% added to 55% wheat-corn-based starter broiler diet challenged with Clostridium perfringens.
Age Treatments NC1 PC2 GM3 GG4 GS5 (d) Feed intake (g) 1-7 115.0 ± 8.2a 1.22.8 ± 4.9a 125.1 ± 1.7a 113.5 ± 5.3a 115.5 ± 2.8a 8-14 243.2 ± 10.6a 244.6 ± 7.8a 263.0 ± 15.9a 221.2 ± 11.8a 236.2 ± 18.9a 15-21 466.9 ± 31.7a 478.3 ± 29.5a 427.1 ± 51.8a 431.2 ± 20.5a 426.8 ± 31.8a
Feed conversion ratio (g feed/g body gain) 1-7 1.20 ± 0.08a 1.33 ± 0.09a 1.28 ± 0.03a 1.23 ± 0.01a 1.22 ± 0.02a 8-14 1.08 ± 0.05a 1.18 ± 0.08a 1.13 ± 0.03a 1.10 ± 0.09a 1.18 ± 0.05a 15-21 1.23 ± 0.08b 1.12 ± 0.09b 1.49 ± 0.06ab 1.34 ± 0.09ab 1.63 ± 0.17a
Mortality rate (%)
0-14 10.0±2.9a 15.0±7.6a 8.3±6.0a 13.3±7.3a 6.7±3.3a 15-21 18.5±6.5a 21.6±0.4a 24.0±13.3a 25.3±10.1a 14.1±7.1a

128
Table 24. Weekly body weight and body weight gain for chicks unchallenged (NC) or challenged with Clostridium perfringens and fed a positive control (PC), 2.5% guar meal (GM), 1% guar gum (GG), or 0.125% saponin-rich guar meal extract (GS) diet
Age
Treatments NC1 PC2 GM3 GG4 GS5
(d) Body Weight (g) 0 43.3 ± 0.4a 44.5 ± 0.6a 43.8 ± 0.5a 45.4 ± 0.7a 44.6 ± 0.2a 7 38.7 ± 7.0a 137.3 ± 2.4a 141.6 ± 2.8a 136.4 ± 4.0a 138.9 ± 3.4a 14 366.3 ± 5.7a 346.3 ± 15.1a 373.1 ±12.4a 358.6 ± 18.1a 341.0 ± 27.3a 21 746.2 ± 22.7a 748.7 ± 32.1a 659.4 ± 22.3b 682.6 ± 11.7ab 612.7 ± 21.7b Body Gain Weight (g) 0-7 96.4 ± 6.6a 92.9 ± 2.9a 97.8 ± 2.3a 92.1 ± 4.2a 94.3 ± 3.4a 8-14 226.6 ± 9.5a 209.0 ± 13.3a 231.5 ± 9.7 a 222.1 ± 20.8a 202.1 ± 23.9a 15-21 380.0 ± 22.6a 402.4 ± 42.6a 286.3 ± 31.9b 324.0 ± 9.5ab 271.7 ± 49.0 b
a-bMeans (± SEM) within a row that do not share a common superscript are significantly different (P ≤ 0.05). 1NC, 55% wheat-corn-based starter broiler diet unchallenged with Clostridium perfringens. 2PC, 55% wheat-corn-based starter broiler diet challenged with Clostridium perfringens. 3GM, 2.5% added to 55% wheat-corn-based starter broiler diet challenged with Clostridium perfringens. 4GG, 1.0% added to 55% wheat-corn-based starter broiler diet challenged with Clostridium perfringens. 5GS, 0.125% added to 55% wheat-corn-based starter broiler diet challenged with Clostridium perfringens.

129
ratio were only observed from 15 to 21 d of age between both negative and positive
control groups and chicks fed 0.125% saponin-rich guar meal extract. Guar meal extract
increased the feed conversion ratio above control levels, but were not different from
2.5% guar meal and 1% guar gum fed chicks (Table 23).
The only dietary effects on body weight and body weight gain were observed
during the last week of the study (Table 24). Body weights of chicks fed guar meal and
saponin-rich extract diets were depressed in comparison to control chicks at 21 d, but
were not depressed in comparison with chicks fed guar gum. Body weight gains were
depressed below those of control chicks during 15 to 21 days by guar meal and saponin-
rich extract diets (Table 24). These results agree with researchers who reported that guar
meal used in poultry, pig and cattle rations is limited because of its adverse effects on
growth rate (Brocher and Ackerson 1950; Saxena and Pradhan 1974; Thakur and
Pradhan, 1975a, b). Kamran et al. (2002) reported that adding 5% guar meal in chicken
diets reduced body weight and intestinal content viscosity. Our results disagree with the
observations of Lee et al. (2003a, b) who reported that there were no negative impacts on
productive performance after adding guar meal without enzyme to diets at
concentrations up to 2.5% in broiler chicks. Lee et al. (2005) reported that guar meal can
be used at up to 5% with β-mannanase enzyme in broilers. High viscosity generally is
coincident with delayed gastric emptying, increased small intestinal transit time, and
inhibition of nutrient absorption (Blackburn and Johnson, 1981). Increased intestinal
viscosity was proposed to result from residual guar gum present in guar meal.

130
Growth is impacted by reduced nitrogen retention, slowed absorption of amino
acids, reduced energy utilization and fat absorption (Anderson and Warnick, 1964;
Katoch et al., 1971). Verma and McNab (1984a, b) reported that protein in guar meal
was rich in arginine, but methionine and lysine concentrations were comparatively lower
than concentrations typically found in soybean meal, and inadequate for optimum rat
growth (Van Etten et al., 1961). Ambegaokar et al. (1969) suggested that tryptophan,
methionine and threonine were the first three deficient amino acids of guar meal when
compared to whole egg protein.
Previous studies reported that the negative effects of adding guar meal on body
weight and feed conversion ratio might be attributed to the presence of anti-nutrient
compounds in guar meal such as trypsin inhibitor, excessive guar gum, saponin or some
other unknown toxic substances. Guar meal used in poultry ration was limited by its
adverse effects on growth rate (Thakur and Pradhan, 1975a, b) due its saponin and guar
gum contents. Guar meal contains 5-13% of dry matter triterpenoid guar saponin (Curl et
al., 1986; Hassan et al., 2007) and 13-18% guar gum, residual galactomannan gum
(Bakshi et al., 1964; Lee et al., 2004). Conner (2002) proved that trypsin inhibitor
activity in the raw guar meal was lower than trypsin inhibitor levels found in heat-treated
soybean meal. Therefore, trypsin inhibitor is not likely the primary anti-nutritive factor
in guar. Our results agree with observations of Vohra and Kratzer (1964) who
demonstrated that as little as 1% guar gum in broiler chicken diets causes a depression of
growth. When the diet contained 2% guar gum, the relative growth of broiler chickens

131
was 61-67% of controls. Lee et al. (2003a) also supported the idea that residual guar
gum was at least partially responsible for the effects seen when guar meal was fed.
The growth depressing properties of guar gum may be overcome by treating the
feed with enzymes capable of hydrolyzing it, namely pectinase, cellulose, a preparation
from sprouted guar beans (Vohra and Kratzer, 1964) or β-mannanase (Vohra and
Kratzer, 1964; 1965; Chesson, 1987; Lee et al., 2003a, b). It is thought that feed
containing exogenous enzymes with guar meal reduced intestinal viscosity and
alleviated the deleterious effects associated with residual guar gum.
Guar meal also is rich in saponins (Curl et al., 1986; Hassan et al., 2007) which
may have antinutritional properties such as those of alfalfa saponins (Price et al., 1987;
Mahato et al., 1988; Shimoyamada et al., 1990). Saponins can be harmful for
monogastric animals such as swine, fish and poultry (Newman et al., 1958; Sim et al.,
1984; Terapunduwat and Tasaki, 1986; Potter et al., 1993; Jenkins and Atwal, 1994; Olli
et al., 1994; Francis et al., 2001a, b). They tend to have a bitter taste, irritate the
membranes of the mouth and the digestive tract (Oleszek and Jurzysta, 1992; Oleszek et
al., 1994), reduce intestinal motility (Klita et al., 1996), change ingesta transit time
(Ueda et al., 1996), inhibit gastric emptying (Matsuda et al., 1999a, b; Yoshikawa et al.,
2001) and decrease growth rate (Ueda and Ohshima, 1987; Cheeke, 1983; 1996; Makkar
and Becker, 1996). They also lower digestion rate (Freeland et al., 1985; Lu and
Jorgensen, 1987; Lu et al., 1987; Killeen et al., 1998), reduce protein digestibility (Potter
et al., 1993; Shimoyamada et al., 1998), depress mucosal enzyme activity in the lower
intestine (Olli et al., 1994). Perhaps acting as a stressor, they stimulate ACTH and

132
corticosterone levels (Kim et al., 1999), inhibit the absorption of vitamins A and E in
chicks and iron in the rat (Johnson et al., 1986; Southon et al., 1988a; Jenkins and Atwal,
1994). Interestingly they have been reported to increase mineral excretion of sodium,
iron, magnesium and zinc (West, 1979; Freeland et al., 1985; Southon et al., 1988b), as
well as change the circadian rhythm of feeding behavior (Petit et al., 1995).
On the other hand, other studies reported no adverse effect on growth after
feeding fenugreek seeds containing steroid saponins (Ishaaya et al., 1969) and soybean
triterpenoid saponins (Petit et al., 1995) at concentrations as much as five times the
concentration in a normal soybean-supplemented diet of chicks, rats and mice. Yucca
and quillaja saponins are classified as generally recognized as safe (GRAS) and are
approved for food use in the USA (Fenwick et al., 1992).
In chapter V we reported that it was not clear which specific compounds in guar
meal contributes to the growth inhibitory effects in the broiler chick diets. Most likely
candidates for growth and feed efficiency inhibition are residual guar gum and
triterpenoid saponins. In this study, the results obtained indicate that there are negative
feed efficiency, body weight and growth rate effects associated with adding 0.125%
saponin-rich guar meal extract to the diet of chicks.
Summary and Conclusions
The Clostridium perfringens challenge of chicks was unsuccessful in creating
necrotic enteritis in this study. There were no differences between negative and positive
control groups in all parameters measured. Adding 1% Guar gum in the diet of chicks

133
challenged with Clostridium perfringens significantly increased the colony forming unit
numbers above the colony forming unit numbers of Clostridium perfringens in digesta of
both negative and positive control treatment groups. Body weights at 21 d, and body
weight gains during 14 to 21 d and 0 to 21 d in birds challenged and fed 2.5% guar meal
or 0.125% saponin-rich guar meal extract were significantly lower than those of both
negative and positive control groups during the same periods. Weekly feed conversion
ratio of chicks challenged and fed 0.125% saponin-rich guar meal extract were higher
than those of both negative and positive control treatment groups, but not different from
the guar meal and saponin fed treatment groups during the 15 to 21 d period. Results
suggest that saponins could contribute to the observed inhibion of growth in chicks fed
guar meal.

134
CHAPTER VII
SUMMARY AND CONCLUSIONS
Prophylactic use of antibiotics is no longer desirable due to increased concerns
regarding antibiotic resistance. Recent research has focused on antibiotic alternatives to
prevent and treat diseases such as use of probiotics, prebiotics and organic acids. Many
pharmaceutical compounds used to protect and treat human and animal health originated
from plant extracts. Among these plant compounds are saponins from quillaja and yucca
that have several beneficial effects on animal health. Saponins are glycoside compounds
distributed in many plants, lower marine animals and some bacteria. They consist of a
fat-soluble nucleus (aglycone) that is either a triterpenoid (C-30) or steroid (C-27)
attached with one or more sugar side chains (glycone) at different carbon sites of the
aglycone. Saponins have many biological properties such as hemolytic, antibacterial and
antiprotozoal activities.
Guar (Gyamopsis tetragonoloba) is a drought tolerant annual legume mainly
grown for the guar gum (galactomannan polysaccharide) that has many industrial and
food processing applications. Guar meal, a combination of hull and germ fractions as a
by-product of guar gum manufacture contains 5-13% saponin by weight of dry matter,
13-18% residual galactomannan gum, and 33-47.5% crude protein that makes it
potentially useful as an ingredient for poultry feed. Guar meal has characteristics of a
useful feeding ingredient that could also have antimicrobial activity because of
galactomannan and saponin content. Research has evaluated neither the hemolytic nor
135
antimicrobial activities of saponin-rich guar meal extracts. Therefore, the objectives of
this research were to isolate saponin-rich extracts from guar meal to determine in vitro
antibacterial activities against relevant gram-positive bacteria (Staphylococcus aureus,
Clostridium perfringens and Lactobacillus spp.) and gram-negative bacteria (Salmonella
Typhimurium and Escherichia coli) in a dose dependent manner compared with
commercial quillaja, yucca and soybean saponins. Also, anticoccidial and anti-
Clostridium perfringens activities were evaluated in vivo by adding guar meal, purified
guar gum or saponin-rich extracts to feed of chicks challenged with the disease
organisms.
Results showed that butanol extracts from guar meal yielded 4.8 ± 0.6% crude
saponin by weight of the original material. Butanol extract purified by reverse-phase C-
18 flash chromatography eluted 2 peak fractions with 20% methanol, and 1 peak each
with 60, and 100% methanol to yield averages of 1.72 ± 0.47, 0.88 ± 0.16, 0.91 ± 0.16
and 1.55 ± 0.15% crude saponin by weight of the original material, respectively. Further
normal-phase HPLC purification of the100% methanol saponin-rich guar meal extract
eluted 4 peaks at 16, 39, 44 and 46 min. Hemolytic activity was observed in the 100 %
methanol guar meal extract, sub-fractions of methanol extract eluted at16 min, and F and
G guar fractions prepared independently by Dr. Mark Berhow. The 100% methanol
extract was most effective against Staphylococcus aureus, Escherichia coli,
Lactobacillus spp. and Salmonella Typhimurium at the concentrations tested. The 20 and
60% methanol extracts were neither hemolytic nor antibacterial, but stimulated
Lactobacillus spp. at concentrations more than or equal to 0.39 mg/mL. The 100%
136
methanol guar meal extract and commercial quillaja saponins were significantly higher
in both hemolytic and antibacterial activities against all bacteria tested than commercial
yucca and soybean saponins. Soybean saponin had no antibacterial activity against any
of the bacteria tested.
Adding 5% guar meal to diets of chicks challenged with Eimeria tenella reduced
the infection severity with respect to oocysts shed per gram feces and bloody diarrhea.
However, adding 5% guar meal in the diet decreased body weight, body weight gain and
feed efficiency. The Clostridium perfringens challenge was unsuccessful in creating
necrotic enteritis in this study. There were no differences in intestinal lesion scores, feed
intakes or mortality rates among all dietary treatments. No differences were observed
between negative and positive control groups in all parameters measured in this study.
Adding 1% Guar gum in the diet of the chicks challenged with Clostridium perfringens
significantly increased the colony forming unit numbers of intestinal contents. Adding
either 2.5% guar meal or 0.125% saponin-rich guar meal extract to challenged chicks
reduced body weights and body weight gain, but 0.125% saponin-rich guar meal extract
increased feed conversion ratio. Results showed that guar saponin may be the main
antinutritional compound in guar meal, however saponin-rich guar meal extract
exhibited antimicrobial activity. Guar meal showed anticoccidial activity against Emeria
tenella and saponin-rich guar meal extract exhibited antibacterial activity. Thus, guar
products may have potential as an antibiotic alternative.

137
REFERENCES
Aabo, S., J. K. Anderson, and J. E. Olsen. 1995. Detection of Salmonella in minced meat by the polymerase chain reaction method. Lett. Appl. Microbiol. 21:180-182.
Aarestrup, F. M. 1999. Association between the consumption of antimicrobial agents in
animal husbandry and the occurrence of resistant bacteria among food animals. Int. J. Antimicrob. Agents. 12:279-285.
Aarestrup, F. M., Y. Agerso, P. Ahrens, J. C. Jorgensen, M. Madsen, and L. B. Jensen.
2000. Antimicrobial susceptibility and presence of resistance genes in Staphylococci from poultry. Vet. Microbiol. 74:353-364.
Abe, H., S. Odashima, and S. Arichi. 1978a. The effects of saikosaponins on biological
membranes. 2. Changes in electron spin resonance spectra from spin labelled erythrocyte and erythrocyte ghost membranes. Planta Med. 34:287–290.
Abe, H., M. Sakaguchi, H. Konishi, T. Tani, and S. Arichi. 1978b. The effects of
saikosaponins on biological membranes. 1. The relationship between the structures of saikosaponins and hemolytic activity. Planta Med. 34:160–166.
Abrams, G. D. 1983. Impact of the intestinal microflora on intestinal structure and
function. Pages 13-19 in Human Intestinal Microflora and Disease. D. J. Hentges, ed. Acad. Press, NY.
Akhtar, R. A., and M. C. Perry. 1975. The effect of digitonin of the stimulation by
insulin of glucose uptake by isolated fat cells. Biochim. Biophys. Acta 10:30-40. Al-Bar, A., A. Ismail, P. R. Cheeke, and H. Nakaue. 1993. Effect of dietary Yucca
shidegera extract (Deodorage) on environment ammonia and growth performance of chickens and rabbits. J. Anim. Sci. 71(Suppl.):114.
Al-Habori, M., and A. Raman. 1998. Antidiabetic and hypocholesterolaemic effects of
fenugreek. Phytother. Res. 12:233–242. Al-Shiekhy, F., and R. B. Truscott. 1977. The pathology of necrotic enteritis of chickens
following infection of crude toxins of Clostridium perfringens into the duodenum. Avian Dis. 21:241-255.
Ambegaokar, S. D., J. K. Kamath, and V. P. Shinde. 1969. Nutritional studies in protein
of gawar (Cyamopsis tetragonoloba). J. Nutr. Diet. 6:323-328.

138
Anderson, J. O., and R. E. Warnick. 1964. Value of enzyme supplements in rations containing certain legume seed meals or gums. Poult. Sci. 43:1091-1097.
Andersson, L., L. Bohlin, M. Iorizzi, R. Riccio, L. Minale, and W. Moreno-Lopez. 1989.
Biological activity of saponins and saponin-like compounds from starfish and brittle-stars. Toxicon. 27:179-188.
Andersson, L., A. Nasir, and L. Bohlin. 1987. Studies of Swedish marine organisms, IX
polyhydroxylated steroidal glycosides from the starfish Porania pulvillus. J. Nat. Prod. 50:944-947.
Anisimov, M. M., N. G. Prokofeva, L. Y. Korotkikh, I. I. Kapustina, and V. A. Stonlik.
1980. Comparative study of cytotoxic activity of triterpene glycosides from marine organisms. Toxicol. 18:221-223.
Annett, C. B., J. R. Viste, M. Chirino-Trejo, H. L. Classen, D. M. Middleton, and E.
Simko. 2002. Necrotic enteritis: Effect of barley, wheat and corn diets on proliferation of Clostridium perfringens type A. Avian Pathol. 31:598-601.
Anthony, N. B., J. M. Balog, F. B. Staudinger, C. W. Wall, R. D. Walker, and W. E.
Huff. 1994. Effects of a urease inhibitor and ceiling fans on ascites in broilers. 1. Environmental variability and incidence of ascites. Poult. Sci. 73:801-809.
Apers, S., S. Baronikova, J. B. Sindambiwe, M. Witvrouw, E. D. Clercq, D. Vanden
Berghe, E. Van Marck, A. Vlietinck, and L. Pieters. 2001. Antiviral, hemolytic and molluscicidal activities of triterpenoid saponins from Maesa lanceolata: Establishment of structure-activity relationships. Planta Med. 67:528–532.
Applebaum, S. W., B. Gestetner, and Y. Birk. 1965. Physiological aspects of host
specificity in the bruchidae-IV. Development incompatibility of soybeans for Callosobruchus. J. Insect Physiol. 11:611-616.
Applebaum, S. W., S. Marco, and Y. Birk. 1969. Saponins as possible factors of
resistance of legume seeds to attack of insects. J. Agric. Food Chem. 17:618-622. Arab, H. A., S. Rahbari, A. Rassouli, M. H. Moslemi, and F. Khosravirad. 2006.
Determination of artemisinin in Artemisia sieberi and anticoccidial effects of the plant extract in broiler chickens. Trop. Anim. Heal. Prod. 38:497–503.
Arletti, R., A. Benelli, E. Cavazzuti, G. Scarpetta, and A. Bertolini. 1999. Stimulating
property of Turnera diffusa and Pfaffia paniculata extracts on the sexual behavior of male rats. Psychopharmacol. 143:15–19.

139
Armah, C. N., A. R. Mackie, C. R. K. Roy, A. E. Osboun, P. Bowyer, and S. Ladha. 1999. The membrane permeabilizing effect of avenacin A-1 involves the reorganization of bilayer cholesterol. Biophys. J. 76:281-290.
Arslan, M. O., G. Yunus, and O. Kadir. 2002. The frequency of Eimeriidae species in
the domestic geese in Kars Province of Turkey. Acta Protozool. 41:353-357. Asaoka, Y., T. Yannai, H. Hirayama, Y. Une, E. Saito, H. Sakai, M. Goryo, H. Fukushi,
and T. Masegi. 2004. Fatal necrotic enteritis associated with Clostridium perfringens in wild crows (Corvus macrorhynchos). Avian Pathol. 33:19-24.
Attele, A. S., J. A. Wu, and C. S. Yuan. 1999. Ginseng pharmacology–Multiple
constituents and multiple actions. Biochem. Pharmacol. 58:1685–1693. Austin, C. C., and M. J. Wilkins. 1998. Reptile associated salmonellosis. J. Am. Vet.
Med. Asso. 212:866-867. Authi, K. S., G. H. R. Rao, B. J. Evenden, and N. Crawford. 1988. Action of guanosine
50-(beta-thio) diphosphate on thrombin-induced activation and calcium mobilization in saponin-permeabilized and intact human platelets. Biochem. J. 255:885–894.
Avato, P., R. Bucci, A. Tava, C. Vitali, A. Rosato, Z. Bialy, and M. Jurzysta. 2006.
Antimicrobial activity of saponins from Medicago spp.: Structure-activity relationship. Phytother. Res. 20:454-457.
Ayres, J. C., J. O. Mundt, and W. E. Sandine. 1980. Lactic fermentation. Pages 198-231
in Microbiology of Foods. J. C. Ayres, O. J. Mundt, and W. E. Sandine, eds. W. H. Freeman Company, San Francisco, USA.
Baba, E., A. L. Fuller, J. M. Gilbert, S. G. Thayer, and L. R. Mcdougald. 1992. Effects
of Eimeria brunetti infection and dietary zinc on experimental induction of necrotic enteritis in broiler chickens. Avian Dis. 36:59-62.
Bae, E. A., S. Y. Park, and D. H. Kim. 2000. Constitutive beta-glucosidases hydrolyzing
ginsenoside R-b1 and R-b2 from human intestinal bacteria. Biol. Pharm. Bull. 23:1481–1485.
Baker, D. C., R. F. Keeler, and W. P. Garfield. 1988. Mechanism of death in Syrian
hamsters’ avaged potato sprouts material. Toxicol. Pathol. 16:333-339. Bakshi, Y. K. 1966. Studies on toxicity and processing of guar meal. PhD Diss. Texas
A&M Univ. College Station, TX.

140
Bakshi, Y. K., C. R. Creger, and J. R. Couch. 1964. Studies on guar meal. Poult. Sci. 43:1302. (Abstr.)
Balaban, N., and A. Rasooly. 2000. Staphylococcal enterotoxins. Int. J. Food Microbiol.
61:1-10. Bangham, A. D., R. W. Horne, A. M. Glauert, J. T. Dingle, and J. A. Lucy. 1962. Action
of saponin on biological cell membranes. Nature 196:952–955. Barber, M. 1961. Methicillin resistant Staphylococci. J. Clin. Pathol. 14:385-393. Barefoot, S. F., and T. R. Klaenhammer. 1983. Detection and activity of Lactain S., a
bacteriocin produced by Lactobacillus acidophilus. Appl. Environ. Microbiol. 45:1808-1815.
Barnes, H. J., J. P. Vaillancourt, and W. B. Gross. 2003. Colibacillosis. In: Diseases of
Poultry, 11th ed., Iowa State University Press, Ames, IA, USA. Basu, N., and R. P. Rastogi. 1967. Triterpenoid saponins and sapogenins. Phytochem.
6:1249-1270. Bedford, M. 2000. Removal of antibiotic growth promoters from poultry diets:
implications and strategies to minimise subsequent problems. World’s Poult. Sci. J. 56:347–365.
Bengmark, S. 1998. Immunonutrition: Role of biosurfactants, fiber, and probiotic
bacteria. Nutr. 14:585-594. Benie, T., A. El-Izzi, C. Tahiri, J. Duval, and M. L. T. I. Thieulant. 1990.
Combretodendron africanum bark extract as an antifertility agent. I: Estrogenic effects in vivo and LH release by cultured gonadotrope cells. J. Ethnopharmacol. 29:13–23.
Berhow, M. A., S. B Kong, K. E. Vermillion, and S. M. Duval. 2006. Complete
quantification of group A and group B soyasaponins in soybeans. J. Agric. Food Chem. 54:2035-2044.
Berkhoff, H. A. 1985. Clostridium colinum spp. nov, the causative agent of ulcerative
enteritis (quail disease) in quail, chickens, and pheasants. Int. J. Systematic Bacteriol. 35:155-159.
Bertolatti, D., F. G. O'Brien, and W. B. Grubb. 2003. Characterization of drug-resistant
Staphylococcus aureus isolated from poultry processing plants in Western Australia. Int. J. Environ. Health. Res. 13:43-54.

141
Bhargava, S. K. 1998a. Antifertility agents from plants. Fitoterapia. 59:163-177. Bhargava, S. K. 1998b. Antifertility effects of Sapindus trifoliatus L. fruit extract in rats.
Int. J. Crude Drug Res. 26:229-233. Birk, Y. 1969. Saponins. Pages 169-210 in Toxic Constituents of Feedstuffs. I. E.
Liener, ed. Acad. Press, NY, USA. Birk, Y., A. Bondi, B. Gestetner, and I. Ishaaya. 1963. A thermostable hemolytic factor
in soybeans. Nature 197:1089-1090. Birk, Y., and I. Peri. 1980. Saponin. Pages 161-182 in Toxic Constituents of Plant
Foodstuffs (2nd ed.). I. E. Liener, ed. Acad. Press, NY, USA. Blackburn, N. A., and I. T. Johnson. 1981. The effect of guar gum on the viscosity of the
gastrointestinal contents and on glucose uptake from the perfused jejunum in the rat. Br. J. Nutr. 46:239-246.
Blom, H., and C. Mortvedt. 1991. Anti-microbial substances produced by food
associated microorganisms. Biochem. Soc. Trans. 19:694-698. Bosler, D. A., M. Blummel, P. Bullerdieck, H. P. S. Makkar, and K. Becker. 1997.
Influence of a saponin containing feed additive on mass development and carcass evaluation of growing lambs. Proc. Soc. Nutr. Physiol. 6:46. (Abstr.)
Brain, K., J. Hadgraft, and M. Al-Shatalebi. 1990. Membrane modification in activity of
plant molluscicides. Planta Med. 56:663. Branton, S. L., B. D. Lott, J. D. May, P. A. Hedin, F. W. Austin, M. A. Latour, and E. J.
Day. 1997. The effects of nonautoclaved and autoclaved water-soluble wheat extracts on the growth of Clostridium perfringens. Poult. Sci. 75:335-338.
Branton, S. L., F. N. Reece, and W. M. Hagler, Jr. 1987. Influence of a wheat diet on
mortality of broiler chickens associated with necrotic enteritis. Poult. Sci. 66:1326–1330.
Brock, T. D., M. T. Madigan, J. M. Martinko, and J. Parker. 1994. Biology of
microorganisms. Prentice Hall, Englwood Cliffs, NJ. Brocher, R., and C. W. Ackerson, 1950. The nutritive value of legume seeds. Effect of
autoclaving and trypsin inhibitor test for seventeen species. J. Nutr. 41:339-345. Broussard, C. T., C. L. Hofacre, R. K. Page, and O. J. Fletcher. 1986. Necrotic enteritis
in cage-reared commercial layer pullets. Avian Dis. 30:617-619.

142
Burda, S., M. Jurzysta, and W. Oleszek. 1994. Pages 128-130 in Biologically Active Saponin Content in Eight Cultivars of Alfalfa (Medicago sativa). Proc. Int. Conf. EUCARPIA Lucern Section Meeting, Lusignan.
Bureau, D. P., A. M. Harris, and C. Young Cho. 1998. The effects of purified alcohol
extracts from soy products on feed intake and growth of Chinook salmon (Oncorhynchus tshawytscha) and rainbow trout (Oncorhynchus mykiss). Aquaculture 161:27-43.
CDC, 2006. Escherichia coli O157:H7. Centers for Disease Control and Prevention.
available online at http://www.cdc.gov/ncidod/dbmd/diseaseinfo/escherichiacoli_g.htm.
Chaffey, B. J., and W. M. Waites. 1987. The adhesion of Staphylococcus aureus isolates
from poultry-processing plants. J. Appl. Bacteriol. 63:R17. Chambers, H. F. 1988. Methicillin-resistant Staphylococci. Clin. Microbial. Rev. 1:173-
183. Chapman, H. D. 1993. Resistance to anticoccidial drugs in fowl. Parasitol. Today 9:159–
162. Chapman, H. D. 1997. Biochemistry, genetic and applied aspects of drug resistance in
Eimeria parasites of the fowl. Avian Pathol. 26:221–244. Chapman, H. D. 1998. Evaluation of the efficacy of anticoccidial drugs against Eimeria
species in the fowl. Int. J. Parasitol. 28:141–144. Cheeke, P. R. 1983. Biological properties and nutritional significance of legume
saponins. Pages 396-414 in Leaf Protein Concentrates. L. Telek, and H. Graham, eds. AVI Publ. Co., West Port, CT.
Cheeke, P. R. 1994. A review of the functional and evolutionary roles of the liver in the
detoxification of poisonous plants, with special reference to pyrrolizidine alkaloids. Vet. Hum. Toxicol. 36:240-247.
Cheeke, P. R. 1996. Biological effects of feed and forage saponins and their impacts on
animal production. Pages 377-385 in Saponins Used in Food and Agriculture. G. R. Waller, and K. Yamasaki, eds. Plenum Press, NY.
Cheeke, P. R. 1998. Natural Toxicants in Feeds, Forages and Poisonous Plants. Upper
Saddle River, Prentice-Hall, NJ.
143
Cheeke, P. R., and R. Otero. 2005. Yucca, quillaja may have role in animal nutrition. Feedstuffs 3(Suppl.):11-14.
Cheeke, P. R., S. Piacente, and W. Oleszek. 2006. Anti-inflammatory and anti-arthritic
effects of yucca schidigera: A review. J. Inflamm. 29:3-6 Chen, J. C., L. D. Chen, W. Tsauer, C. C. Tsai, B. C. Chen, and Y. J. Chen. 2001.
Effects of Ginsenoside Rb2 and Rc on inferior human sperm motility in vitro. Am. J. Chin. Med. 29:155-160.
Cheng, Z. 2004. Evalution of guar meal as a source of prebiotic galactomannans for
laying hens. PhD Diss. Texas A&M Univ., College Station, TX. Chesson, A. 1987. Supplementary enzymes to improve the utilization of pig and poultry
diets. Pages 71-89 in Recent Advances in Animal Nutrition. W. Haresign, and D. J. A. Coles, eds. Butterworth, London, UK.
Chevillard, I., M. Ranson, and B. Senault. 1965. Anti-inflammatory activity of holly
extracts (Ruscus aculeatus). Med. Pharmacol. Exp. Int. J. Exp. Med. 12:109-114. Choi, J. S., and W. S. Woo. 1987. Triterpenoid glycosides from the roots of Patrinia
scabiosaefolia. Planta Med. 53:62-65. Choi, S., S. Y. Jung, C. H. Kim, H. S. Kim, H. Rhim, S. C. Kim, and S. Y. Nah. 2001.
Effect of ginsenosides on voltage-dependent Ca2+ channel subtypes in bovine chromaffin cells. J. Ethnopharmacol. 74:75–81.
Chou, S. C., S. Ramanathan, A. Matsui, J. Rojers, and W. C. Cutting. 1971. Isolation of
saponins with antifertility activity from Gleditschia horrida. Ind. J. Exp. Biol. 9:503–504.
Cioaca, C., C. Margineanu, and V. Cucu. 1978. The saponins of Hedera helix with
antibacterial activity. Pharmazie 33:609-610. Cody, S. H, M. K. Glynn, J. A. Farrar, K. L. Cairns, P. M. Griffin, J. Kobavashi, M.
Fvfe, R. Hoffman, A. S. King, J. H. Lewis, B. Swaminathan, R. G. Bryant, and D. J. Vugia. 1999. An outbreak of Escherichia coli O157:H7 infection from unpasteurized commercial apple juice. Ann. Intern. Med. 130:202-209.
Collignon, P., and F. J. Angulo. 2006. Fluoroquinolone-resistant Escherichia coli: food
for thought. J. Infect. Dis. 194:8–10. Conner, S. R. 2002. Characterization of guar meal for use in poultry rations. PhD Diss.
Texas A&M Univ., College Station, TX.

144
Couch, J. R., C. R. Creger, and Y. K. Bakshi, 1966. Trypsin inhibitor in guar meal. Proc. Soc. Expt. Biol. Med. 123:263-265.
Couch, J. R., J. A. Lazano, and C. R. Creger. 1967a. Soy protein guar meal and excess
calcium in nutrition of commercial layers. Poult. Sci. 46:1248. (Abstr.) Couch, J. R., Y. K. Bakshi, T. M. Ferguson, E. B. Smith, and C. R. Creger. 1967b. The
effect of processing on the nutritional value of guar meal for broiler chicks. Br. Poult. Sci. 8:243-250.
Coulson, C. B., and T. Davis. 1962. Saponin II. Fractionation and pharmacological
properties of lucerne saponins. Possible relation of these to bloat. J. Sci. Food Agric. 13:53-57.
Cowen, B. S., L. D. Schwartz, R. A. Wilson, and S. I. Ambrus. 1987. Experimentally
induced necrotic enteritis in chickens. Avian Dis. 31:904-906. Craven, S. E., N. A. Cox, N. J. Stern, and J. M. Mauldin. 2001a. Prevalence of
Clostridium perfringens in commercial broiler hatcheries. Avian Dis. 45:1050-1053.
Craven, S. E., N. J. Stern, J. S. Bailey, and N. A. Cox. 2001b. Incidence of Clostridium
perfringens in broiler chickens and their environment during production and processing. Avian Dis. 45:887-896.
Cruchaga, S., A. Echeita, A. Aladuena, J. Garcia-Pena, N. Frias, and M. A. Usera. 2001.
Antimicrobial resistance in Salonellae from humans, food and animals in Spain in 1998. J. Antimicrob. Chemother. 17:315-321.
Curl, C. L., R. K. Price, and G. R. Fenwick. 1986. Isolation and structural elucidation of
a triterpenoid saponin from guar, Cyamopsis tetragonoloba. Phytochem. 25:2675-2676.
Dario Frias, A. C., and V. C. Sgarbieri. 1998. Guar gum effects on food intake, blood
serum lipids and glucose levels of Wistar rats. Plant Foods Hum. Nutr. 53:15-28. Do Carmo, L. S., C. Cummings, V. R. Linardi, R. S. Dias, J. M. De Suoza, M. J. De
Sena, D. A. Dos Santos, J. W. Shupp, R. K. Pereira, and M. Jett. 2004. A cause of massive staphylococcal food poisoning incident. Foodborne Pathog. Dis. 1:241-246.
Dodd, G., C. Mead, and W. M. Waites. 1988. Chlorine resistance of strains of
Staphylococcus aureus isolated from poultry-processing plants. Lett. Appl. Microbiol. 6:31-34.

145
Dollahite, J. W., T. Shaver, and B. J. Camp. 1962. Injected saponins as abortifacients. Am. J. Vet. Res. 23:1261–1263.
Dorsaz, A. C., and K. Hostettmann. 1986. Further Saponins from Phytolacca
dodecandra: their Molluscicidal and Spermicidal Properties. Planta Med. 52:557-558.
Dorsaz, A. C., M. Hostettmann, and K. Hostettmann. 1988. Molluscicidal saponins from
Sesbania sesban. Planta Med. 54:225–227. Drake, A., C. Pixley, D. Johnson, S. Higgins, G. Nava, G. Tellez, D. Donoghue, A.
Donoghue, and B. M. Hargis. 2003. Evaluation of a simple in vitro selected probiotic consisting on nine non-pathogenic bacteria to prevent Salmonella infection in broiler chicks. Poult. Sci. 82(Suppl.1):32. (Abstr.)
Droual, R., T. B. Farver, and A. A. Bickford. 1995. Relationship of sex, age, and
concurrent intestinal disease to necrotic enteritis in turkeys. Avian Dis. 39:599-605.
Du, A., and S. Hu. 2004. Effects of herbal complex against Eimeria tenella infection in
chickens. J. Vet. Med. 51:194-197. Duncan, D. B. 1955. Multiple ranges and multiple F test. Biometrics 11:1-42. Duncan, C. J., N. Pugh, D. S. Pasco, and S. A. Ross. 2002. Isolation of a galactomannan
that enhances macrophage activation from the edible fungus Morchella esculenta. J. Agric. Food Chem. 50:5683-5685.
Dunn, A. M. 1969. Pages 276-278 in Veterinary Helminthology. William Heinemann
Medical Books Ltd., London. Ebel, E. D., M. J. David, and J. Mason. 1992. Occurrence of Salmonella enteritidis in the
U.S. commercial egg industry: Report on a national spent hen survey. Avian Dis. 36:646-654.
Edel, W. 1994. Salmonella enteritidis eradication program in poultry breeder flocks in
the Netherlands. Int. J. Food Microbiol. 21:171-178. Elbary, A. A., and S. A. Nour. 1979. Correlation between the spermicidal activity and
the haemolytic index of certain plant saponins. Pharmazie 34:560-561. El Izzi, A., T. Benie, M. L. Thieulant, L. Le Men-Olivier, and J. Duval. 1992.
Stimulation of LH release from cultured pituitary cells by saponins of Petersianthus macrocarpus: A permeabilizing effect. Planta Med. 58:229-233.

146
Ellerbroek, L. 1997. Airborne microflora in poultry slaughtering establishments. Food Microbiol. 14:527-531.
Enomoto, Y., K. Ito, Y. Kawagoe, Y. Morio, and Y. Yamasaki. 1986. Positive inotropic
action of saponins on isolated atrial and papillary muscles from the guinea pig. Br. J. Pharm. 88:259–267.
Fairchild, R. M., P. R. Ellis, A. J. Byrne, S. D. Luzio, and M. A. Mir. 1996. A new
breakfast cereal containing guar gum reduces postprandial plasma glucose and insulin concentrations in normal weight human subjects. Br. J. Nutr. 76:63-73.
Favier, M. L., P. E. Bost, C. Demigne, and C. Remesy. 1998. The cholesterol-lowering
effect of guar gum in rats is not accompanied by an interruption of bile acid cycling. Lipids 33:765-771.
Favier, M. L., P. E. Bost, C. Guittard, C. Demigne, and C. Remesy. 1997. The
cholesterol-lowering effect of guar gum is not the result of a simple diversion of bile acids toward fecal excretion. Lipids 32:953-959.
Feng, P. 1992. Commercial assay systems for the detecting food-borne Salmonella: A
review. J. Food Prot. 55:927-934. Feng, P., S. Weagant, and M. Grant. 2002. Enumeration of Escherichia coli and the
Coliform Bcteria. In Bacteriological Analytical Manual (8th ed.). Available online at http://www.cfsan.fda.gov/~ebam/bam-4.html.
Fenwick, D. E., and D. Oakenfull. 1981. Saponins content of soya beans and some
commercial soya bean products. J. Sci. Food Agric. 32:273-278. Fenwick, D. E., and D. Oakenfull. 1983. Saponin content of food plants and some
prepared foods. J. Sci. Food Agric. 34:198-191. Fenwick, G. R., K. R. Price, C. Tsukamoto, and K. Okubo. 1991. Saponins. Pages 285-
327 in Toxic Substances in Crop Plants. J. P. F. D’Mello, C. M. Duffus, and J. H. Duffus, eds. The Royal Soc. Chem., Camb., UK.
Fenwick, G. R., K. R. Price, C. Tsukamoto, and K. Okubo. 1992. Saponins. Pages 285-
327 in Toxic Substances in Crop Plants. J. P. F. D’Mello, C. M. Duffus, and J. H. Duffus, eds. The Royal Soc. Chem., London, UK.
Ficken, M. D. 1991. Necrotic enteritis. Pages 264–267 in Diseases of Poultry. 9th ed. B.
W. Calnek, J. J. Barnes, C. W. Beard, W. M. Reid, and H. W. Yoder, Jr., eds. Iowa State Univ. Press, Ames, IA.

147
Ficken, M. D., and D. P. Wages. 1997. Necrotic enteritis. Pages 261–264 in Diseases of Poultry. B. W. Calnek, ed. Iowa State Univ. Press, Ames, IA.
Flaoyen, A., A. L. Wilkins, D. Deng, and T. Brekke. 2001. Ovine metabolism of
saponins: Evaluation of a method for estimating the ovine uptake of steroidal saponins from Narthecium ossifragum. Vet. Res. Comm. 25:225–238.
Foley, S. L., A. M. Lynne, and R. Nayak. 2007. Salmonella challenge: prevalence in
swine and poultry and potential pathogenicity of such isolates. Available online at http://jas.fass.org/cgi/reprint/jas.2007-0464v1.
Forhne, D. 1999. Plant intoxicants. Is there a risk from herbal preparation? J.
Phytotherap. 20:201-202. Frame, D. D., and A. A. Bickford. 1986. An outbreak of coccidiosis and necrotic
enteritis in 16-week-old cage-reared layer replacement pullets. Avian Dis. 30:601–602.
Francis, G., H. P. S. Makkar, and K. Becker. 2001a. Antinutritional factors present in
plant-derived alternate fish feed ingredients and their effects in fish. Aquaculture 199:197–227.
Francis, G., H. P. S. Makkar, and K. Becker. 2001b. Effects of quillaja saponins on
growth, metabolism, egg production, and muscle cholesterol in individually reared Nile tilapia (Oreochromis niloticus). Comp. Biochem. Physiol. 129C:105–114.
Francis, G., H. P. S. Makkar, and K. Becker. 2002a. Dietary supplementation with a
quillaja saponin mixture improves growth performance and metabolic efficiency in common carp (Cyprinus carpio L.). Aquaculture 203:311–320.
Francis, G., H. P. S. Makkar, and K. Becker. 2002b. Effects of cyclic and regular feeding
of quillaja saponin supplemented diet on growth and metabolism of common carp (Cyprinus carpio L). Fish Physiol. Biochem. 24:343–350.
Freeland, W. J., P. H. Calcott, and D. P. Geiss. 1985. Allelochemicals, minerals and
herbivore population size. Biochem. Systematic Ecol. 13:195-206. Frenzen, P. D., A. Drake, F. J. Angulo, and Emerging Infections Program Food Net
Working Group. 2005. Economic cost of illness due to Escherichia coli o157 Infectios in the United States. J. Food Prot. 68:2623-2630.

148
Friedman, M. S, T. Roels, J. E. Koehler, L. Feldman, W. F. Bibb, and P. Blake. 1999. Escherichia coli O157:H7 outbreak associated with an improperly chlorinated swimming pool. Clin. Infect. Dis. 29:298-303.
Fukuda, K., H. Utsumi, J. Shoji, and A. Hamada. 1985. Saponins can cause the
agglutination of phospholipid vesicles. Biochim. Acta 820:199–206. Furth, R. V., and H. F. Guiot. 1989. Modulation of the host flora. Eur. J. Clin. Microbiol.
8:1-7. Gagliardo, R., A. M. Vignola, and M. Mathieu. 2001. Is there a role for glucocorticoid
receptor beta in asthma? Respiratory Res. 2:1–4. Gan, H., and S. Chen. 1982. Qualitative and quantitative comparison between root and
stem and leaves of Bupleurum Chinese. Zhongyao Tcngbao 7:7-8 (Chem. Abstr., 97, 60875).
Garau, J., M. Xercavins, M. Rodriguez-Carballeira, J. R. Gomez-Vera, I. Coll, and D.
Vidal. 1999. Emergence and dissemination of quinolone-resistant Escherichia coli in the community. Antimicrob Agents Chemother. 43:2736–2741.
Gast, R. K. 1997. Paratyphoid infection. Pages 97-129 in Diseases of Poultry. W. B.
Calnek, H. J. Barnes, C. W. Beard, L. R. McDougald, and Y. M. Saif, eds. Iowa State University Press, Ames, IA, USA.
Gaunt, I. F., P. Grasso, and S. D. Gangolli. 1974. Short-term toxicity of quillaia extract
in rats. Food Cosmet. Toxicol. 12:641-650. Gazdzinski, P., and R. J. Julian. 1992. Necrotic enteritis in turkeys. Avian Dis. 36:792-
798. Gee, J. M., and I. T. Johnson. 1988. Interactions between hemolytic saponins, bile salts
and small intestinal mucosa in the rat. J. Nutr. 118:1391–1397. Gee, J. M., K. R. Price, I. T. Johnson, and M. J. Rhodes. 1998. The relationship between
saponin structure and bioactivity – a preliminary study. Pages 8-14 in Cost 98. Effects of Antinutrients on The Nutritional Value of Legume Diets. S. Bardocz, and A. Pusztai, eds. European Commission, Luxemburg.
Gee, J. M., K. R. Price, C. L. Ridout, I. T. Johnson, and G. R. Fenwick. 1989. Effects of
some purified saponins on transmural potential difference in mammalian small intestine. Toxicol. In vitro 3:85–90.

149
Gee, J. M., K. R. Price, G. L. Ridout, G. M. Wortley, R. F. Hurrell, and I. T. Johnson. 1993. Saponins of quinoa (Chenopodium quinoa): Effects of processing on their abundance in quinoa products and their biological effects on intestinal mucosal tissue. J. Sci. Food Agric. 63:201–209.
Gee, J. M., G. M. Wortley, I. T. Johnson, K. R. Price, A. A. J. J. L. Rutten, G. F.
Houben, and A. H. Penninks. 1996. Effect of saponins and glycoalkaloids on the permeability and viability of mammalian intestinal cells and on the integrity of tissue preparations in vitro. Toxicol. In vitro 10:117–128.
Genigeorgis, C. A. 1989. Present state of knowledge on staphylococcal intoxication. Int.
J. Food Microbiol. 9:365-369. George, A. J. 1965. Legal status and toxicity of saponins. Food Cosmet. Toxicol. 3:85-
91. Geornaras, I., A. Dejesus, E. Vanzyl, and A. von Holy. 1995. Microbiological survey of
a South-African poultry-processing plant. J. Basic Microbiol. 35:73-82. Gestetner, B., Y. Assa, Y. Henis, Y. Birk, and A. Bondi. 1971. Lucerne saponins,
relationship between their chemical constitution, and hemolytic and antifungal activities. J. Sci. Food Agric. 22:168-172.
Gestetner, B., Y. Birk, and Y. Tencer. 1968. Soybean saponins. Fate of ingested
saponins and the physiological aspect of their hemolytic activity. J. Sci. Food Agric. 16:1031-1035.
Glauert, A. M., J. T. Dingle, and J. A. Lucy. 1962. Action of saponin on biological
membranes. Nature 196:953–955. Glynn, M. K., C. Bopp, W. Dewitt, P. Dabney, M. Molktar, and F. J. Angulo. 1998.
Emergence of multidrug-resistant Salmonella enteric serotype typhimurium DT104 infections in the United States. N. Engl. J. Med. 338:1333-1338.
Gogelein, H., and A. Huby. 1984. Interaction of saponin and digitonin with black lipid
membranes and lipid monolayers. Biochim. Biophys. Acta 773:32–38. Goodall, S. R., and P. Braddy, D. Horton, and B. Beckner. 1982. Steam flaked vs. high
moisture content rations with and without sarsasaponin for finishing steers. Proc. West Sec. Am. Soc. Anim. Sci. 33:45-48.
Gordon, M. C., J. N. David. 2001. Natural product drug discovery in the next
millennium. Pharm. Biol. 39:8-17.

150
Groop, P. H., A. Aro, S. Stenman, and L. Groop. 1993. Long-term effects of guar gum in subjects with non-insulin-dependent diabetes-mellitus. Am. J. Clin. Nutr. 58:513-518.
Griffin, P. M., and R. V. Tauxe. 1991. The epidemiology of infections caused by
Escherichia coli O157:H7, other entrohemorragic E. coli, and the associated hemolytic uremic syndrome. Epidemiol. Rev. 13:60-98.
Grunweller, S., and J. Kesselmeier. 1985. Characterization of a membrane-bound β-
glucosidase responsible for activation of oat leaf saponins. Phytochem. 24:1941-1943.
Gupta, K., T. M. Hooton, and W. E. Stamm. 2001. Increasing antimicrobial resistance
and the management of uncomplicated community-acquired urinary tract infections. Ann. Intern. Med. 135:41–50.
Gus-Mayer, S., H. Brunner, H. A. Schneider-Poetsch, and W. Rudiger. 1994.
Avenacosidase from oat: purification, sequence analysis and biochemical characterization of a new member of the BGA family of beta-glucosidases. Plant Mol. Biol. 26:909–921.
Gutierrez, O., C. Zhang, A. L. Cartwright, J. B. Carey, and C. A. Bailey. 2007. Use of
guar by product in high production laying hen diets. Poult. Sci. 86:1115-1120. Hale, W. H., W. C. Sherman, W. M. Reynolds, and H. G. Luther. 1961. The value of
certain steroidal sapogenins in rations of fattening lambs and cattle. Proc. Soc. Exp. Biol. Med. 106:486-489.
Haralampidis, K., M. Trojanowska, and A. E. Osbourn. 2002. Biosynthesis of
triterpenoid saponins in plants. Adv. Biochem. Eng. Biotechnol. 75:31-49. Haridas, V., C. J. Arntzen, and J. U. Gutterman. 2001a. Avicins, a family of triterpenoid
saponins from Acacia victoriae (Bentham), inhibit activation of nuclear factor-kappa B by inhibiting both its nuclear localization and ability to bind DNA. Proc. Nat. Acad. Sci. USA. 98:11557–11562.
Haridas, V., M. Higuchi, G. S. Jayatilake, D. Bailey, K. Mujoo, M. E. Blake, C. J.
Arntzen, and J. U. Gutterman. 2001b. Avicins: Triterpenoid saponins from Acacia victoriae (Bentham) induce apoptosis by mitochondrial perturbation. Proc. Nat. Acad. Sci. USA. 98:5821–5826.
Hashimoto, Y. 1979. Page 268 in Marine Toxins and Other Bioactive Marine
Metabolites. Jpn. Sci. Soc. Press, Bunkyo-Ku, Tokyo.

151
Hassan, S. M., O. Gutierrez, A. U. Haq, J. A. Byrd, C. A. Bailey, and A. L. Cartwright. 2007. Saponin-rich extracts from quillaja, yucca, soybean, and guar differ in antimicrobial and hemolytic activities. Poult. Sci. 86:121. (Abstr.)
Hee, G. U., and W. N. Jae. 2001. Screening of the anticoccidial effects of herb extracts
against Eimeria tenella. Vet. Parasitol. 96:257-263. Helmboldt, C.F., and E. S. Bryant. 1971. The pathology of necrotic enteritis in domestic
fowl. Avian Dis. 15:775–780. Hentges, D. 1992. Gut flora and disease resistance. Pages 87-107 in Probiotics: The
Scientific Basis. R. Fuller, ed. Chapman and Hall, NY. Heyman, D. 2004. Control of Communicable Diseases Manual. 18th ed. American
Public Health Association, Washington, DC. Hiai, S., Y. Sasayama, and C. Oguro. 1987. Chronic effects of ginseng saponin,
glycyrrhizin and flavin adenine dinucleotide on adrenal and thymus weight in normal and dexamethasone-treated rats. Chem. Pharm. Bull. 35:241-248.
Hiai, S., and H. Yokoyama. 1986. Chronic effect of saikosaponin on adrenal and thymus
growth in normal and dexamethasone-treated rats. Chem. Pharm. Bull. 34:1195-1202.
Higgins, J. P. S., E. Higgins, K. L. Guenther, W. Huff, A. M. Donoghue, D. J.
Donoghue, and B. M. Hargis. 2005a. Use of a specific bacteriophage treatment to reduce Salmonella in poultry products, Poult. Sci. 84:1141-1145.
Higgins, J. P., S. E. Higgins, V. Salvador, A. D. Wolfenden, G. Tellez, and B. M.
Hargis. 2007. Temporal effects of lactic acid bacteria probiotic culture on Salmonella in neonatal broilers. Poult. Sci. 86:1662-1666.
Higgins, S. E., A. Torres-Rodriguez, J. L. Vicente, C. D. Sartor, C. M. Pixley, G. M.
Nava, G. Tellez, J. T. Barton, and B. M. Hargis. 2005b. Evaluation of intervention strategies for idiopathic diarrhea in commercial turkey brooding houses. J. Appl. Poult. Res. 14:345-348.
Higuchi, R., Y. Tokimitsu, T. Fujioka, T. Komori, T. Kawasaki, and D. G. Oakenful.
1987. Structure of desacylsaponins obtained from the bark of Quillaja saponiaria. Phytochem. 26:229-235.
Higuchi, R., Y. Tokimitsu, and T. Komori. 1988. An acylated triterpenoid saponin from
Quillaja saponaria. Phytochem. 27:1165-1168.

152
Hofacre, C. L., R. Froyman, B. Gautrias, B. George, M. A. Goodwin, and J. Brown. 1998. Use of aviguard and other intestinal bioproducts in experimental Clostridium perfringens associated necrotizing enteritis in broiler chickens. Avian Dis. 42:579-584.
Holmberg, S. D., S. L. Solomon, and P. A. Blake. 1987. Health and economic impacts of
antimicrobial resistance. Rev. Infec. Dis. 9:1065-1078. Hostettmann, K., M. Hostettman, and A. Marston. 1991. Saponins. Pages 433-471 in
Methods in Plant Biochemistry. B.V. Charlwood, and D. V. Banthorpe, eds. Acad. Press, London, UK.
Hostettmann, K., and A. Marston. 1995. Triterpene saponin-pharmacological and
biological. Pages 232-286 in Saponins: Chemistry and Pharmacology of Natural Product. Camb. Univ. Press, UK, NY.
Hu, J., S. O. Lee, S. Hendrich, and P. A. Murphy. 2002. Quantification of the group B
soyasaponins by high-performance liquid chromatography. J. Agric. Food Chem. 50:2587–2594.
Hu, M., K. Konoki, and K. Tachibana. 1996. Cholesterol-independent membrane
disruption caused by triterpenoid saponins. Biochim. Biophys. Acta Lipid Metabolism 1299:252–258.
Hussain, I., and P. R. Cheeke. 1995. Effect of Yucca scidigera extract on rumen and
blood profiles of steers fed concentrate- or roughage-based diets. Anim. Feed Sci. Tech. 51:231–242.
Huys, G., M. Cnockaert, A. Nemec, L. Dijkshoorn, S. Brisse, M. Vaneechoutte, and J.
Swings. 2005a. Reptitive-DNA-element PCR fingerprinting and antibiotic resistance of pan-European multi-resistant Acinetobacter baumannii clone III strains. J. Med. Microbiol. 54:851-854.
Huys, G., K. D'Haene, J. V. Eldere, A. Holy, and J. Swings. 2005b. Molecular diversity
and characterization of tetracycline-resistant Staphylococcus aureus isolates from a poultry processing plant. Appl. Environ. Microbiol. 71:574-579
Ireland, P. A., S. Z. Dziedzic, and M. W. Kearsley. 1986. Saponin content of soya and
some commercial soya products by means of high-performance liquid chromatography of the sapogenins. J. Sci. Food Agric. 37:694-698.
Ishaaya, I., Y. Birk, A. Bondi, and Y. Tencer. 1969. Soybean saponins. IX. Studies of
their effect on birds, mammals and cold-blooded organisms. J. Sci. Food Agric. 20:433-436.

153
Jackson, H. D., and R. A. Shaw. 1959. Chemical and biological properties of a respiratory inhibitor from alfalfa saponins. Arch. Biochem. Biophys. 84:411-416.
Jenkins, K. J., and A. S. Atwal. 1994. Effects of dietary saponins on fecal bile acids and
neutral sterols, and availability of vitamins A and E in the chick. J. Nutr. Biochem. 5:134–138.
Jensen, B. B. 1998. The impact of feed additives on the microbial ecology of the gut in
young pigs. J. Anim. Feed Sci. 7:45-64. Jigna, P., K. Nehal, and C. Sumitra. 2006. Evaluation of antibacterial activity and
phytochemical analysis of Bauhinia variegata L. bark. African J. Biomed. Res. 9:53-56.
Johansson, K. R., and W. B. Sarles. 1948. Bacterial population changes in the ceca of
young chickens infected with Eimeria tenella. J. Bacteriol. 56:635–647. Johnson, I. T., J. M. Gee, K. Price, C. Curl, and G. R. Fenwick. 1986. Influence of
saponins on gut permeability and active nutrient transport in vitro. J. Nutr. 116: 2270–2277.
Johnson, D. C., and C. Pinedo. 1971. Gizzard erosion and ulceration in Peru broilers.
Avian Dis. 15:835–837. Johnson, J., and W. M. Reid. 1970. Anticoccidial drugs: Lesion scoring techniques in
battery and floor-pen experiments with chickens. Exp. Parasitol. 28:30-36. Johnson, J. R., P. Delavari, T. T. O'Bryan, K. Smith, and S. Tatini. 2005a.
Contamination of retail foods, particularly turkey, from community markets (Minnesota, 1999–2000) with antimicrobial-resistant and extraintestinal pathogenic Escherichia coli. Food-borne Pathog. Dis. 2:38–49.
Johnson, J. R., A. C. Murray, A. Gajewski, M. Sullivan, P. Snippes, and M. A.
Kuskowski. 2003. Isolation and molecular characterization of nalidixic acid-resistant extraintestinal pathogenic Escherichia coli from retail chicken products. Antimicrob Agents Chemother. 47:2161–2168.
Johnson, J. R., M. A. Kuskowski, K. Smith, T. T. O'Bryan, and S. Tatini. 2005b.
Antimicrobial-resistant and extraintestinal pathogenic Escherichia coli in retail foods. J. Infect. Dis. 191:1040–1049.
Johnson, J. R., M. A. Kuskowski, M. Menard, A. Gajewski, M. Xercavins, and J. Garau.
2006. Similarity of human and chicken-source Escherichia coli isolates in relation to ciprofloxacin resistance status. J. Infect. Dis. 94:71–78.
154
Johnston, N. L., C. L. Quarles, and D. J. Fagerberg. 1980. Evaluation of DSS40 yucca saponin on broiler performance. Poult. Sci. 59:1625. (Abstr.)
Johnston, N. L., C. L. Quarles, and D. J. Fagerberg. 1982. Broiler performance with
DSS40 yucca saponin in combination with monensin. Poult. Sci. 61:1052–1054. Johnston, N. L., C. L. Quartes, D. J. Fagerberg, and D. D. Carveny. 1981. Evaluation of
yucca saponin on broiler performance and ammonia suppression. Poult. Sci. 60:2289-2299.
Jones, T. F., and W. Schaffner. 2005. New perspectives on the persistent scourge of
food-borne disease. J. Infect. Dis. 191:1029–1031. Joos, P., and R. Ruyssen. 1967. Spread mixed monolayer of senegin and seneginin with
cholesterol at the air-water interface. Bull. Soc. Chem. Beiges 76:308-315. Jordan, F. T. W., and M. Pattison. 1996. Pages 66-69 in Poultry Diseases, 4th ed.
Saunders, London. Julien, J., M. Gasquet, C. Maillard, G. Balansard, and P. Timon-David. 1985. Extracts of
the ivy plant, Hedera helix, and their anthelmintic activity on liver fluke. Planta Med. 50:205-208.
Jurzysta, M. 1982. Page 170 in Investigation of Saponins in Native Lucerne Populations
(Medicago media Pers.). IUNG, Pulawy. Poland. Kaldhusdal, M., and M. Hofshagen. 1992. Barley inclusion and avoparcin inclusion in
broiler diets. 2. Clinical, pathological and bacteriological findings in a mild form of necrotic enteritis. Poult. Sci. 71:1145-1153.
Kaldhusdal, M., and H. Lovland. 2000. The economical impact of Clostridium
perfringens is greater than anticipated. World’s Poult. J. 16:50-51. Kaldhusdal, M., and E. Skjerve. 1996. Association between cereal contents in the diet
and incidence of necrotic enteritis in broiler chickens in Norway. Prev. Vet. Med. 28:1-16.
Kamel, M. S., K. Ohtani, and T. Kurokawa. 1991. Studies on Balanites aegyptiaca
fruits, an antidiabetic Egyptian folk medicine. Chem. Pharm. Bull. 39:1229-1233. Kamran, M., T. N. Pasha, A. Mahmud, and Z. Ali. 2002. Effect of commercial enzyme
(Natugrain) supplementation on the nutritive value and inclusion rate of guar meal in broiler rations. Int. J. Poult. Sci. 1:167-173.

155
Kandler, O., and N. Weiss. 1986. Regular nonsporing gram-positive rods. Pages 1208-1234 in Bergey’s Manual of Systematic Bacteriology. H. A. Sheath, N. S. Mair, M. E. Sharpe, J. G. Holt, eds. Williams and Wilkins, Baltmore, MD.
Kaneda, N., H. Nakanishi, and J. Staba. 1987. Steroidal constituents of Yucca schidigera
plants and tissue cultures. Phytochem. 26:1425-1429. Kang, B. N., and I. S. Koh. 1974. Effect of saponin on sodium-potassium activated
ATPase in rabbit red cell membrane. Taehan Saengri Hakhoe. Chi. 8:67-76 (Chem. Abstr., 82, 697555).
Kasai, R., and K. Yamasaki. 2000. Antiyeast steroidal saponins from Yucca schidigera
(Mohave yucca), a new anti-food-deteriorating agent. J. Natural Prod. 63:332–338.
Kataria, A., B. M. Chauhan, and D. Punia. 1989. Antinutrients in amphidiploids (black
gram x mung bean): Varietals differences and effect of domestic processing and cooking. Plant Foods Hum. Nutr. 29:257-266.
Katoch, B. S., J. S. Chawla, and A. Rekib. 1971. Absorption of amino acid (in vitro)
through intestinal wall of chicken in presence of guar gum. Ind. Vet. J. 4:142-146.
Keen, J., T. E. Wittum, J. R. Dunn, J. L. Bono, and M. E. Fontenot. 2003. Page 22 in
Occurrence of STEC O157, O111, and O26 in Livestock at Agricultural Fairs in the United States. Proc. 5th Int. Symp. on Shiga Toxin (Verocytotoxin)-Producing Escherichia coli Infections, Edinburgh, UK.
Kesselmeier, J., and D. Strack. 1981. High performance liquid chromatographic analysis
of steroidal saponins from Avena sativa L., Z. Naturforsch 36C:1072-1074. Khalil, A. H., and T. A. EI-Adawy. 1994. Isolation, identification and toxicity of saponin
from different legumes. Food Chem. 50:197-201. Khatachatourians, G. G. 1998. Agricultural use of antibiotics and the evolution and
transfer of antibiotic-resistant bacteria. Canad. Med. Assoc. J. 159:1129-1136. Killeen, G. F., C. A. Madigan, C. R. Connolly, G. A. Walsh, C. Clark, M. J. Hynes, B. F.
Timmins, P. James, D. R. Headon, and R. F. Power. 1998. Antimicrobial saponins of Yucca Schidigera and the implications of their in vitro properties for their in vivo impact. J. Agric. Food Chem. 46:3178–3186.

156
Kim, Y. R., S. Y. Lee, B. A. Shin, and K. M. Kim. 1999. Panax ginseng blocks morphine-induced thymic apoptosis by lowering plasma corticosterone level. General Pharmacol. 32:647–652.
Kimata, H., T. Nakashima, and S. Kokubun. 1983. Saponins of pericarps of Sapindus
mukurossi Gaertn and solubilization of monodesmosides by bis-desmosides. Chem. Pharm. Bull. 31:1998-2005.
Kitai, S., A. Shimizu, J. Kawano, E. Sato, C. Nakano, H. Kitagawa, K. Fujio, K.
Matsumura, R. Yasuda, and T. Inamoto. 2005. Prevalence and characterization of Staphylococcus aureus and enterotoxigenic Staphylococcus aureus in retail raw chicken meat throughout Japan. J. Vet. Med. Sci. 67:269-274.
Klita, P. T., G. W. Mathison, T. W. Fenton, and R. T. Hardin. 1996. Effects of alfalfa
root saponins on digestive function in sheep. J. Anim. Sci. 74:1144-1156. Kluytmans, J., A. Van Belkum, and H. Verburgh. 1997. Nasal carriage of
Staphylococcus aureus: epidemiology, underlying mechanisms, underlying mechanisms and associated risks. Clin. Microbiol. Rev. 10:505–520.
Kocher, A., M. Choct, G. Ross, J. Broz, and T. K. Chung. 2003. Effects of enzyme
cominations on apparent metabolizable energy of corn-soybean meal-based diets in broilers. J. Appl. Poult. Res. 12:275-283.
Komnenov, V., M. Vehlner, and M. Katrinka. 1981. Importance of feed in the
occurrence of clostridial infections in poultry. Vet. Glas. 35:245–249. Kramer, J., A. H. Visscher, J. A. Wagenaar, A. G. Boonstra-Blom, and S. H. M.
Jeurissen. 2001. Characterization of the innate and adaptive immunity to Salmonella enteritidis PT1 infection in four broiler lines. Vet. Immunol. Immunopathol. 79:219-233.
Kuduo, S., M. Tonomura, and C. Tsukamoto. 1993. Isolation and structure elucidation of
DDMP-conjugated soyasaponins as genuine saponins from soybean seeds. Biosci. Biotech. Biochem. 57:546-550.
Kuduo, S., M. Tonomura, C. Tsukamoto, M. Shimoyamada, T. Uchida, and K. Okubo.
1992. Isolation and structural elucidation of the major genuine soybean saponin. Biosci. Biotechnol. Biochem. 56:142-143.
Kuete, V., J. G. Tangmouo, V. Penlap Beng, F. N. Ngounou, and D. J. Lontsi. 2006.
Antimicrobial activity of the methanolic extract from the stem bark of Tridesmostemon omphalocarpoides (Sapotaceae). J. Ethnopharmacol. 8:5-11.
157
Kusters, J. G., G. A. W. M. Mulders-Kremers, C. E. M. van Doornik, and B. A. M. Van der Zeijst. 1993. Effects of multiplicity of infections, bacterial protein synthesis, and growth phase on adhesion to and invasion of human cell lines by Salmonella Typhimurium. Infect. Immun. 61:5013-5020.
Kuznetzova, T. A., M. M. Anisimov, and A. M. Popov. 1982. A comparative study in
vitro of physiological activity of triterpene glycosides of marine invertebrates of echinoderm type. Comp. Biochem. Physiol. 73C:41–43.
Lalitha, T, S. Vishwanatha, and L. V. Venkataraman. 1990. Oral toxicity of Madhuca
butyracea Macb. saponins to albino rats. Ind. J. Exp. Biol. 28:642-647. Laurence, V., G. Pauline, F. Clément, T. Odile, L. Marc, and L. Catherine. 2005.
Hemolytic acylated triterpenoid saponins from Harpullia austro caledonica. Phytochem. 66:825-835.
Le Loir, Y., F. Baron, and M. Gautier. 2003. Staphylococcus aureus and food poisoning.
Genet. Mol. Res. 2:63-76. Lee, J. T., C. A. Bailey, and A. L. Cartwright. 2003a. Guar meal germ and hull fractions
differently affect growth performance and intestinal viscosity of broiler chickens. Poult. Sci. 82:1589-1595.
Lee, J. T., C. A. Bailey, and A. L. Cartwright. 2003b. Beta-mannanase ameliorates
viscosity-associated depression of growth in broiler chickens fed guar germ and hull fractions. Poult. Sci. 82:1925-1931.
Lee, J. T., S. Connor-Appleton, C. A. Bailey, and A. L. Cartwright. 2005. Effects of guar
meal by-product with and without beta-mannanase Hemicell® on broiler performance. Poult. Sci. 84:1261-1267.
Lee, J. T., S. Connor-Appleton, A. U. Haq, C. A. Bailey, and A. L. Cartwright. 2004.
Quantitative measurement of negligible trypsin inhibitor activity and nutrient analysis of guar meal fractions. J. Agric. Food Chem. 20:6492-56495.
Lee, K. T., I. C. Sohn, H. J. Park, D. W. Kim, and G. O. Jung. 2000. Essential moiety for
antimutagenic and cytotoxic activity of hederagenin monodesmosides and bisdesmosides isolated from the stem bark of Kalopanax pictus. Planta Med. 66:329–332.
Lee, Y. K., and S. Salminen. 1995. The coming of age of probiotics. Trends Food Sci.
Technol. 6:241-245.

158
Lei, W., Q. Shi, and S. Yu. 1984. Analgesic and CNS inhibitory effects of total saponins from the leaves of Panax notoginseng. Zhonagao Tongbao 9:134-137 (Chem. Abstr., 101, 103905).
Lemma, A. 1965. A preliminary report on the molluscicidal property of endod
(Phytolacca dodecandra). Ethiopian Med. J. 3:187. Levy, M., U. Zehavi, M. Naim, and I. Polacheck. 1989. Isolation, structure
determination and antifungal activity of a new native alfalfa root saponin. Carbohydr. Res. 193:115-123.
Levy, S. B. 1998. The challenge of antibiotic resistance. Sci. Am. 88:46-53. Levy, S. B., J. P. Burke, and C. K. Wallace. 1987. Antibiotic use and antibiotic
resistance world-wide. Rev. Infect. Dis. 9:S231-S316. Lindahl, I. L., R. E. Davis, and R. T. Tertell. 1957. Production of bloat and other
symptoms in intact sheep by alfalfa saponins administration. USDA Tech. Bull. 1161:2-15.
Linton, A. H. 1977. Animal to man transmission of Enterobacteriaceae. R. Soc. Health
J. 97:115–118. Liu, W. K., S. X. Xu, and C. T. Che. 2000. Anti-proliferative effect of ginseng saponins
on human prostate cancer cell line. Life Sci. 67:1297–1306. Livermore, D. M. 2000. Epidemiology of antibiotic resistance. Int. Care Med. 26:514-
521. Livingston, A. L., L. C. Whitehand, and G. O. Kohler. 1977. Microbiological assay for
saponin in alfalfa products. J. A.O.A.C. 60:957-960. Long, J. R. 1973. Necrotic enteritis in broiler chickens. I. A review of the literature and
the prevalence of the disease in Ontario. Can. J. Comp. Med. 37:302–308. Long, P. L. 1982. The Biology of the Coccidia. Univ. Park Press, Baltimore. Lovland, A., and M. Kaldhusdal. 1999. Liver lesions seen at slaughter as an indicator of
necrotic enteritis in broiler flocks. FEMS Microbiol. Med. Microbiol. 24:345–351.
Lovland, A., and M. Kaldhusdal. 2001. Severely impaired production performance in broiler flocks with high incidence of Clostridium perfringens associated hepatitis. Avian Pathol. 30:73-81.

159
Lovland, A., M. Kaldhusdal, K. Redhead, E. Skjerve, and A. Lillehaug. 2004. Maternal vaccination against subclinical necrotic enteritis in broilers. Avian Pathol. 33: 83–92.
Low, J. C., M. Angus, G. Hopkins, D. Munro, and S. C. Rankin. 1997. Antimicrobial
resistance of Salmonella enteric typhimurium DT104 isolates and investigation of strains with transferable apramycin resistance. Epidemiol. Infect. 118:97-103.
Lower, E. S. 1984. Activity of the saponins. Drug Cosmet. Ind. 135:39-44. Lu, C. D., and N. A. Jorgensen. 1987. Alfalfa saponins affect site and extent of nutrient
digestion in ruminants, J. Nutr. 117:919-927. Lu, C. D., L. S. Tsai, D. M. Schafer, and N. A. Jorgensen. 1987. Alteration of
fermentation in continous culture of mixed rumen bacteria by isolated alfalfa saponins. J. Dairy Sci. 70:799-805.
Lyon, B. R., and R. Skurray. 1987. Antimicrobial resistance of Staphylococcus aureus:
genetic basis. Microbial. Rev. 51:88-134. Lyons, P. 1989. Ammonia Control in Confinement Units. Pages 34-38 in The Feed
Compounder. Ma, L. Y., and P. G. Xiao. 1998. Effects of Panax notoginseng saponins on platelet
aggregation in rats with middle cerebral artery occlusion or in vitro and on lipid fluidity of platelet membrane. Phytother. Res. 12:138–140.
Ma, Y. X., H. Z. Fu, M. Li, W. Sun, B. Xu, and J. R. Cui. 2007. An anticancer effect of a
new saponin component from Gymnocladus chinensis Baillon through inactivation of nuclear factor-kappa B. Anticancer Drugs 18:41-46.
Mader, T. L., and M. C. Brumm. 1987. Effect of feeding sarsaponin in cattle and swine
diets. J. Anim. Sci. 65:9-15. Mahato, S. B., A. N. Ganguly, and N. P. Sahu. 1982. Review. Steroid saponins.
Photochem. 21:959-978. Mahato, S. B., and A. K. Nandy. 1991. Triterpenoid saponins discovered between 1987
and 1989. Phytochem. 30:1357-1390. Mahato, S. B., S. K. Sudip, and G. Poddar. 1988. Review article number 38:
Triterpenoid saponins. Phytochem. 27:3037-3067.

160
Maier, H., M. Anderson, C. Karl, K. Magnuson, and R. L. Whistler. 1993. Guar, locust bean, tara and fenugreek gums. Pages 81–1221 in Industrial Gums: Polysaccharides and Their Derivatives. R. L. Whistler, and J. N. BeMiller, eds. Acad. Press, London, UK.
Makkar, H. P. S., and K. Becker. 1996. Effect of quillaja saponins on in vitro rumen
fermentation. Pages 387-394 in Saponins Used in Food and Agriculture. G. R. Waller, and K. Yamasaki, eds. Plenum Press, NY.
Malinow, M. R. 1984. Saponins and cholesterol metabolism. Atherosclerosis 50:117-
119. Malinow, M. R., P. McLaughlin, G. O. Kohler, and A. L. Livingston. 1977. Prevention
of elevated cholesterolemia in monkeys by alfalfa saponin. Steroids 29:105-110. Mandal, P., S. P. Sinha Babu, and N. C. Mandal. 2005. Antimicrobial activity of
saponins from Acacia auriculiformis. Fitoterapia 76:462-465. Marston, A, J. L. Wolfender, and K. Hostettmann. 2000. Analysis and isolation of
saponins from plant material. Pages 1-12 in Saponins in Food, Feedstuffs and Medicinal Plants. Ann. Proc. Phytochem. Soc. W. Oleszek, and A. Marston, eds. Clarendon Press, Oxford and London, UK.
Mason, T. G., and G. Richardson. 1981. A review of Escherichia coli and the human
gut: Some ecological considerations. J. Appl. Bacteriol. 1:1-16. Massiot, G., C. Lavaud, M. Benkaled, and L. Le Men- Olivier. 1992. Soyasaponin VI, a
new matol conjugate from alfalfa and soybean. J. Nat. Prod. 55:1339-1342. Massiot, G., C. Lavaud, V. Besson, L. Le Men-Olivier, and G. Van Binst. 1991.
Saponins from aerial alfalfa (Medicago sativa). J. Agric. Food Chem. 39:78-82. Massiot, G., C. Lavaud, D. Guillaume, and L. Men-Olivier. 1988. Reinvestigation of the
sapogenins and prosapogenins from alfalfa (Medicago sativa). J. Agric. Food Chem. 36:902-909.
Matsuda, H., Y. H. Li, T. Murakami, J. Yamahara, and M. Yoshikawa. 1999a.
Structure-related inhibitory activity of oleanolic acid glycosides on gastric emptying in mice. Bioorganic Med. Chem. 7:323–327.
Matsuda, H, Y. Li, J. Yamahara, and M. Yoshikawa. 1999b. Inhibition of gastric
emptying by triterpene saponin, momordin Ic, in mice: Roles of blood glucose, capsaicin-sensitive sensory nerves, and central nervous system. J. Pharmacol. Exp. Therapeutics 289:729–734.

161
Matsuda, H., K. Murakami, K. Ninomiya, J. Yamahara, and M. Yoshikawa. 1997. Effects of escins 1a, 1b, 11a, and 11b from horse chestnut, the seeds of Aesculus hippocastanum L, on acute inflammation in animals. Chem. Pharm. Bull. 20:1092–1095.
McDonel, J. L. 1986. Toxins of Clostridium perfringens types A, B, C, D and E. Pages
477-517 in Pharmacology of Bacterial Toxins. F. Dorner, and J. Drews, eds. Pergamon Press, Oxford, UK.
McNamee, P. T., J. J. McCullagh, B. H. Thorp, H. J. Ball, D. Graham, S. J. McCullagh,
D. McConaghy, and J. A. Smyth. 1998. Study of leg weakness in two commercial broiler flocks. Vet. Rec. 143:131–135.
McManus, O. B., G. H. Harris, and K. M. Giangiacombo. 1993. An activator of calcium-
dependent potassium channels isolated from a medicinal herb. Biochem. 32:6128–6133.
McReynolds, J. L., J. A. Byrd, R. C. Anderson, R. W. Moore, T. S. Edrington, K. J.
Genovese, T. L. Poole, L. F. Kubena, and D. J. Nisbet. 2004. Evaluation of immunosuppressants and dietary mechanisms in an experimental disease model for necrotic enteritis. Poult. Sci. 83:1948-1952.
Mead, G. C., and C. E. R. Dodd. 1990. Incidence, origin and significance of
Staphylococci on processed poultry. J. Appl. Bacteriol. Symp. Suppl. 19:81S-91S.
Mead, G. C., C. Gibson, and D. B. Tinker. 1995. A model system for the study of
microbial colonization in poultry defeathering machines. Lett. Appl. Microbiol. 20:134-136.
Mead, P. S., L. Slutsker, V. Dietz, L. F. McCaig, J. S. Bresee, C. Shapiro, P. M. Griffin,
and R. V. Tauxe. 1999. Food-related illness and death in the United States. Emerg. Infect. Dis. 5:607-625.
Menin, L., M. Panchichkina, C. Keriel, J. Olivares, U. Braun, E. K. Seppert, and V. A.
Saks. 2001. Macrocompartmentation of total creatine in cardiomyocytes revisited. Mol. Cell. Biochem. 220:149–159.
Menzies, G. S., K. Howland, M. T. Rae, and T. A. Bramley. 1999. Stimulation of
specific binding of [3H]-progesterone to bovine luteal cell-surface membranes: Specificity of digitonin. Mol. Cell. Endocrinol. 153:57–69.

162
Miwa, N., T. Nishina, S. Kubo, and H. Honda. 1997. Most probable numbers of enterotoxigenic Clostridium perfringens in intestinal contents of domestic livestock detected by nested PCR. J. Vet. Med. Sci. 59:557–560.
Mizutani, K. 1994. Biological activities, production, and use of chemical constituents of
licorice. In Food Pytochemical for Cancer Prevention II, ACS Symposium Series 547. C. T. Ho, T. Osawa, M. T. Huang, and R. T. Rosen, eds. Am. Chem. Soc., Washington, D.C.
Moellering, R. C. 1998. Antibiotic resistance: lessons for the future. Clin. Infect. Dis.
27:135-140. Monder, C., P. M. Stewart, V. Lakshmi, R. Valentino, D. Burt, and C. R. W. Edwards.
1989. Licorice inhibits corticosteroid 11bdehydrogenase of rat kidney and liver: In vivo and in vitro studies. Endocrinol. 125:1046–1053.
Moore, R. W., J. A. Byrd, K. D. Knape, R. C. Anderson, T. R. Callaway, T. Edrington,
L. F. Kubena, and D. J. Nisbet. 2006. The Effect of an experimental chlorate product on Salmonella recovery of turkeys when administered prior to feed and water withdrawal. Poult. Sci. 85:2101-2105.
Moriceau, S., C. Besson, M. A. Levrat, C. Moundras, C. Remesy, C. Morand, and C.
Demigne. 2000. Cholesterol-lowering effects of guar gum: Changes in bile acid pools and intestinal reabsorption. Lipids 35:437-444.
Morrissey, J. P., and A. E. Osbourn. 1999. Fungal resistance to plant antibiotics as a
mechanism of pathogenesis. Microbiol. Mol. Biol. Rev. 63:708–724. Mshvildadze, V., A. Favel, F. Delmas, R. Elias, R. Faure, G. Decanosidze, E.
Kemertelidze, and G. Balansard. 2000. Antifungal and antiprotozoal activities of saponins from Hedera colchica. Pharmazie 55:325-326.
Muir, A. D., K. D. Ballantyne, and T. W. Hall. 2000. LC-MS and LC-MS/MS analysis
of saponins and sapogenins–comparison of ionization techniques and their usefulness in compound identification. Pages 35-42 in Saponins in Food, Feedstuffs and Medicinal Plants. W. Oleszek, and A. Marston, eds. Ann. Proc. Phytochem. Soc. Clarendon Press, Oxford, London, UK.
Murakami, T., J. Nakamura, H. Matsuda, and M. Yoshikawa. 1999. Bioactive saponins
and glycosides. XV. Saponin constituents with gastroprotective effect from the seeds of tea plant, Camellia sinensis L var. assamica Pierre, cultivated in Sri Lanka: Structures of assamsaponins A, B, C, D, and E. Chem. Pharm. Bull. 47:1759–1764.

163
Murray, B. E. 1991. New aspects of antimicrobial resistance and the resulting therapeutic dilemmas. J. Infect. Dis.163:1185-1194.
Murry, Jr., A. C., A. Hinton, Jr., and H. Morrison. 2004. Inhibition of growth of
Escherichia coli, Salmonella typhimurium, and Clostridia perfringens on chicken feed media by Lactobacillus salivarius and Lactobacillus plantarum. Int. J. Poult. Sci. 3:603-607.
Muto, Y., K. Takagi, O. Kitagawa, and K. Kumagai. 1987. Triteroenoid saponins as
antiulcer agents. Jpn. Pat. 62 205, 025 (Chem. Abstr., 108, 173547). Myint, M. S. 2004. Epidemiology of salmonella contamination of poultry meat products:
knowledge gaps in the farm to store products. PhD Diss. Virginia-Maryland Reginol College of Veterinary Medicine, College Park, MD.
Nagpal, M. L., O. P. Agrawal, and I. S. Bhatia. 1971. Chemical and biological
examination of guar meal (Cyamopsis tetragonoloba L.). Ind. J. Anim. Sci. 41:283-293.
Nagra, S. S., B. K. Shingari, and J. S. Ichhponani. 1985. Feeding of guar (Cyamopsis
tetragonoloba) meal to poultry. 1. Growth of commercial broiler chicks. Ind. J. Poult. Sci. 20:188-193.
Nagra, S. S., and R. S. Virk. 1986. Growth and laying performance of White Leghorn
pullets fed toasted guar meal alone or in combination with groundnut and mustard cakes as sources of protein. Ind. J. Poult. Sci. 21:16-20.
Nairn, M. E., and V. W. Bamford. 1967. Necrotic enteritis of broiler chickens in western
Austeralia. Aust. Vet. J. 43:49–54. Namba, T., M. Yoshsaki, T. Tomimori, K. Kobashi, K. Mitsui, and J. Hase. 1973.
Hemolytic and protective activity of ginseng saponins. Chem. Pharm. Bull. 21:459–461.
Nawaz, M. S., S. A. Khan, A. A. Khan, F. M. Khambaty, and C. E. Cerniglia. 2000.
Comparative molecular analysis of erythromycin-resistance determinants in staphylococcal isolates of poultry and human origin. Mol. Cell Probes. 14:311-319.
Neidhardt, F. C., J. L. Ingraham, and M. Schaechter. 1990. Physiology of the Bacterial
Cell. Sinauer Associates, Inc., Sunderland, MA. Neu, H. C. 1992a. Quiolone antimicrobial agents. Annu. Rev. Med. 43:465-486.
164
Neu, H. C. 1992b. The crisis in antibiotic resistance. Sci. 257:1064-1073. Newbold, C. J., S. M. El-Hassan, J. Wang, M. E. Ortega, and R. J. Wallace. 1997.
Influence of foliage from African multipurpose trees on activity of rumen protozoa and bacteria. Br. J. Nutr. 78:237–249.
Newman, H. A., F. A. Kummerow, and H. H. Scott. 1958. Dietary saponin, a factor
which may reduce liver and serum cholesterol levels. Poult. Sci. 37:42-46. Ng, K. R., K. R. Price, and G. R. Fenwick. 1994. A TLC method for the analysis of
quinoa (Chenopodium quinoa) saponins. Feed Chem. 49:311-315. Nowacka, J., and W. Oleszek. 1992. High performance liquid chromatography of zanhic
acid glycoside in alfalfa (Medicago sativa). Phytochem. Anal. 3:227-230. Nowacka, J., and W. Oleszek. 1994. Determination of alfalfa (Medicago sativa)
saponins by high-performance liquid chromatography. J. Agric. Food Chem. 42:727-730.
Oakenfull, D. 1981. Saponins in food. Food Chem. 6:19-40. O’Brien, T. F. 1987. Resistance of bacteria to antibacterial agents: Report of Task Force
2. Rev. Infect. Dis. 9:S244-S260. Oda, K., H. Matsuda, T. Murakami, S. Katayama, T. Ohgitani, and M. Yoshikawa. 2000.
Adjuvant and haemolytic activities of 47 saponins derived from medicinal and food plants. Biol. Chem. 381:67–74.
Odenyo, A. A., P. O. Osuji, and O. Karanfil. 1997. Effects of multipurpose tree (MPT)
supplements on ruminant ciliate protozoa. Anim. Feed Sci. Technol. 67:169–180. Okubo, T., N. Ishihara, H. Takahashi, T. Fujisawa, M. J. Kim, T. Yamamoto, and T.
Mitsuoka. 1994. Effects of partially hydrolyzed guar gum intake on human intestinal microflora and its metabolism. Biosci. Biotechnol. Biochem. 58:1364-1369.
Okunji, C. O., C. N. Okeke, H. C. Gugnani, and M. M. Iwu. 1990. An antifungal
spirostanol saponin from fruit pulp of Dracaena mannii. Int. J. Crude Drug Res. 28:193-199.
Oleszek, W. 1988. Solid phase extraction fractionation of alfalfa saponins. J. Sci. Food
Agric. 44:43-49.
165
Oleszek, W. 1996. Alfalfa saponins: Structure, Biological, Activity, and Chemotaxonomy. Pages 155-170 in Saponins Used in Food and Agriculture. G. R. Waller, and K. Yamasaki, eds. Plenum Press, NY.
Oleszek, W., and Z. Bialy. 2006. Chromatographic determination of plant saponins-an
update (2002-2005). J. Chromatogr. 1112:78-91. Oleszek, W., and M. Jurzysta. 1992. New saponins from alfalfa tops. Pages 315-316 in
The Structure and Biological Activity, Proc. X Int. Conf. EUCARPIA Medicago spp. Group.
Oleszek, W., M. Jurzysta, M. Ploszynski, I. J. Colquhoun, K. R. Price, and R. G.
Fenwick. 1992. Zanhic acid tridesmoside and other dominant saponins from alfalfa (Medicago sativa L.) aerial parts. J. Agric. Food Chem. 40:191-196.
Oleszek, W., J. Nowacka, J. M. Gee, G. M. Wortley, and I. T. Johnson. 1994. Effects of
some purified alfalfa (Medicago sativa) saponins on transmural potential difference in mammalian small intestine. J. Sci. Food and Agric. 65:35–39.
Oleszek, W., K. R. Price, I. J. Colquhoun. M. Jurzysta, M. Ploszynski, and R. G.
Fenwick. 1990. Isolation and identification of alfalfa (Medicago sativa) root saponins: Their activity in relation on a fungal bioassay. J. Agric. Food Chem. 38:1810-1817.
Oleszek, W, M. Sitek, A. Stochmal, S. Piacente, C. Pizza, and P. Cheeke. 2001a.
Steroidal saponins of Yucca schidigera Roezl. J. Agric. Food Chem. 49:4392-4396.
Oleszek, W., M. Sitek, A. Stochmal, S. Piacente, C. Pizza, and P. Cheeke. 2001b.
Resveratrol and other phenolics from the bark of Yucca schidigera Roezl. J. Agric. Food Chem. 49:747-752.
Olivier, M., C. M. Veary, T. E. Cloete, and A. von Holy. 1996. Microbiological status of
selected chicken carcasses from a nonautomated poultry processing plant. J. Basic Microbiol. 36:41-49.
Olli, J. J., K. Hjelmeland, and A. Krogdahl. 1994. Soybean trypsin inhibitors in diets for
Atlantic salmon (Salmo salar, L): Effects on nutrient digestibilities and trypsin in pyloric caeca homogenate and intestinal content. Comp. Biochem. Physiol. A Physiol. 109:923-928.
Onning, G., and N. G. Asp. 1995. Effect of oat saponins on plasma and liver lipids in
gerbils and rats. Br. J. Nutr. 73:275-286.

166
Onning, G., N. G. Asp, and B. Sivik. 1993. Saponin content in different oat varieties and in different fractions of oat grain. Food Chem. 48:251-254.
Onning, G., Q. Wang, B. Wesrom, N. G. Asp, and B. W. Karlsson. 1996. Influence of
oat saponins on intestinal permeability in vitro an in vitro in the rat. Br. J. Nutr. 74:141-151.
Osbourn, A. E. 2003. Molecules of interest: Saponins in cereals. Phytochem. 62:1-4. Oshima, Y., T. Ohsawa, K. Oikawa, C. Konno, and H. Hikino. 1984. Structures of
Dianosides A and B, Analgesic Principles of Dianthus superbus var. longicalycinus herbs. Planta Med. 50:40-43.
Ou, S. Y., K. C. Kwok, Y. Li, and L. Fu. 2001. In vitro study of possible role of dietary
fiber in lowering postprandial serum glucose. J. Agric. Food Chem. 49:1026-1029.
Parish, W. E. 1961. Necrotic enteritis in the fowl (Gallus gallus domesticus). I.
Histopathology of the disease and isolation of a strain of Clostridium welchii. J. Comp. Pathol. 71:377–393.
Park, H. J., S. H. Kwon, J. H. Lee, K. H. Lee, K. Miyamoto, and K. T. Lee. 2001.
Kalopanaxsaponin A is a basic saponin structure for the anti-tumor activity of hederagenin monodesmosides. Planta Med. 67:118–121.
Patel, M. B., and J. McGinnis. 1985. The effect of autoclaving and enzyme
supplementation of guar meal on the performance of chicks and laying hens. Poult. Sci. 64:1148-1156.
Patterson, J., and K. Burkholder. 2003. Application of prebiotics and probiotics in
poultry production. Poult. Sci. 82:627-631. Pawar, R., C. Gopalakrishnan, and K. K. Bhutani. 2001. Dammarane triterpene saponin
from Bacopa monniera as the superoxide inhibitor in polymorphonuclear cells. Planta Med. 67:752–754.
Pedersen, M. W. 1975. Relative quantity and biological activity of saponins in
germinated seeds, roots and foliage of alfalfa. Crop Sci. 15:541-543. Petit, L., E. Maier, M. Gibert, M. R. Popoff, and R. Benz. 2001. Clostridium perfringens
epsilon toxin induces a rapid change of cell membrane permeability to ions and forms channels in artificial lipid bilayers. J. Biol. Chem. 276:15736-15740.

167
Petit, P., Y. Sauvaire, D. Hillaire-Buys, O. Leconte, Y. Baissac, G. Ponsin, and G. Ribes. 1995. Steroid saponins from fenugreek seeds: Extraction, purification, and pharmacological investigation on feeding behavior and plasma cholesterol. Steroids 60:674–680.
Petit, P. R., Y. Sauvaire, G. Ponsin, M. Manteghetti, A. Fave, and G. Ribes. 1993.
Effects of a fenugreek seed extract on feeding behaviour in the rat: Metabolic endocrine correlates. Pharmacol. Biochem. Behaviour 45:369–374.
Philips, J. C., K. R. Butterworth, I. F. Gaunt, J. G. Evans, and P. Grasso. 1979. Long –
term toxicity study of quillaja extract in mice. Food cosmet. Toxicol. 17:23-27. Pillion, D. J., J. A. Amsden, C. R. Kensil, and J. Recchia. 1996. Structure-function
relationship among quillaja saponins serving as excipients for nasal and ocular delivery of insulin. J. Pharm. Sci. 85:518–524.
Pitout, J. D., P. Nordmann, K. B. Laupland, and L. Poirel. 2005. Emergence of
Enterobacteriaciae producing extended spectrum β-lactamases (ESBLs) in the community. J. Antimicrob Chemother. 56:52–59.
Plock, A., W. Sokolowska-Kohler, and W. Presber. 2001. Application of flow cytometry
and microscopical methods to characterize the effect of herbal drugs on Leishmania spp. Exp. Parasitol. 97:141–153.
Podgorski, W., and T. Majewski. 2002. Effect of saponins on the intake of water and
feeds by broiler chickens and their body weight gains. Annales Universitatis Mariae Curie-Sklodowska, Sectio E. E. Zootechnica. Wydawnictw Akademii Rolniczej, Lublin, Poland. 20:307-311.
Pogonka, T., C. Klotz, F. Kovacs, and R. Lucius. 2003. A single dose of recombinant
Salmonella Typhimurium induces specific humoral immune responses against heterologous Eimeria tenella antigens in chicken. Int. J. Parasitol. 33:81-88.
Poppe, C., R. J. Irwin, C. M. Forsberg, R. C. Clarke, and J. Oggel. 1991. The prevalence
of Salmonella enteritidis and other Salmonella spp. among Canadian registered commercial layer flocks. Epidemiol. Infect. 106:259-270.
Porter, R. E. 1998. Bacterial enterides of poultry. Poult. Sci. 77:1159-1165. Potter, S. M., R. Jimenez-Flores, J. Pollack, T. A. Lone, and M. D. Berber-Jimenez.
1993. Protein saponin interaction and its influence on blood lipids. J. Agric. Food Chem. 41:1287–1291.

168
Prescott, J. F. 1979. The prevention of experimentally induced necrotic enteritis in chickens by avoparcin. Avian Dis. 23:1072-1074.
Prescott, J. F., R. Sivendra, and D. A. Barnum. 1978. The use of bacitracin in the
prevention and treatment of experimentally-induced necrotic enteritis in the chicken, Can. Vet. J. 19:181–183.
Price, K. R., I. T. Johnson, and G. R. Fenwick. 1987. The chemistry and biological
significance of saponins in foods and feedstuffs. CRC Crit. Rev. Food Sci. Nutr. 26:27-135.
Punnonen, R., and A. Lukola. 1980. Oestrogen-like effect of ginseng. Br. Med. J.
281:1110. Quin, G. W., and R. S. Xu. 1998. Recent advances in bioactive natural products from
Chinese medicinal plants. Med. Res. Rev. 18:375–382. Rahman, M., and M. Shafivr. 1967. Guar meal in dairy cattle rations. PhD Diss. Texas
A&M Univ., College Station, TX. Rakhimov, R. R., N. P. Benetis, A. Lund, J. S. Hwang, A. I. Prokofev, and Y. S.
Lebedev. 1996. Intramolecular and reorientation dynamics of bis (triphenylphosphine)-3, 6-di-tert-butyl-4, 5-dimethoxy-o-semiquinone complex of copper (I) in viscous media. Chem. Phys. Lett. 225:156-162.
Ramakrishnan, C. F. 1957. Amino acid composition of crude and germinated guar seed
flour protein (Cyamopsis psoralioides). Exp. 3:78. Rao, A. V., and M. K. Sung. 1995. Saponins as anticarcinogens. J. Nutr. 125:717–724S. Rediff India Abroad, Sep., 2007. India to develop new guar seed varieties. 2007.
available online at http://www.rediff.com/money/2007/sep/28guar.htm. Riddell, C., and X. Kong. 1992. The influence of diet on necrotic enteritis in broiler
chicks. Avian Dis. 36:499-503. Riguera, R. 1997. Isolating bioactive compounds from marine organisms. J. Marine
Biotechnol. 5:187–193. Riley, L.W., R. S. Remis, S. D. Helgerson, H. B. McGee, J. G. Wells, B. R. Davis, R. J.
Hebert, E. S. Olcott, L. M. Johnson, N. T. Hargrett, P. A. Blake, and M. L. Cohen. 1983. Hemorrhagic colitis associated with a rare Escherichia coli serotype. New England J. Med. 308:681–685.
169
Rood, J. I. 1998. Virulence genes of Clostridium perfringens. Ann. Rev. Microbiol. 52:333-360.
Ross, T. 1999. Necrotic enteritis and associated conditions in broiler chickens. World’s
Poult. J. 15:44-47. Ruales, J., and B. M. Nair. 1993. Saponins, phytic acid, tannins and protease inhibitors
in quinoa (Chenopodium quinoa, Willd) seed. Feed Chem. 48:137-143. Rubin, H. E. 1978. Toxicological model for a two-acid system. Appl. Environ.
Microbial. 36:623-624. Rubin, R. H., and L. Weinstein. 1977. Microbiologic characteristics of the Salmonella.
Pages 1-12 in Salmonellosis. Stratton Intercotinental Medical Book Corporation. NY.
Russo, A., J. E. Stevens, T. Wilson, F. Wells, A. Tonkin, M. Horowitz, and K. L. Jones.
2003. Guar attenuates fall in postprandial blood pressure and slows gastric emptying of oral glucose in type 2 diabetes. Dig. Dis. Sci. 48:1221-1229.
Ryan, K. J., and C. G. Ray. 2004. Pages 376-377 in Sherris Medical Microbiology. 4th
ed., McGraw-Hill, NY, USA. Salmon, D. E, and T. Smith. 1886. The bacterium of swine-plague. Am. Monthly
Microscopical J. 7:204-205.
Samoilov, A. V., and E. S. Girshovich. 1980. Antibiotic properties of the triterpene glycosides from marine animals of the class Holothuroidea. Antibiotiki 25:307-313.
Santos, W. R., R. R. Bernardo, L. M. T. Pecanha, M. Palatink, J. P. Parente, and C. B.
Palatink de Sousa. 1997. Hemolytic activities of plant saponins and adjuvant. Effect of Peria ndra mediterranea saponin the humoral response to the FML antigen of Leishmania donovani. Vaccine 15:1024-1029.
Sathe, B. S., and S. Bose. 1962. Studies on the utilization of industrial and farm
byproducts in growing poultry rations. Ind. J. Vet. Sci. 32:74-84. Sato, Y., S. Fukui, H. Kurusu, I. Kitazawa, R. Kuwamoto, and T. Aoyagi. 1999.
Salmonella Typhimurium infection in domesticated fowl in a children's zoo. Avian Dis. 43:611-615.
170
Sauvaire Y., Y. Baissac, O. Leconte, P. Pettit, and G. Ribes. 1996. Pages 37-46 in Saponins Used in Food and Agriculture. G. R. Waller, and K. Yamasaki, eds. Plenum Press, NY.
Saxena, U. C., and K. Pradhan. 1974. Effect of high protein level on the replacement
value of guar meal in layer ration. Ind. J. Anim. Sci. 44:190-193. Schmidt-Thome, J., and F. Prediger. 1950. Hemolysis with saponins. Physiol. Chem.
286:127-138. Schopke, T. 2000. Non-NMR methods for structure elucidation of saponins. Pages 106-
113 in Saponins in Food, Feedstuffs and Medicinal Plants. Ann. Proc. Phytochem. Soc. W. Oleszek, and A. Marston, eds. Clarendon Press, Oxford, London, UK.
Schroeder, C. M., D. G. White, B. Ge, Y. Zhang, P. F. McDermott, and S. Avers. 2003.
Isolation of antimicrobial-resistant Escherichia coli from retail meats purchased in Greater Washington, DC, USA. Int. J. Food Microbiol. 85:197–202.
Schwartz, L. D. 1988. Necrotic enteritis. Pages 105–106 in Poultry Health Handbook.
3rd ed. The Pennsylvania State Univ., University Park, PA. Seeman, P. 1974. Ultrastructure of membrane lesions in immune lysis, osmotic lysis and
drug-induced lysis. Feed Proc. 33:2116-2124. Seeman, P., D. Cheng, and G. H. Iles. 1973. Structure of membrane holes in osmotic and
saponin hemolysis. J. Cell Biol. 56:519–527. Segal, R., M. Mansour, and D. V. Zaitschek. 1966. Effect of ester groups on hemolytic
action of some saponins and sapogenins. Biochem. Pharmacol. 15:1411-1416. Segal, R., P. Shatkovsky, and I. Milo-Goldzweig. 1974. On the mechanism of saponin
hemolysis-1 hydrolysis of the glycosidic bond. Biochem. Pharmacol. 23:973-981.
Sen, S., H. P. S. Makkar, and K. Becker. 1998a. Alfalfa saponins and their implication in
animal nutrition. J. Agric. Food Chem. 46:131–140. Sen, S., H. P. S. Makkar, S. Muetzel, and K. Becker. 1998b. Effect of Quillaja
saponaria saponins and Yucca schidigera plant extract on growth of Escherichia coli. Lett. Appl. Microbiol. 27:35-38.
Shane, S., and W. Van der Sluis. 2002. Global Disease Update 2002: More problems to
be solved. World’s Poult. J. 18:28-31.

171
Shany, S., Y. Birk, B. Gestetner, and A. Bondi. 1970. Preparation, characterization and some properties of saponins from lucerne tops and roots. J. Sci. Food Agric. 21:131-135.
Shapiro, S. K., and W. B. Sarles. 1949. Microorganisms in the intestinal tract of normal
chickens. J. Bacteriol. 58:531–544. Sharma, A., and S. Sehgal. 1992. Effect of processing and cooking on the antinutritional
factors of faba bean (Vicia faba). Food Chem. 43:383-385. Sharpe, M. E. 1981. The genus Lactobacillus. Pages 1653-1679 in The Prokaryotes. M.
P. Starr, H. Stolp, H. G. Truper, A. Balows, and H. G. Shelegel, eds. Springer Verlag, NW.
Shimoyamada, M., S. Ikedo, R. Ootsubo, and K. Watanabe. 1998. Effects of soybean
saponins on chymotryptic hydrolyses of soybean proteins. J. Agric. Food Chem. 46:4793-4797.
Shimoyamada, M., S. Kudo, K. Okubo, F. Yamauchi, and K. Harada. 1990. Distribution
of saponin constituents in some varieties of soybean plant. Agric. Biol. Chem. 54:77-81.
Shiraiwa, M., K. Harada, and K. Okubo. 1991a. Composition and structure of group B
saponin in soybean seed. Agric. Biol. Chem. 55:911-917. Shiraiwa, M., S. Kudo, M. Shimoyamada, K. Harada, and K. Okubo. 1991b.
Composition and structure of group A saponin in soybean seed. Agric. Biol. Chem. 55:315-322.
Shirley, M.W. 1986. Avian coccidiosis. Pages 13-35 in Research in New Methods For
The Identification of Species and Strains of Eimeria. L. R. McDougald, P. L. Long, and L. P. Joyner, eds. Univ. of GA, Athens, USA.
Sim, J. S., W. D. Kitts, and D. B. Bragg. 1984. Effect of dietary saponin on egg
cholesterol level and laying hen performance. Can. J. Anim. 64:977-984. Sindambiwe, J. B., M. Calomme, S. Geerts, L. Pieters, A. L. Vlietinck, and D. A.
Vanden. 1998. Evaluation of biological activities of triterpenoid saponins from Maesa lanceolata. J. Nat. Prod. 61:585–590.
Slutsker, L., S. F. Altekruse, and D. L. Swerdlow. 1998. Foodborne disease. Emerging
pathogens and trends. Infect. Dis. Clin. N. Amer. 12:199-216.

172
Smith, H. W. 1965. The development of the flora of the alimentary tract in young animals. J. Pathol. Bacteriol. 90:495–513.
Songer, J. G. 1996. Clostridial enteric diseases of domestic animals. Clin. Microbiol.
Rev. 9:216-234. Sood, A. R., A. Bajpai, and M. Dixi. 1985. Pharmacological and biological studies on
saponins. Ind. J. Pharmacol. 17:178-179. Southon, S., I. T. Johnson, J. M. Gee, and K. R. Price. 1988a. The effect of gypsophylla
saponins in the diet on mineral status and plasma cholesterol concentration in the rat. Br. J. Nutr. 59:49–55.
Southon S., A. J. Wright, K. R. Price, S. J. Fairweather-Tait, and G. R. Fenwick. 1988b.
The effect of three types of saponin on iron and zinc absorption from a single meal in the rat. Br. J. Nutr. 59:389-396.
Spinks, E. A., and G. R. Fenwick. 1990. The determination of glycyrrhizin in selected
UK liquorice products. Food Addit. Contam. 7:769-778. Steurer, S., M. Wurglics, W. Likussar, K. Burmistrov, A. Michelitsch, and M. Schubert-
Zsilavecz. 1999. Lack of correlation between surface and interfacial activities of saponins and their hemolytic properties. Pharmazie 54:766–767.
Stolzenberg, S. J., and R. M. Parkhurst. 1976. Blastocidal and contraceptive actions by
an extract and compounds from endod (Phytolacca dodecandra). Contraception 14:39–51.
Story J. A., S. L. Le Page, and M. S. Petro. 1984. Interactions of alfalfa plant and sprout
saponins with cholesterol in vitro and in cholesterol-fed rats. Am. J. Clin. Nutr. 39: 917–929.
Tahri, K., J. Crociani, J. Ballongue, and F. Schneider. 1995. Effects of three strains of
bifidobacteria on cholesterol. Lett. Appl. Microbiol. 21:149-151. Takano, T., K. Arai, I. Murota, K. Haykawa, T. Mizutarie, and T. Mitsuoka. 1985.
Eefects of feeding sour milk on longevity and tumorigenesis in mice and rats. Bifido. Microflora. 4:31-37.
Takechi, M., S. Matsunami, J. Nishizawa, C. Uno, and Y. Tanaka. 1999. Hemolytic and
antifungal activities of saponins or anti-ATPase and antiviral activities of cardiac glycosides. Planta Med. 65:585–586.

173
Takechi, M., and Y. Tanaka. 1995a. Structure-activity relationship of synthetic methyl urosylate glycosides. Phytochem. 34:675-677.
Takechi, M., and Y. Tanaka. 1995b. Hemolytic and time course differences between
steroid and triterpenoid saponins. Planta Med. 61:76–77. Tamura, K., H. Honda, Y. Mimaki, Y. Sashida, and H. Kogo. 1997. Inhibitory effects of
a new steroidal saponin, OSW-1, on ovarian function in rats. Br. J. Pharmacol. 121:1796–1802.
Tanaka, O., T. Ikeda, K. Ohtani, R. Kasai, and K. Yamasaki. 2000. Antiyeast steroidal
saponins from Yucca schidigera (Mohave Yucca), a new anti-food-deteriorating agent. J. Nat. Prod. 63:332-338.
Tanaka, O., Y. Tamura, H. Masuda, and K. Mizutani. 1996. Application of saponins in
foods and cosmetics: Saponins of Mohave yucca and Sapindus mukurossi. Pages 1-11 in Saponins Used Food and Agriculture. G. R. Waller, and K. Yamasaki, eds. Plenum Press, NY.
Tauxe, R. V. 1991. Forward: transmission of human bacterial pathogens through poultry
(Banquet address). Pages 15-22 in Colonisation Control of Human Bacterial Enteropathogens. L. C. Blankenship, ed. Acad. Press. NY.
Tava, A, W. Oleszek, M. Jurzysta, N. Berardo, and M. Odoardi. 1993. Alfalfa saponins
and sapogenins: Isolation and quantification in two different cultivars. Phytochem. Anal. 4:269-274.
Teferedegne, B. 2000. New perspectives on the use of tropical plants to improve
ruminant nutrition. Proc. Nutr. Soc. 59:209–214. Tellez, G., S. E. Higgins, A. M. Donoghue, and B. M. Hargis. 2006. Digestive
physiology and the role of microorganisms. J. Appl. Poult. Res. 15:136-144. Tenover, F. C. 1991. Noval and emerging mechanisms of antimicrobial resistance in
nosocomial pathogens. Am. J. Med. 91:76S-81S. Terapunduwat, S., and I. Tasaki. 1986. Effect of dietary saponin on the performance and
plasma cholesterol level of chicks and the alleviation of saponin toxicity by cholesterol by cholesterol supplementation. Jpn. J. Zootechnical. Sci. 57:524-533.
Tewary, P. V., C. Chaturvedi, and V. B. Pandey. 1973. Antifertility activity of Costus
speciosus Sm. Ind. J. Pharmol. 35:114–115.

174
Thakur, R. S., and K. Pradhan. 1975a. A note on inclusion of guar meal (Gyamopsis tetragonoloba) in broiler rations. Ind. J. Anim. Sci. 45:98-102.
Thakur, R. S., and K. Pradhan. 1975b. A note on inclusion of guar meal (Gyamopsis
tetragonoloba) in broiler rations. Effect on carcass yield and meat composition. Ind. J. Anim. Sci. 45:880-884.
Tietjen, M., and D. Y. C. Fung. 1995. Salmonellae and food safety Crit. Rev. Microbiol.
21:53-83. Truscott, R. B., and F. Al-Sheikhly. 1977. Reproduction and treatment of necrotic
enteritis in broilers. Am. J. Vet. Res. 38:857–861. Tschesche, R., G. Ludke, and G. Wulff. 1969. Steroid saponins with more than 1 sugar
chain. II. Sarsaparilloside, a bisdesmosidic 22-hydroxy-furanostanol saponin. Chem. Ber. 102:1253-1269.
Turtura, G. C., S. Massa, and H. Ghazvinizadeh. 1990. Antibiotic resistance among
coliform bacteria isolated from carcasses of commercially slaughtered chickens. Int. J. Food Microbiol. 11:351-354.
Ueda, H., Y. Kakutou, and M. Ohshima. 1996. Growth-depressing effect of alfalfa
saponin in chicks. Anim. Sci. Technol. 67:772-779. Ueda, H., and M. Ohshima. 1987. Effects of alfalfa saponin on chick performance and
plasma cholesterol level. Jpn. J. Zootech. Sci. 58:583-590. Undersander, D. J., D. H. Putnam, A. R. Kaminski, K. A. Kelling, J. D. Doll, E. S.
Oplinger, and J. L. Gunsolus. 1997. Alternative Field Crops: Guar. Available online at www.hort.purdue.edu/newcrop/articles/guar.htm.
Ungemach, F. R. 2000. Figures on quanities of antibacterials used for different purposes
in the EU countries and interpretation. Acta Vet. Scand. 93:89-98. USDA. 1996. Pages 14-19 in United States Department of Agriculture Animal and Plant
Health Inspection Services. National Poultry Improvement Plan, CFR part14, Auxiliary provisions on National Poultry Improvement Plan. Subpart B-bacteriological examination procedure. § 147-11 laboratory procedure recommended for the bacteriological examination of Salmonella.
USDA Market News Feb., 2008. Available on line at http://www.kxmb.com/t/usda. Vacek, L., and B. Sedlak. 1962. Comparison of physical, chemical and biological
properties of saponins. Gunma J. Med. Sci.11:1-6.

175
Van Atta, G. R., J. Guggolz, and C. R. Thompson. 1961. Determination of saponin in alfalfa. J. Agric. Food Chem. 9:77-79.
Van de Giessen, A.W., A. G. Dufrenne, W. S. Ritmeester, P. A. T. A. Berkers, W. J.
Van Leeuwen, and S. H. W. Notemans. 1991. Salmonella contamination of poultry flocks in the Netherlands. Vet. Q. 13:41-46.
Van der Sluis, W. 2000. Clostridial enteritis is an often underestimated problem.
World’s Poult. J. 16:42-43. Van Etten, C. H., R. W. Mller, I. A. Wolff, and Q. Jones. 1961. Amino acid composition
of twenty seven selected seed meals. J. Agri. Food Chem. 9:79-82. Van Immerseel, F., J. De Buck, F. Pasmans, G. Huyghebaert, F. Haesebrouck, and R.
Ducatelle. 2004. Clostridium perfringens in poultry: An emerging threat for animal and public health. Avian Pathol. 33:537-549.
Van Immerseel, F., J. B. Russell, M. D. Flythe, I. Gantois, L. Timbermont, F. Pasmans,
F. Haesebrouck, and R. Ducatelle. 2006. The use of organic acids to combat Salmonella in poultry: a mechanistic explanation of the efficacy. Avian Pathol. 35:182-188.
Van Nevel, C. J., J. A. Decuypere, N. A. Dierick, and K. Molly. 2005. Incorporation of
galactomannans in the diet of newly weaned piglets: effect on bacteriological and some morphological characteristics of the small intestine. Arch. Anim. Nutr. 59:123-138.
Verma, S. V. S., and J. M. McNab. 1982. Guar meal in diets for broiler chickens. Br.
Poult. Sci. 23:95-105. Verma, S. V. S., and J. M. McNab. 1984a. Chemical, biochemical and microbiological
examination of guar meal. Ind. J. Poult. Sci. 19:165-170. Verma, S. V. S., and J. M. McNab. 1984b. Performance of hens fed guar meal
containing diets with or without supplemental cholesterol. Ind. J. Poult. Sci. 19:245-250.
Vicente, J. L., A. Torres-Rodriguez, S. E. Higgins, C. Pixley, G. Tellez, and B. M.
Hargis. 2005. Effect of a probiotic culture on horizontal transmission of Salmonella enteritidis in turkey poults. Poult. Sci. 84(Suppl.1):101. (Abstr.)
Vicente, J. L., L. Avina, A. Torres-Rodriguez, B. Hargis, and G. Tellez. 2007.
Effect of a Lactobacillus spp. based probiotic culture product on broiler chicks performance under commercial conditions. Int. J. Poult. Sci. 6:154-156.
176
Vogt, R. L., and L. Dippold. 2005. Escherichia coli O157:H7 outbreak associated with consumption of ground beef, June-July 2002. Public Health Reports. 2:174-178.
Vohra, P., and F. H. Kratzer. 1964. Growth inhibitory effect of certain polysaccharides
for chickens. Poult. Sci. 43:1164-1170. Vohra, P., and F. H. Kratzer. 1965. Improvement of guar meal by enzymes. Poult. Sci.
44:1201-1205. Wagner, H., S. Ott, K. Jurcic, J. Morton, and A. Neszmelyi. 1983. Chemistry, 13C-NMR
study and pharmacology of two saponins from Colubrina asiatica. Planta Med. 48:136-141.
Wakabayashi, C., K. Murakami, H. Hasegawa, J. Murata, and I. Saiki. 1998. An
intestinal bacterial metabolite of ginseng protopanaxadiol saponins has the ability to induce apoptosis in tumor cells. Biochem. Biophys. Res. Comm. 246:725–730.
Wallace, R. J. 2004. Antimicrobial properties of plant secondary metabolites. Proc. Nutr.
Soc. 63:621-629. Wallace, R. J., L. Arthaud, and C. J. Newbold. 1994. Influence of Yucca shidigera
extract on ruminal ammonia concentrations and ruminal microorganisms. Appl. Environ. Microbiol. 60:1762-1767.
Waltman, W. D., A. M. Horne, C. Pirkle, and D. C. Johnson. 1992. Prevalence of
Salmonella enteritidis in spent hens. Avian Dis. 36:251-255. Wang, Y., T. A. McAllister, L. J. Yanke, and P. R. Cheeke. 2000a. Effect of steroidal
saponin from Yucca schidigera extract on ruminal microbes. J. Appl. Microbiol. 88:887–896.
Wang, Y. X., T. A. McAllister, L. J.Yanke, Z. J. Xu, P. R. Cheeke, and K. J. Cheng.
2000b. In vitro effects of steroidal saponins from Yucca schidigera extract on rumen microbial protein synthesis and ruminal fermentation. J. Sci. Food Agric. 80:2114–2122.
West, L. G. 1979. Identification of oleanolic acid from saponins presents in lucerne
(alfalfa) roots. J. Sci. Food Agric. 30:540-542. Whistler, R. L., and T. Hymowitz. 1979. Guar: Agronomy, Production. Industrial Use
and Nutrition. Purdue Univ., Press, West Lafyette, IN. Whyte, P., K. Mc Gill, J. D. Collins, and E. Gormley. 2002. The prevalence and PCR
detection of Salmonella contamination in raw poultry. Vet. Microbiol. 89:53-60.

177
Wieneke, A. A., D. Roberts, and R. J. Gilbert. 1993. Staphylococcal food poisoning in the United Kingdom, 1969-1990. Epidemiol. Infect. 110:519-531.
Williams, R. B. 1998. Epidemiological aspects of the use of live anticoccidial vaccine
for chickens. Int. J. Parasotol. 285:1089-1098. Williams, R. B. 1999. A compartmentalized model for the estimation of the cost of
coccidiosis to the world's chicken production industry. Int. J. Parasitol. 29:1209–1229.
Williams, R. 2000. The impact of antimicrobial resistance. Acta Vet. Scand. 93:17-21. Williams, R. B. 2005. Intercurrent coccidosis and necrotic enteritis of chickens: rational,
integrated disease management by maintenance of gut integrity. Avian Pathol. 34:159-180.
Williams, R. B., R. N. Marshall, R. M. La Ragione, and J. Catchpole. 2003. A new
method for the experimental production of necrotic enteritis and its use for studies on the relationships between necrotic enteritis, coccidiosis and anticoccidial vaccination of chickens. Parasitol. Res. 90:19-26.
Willis, A. T. 1977. Clinical and Laboratory Practice. Page 360 in Anaerobic-
Bacteriology. 3rd ed., Butterworths, London. Wink, M. 1999. Introduction biochemistry, role and biotechnology of secondary
products. Pages 1-16 in Biochemistry of Secondary Product Metabolism. M. Wink, ed. CRC Press, Boca Raton, FL.
Witte, W. 2000. Antimicrobial therapy in a historical perspective. Acta Vet. Scand. 93:7-
16. Witte, W., H. Tschape, I. Klare, and G. Werner. 2000. Antibiotics in animal feed. Acta
Vet. Scand. 93:37-45. Woldemichael, G. M., and M. Wink. 2001. Identification and biological activities of
triterpenoid saponins from Chenopodium quinoa. J. Agric. Food Chem. 49:2327–2332.
Wu, Z., M. Sadik, and F. T. Sleiman. 1994. Influence of yucca extract on ruminal
metabolism in cows. J. Anim. Sci. 72:1038–1042. Yadav, A., and S. K. Gupta. 2001. Study of resistance against some ionophores in
Eimeria tenella Weld isolates. Vet. Parasitol. 102:69–75.

178
Yamamoto, Y., I. Sogawa, A. Nishina, S. Saeki, N. Ichikawa, and S. Iibata. 2000. Improved hypolipidemic effects of xanthan gum-galactomannan mixtures in rats. Biosci. Biotechnol. Biochem. 64:2165-2171.
Yamasaki, Y., K. Ito, Y. Enomoto, and J. L. Sutko. 1987. Alterations by saponins of
passive calcium permeability and sodium-calcium exchange activity of canine cardiac sarcolemnal vesicles. Biochim. Biophys. Acta 897:481–487.
Yang, C. R., Y. Zhang, M. R. Jacob, S. I. Khan, Y. J. Zhang, and X. C. Li. 2006.
Antifungal activity of C-27 steroidal saponins. Antimicrob Agents Chemother. 50:1710-1714.
Yata, N., N. Sugihara, R. Yamajo, T. Murakami, Y. Higashi, H. Kimata, K. Nakayama,
T. Kuzuki, and O. Tanaka. 1985. Enhanced rectal absorption of beta-lactam antibiotics in rat by monodesmosides isolated from pericarps of Sapindus mukurossi (Enmei-hi). J. Pharmacobio. Dyn. 8:1041-1047.
Yolken, R. H., C. Ojeh, I. A. Khatri, U. Sajjan, and J. F. Forstner. 1994. Intestinal
mucins inhibit rotavirus replication in an oligosaccharide-dependent manner. J. Infect. Dis. 169:1002-1006.
Yoshikawa, M., T. Murakami, A. Kishi, T. Kageura, and H. Matsuda. 2001. Medicinal
flowers. III. Marigold (1): hypoglycaemic, gastric emptying inhibitory, and gastroprotective principles and new oleanane-type triterpene oligoglycosides, calendasaponins A, B, C, and D, from Egyptian Calendula officinalis. Chem. Pharm. Bull. 49:863–870.
Yoshiki, Y., S. Kuduo, and K. Okubo. 1998. Relationship between chemical structures
and biological activities of triterpenoid saponins from soybean. Biosci. Biotechnol. Biochem. 62:2291–2299.
Yoshikoshi, M., T. Kahara, Y. Yoshiki, M. Ito, Y. Furukawa, K. Okubo, and R.
Amarowicz. 1995. Metabolism and nonabsorption of soybean hypocotyl saponins in the rat model. Acta Alimentaria 24:355–364.
Youn, H. J., and J. W. Noh. 2001. Screening of the anticoccidial effects of herb extracts
against Emieria tenella. Vet. Parasitol. 96:257-263.

179
VITA
Name: Sherif Mohamed Hassan
Address: 118 Wadi Halfa St. Apt. # 6, Arishiat Misr, Ismailia, Egypt
Email Address: [email protected]
Education: B.S., Poultry Sciences, Suez Canal Univ., Egypt, 1990 M.S., Poultry Physiology, Suez Canal Univ., Egypt, 1997 Ph.D., Candidate, Poultry Physiology, Suez Canal Univ., Egypt, 2001 Ph.D., Poultry Nutrition, Texas A&M Univ., TX, USA, 2008
Selected Publications
Hassan S. M., EL-Gayar A. K., Byrd J. A., Caldwell D., Bailey C. A., and Cartwright A. L. (2008). Effects of guar meal against Eimeria tenella infection in broiler chicks. Southern Poultry Science Society Annual Meeting, Atlanta, GA. (Abstr.)
Hassan S. M., Gutierrez O., Haq A. U., Byrd J. A., Bailey C. A., and Cartwright A. L. (2007). Saponin rich extracts from Quillaja, Yucca, Soybean, and Guar differ in antimicrobial and hemolytic activities. Poult. Sci. 86:121 (Abstr.) Hassan, S. M., M. E. Mady, A. L. Cartwright. 2005. Egg storage period and weight effects on hatchability of ostrich (Struthio camelus) eggs. Poult. Sci. 84: 1908-1912. Hassan, S. M., M. E. Mady, A. L. Cartwright, and A. A. Siam. 2004. Incubation temperature for ostrich (Struthio camelus) eggs. Poult. Sci. 82: 1188-1192). Hassan, S. M., M. E. Mady, A. L. Cartwright, H. M. Sabri, and M. S. Mobarak. 2003. Effect of feeding time on the reproductive performance of Japanese quail (Coturnix coturnix japonica). Poult. Sci. 82: 1188-1192. Hassan, S. M., M. E. Mady, A. L. Cartwright, H. M. Sabri, and M. S. Mobarak. 2003. Effect of acetyl salicylic acid in drinking water on reproductive performance of Japanese quail (Coturnix coturnix japonica). Poult. Sci. 82: 1174-1180. Hassan, S. M., M. E. Mady, A. L. Cartwright, H. M. Sabri, and M. S. Mobarak. 2003. Effect of early feed restriction on reproductive performance in Japanese quail (Coturnix coturnix japonica). Poult. Sci. 82: 1163-1169.